
- Home
- Protocols

-

Assessment of changes in real time net glucose uptake in adherent cell models upon acute stimulation
Last updated date: Dec 16, 2021 DOI: 10.21769/p1478 Views: 1065 Forks: 0
*For correspondence: peter.breining@biomed.au.dk
1PROMEMO and DANDRITE, Aarhus University, Aarhus, Denmark; 2Department of Clinical Pharmacology, Aarhus University Hospital, Aarhus, Denmark; 3Department of Biomedicine, Aarhus University, Aarhus, Denmark, 4Experimental Clinical Oncology, Department of Oncology, Aarhus University Hospital, Aarhus, Denmark 5Department of Nuclear Medicine & PET, Aarhus University Hospital, Aarhus, Denmark
[Abstract]
Glucose uptake rate is an essential proxy for overall metabolic rate in cells. The uptake rate may be increased upon receptor activation or by changes in the cellular phenotype, as seen in e.g., cancer.
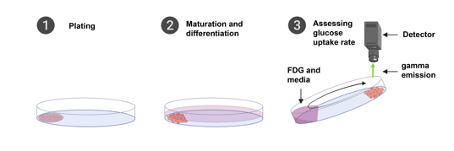
Traditionally, net glucose uptake has been assessed as overall uptake after a specific period of time, e.g., 1 hour, by the use of variations of the glucose analogue deoxyglucose. This static assessment does not give any insight into the kinetics of cellular stimulation by an agonist nor does it provide the opportunity for multiple testing in a single setup. With this protocol we introduce a real time in vitro assay of net glucose uptake in adherent cells using the glucose analogue 18F- fluorodeoxyglucose (FDG) . Cells are cultured only in a distinct area of a petri dish which is then positioned at an angle in a “LigandTracer” instrument and subjected to FDG. The dish rotates once a minute and for every rotation cellular FDG emission is detected providing real time data on net cellular glucose uptake. Tracing can be assessed over multiple hours providing sufficient time to assess various concentrations of a given compound. After tracing, cells can be stained in the dish or harvested for e.g., RNA or protein extraction.
The assay provides valuable information on time-to-effect kinetics and gives insight into net cellular glucose uptake sensitivity in a single setup by successive assessment upon addition of increasing concentrations of a given compound.
[Background]
In vitro cell studies assessing the uptake of radioactive labelled biomolecules (tracers) plays a central role in various research fields. Such studies are essential for improving our basal understanding of cellular metabolism (Yamamoto, Ueda et al. 2011), or drug biodistribution (Vendelbo, Gormsen et al. 2018) and for testing and development of novel tracers used in clinical medical imaging like PET (Busk, Overgaard et al. 2020). A major advantage of using radiolabelled tracers is the ability to perform measurements rapidly under near-stable culturing conditions. In contrast, traditional enzymatic assays determine uptake rates based on changes in metabolite concentrations in medium samples. This, by necessity prevents measurements of fluxes at stable medium and, if proliferating cells are used, cell number conditions. Commonly used tracers for assessing metabolism include 11C/14C labelled acetate, pyruvate or amino acids but the most widely used are glucose analogues like 14C-labelled 2-deoxy-glucose (2-DG) or the PET relevant analogue 18Fluoro-2-deoxy-glucose (FDG) (Leung 2004). The glucose analogues have the advantage that they are taken up by glucose transporters and phosphorylated by hexokinase in a similar manner as genuine glucose (Leung 2004), i.e. 2-DG and FDG are captured in the ‘priming stage’ in the glycolytic pathway. Contrary to glucose, the phosphorylated versions of 2-DG and FDG are not a substrate for further downstream glycolytic metabolism by phosphohexose isomerase and are largely unable to diffuse across membranes (Leung 2004). This makes the tracer ideal since cellular built-up of radioactivity will, at least for short time periods, accurately mimic glucose retention/metabolism patterns. The assumption of irreversible retention of glucose analogues is not universally true. Glucose-6-phosphatase activity, which is highly cell-type-dependent, may lead to de-phosphorylation of trapped phosphorylated tracer and diffusive loss by facilitated diffusion via glucose transporters (Leung 2004, Scussolini, Bauckneht et al. 2019). This can typically be ignored, if the tracer-loading period is kept relatively short and the cells do not express significant levels of Glucose-6-phosphatase.
For some experiments, single time point quantification of tracer retention is sufficient. However, a more detailed assessment of tracer retention over time is often warranted since kinetic data with high time resolution, may be more informative and provide additional knowledge on uptake/binding mechanisms, that are not deducible from single time point measurements. Traditional methods that quantify tracer retention over time relies on the seeding of multiple identical petri dishes, which are then harvested at different time points (Seidensticker, Ulrich et al. 2014). Alternatively, cells may be grown in suspension with repeated sample withdrawal but this requires repeated cycles of washing/centrifugation (Sorger, Patt et al. 2003) and many cells are not suited for such culturing conditions. In addition, such approaches have several limitations, including poor time resolution, evaporation-driven increases in metabolite concentrations as well as minor, possibly undetected, differences in added medium volume or tracer dose and the dish cell number. Correction for such dish-to-dish differences can be included but is highly labour intensive and may indeed add further measurement inaccuracy depending on the accuracy of such correction steps. Therefore, methods that are able to quantify tracer retention in attached cells over time with high time resolution are warranted. The “LigandTracer” allows such real time measurements. In the following we will describe how to use this instrument to assess net glucose uptake in cellular models of adipocytes (Markussen, Isidor et al. 2017) and of primary myotubes (Liu, Cheung et al. 2015). These two models are used in order to illustrate variations in seeding and to illustrate the difference in basal kinetics between the two cell models.
Materials and Reagents
- Petri dish (87-89 mm Ø and maximum 15 mm in height) (Thermo Fisher Scientific, Nunc, 150350)
- Pipette tips
- 10ul (Hounisen, Sarstedt 701130210)
- 200ul (Hounisen, Sarstedt 70720211)
- 1250ul (Hounisen Sarstedt 701186210)
- Pipettes
- 0,5-10ul (VWR, Eppendorf Research plus)
- 10-100ul (VWR, Eppendorf Research plus)
- 100-1000ul (VWR, Eppendorf Research plus)
- Pipetboy (Thermo Fisher Scientific, Thermo Scientific, S1 pipet Fillers S1 9521)
- Serological pipettes
- 1ml (Fisher Scientific, Corning, 4011)
- 5ml (VWR, VWR, 612-3702)
- 10ml (VWR, VWR, 612-3700)
- 25ml (VWR, VWR, 612-3698)
- Falcon tubes
- 15ml (In Vitro, Greiner Bio-One, 188271)
- 50ml (In Vitro, Greiner Bio-One, 227261)
- Pastuer pipettes (Hounisen, Scherf, 1646.0230)
- T75 flasks with filter (VWR, Thermo Scientific, 734-2167)
- T75 flasks without filter (VWR, Thermo Scientific, 734-2065)
- T25 flasks (VWR, Thermo Scientific, 734-2069)
- FACS sorted primary myoblasts from hindlegs of wild type C57B/6 (Liu, Cheung et al. 2015)
- TERT-hWA cells (available by request, (Markussen, Isidor et al. 2017))
- TERT-hBA cells (available by request, (Markussen, Isidor et al. 2017))
- ECM Gel from Engelbreth-Holm-Swarm murine sarcoma (Merck, Sigma-Aldrich, E1270)
- High Glucose DMEM (BioNordika, Lonza, BE12-604/UI)
- Low Glucose DMEM (BioNordika, Lonza, BE12-707F)
- Advanced DMEM/F12 (Thermo Fisher Scientific, # 12634010)
- Penicillin-Streptomycin (P/S) (Thermo Fisher Scientific, Gibco, 15140122)
- Glutamax 100x (Gibco #35050-061)
- Trypsin (BioNordika, Lonza BE17-161E)
- Fetal bovine serum (FBS) (Merck, Sigma Aldrich, F9665)
- Dialyzed PBS (Fisher Scientific, Cytiva SH30028.02)
- Fibroblast growth factor basic (bFGF) (final concentration 2.5 ng/ml) (Thermo Fisher Scientific, # 13256029)
- Amphotericin (final concentration 2.5 μg/ml) (Thermo Fisher Scientific, # 15290026)
- T3 (final concentration 1 nM) (Sigma-Aldrich, # T6397)
- Rosiglitazone (final concentration 1 µM) (Cayman Europe, # 71740) 15290026
- Cortisol (final concentration 1 µM) (Sigma-Aldrich, # H1035)
- Dexamethasone (final concentration 1 µM) (Sigma-Aldrich, # D1756)
- Methylisobutylxanthine (final concentration 0.5 mM) (Sigma-Aldrich, # I5879)
- Triton X-100 (AppliChem, A4975,0500)
- Normal Donkey serum (TriChem, Jackson Immuno Research, 017-000-121)
- PBS (See recipe)
- Cover glass (VWR, VWR, 631-0152)
- DAKO-pen (Dako, Dako, S2002)
- Cell scraper (Buck & Holm, TPP 99002)
- Hoechst (Sigma, Sigma, B2261)
- clear nail polish to seal the coverslip (Matas, despend top coat nr 080)
- Paraformaldehyde (PFA) (Fisher scientific, Acros Organics, 10426730)
- Parafilm (Merck, Bemis, P7793-1EA)
- Primary antibody:
- Desmin (1:200) (Merck, Sigma Aldrich, D1033)
- Perilipin (1:200) (Abcam, Abcam, ab61682)
- DAPI mounting media (Dako, Dako S3023)
- Secondary antibody:
- Donkey anti-Goat IgG, Alexa Fluor 568 (1:400) (Thermo Fisher Scientific, Invitrogen, A11057)
- Donkey-anti-mouse Alexa flour 488 (1:400) (Thermo Fisher Scientific, Invitrogen, A21202)
- 18F- fluorodeoxyglucose (18F-FDG) (in-house production)
Equipment
- Culture hood/Laminar Flow Cabinet (Labogene, Scanlaf, Mars)
- Incubator 1 (Thermo Fisher, Series 8000 DH 3541)
- Incubator 2 (Thermo Fisher, Steri-Cult 3308)
- Inverted microscope (Olympus CK40, CK40-F200)
- Inverted brightfield and fluorescence imaging microscope (Invitrogen, EVOS M5000, Catalog number: AMF5000)
- LigandTracer White, version 1.4, (Ridgeview)
- CRC-25R dose calibrator (Carpintic)
Software
- ImageJ (Rasband, W.S., ImageJ, U. S. National Institutes of Health, Bethesda, Maryland, USA, https://imagej.nih.gov/ij/)
- Software LigandTracer Control 2.3.0 (Ridgeview, https://www.ligandtracer.com/)
- Graphpad Prism 9.2 (GraphPad Software, https://www.graphpad.com/)
- Microsoft Excel for Mac v.16.49 (http://www.microsoft.com/)
Procedure
- Plating cells for assay
- Culture your cells in a T75 flask until 80% confluency.
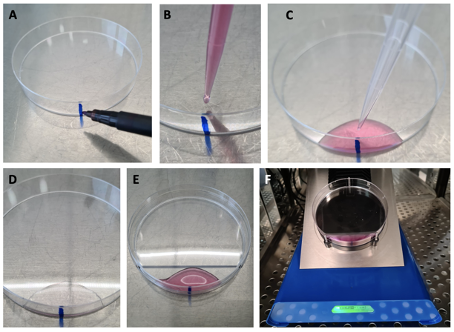
- Add a vertical line using a marker on the outside of a petri dish (Fig. 1,A).
- If muscle satellite cells are used (Liu, Cheung et al. 2015, Kim, Qiu et al. 2020), pre-coat the petri dish with freshly thawed and diluted ECM. Keep the ECM below 10°C until coating. Slowly add 1 ml diluted ECM with a P1000 pipette centered 0.5-1 cm towards the center of the dish. Eject slowly to allow surface tension to restrict the media (Fig. 1,B+C). Leave at room temperature for 1-2h until cells are ready for plating. Before trypsination of cells, discard med media with the M1000 pipette.
- Wash the cells in heated PBS, trypsinate them and resuspend in proliferation media.
- Slowly add 1 ml of the resuspended cells with a P1000 pipette centered 0.5-1 cm towards the center of the dish (Fig. 1,D+E). If the plate is pre-coated with ECM the surface tension of the media ensures that the cells stay in the coated area.
- Put on the lid and carefully move the cells to an incubator.
- Leave the cells for 3-4h and add more media. Most MuSC cells and all TERT-hWA and TERT-hBA have attached within these 3-4h and because MuSC cells only adhere to coated surfaces, cells are limited to the designated area.
B. Cell propagation/proliferation
- Cells are cultured with fresh bFGF until confluency. Change media every other day by tilting the dish so that the cells remain undisturbed. When cells are confluent, continue with the cell specific differentiation protocol:
- MuSC – switch to differentiation media (See recipes). Change media every other day.
- TERT-hWA and TERT-hBA – Omit bFGF for 48h and follow differentiation protocol found in “recipes”.
- If TERT-hWA/hBA cells are used go directly to “D.”.
C. Increase insulin sensitivity of myotubes
- To increase the sensitivity of myotubes switch from High Glucose DMEM (HG-DMEM) to Low Glucose DMEM (LG-DMEM) 48h before assessing insulin sensitivity (usually on day 5 or 6 depending on the degree of differentiation as observed by microscope).
D. Glucose uptake assessment in LigandTracer
- On the night before assessing insulin sensitivity, omit FBS from media to starve cells overnight. Place the LigandTracer and a falcon tube containing serum free media inside the incubator to allow for it temper overnight.
- On the morning of tracing omit media from the first LigandTracer dish and add 3 ml fresh serum free media.
- Allow each plate to sit for 20-30 minutes with fresh media before installing the plate in the LigandTracer apparatus.
- Position the plate in the LigandTracer with the vertical line, and hence cells, at the very bottom covered in media (see photo). Close the lid and turn on the LigandTracer software.
- Start experiment
- Press the nucleotide correction “drop down menu” and choose “18F”. The software will now correct for the half-life of 18F.
- Press pause, draw 10 Mbq FDG, inject the FDG, close the lid and press “continue”. Confirm that all 10 Mbq was injected by using a dose calibrator.
- Net FDG uptake as measured by counts per second (CPS) will now appear on your screen. Uptake over the first 10-15 minutes is unstable as the tracer needs to disperse throughout the media and stick evenly as background. The starting point of the slope differs between setups depending on e.g., the time the cells sit with the FDG after injection and before the first rotation. However, this is of no importance as the net glucose uptake rate is defined by the slope resulting from the increased CPS over time.
- Basal uptake is defined by the slope of the 7-8 measurements after uptake has stabilized . Usually, the first 15 minutes after injection is discarded for uptake to stabilize and the slope of the subsequent 7-8 measures, from 16-25 minutes, is used as net basal uptake rate. However, as timing is started when the “start”-button is hit and not when FDG is injected, timing of subsequent injections is done by subtracting the initial period before FDG injection. In practice, every point after injection is counted to ascertain proper timing of injections (see below).
- After establishing a basal slope several injections can be made, e.g., insulin at rising concentrations (as illustrated below) by pressing “pause” and opening the LigandTracer. Injections can only be made after emission has been detected as the LigandTracer is otherwise locked. The injections should be as fast as possible so to not disturb the kinetics. Continue tracing by pressing “continue”. If you expect an instant response, as is the case for insulin stimulation or beta-adrenergic receptor stimulation, disregard the first four measures after each injection to allow for diffusion and binding. To calculate the new slope, allow for a minimum of 8-10 valid datapoints for each intervention (see Data analyses for examples).
- Stop the tracing by clicking “Pause” and then “End”. Export data by right clicking on the screen and press export. A .txt file is created with the information from the tracing. This can be opened and the data can be copy pasted to e.g. STATA, Microsoft Excel or GraphPad Prism.
- Discard the media as radioactive material and work in a lead shielded environment. Ad ethanol to the removed media to kill any cells that may have dislodged during tracing and let the media sit in a lead coated box until the following day where it can be discarded into the sink.
- Wash the petri dish twice with PBS to remove the remaining FDG (discard with the tracing media).
- Add fresh media if you wish for the cells to continue.
- Lyse the cells with your lysis buffer of choice for protein assessments, or
- Fix the cells for staining by adding 4% PFA, let it sit for 20 minutes and wash twice with PBS (discard the PFA and subsequent washing as hazardous material). Soak the cells with PBS, add the lid, and seal the plate with parafilm until staining.
E. Staining in the petri dish – validation of differentiation
- Day 1
- Wash the dish 2*10 minutes in PBS+0.1% Triton
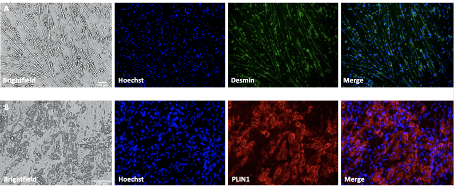
- Turn your petri dish upside down on a flat surface. Place a cover glass on the petri dish and outline the area you wish to stain using a permanent marker (re-use this cover glass for future markings). Turn the petri dish right side up and use a cell scraper to remove cells and coating from the area surrounding your area of interest. Wipe of remaining washing buffer with a kimwipe of similar. Use a hydrophobic pen to draw a barrier around this area matching the permanent marker outline. Allow 15 seconds for hydrophobic barrier to dry. Draw a larger circle across from your area of interest for creating a barrier for H2O to create a humid chamber. If you have doubts whether your barriers holds, test with PBS. Dilute your desired primary antibody in 10% donkey serum (here anti-perilipin1 or anti-desmin 1:200 dilution for TERT-hWA and myotubes resp.) and add this inside the hydrophobic barrier for ON incubation. Add H2O in the larger circle to increase humidity. Place the dish 4°C overnight.
- Day 2
- Wash dish 3*10 minutes in PBS+0.1% Triton
- Dilute your desired secondary antibody in 10% donkey serum (here donkey anti goat and donkey anti mouse 1:400). Ad this inside the hydrophobic barrier, add H2O to larger circle to increase humidity and incubate for 1h.
- Wash 1*10 minutes in PBS+0.1% Triton.
- Wash 2*10 minutes in PBS.
- Incubate 1*10 minutes with Hoechst/DAPI 1:10,000 in H2O for nuclear staining
- Remove the solution and mounting media and cover glass.
- Once dry, add nail polish around the cover glass to seal it properly.
- Image with inverted microscope (Fig. 2,A+B) or carefully with an upright microscope. Using an upright microscope may prove difficult because the walls of the dish only leaves room to image the innermost cells. Using in inverted microscope has the advantage that alle cells may be imaged, but the quality of the image is lower as it is imaged through the plastic dish.
F. Results
- Bring the petri dish to your microscope and image using the channels for your selected fluorescence (here DAPI (357/447 nm), GFP (470/525 nm) or RFP (531/593 nm)).
- Open the images in ImageJ/FIJI. In image metadata (Image>Show info) find “MicronsPerPixel”, set the scale (Analyze>set scale). Save montage. Reduce file size by downscaling the image by 50% and save the new file as high-resolution jpg. Use “Magic Montage Tool” to create a montage. Insert a scalebar.
Data analysis
- Importing DATA to GraphPad Prism
- Open the exported “.txt”-file and copy all data points. Paste these in a new “XY” data table. Exclude “Background” and “Target-Background” as background is relatively unstable for the initial 30 minutes when using FDG which will severely impact your data.
- The data is now plotted and the slope appears.
- Copy “Target” data into a new “XY” data table and create a new “Y” column for each intervention and copy-past the data to these columns. Remember to exclude the first four measurements after each intervention to allow for diffusion and to overcome the extra time the cells were subjected to FDG during the pause. Use“simple linear regression” to calculate the net glucose uptake or glucose uptake rate.
B. Glucose uptake in TERT-hBA and TERT-hWA cell models.
The TERT-hWA and TERT-hBA cell models both have a stable linear non-stimulated net FDG uptake as seen in Fig 3,A. Activating TERT-hBA cells cultured and traced in Advanced DMEM/F12 media (17.5 mM glucose and 1.744 µM insulin) by a stimulatory G-protein coupled receptor agonist (here PTH) after 1h of tracing, increases glucose uptake to a new and stable slope. In this case, the activation increases net uptake 47,7% from a slope of 23.2 CPS/min (R2 = 0.9991) to a slope of 34.27 CPS/min (R2 = 0.9963). When fasted overnight in LG DMEM + dFBS (5.5 mM glucose and no insulin), insulin stimulation increases glucose uptake in the TERT-hWA cell model after 5 measurement points, or roughly 6 minutes, after injection (Fig 3,B). In this case (n=1), stimulation with insulin concentrations of just 1 nM stably increased the net glucose uptake rate by 11% (slope 32.03 (R2 = 0.9956) to 35.66 (R2 = 0.9984) a small increase that could have been missed by traditional assays.

C. Glucose uptake in primary myotubes.
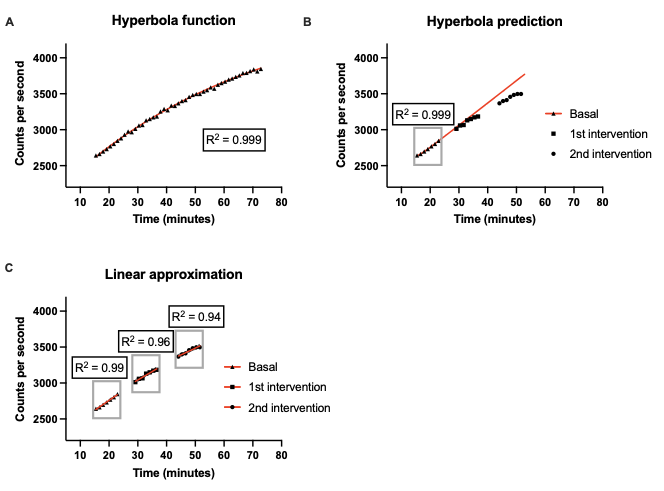
Real time FDG uptake in non-stimulated primary myotubes is more complex as the uptake curve is slightly bent (Fig 4,A). This complicates the interpretation of insulin stimulation compared to the TERT-hWA and TERT-hBA models. FDG uptake/influx in in vitro cell models can be described by a compartment model (Scussolini, Bauckneht et al. 2019). With constant [FDG] in the media long term net uptake kinetics is given by the equation:
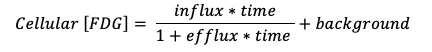
When applied to the entire data acquisition period, the model provides a very plausible fit (Fig 4,A). However, with a setup that requires multiple interventions long term data acquisition is not feasible and predictions based on limited basal measurements do not match obsevations at later time points (Fig 4,A+B). A paired setup where stimulated cells are matched with non-stimulated control cells can be used to overcome this obstacle. If net uptake is assessed within certain predefined temporal windows, a linear approximation may be used to determine the slope within that window as depicted in Fig 4,C and Fig 5. The slope of the linear approximation is a measure of the median uptake rate within that matched temperal window.
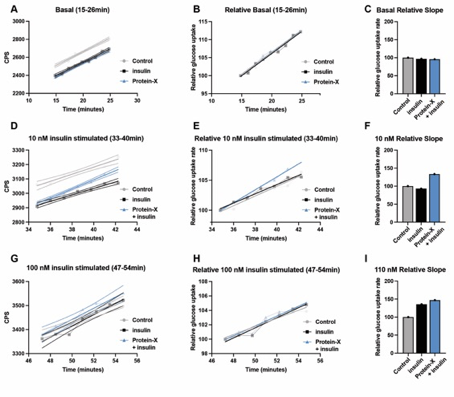
If cells are plated equally and treated identically throughout the differentiation period they can be predicted to behave in the same manner and therefor be matched. However, in order to ascertain that this is indeed the case the uptake rate/slope of the basal period on any given day must not differ between the dishes analyzed (see notes). In a new table paste the datapoints from the basal period from the plates you need to compare. Use the simple linear regression option in GraphPad Prism and “test whether slopes and intercepts are significantly different”. In most cases intercepts will differ, but as mentioned previously (procedure “D”) this is of no importance. In the example below, which contains data from an experimental setup not included in the Kjolby, Breining et al. paper as only 3 comparable dishes were available, basal slopes did not differ (p= 0.78). This can be easily visualized by creating a curve with plotted relative data starting at 100 (Fig 5,A-B) and a bar chart with slopes relative to control set at 100% calculated based on the original slope values (Fig 5,C). Based on the hyperbolar nature of the uptake (Fig 4, A), the slope of the control dish will decrease over timer. Depictions of interventions is therefore performed relative to the decrease in slope of the control dish set at 100% for each given intervention. To assess the kinetics of the myotubes, statistics are performed on the reduction in slope of each individual plate. The relative slopes are then depicted for each intervention, and the reduction in slope is represented in the bar chard relative to the control plate set at 100% (Fig 5,D-F and G-I).
Net uptake rate/slope may differ between days, as it will differ with degree of differentiation, health of cells etc. For this exact reason it is essential to perform several experiments before a conclusion can be drawn. Again, cells plated from the same batch and treated identically must be traced on the same day to be analyzed as matched. In Kjolby, Breining et al., a mean predicted decline was calculated based on the slopes of the control plates on the four individual study days. This mean reduction in slopes is used as the value of expected reduction from which the effects of the various interventions is depicted. Due to uneven variance, a non-parametric approach (Friedman test) was used with Dunn's multiple comparisons test to assess effect of the interventions compared to control. In the example below no statistics can be performed as it is only one matched setup.
Notes
- Basal slope characteristics differ between different cell lines. It is therefore essential to perform initial experiments before initiating interventions. We recommend multiple short term and long-term basal uptake measures (n ³ 3).
- Using LG media will logically increase the slope of FDG uptake. However, although the glucose concentration in LG DMEM is 4.5 times lower, the uptake rate is not 4.5 times higher. It is therefore not always ideal to switch to LG DMEM when tracing as the cells seem to react to the lower glucose availability by altering their metabolic phenotype. Always allow for a minimum of 12h for cells to accustom to LG DMEM.
- We recommend plating at least two spare plates for every experiment where data is to be compared between plates, as is the case for cells with non-linear uptake (e.g., myotubes). During the tracing, assess the basal uptake slope of all dishes. If one is significantly different from the others, use a spare dish and redo the setup. If this is not done, the dish in which the basal slope differs cannot be analyzed as it is not comparable to the others.
Recipes
- ECM for coating
- Dilute 1:100 and store 1 ml aliquots at -20°C.
- Thaw an aliquot at 4°C and dilute 1:10 with 4°C LG DMEM. The solution must stay below 10°C until plated.
- basic fibroblast growth factor (bFGF)
- Dissolve in sterile 1× PBS containing 0.1% (wt/vol) BSA to reach 25 µg/ml. Aliquot 20 µL in PCR tubes and store at -20°C. When frozen the solution can be stored up to 6 months. When thawed store at 4°C and use within 1 week. Avoid freeze and thaw cycles.
- Use 1:10,000 (2.5 ng/mL)
- PBS
- 1000 mL H20
- 13.80 g NaH2PO4
- 87.7 g NaCl
- 0.88 g CaCl2
- Paraformaldehyde (PFA)
- 37% PFA is diluted in PBS to reach 4%
- Blocking solution
- 10% Normal donkey serum in PBS
- Wash buffer
- 0,1% Triton in PBS
- Muscle satellite cell (MuSC) proliferation media (ready-for-use, 500 mL)
- 395 mL High glucose DMEM
- 100 mL FBS (20%)
- 5 mL P/S (1:100)
- bFGF (f2.5 ng/ml)
- Muscle satellite cell (MuSC) differentiation media (ready-for-use, 500 mL)
- 485 mL High glucose DMEM
- 10 mL FBS (2%)
- 5 mL P/S (1:100)
- Myotube insulin sensitizing media (ready-for-use, 500 mL)
- 485 mL Low glucose DMEM
- 10 mL FBS (2%)
- 5 mL P/S (1:100)
- Myotube overnight fasting media (ready-for-use, 500 mL)
- 495 mL High glucose DMEM
- 5 mL P/S (1:100)
- Propagation medium for TERT-hWA and TERT-hBA cells (ready-for-use, 500 mL)
- 438 ml advanced DMEM/F12 medium
- 50 mL FBS (10%)
- 5 mL L-Glutamax (x100)
- 5 mL P/S (1:100)
- 2 mL amphotericin
- Differentiation medium for TERT-hWA and TERT-hBA cells (ready-for-use, 500 mL)
- 478 ml advanced DMEM/F12 medium
- 10 mL FBS (2%)
- 5 mL L-Glutamax (x100)
- 5 mL P/S (1:100)
- 2 mL amphotericin
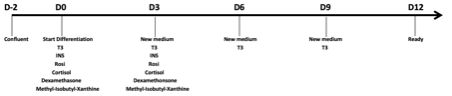
- Add supplements according to schema below
Medium supplements:
Acknowledgments
This protocol was adapted from our previous work submitted for publication in December 2021.
The study has been supported by the Danish Diabetes Academy, Novo Nordisk Foundation, Aarhus Universitity Research Foundation: Grant AUFF-E-2017-7-17.
Steno Diabetes Center Aarhus for providing the LigandTracer
Graphic abstract was created with BioRender.com.
Competing interests
The authors declare no competing interests.
Ethics
Two mice were sacrificed to harvest primary MuSCs. Euthanization was performed by cervical dislocation in accordance with guidelinces approved by the Danish Animal Experiments Inspectorate under the Ministry of Justice
Reference List
Busk, M., J. Overgaard and M. R. Horsman (2020). "Imaging of Tumor Hypoxia for Radiotherapy: Current Status and Future Directions." Semin Nucl Med 50(6): 562-583.
Kim, K. H., J. Qiu and S. Kuang (2020). "Isolation, Culture, and Differentiation of Primary Myoblasts Derived from Muscle Satellite Cells." Bio Protoc 10(14): e3686.
Leung, K. (2004). [(18)F]Fluoro-2-deoxy-2-D-glucose. Molecular Imaging and Contrast Agent Database (MICAD). Bethesda (MD), National Center for Biotechnology Information (US).
Liu, L., T. H. Cheung, G. W. Charville and T. A. Rando (2015). "Isolation of skeletal muscle stem cells by fluorescence-activated cell sorting." Nat Protoc 10(10): 1612-1624.
Markussen, L. K., M. S. Isidor, P. Breining, E. S. Andersen, N. E. Rasmussen, L. I. Petersen, S. B. Pedersen, B. Richelsen and J. B. Hansen (2017). "Characterization of immortalized human brown and white pre-adipocyte cell models from a single donor." PLoS One 12(9): e0185624.
Scussolini, M., M. Bauckneht, V. Cossu, S. Bruno, A. M. Orengo, P. Piccioli, S. Capitanio, N. Yosifov, S. Ravera and S. Morbelli (2019). "G6Pase location in the endoplasmic reticulum: Implications on compartmental analysis of FDG uptake in cancer cells." Scientific reports 9(1): 1-14.
Seidensticker, M., G. Ulrich, F. L. Muehlberg, A. Pethe, O. S. Grosser, I. G. Steffen, M. Stiebler, J. Goldschmidt, K. H. Smalla, R. Seidensticker, J. Ricke, H. Amthauer and K. Mohnike (2014). "Tumor cell uptake of 99mTc-labeled 1-thio-β-D-glucose and 5-thio-D-glucose in comparison with 2-deoxy-2-[18F]fluoro-D-glucose in vitro: kinetics, dependencies, blockage and cell compartment of accumulation." Mol Imaging Biol 16(2): 189-198.
Sorger, D., M. Patt, P. Kumar, L. I. Wiebe, H. Barthel, A. Seese, C. Dannenberg, A. Tannapfel, R. Kluge and O. Sabri (2003). "[18F]Fluoroazomycinarabinofuranoside (18FAZA) and [18F]Fluoromisonidazole (18FMISO): a comparative study of their selective uptake in hypoxic cells and PET imaging in experimental rat tumors." Nucl Med Biol 30(3): 317-326.
Vendelbo, M. H., L. C. Gormsen and N. Jessen (2018). "Imaging in Pharmacogenetics." Advances in Pharmacology 83: 95-107.
Yamamoto, N., M. Ueda, T. Sato, K. Kawasaki, K. Sawada, K. Kawabata and H. Ashida (2011). "Measurement of glucose uptake in cultured cells." Curr Protoc Pharmacol Chapter 12: Unit 12.14.11-22.
- Breining, P, Kjolby, M, Jensen, A G, Nykjaer, A, Busk, M and Vendelbo, M H(2021). Assessment of changes in real time net glucose uptake in adherent cell models upon acute stimulation. Bio-protocol Preprint. 10.21769/p1478.
Category
Do you have any questions about this protocol?
Post your question to gather feedback from the community. We will also invite the authors of this article to respond.