


- Protocols

- Articles and Issues
- For Authors
- About
- Become a Reviewer


Step-by-Step Protocol for Fluorescence-Based Analysis of Uptake in Transporter-Expressing Xenopus laevis Oocytes

Published: Vol 16, Iss 19, Oct 5, 2026 DOI: 10.21769/BioProtoc.5834 Views: 18
Reviewed by: Prashanth N SuravajhalaSusmita SharmaAnonymous reviewer(s)
 PDF
PDF  Ask a question
Original research article
The authors used this protocol in:

Jan 2023

Protocol Collections
Comprehensive collections of detailed, peer-reviewed protocols focusing on specific topics




Abstract
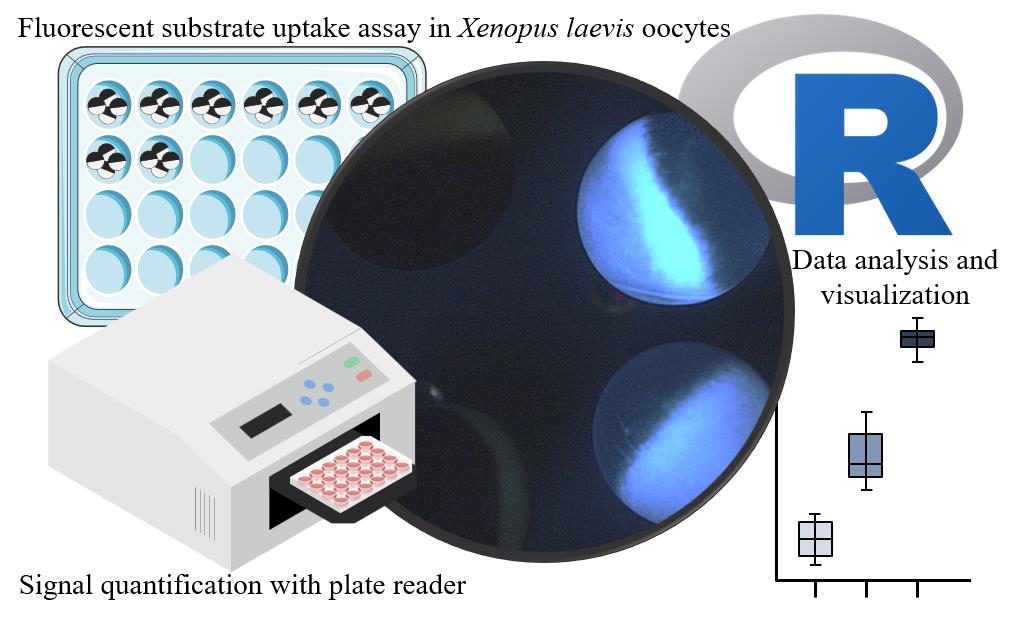
Xenopus laevis oocytes are widely used as a heterologous expression system for investigating the function of membrane proteins due to robust expression of heterologous protein and a low endogenous transport background. Traditionally, transporter activity in oocytes has been assessed using electrophysiology or radiolabeled uptake assays, approaches that are constrained by the requirement for electrogenicity of the transport process, availability of radiolabeled compounds, and instrumentation. Here, we describe a fluorescence-based uptake assay that enables direct and rapid quantification of transporter activity using a fluorescence plate reader. The protocol uses the Arabidopsis thaliana sucrose transporter 1 (SUC1) and its fluorescent substrate esculin as a case for how to set up the assay. The workflow includes optimizing assay conditions, sample preparation, fluorescent measurements, and downstream data analysis using R. This method can readily be adapted to other transporter-substrate pairs, and it supports applications such as transporter inhibitor screening, mutational analysis, characterization of kinetic properties, or indirect substrate specificity testing through competition assays. Overall, this protocol provides a simple and scalable alternative to traditional techniques, eliminating the need for radiolabeled compounds or electrophysiology while enabling easy quantitative assessment of transporter activity.
Key features
• Provides a simple, plate reader–based fluorescence uptake assay for quantifying transporter activity in Xenopus laevis oocytes.
• Adaptable to any transporter with a compatible fluorescent substrate, supporting rapid testing of substrate specificity indirectly through competition assays or mutant screening.
• Includes a complete workflow from assay setup and conduction to data analysis, suitable for both initial characterization and routine functional testing of membrane transporters.
Keywords: Xenopus laevis oocytes Heterologous expression
Fluorescence uptake assay
Plate reader
SUC1
Esculin
Transporter characterization
Heterologous expression
Fluorescence uptake assay
Plate reader
SUC1
Esculin
Transporter characterization
Graphical overview
Background
Xenopus laevis oocytes are a widely used heterologous expression system for the study of membrane proteins. Their large size, ease of manipulation, low endogenous transporter and channel background, and exceptional capacity for robust heterologous protein expression make them particularly well suited for functional characterization of membrane proteins [1–5]. Transporter and channel activity can be measured by two-electrode voltage clamp electrophysiology [6,7], scintillation counting of radiolabeled substrates [8], LC-MS/GC-MS detection [9–11], or fluorescent readouts [12–16].
When a fluorescent substrate for a target transporter is available, a fluorescent plate reader offers a rapid, safe, and experimentally accessible way to detect transporter activity in oocytes. Although their use depends on the availability of a suitable fluorescent substrate, recent advances in the generation of fluorescent analogs, including click chemistry–based labeling strategies [17–20], may help overcome this limitation and broaden the use of fluorescence-based transport measurements.
Fluorescence-based assays can detect transport either indirectly via fluorophore quenching of injected dyes upon binding to substrates imported by the target transporter [15,16] or directly by monitoring uptake of fluorescent substrates [12–14], both of which allow rapid quantification of transport activity. Fluorescence-based assays can be applied to uptake measurements, and can also be extended to inhibition, competition, or export assays.
In this protocol, we describe the fluorescence-based uptake assay using sucrose transporter 1 (SUC1), a high-affinity H+-sucrose symporter from Arabidopsis thaliana [21,22]. SUC1 has been functionally expressed in Xenopus laevis oocytes, where it mediates proton-coupled uptake of sucrose [22–24]. In yeast, SUC1 has additionally been shown to transport the fluorescent coumarin β-glucoside esculin [25], demonstrating that esculin is a suitable surrogate substrate for monitoring SUC1-dependent transport activity.
We previously applied a fluorescence-based analysis of uptake assay to plant glucosinolate transporters (GTR1/GTR2/GTR3) using artificial fluorescent glucosinolates [12]. This protocol establishes an accessible and generalizable workflow for SUC1 and esculin as a transporter–substrate pair, describing a complete workflow encompassing plate reader setup, initial assay optimization, oocyte assays, fluorescence measurement, and data analysis using R.
Materials and reagents
Biological materials
1. Xenopus laevis oocytes stage V–VI. Ovary lobes were kindly provided by Prof. Stephan Pless at the Department of Drug Design and Pharmacology, University of Copenhagen. Ovarian lobes were obtained shortly after surgical removal and transported to the laboratory in storage buffer supplemented with antibiotics. Transport of ovarian lobes to our lab was performed at ambient temperature and typically required 15–20 min, and collagenase treatment was commenced shortly after arrival. Defolliculated oocytes can be obtained commercially from Ecocyte Bioscience, Xenoocyte, or the European Xenopus Resource Centre (EXRC). Defolliculation and microinjection of stage V–VI oocytes followed the general procedures described in previous protocols [26–31].
Reagents
1. Esculin (Merck, Millipore, CAS: 66778-17-4, microbiology grade)
2. Sodium chloride (NaCl) (CAS: 7647-14-5, molecular biology grade)
3. Calcium chloride (CaCl2) (CAS: 10035-04-8, molecular biology grade)
4. Magnesium chloride (MgCl2) (CAS: 7791-18-6, molecular biology grade)
5. Potassium chloride (KCl) (CAS: 7447-40-7, molecular biology grade)
6. HEPES (CAS: 7365-45-9, molecular biology grade)
7. MES (CAS: 1266615-59-1, molecular biology grade)
8. DMSO (CAS: 67-68-5, ≥99.7%, Hybri-MaxTM grade); prepare 10% (v/v) DMSO and store at room temperature in a sealed container
9. Methanol (CAS: 67-56-1, ≥99.9%, HPLC grade); prepare 20% (v/v) methanol and store at room temperature in a sealed container
10. Ethanol (CAS: 64-17-5, 96% vol, molecular biology grade); prepare 70% (v/v) ethanol by dilution of 96% ethanol without correction; store at room temperature in a sealed container
11. MilliQ water
12. Amikacin disulfate salt (Thermo Scientific Chemicals, CAS no. 39831-55-5, catalog number: 455190050)
13. mMessage mMachine T7 Transcription kit (InVitrogen, Thermo Fisher Scientific, catalog number: AM1344)
14. Oocyte expression vector (e.g., pNB1 [32]) with gene of interest (SUC1 is used in the Validation of protocol section)
Solutions
1. Kulori buffer, pH 7.4 (see Recipes)
2. Kulori buffer, ph 4–6.5 (see Recipes)
3. 50 mM esculin in DMSO (see Recipes)
Recipes
1. Kulori buffer, pH 7.4
| Reagent | Final concentration | Quantity or volume |
| 5 M NaCl | 90 mM | 9 mL |
| 1 M CaCl2 | 1 mM | 500 μL |
| 1 M MgCl2 | 1 mM | 500 μL |
| 1 M KCl | 1 mM | 500 μL |
| HEPES (238.3 g/mol) | 5 mM | 0.596 g |
| Adjust to pH 7.4 with NaOH | ||
| MilliQ water | n/a | To 500 mL |
| Total | n/a | 500 mL |
2. Kulori buffer, pH 4–6.5
| Reagent | Final concentration | Quantity or volume |
| 5 M NaCl | 90 mM | 9 mL |
| 1 M CaCl2 | 1 mM | 500 μL |
| 1 M MgCl2 | 1 mM | 500 μL |
| 1 M KCl | 1 mM | 500 μL |
| MES (195.24 g/mol) | 5 mM | 0.488 g |
| Adjust pH with NaOH/HCl | ||
| MilliQ water | n/a | To 500 mL |
| Total | n/a | 500 mL |
Storage: Kulori solutions can be prepared in advance and stored at 4 °C. Under these conditions, the buffer is typically stable for several weeks, provided that no precipitation, turbidity, or microbial growth is observed. To minimize degradation of antibiotics, it is recommended to add antibiotics only to the volume required for immediate use rather than to the entire stock solution. Alternatively, a 10× Kulori stock can be prepared by increasing the concentration of all components tenfold and storing in 50-mL aliquots at -20 °C for several months. Prior to use, the stock should be diluted 1:10 with MilliQ water, and the pH verified and adjusted if necessary.
3. 50 mM esculin in DMSO
| Reagent | Final concentration | Quantity or volume |
| Esculin (367.31 g/mol) | 50 mM | 18.37 mg |
| DMSO | 100% | 1 mL |
| Total | n/a | 1 mL |
Esculin stock can be prepared in advance and stored at -20 °C. In our laboratory, esculin stocks stored under these conditions have been used successfully after at least 6 months of storage. To minimize repeated freeze/thaw cycles, we suggest preparing stock aliquots.
Laboratory supplies
1. Oocyte pipette (Pasteur pipettes with tips cut and smoothed) or plastic pipettes (e.g., BRANDTM, catalog number: 15202699 with FisherbrandTM Dropper Bulb, catalog number: 03-448-26; alternative: disposable plastic pipettes, e.g., Pastette, catalog number: LW4111)
2. Petri dishes, non-treated, 55 mm in diameter (any standard laboratory grade)
3. Petri dishes, non-treated, 90 mm in diameter (any standard laboratory grade)
4. 48-well plate (Sarstedt, catalog number: 83.3923 is used in this protocol, but any standard laboratory grade should work)
5. 1.5 mL microcentrifuge tubes (any standard laboratory grade)
6. P1000 pipette tips (any standard laboratory grade)
7. P200 pipette tips (any standard laboratory grade)
8. P10 pipette tips (any standard laboratory grade)
9. Ice
10. Black 96-well plate (Thermo ScientificTM, catalog number: 237108)
Equipment
1. Plate reader (BioTek, model: Synergy H1 Microplate reader)
2. Nanoject II (Drummond Scientific Company, Broomall, PA, USA)
3. Centrifuge for microcentrifuge tubes (HERMLE Labortechnic GmbH, Germany, model: Z216MK, and Thermo Scientific HERAEUS, Fresco 21, catalog number: 10651805; however, any centrifuge with a speed of >19,000× g can be used)
Procedure
To establish a fluorescence-based transport assay in Xenopus oocytes, several parameters must be evaluated to ensure reliable detection of the fluorescent compound in oocytes. These optimizations include spectral properties of the compound, sample preparation procedures, and factors that may influence fluorescent substrate recovery during sample processing. Together, these experiments define the optimal workflow for preparing oocyte homogenates for fluorescence-based quantification. The recommended optimization procedure is exemplified here (sections A–C) using esculin.
A. General sample preparation for plate reader measurements
The following steps describe the general procedure for preparing oocyte homogenates for fluorescence measurement using a fluorescent plate reader. All steps are carried out at room temperature.
1. Transfer the required number of oocytes (1, 2, 3, or 4, depending on the experiment; see individual protocols below) into a 1.5-mL microcentrifuge tube and remove excess liquid using a P200 pipette.
2. Add 110 μL of extraction solvent and homogenize the oocyte(s) by pipetting up and down until no oocyte debris is visible.
Note: Extraction solvent(s) are MilliQ water, 10% DMSO, 20% methanol, 70% ethanol, or other solvent(s) relevant to substrate or assay conditions. Section C displays the difference in signal for esculin between the different solvents tested.
3. Centrifuge the homogenate at >19,000× g for 10 min at 20 °C.
4. Transfer 100 μL of supernatant into the wells of a black 96-well plate for fluorescence measurement.
B. Setup of plate reader: spectrum scan
Before setting up the oocyte assays, it is necessary to determine the optimal excitation and emission wavelengths for the fluorescent substrate. According to the AAT Bioquest [33], esculin has an excitation maximum at 336 nm and an emission maximum at 409 nm, whereas a previous study has reported measurements at 367/454 nm [25]. To identify the most suitable wavelengths for this substrate, we performed excitation and emission spectra scans around the reported values. If no spectral information is available for a given compound, a broader initial scan can be used to determine optimal excitation and emission. To assess potential solvent effects and oocyte matrix interference, scans were performed in multiple solvents and in the presence or absence of an oocyte.
1. Prepare substrate solution in the following standard solvents (here, 1 μM esculin; adjust substrate concentration if needed):
a. MilliQ water
b. 10% DMSO
c. 20% methanol
d. 70% ethanol
e. (Optional) Additional solvent(s) relevant to substrate or assay conditions
2. Follow the steps in section A, using the substrate solutions as the extraction solvent for one oocyte per tube.
3. In addition, transfer 100 μL of each pure substrate solution (no oocyte) into separate wells in the plate.
4. Perform excitation and emission scans.
a. Excitation scan: From 300 to 425 nm in increments of 10 nm, with emission fixed at 454 nm.
b. Emission scan: From 400 to 500 nm in increments of 10 nm, with excitation fixed at the wavelength determined by the excitation scan.
Note: Across all solvents tested (MilliQ, 10% DMSO, 20% methanol, 70% ethanol), the excitation and emission maxima of esculin were comparable (Figure 1). The presence of an oocyte reduced overall fluorescence intensity but did not shift the spectral maxima (Supplementary Figure S1). A narrower scan (±10 nm around the initial maxima, 2 nm increments) was performed to precisely identify the maxima. Maxima varied by only ±2 nm around the initial maxima, depending on solvent composition, confirming minimal influence on the fluorescence properties (Supplementary Figure S2). Based on these results, 340 nm excitation and 452 nm emission were selected for all subsequent plate reader measurements.
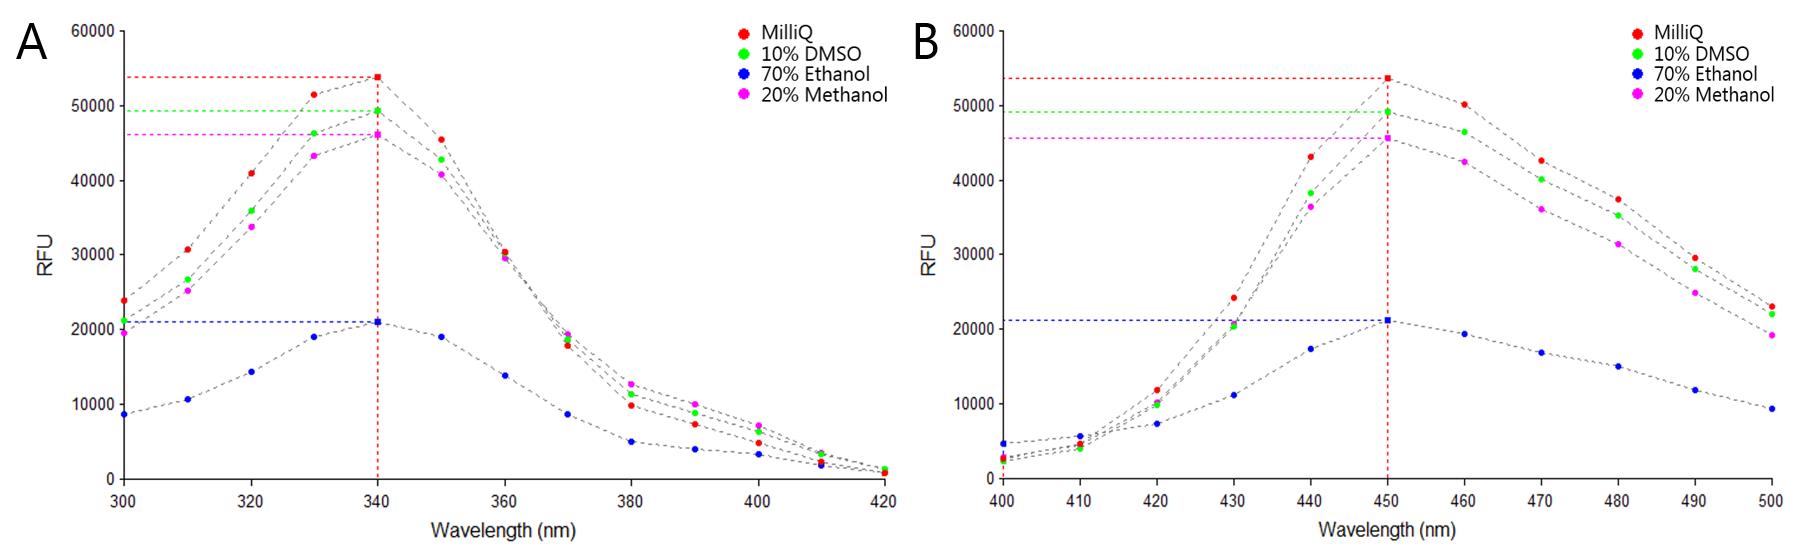
Figure 1. Excitation and emission spectra of esculin in different solvents. (A) Excitation scan at 300–425 nm, with increments of 10 nm and fixed emission at 454 nm. (B) Emission scan at 400–500 nm, with increments of 10 nm and excitation fixed at 340 nm. 1 μM esculin in MilliQ (red), 10% DMSO (green), 70% ethanol (blue), and 20% methanol (pink). RFU = relative fluorescence unit; single point measurement; optics position: top; gain: 100 (default); read height: 7.00 mm (default). Gen5TM Data Analysis Software, version 3.04.
C. Optimization of sample preparation for fluorescent uptake assays
This section describes the optimization of sample preparation procedures for fluorescence-based uptake measurements in Xenopus oocytes. The effects of oocyte number, extraction solvent, and other sample processing parameters on fluorescence recovery were evaluated.
C1. Oocyte number
1. Prepare substrate solutions of different concentrations in the following solvents (here, 1, 2.5, and 5 μM esculin):
a. MilliQ water
b. 10% DMSO
c. 20% methanol
d. 70% ethanol
e. (Optional) Additional solvent(s) relevant to substrate or assay conditions
2. Follow the steps in section A, using the substrate solutions as the extraction solvent for 1, 2, 3, and 4 oocytes per tube (≥2 replicates per condition), keeping the extraction volume constant across all samples.
3. In addition, for each concentration–solvent combination, transfer 100 μL of each pure esculin solution (no oocyte) into two separate wells in the black plate, as the 0-oocyte control.
4. Measure fluorescence on the plate reader using 340 nm excitation and 452 nm emission.
Note: Fluorescence signal is independent of oocyte number (1–4): Signal intensity increased with higher esculin concentrations across all tested solvents (Figure 2A). In three of the four solvents (MilliQ, DMSO, and methanol), the addition of oocytes resulted in a reduction in measured fluorescence compared to no-oocyte controls, after which the signal remained relatively stable regardless of whether 1–4 oocytes were combined. Ethanol was an exception, showing relatively stable fluorescence for assays with 1 or 2.5 μM esculin regardless of the presence or absence of oocyte matrix. Samples prepared with ethanol displayed an overall lower signal intensity than the other three solvents and, at 5 μM esculin, highly varying signal intensities.
In one batch, samples containing oocytes extracted in solvent without esculin were included to assess background fluorescence originating from the oocyte matrix alone. As shown in Figure 2A, the background signal from the oocyte matrix was minimal. Overall, no substantial increase in background or masking of signal was observed when combining up to four oocytes. To reduce workload and simplify the assay, all subsequent experiments were performed using one oocyte per sample.
C2. Choice of extraction solvent
1. Prepare substrate solutions (here, esculin) at 0, 0.5, 1, 2.5, 5, 10, and 20 mM in MilliQ water.
2. Inject 23 nL of each solution into oocytes using Nanoject II (≥16 oocytes per concentration).
Note: The volume 23 nL is routinely used in our lab, but the injected volume of esculin can easily differ from this. Other injection volumes may be used; however, substrate concentrations may need to be adjusted accordingly.
3. Add one injected oocyte into an individual microcentrifuge tube.
4. Follow the steps in section A, using the following extraction solvent (four replicates per solvent):
a. MilliQ water
b. 10% DMSO
c. 20% methanol
d. 70% ethanol
e. (Optional) Additional solvent(s) relevant to substrate or assay conditions
5. Measure fluorescence on the plate reader using 340 nm excitation and 452 nm emission.
Note: Detection of fluorescence from extracted oocytes from all injected concentrations: To assess the best extraction solvent, fluorescence was measured from oocytes injected with increasing concentrations of esculin and extracted in the different solvents (Figure 2B). A clear concentration-dependent increase in signal was observed across all solvents, demonstrating that esculin can be extracted and detected from individual oocytes with all tested solvents. Ethanol consistently yielded lower signal intensities compared to the other solvents, whereas MilliQ, DMSO, and methanol performed similarly. Detectable fluorescence signals were obtained even at low injected concentrations (0.5 and 1 mM, corresponding to approximately 0.1 and 0.2 μM in the final extract if one oocyte is regarded as 1 μL), indicating that esculin can be detected from individual oocytes across a broad concentration range.
C3. (Optional) Freeze vs. non-freeze oocyte homogenates
Freezing oocyte homogenates is a common practice when analyzing uptake using LCMS [11], either because samples cannot be analyzed immediately or because freezing (≥1 h) can improve clarification of the supernatant of the homogenate. For fluorescence-based uptake assays, immediate analysis is often preferred to enable rapid quantification of transport activity. However, situations such as prolonged assay times, limited plate reader availability, or large-scale experiments may necessitate sample storage prior to analysis. This test evaluates whether freezing oocyte homogenates before centrifugation affects subsequent fluorescence measurements. All prior experiments were analyzed without freezing the oocyte homogenate.
1. Prepare a substrate solution in MilliQ water for injection (here, 10 mM esculin, based on section C2).
2. Inject 23 nL of the solution into oocytes using Nanoject II (≥32 oocytes in total).
3. Add one injected oocyte into an individual microcentrifuge tube.
4. Follow the steps in section A, up to the homogenization step, using the following extraction solvents (four replicates per solvent):
a. MilliQ water
b. 10% DMSO
c. 20% methanol
d. 70% ethanol
e. (Optional) Additional solvent(s) relevant to substrate or assay conditions
5. After homogenization, split the samples into two conditions:
a. Non-freeze: Centrifuge immediately and transfer the supernatant to new tubes. Keep it at 4 °C until transfer to the plate, together with the frozen samples, after 1 h.
b. Freeze: Freeze the homogenate at -20 °C for 1 h, then centrifuge before following the steps in section A.
6. Measure fluorescence on the plate reader using 340 nm excitation and 452 nm emission.
Notes:
1. Freezing does not affect esculin fluorescence measurements: To assess the impact of freezing the oocyte homogenate, oocytes were injected with 10 mM esculin and processed with or without a 1-h freezing step. Non-injected oocyte controls (Figure 2C, open symbols) showed minimal background signal and no difference between the conditions. Overall, no major difference in signal intensity was observed between the esculin-injected frozen and non-frozen samples across the tested solvents (Figure 2C, closed symbols). A slight increase in variability was observed for the DMSO samples, with a tendency toward a lower signal intensity for the frozen samples. In contrast, ethanol samples showed a slightly higher signal intensity after freezing, although overall signal intensity remained lower than that of the other tested solvents. No notable differences were observed for the MilliQ and methanol samples. Together, these results indicate that freezing does not majorly affect fluorescence measurement. Thus, samples can be stored frozen and analyzed later or measured immediately.
2. Based on the results from sections C1–C3, out of the tested solvents, MilliQ and 20% methanol showed the most consistent performance. Methanol was selected for subsequent experiments, although MilliQ would have been an equally suitable alternative.
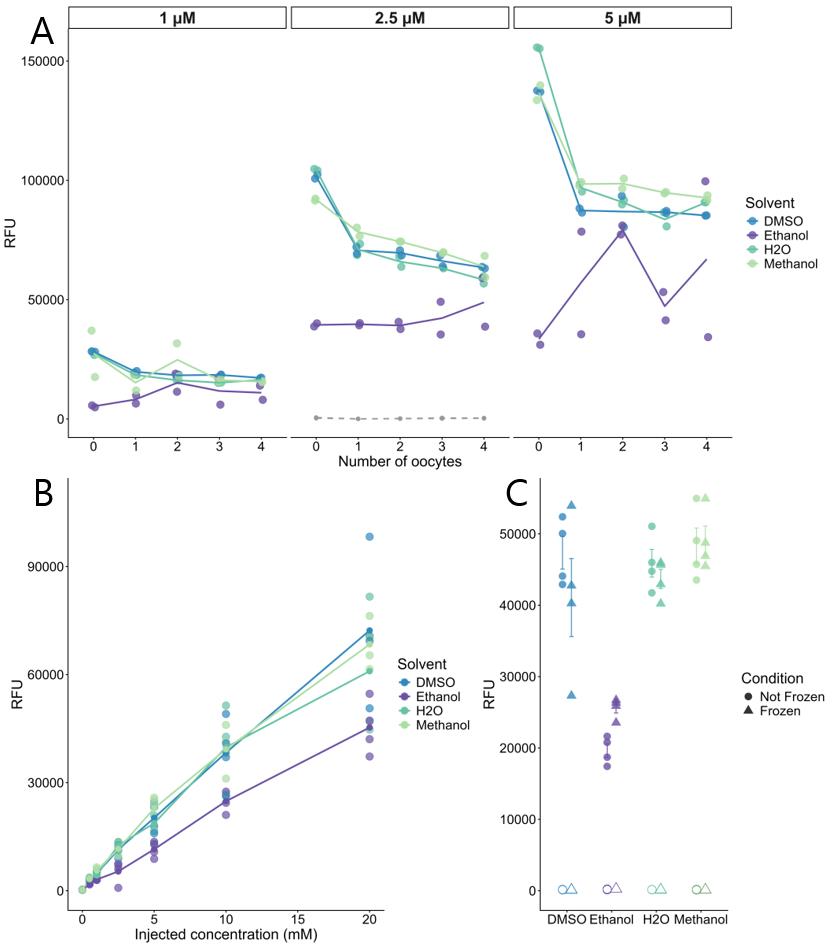
Figure 2. Optimization of assay and extraction conditions. (A) Homogenization of 1–4 oocytes in different concentrations of esculin. Oocytes were homogenized in 1, 2.5, or 5 μM esculin, 1–4 oocytes or a pure esculin sample (0 oocyte amount), using four solvents (MilliQ, 10% DMSO, 20% methanol, 70% ethanol). Data obtained from two oocyte batches are shown (batch 1: 1 μM and 5 μM, batch 2: 2.5 μM). Grey dashed line indicates a no-compound baseline in the different solvents assayed using oocyte batch 2. n = 2 oocytes per oocyte number, solvent, and concentration. Points represent individual measurements, and lines connect the mean relative fluorescence unit (RFU) values at each number of oocytes. (B) Extraction of esculin from injected oocytes. Oocytes were injected with 23 nL of esculin at 0.5–20 mM and extracted using MilliQ, 10% DMSO, 20% methanol, or 70% ethanol. n = 4 oocytes per solvent per concentration. Points represent individual measurements, and lines connect the mean RFU values at each injected concentration. (C) Comparison between frozen and non-frozen oocyte homogenates. Oocytes were injected with 23 nL of 10 mM esculin and extracted using MilliQ, 10% DMSO, 20% methanol, or 70% ethanol. n = 4 oocytes per solvent per concentration. Filled marks indicate oocytes injected with esculin; open marks indicate blank oocyte controls not injected with esculin. Error bars represent ± SE. Fluorescence was measured at 340/452 nm; single-point measurement; optics position: top; gain: 100 (default); read height: 7.00 mm (default).
D. Assay conditions
D1. General assay workflow
The following steps describe the general procedure for an uptake assay using Xenopus laevis oocytes. In our laboratory, oocytes are injected with 50.6 nL of cRNA (450–550 ng/μL) using a Nanoject II and incubated at 16 °C in Kulori pH 7.4 supplemented with amikacin (100 μg/mL). cRNA is synthesized by in vitro transcription using the mMessage mMachine T7 Transcription kit according to the manufacturer's instructions. Supplementary File S1 contains an example protocol for cRNA synthesis. In parallel to cRNA-injected oocytes, an equal number of oocytes are always injected with water. These serve as control oocytes (mock). Unless otherwise stated, oocytes are incubated for three days to allow time for heterologous expression of the target protein. For the assay, oocytes were kept on ice until they were added to the assay wells. Assays were performed at room temperature. The procedure is shown in Figure 3.
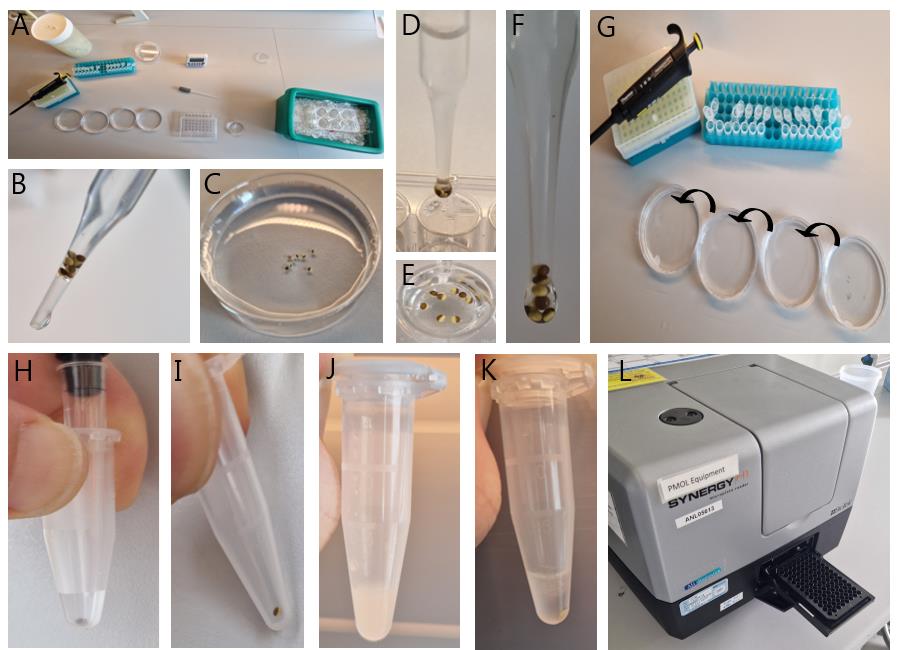
Figure 3. General assay workflow. (A) Assay setup showing oocytes kept on ice, pre-incubation Petri dish, 48-well assay plate, wash solutions, and microcentrifuge tubes. (B) Oocyte pipette containing oocytes. (C) Oocytes in pre-incubation in a small Petri dish. (D) Oocytes being transferred to the 48-well plate to initiate the assay. (E) Oocytes in the 48-well plate. (F) Oocytes transferred into an assay well as a single drop, zoomed-in example. (G) Wash steps in which oocytes are sequentially transferred through four Petri dishes containing wash solution before being transferred to microcentrifuge tubes. (H) Removal of excess wash solution using a pipette tip positioned adjacent to the oocyte at the bottom of the tube. (I) Single oocyte after removal of the washing solution. (J) Oocyte homogenate obtained after homogenization in extraction solvent by repeated pipetting. (K) Centrifuged oocyte homogenate showing the pellet and supernatant; the supernatant is transferred to a black 96-well plate for fluorescence measurements. (L) Fluorescence plate reader ready to read the black 96-well plate.
1. Prepare Kulori buffers at pH relevant to the assay conditions.
2. Prepare assay solution(s) consisting of Kulori buffer at the desired pH containing the substrate at relevant concentrations; 250 μL per oocyte group (per Kulori buffer).
3. Add 250 μL to individual wells in a 48-well plate.
4. Pre-incubation: Pour Kulori buffers of each pH without substrate into a 55 mm Petri dish.
Note: The pre-incubation step is to avoid changing the pH in the assay solution when oocytes are added. Besides, should there be a change in the oocyte membrane potential when adding to a different pH, it is hereby accounted for.
5. Washing solutions: Pour Kulori buffer without substrate into four 90 mm Petri dishes.
Note: Kulori of any pH can be used for the washing step. However, be aware that if pH 7.4 (or another neutral pH) is used, a small amount of esculin may leak out of the oocytes. During a brief wash, this loss is expected to be negligible; however, if there is any concern, use pH 5.
6. Start assay: Using the oocyte pipette, transfer 6–8 oocytes from the Kulori pH 7.4 storage buffer into the pre-incubation buffer. Start a timer.
Note: In these assays, the intended n is 6 oocyte samples per group. The additional 2 oocytes used in the assays are added in case the oocytes rupture during the assay.
7. After 5 min, pick up all the oocytes and move them into the first well in the 48-well plate in a single drop.
Note: The 5-min time period can be reduced to 2 min once you have gained experience. Typically, there is no need for more than 5 min. The time is needed at the end of the assay. It is important that as little as possible of the pre-incubation buffer is transferred into the assay solution. If two drops are needed to get the oocytes into the solution, be consistent for all the wells.
8. Immediately after, start the next group by transferring 6–8 oocytes from the storage buffer into the pre-incubation buffer.
9. Buffer measurement: From the first assay well, where the oocytes were added, transfer 1 μL into a microcentrifuge tube. Transfer this sample into the respective microcentrifuge tubes from all assay wells after oocytes are added to the wells.
Note: This sample is to check that the substrate concentration in the assay is the same for all the wells. To quantify later using the standard curve (D3), an oocyte should be added to the microcentrifuge tube before the buffer sample is added (to account for the background fluorescence from the oocyte itself).
10. After 5 min, transfer all the oocytes from pre-incubation into the next assay well in the 48-well plate.
11. Repeat steps D1.8–10 until all oocytes have been transferred into the 48-well plate.
12. End assay: Once the first oocyte group has been incubated in the assay solution for the designated assay time, the assay is stopped by the addition of 500 μL of Kulori pH 7.4 without substrate.
Note: Remember to include the pre-incubation time when checking the assay time; the timer was started when pre-incubation started, so oocytes have been incubating for 1 h in the assay when the timer reads 1 h + 5 min. The addition of the 500 μL is to 1) loosen the oocytes from the bottom of the well, and 2) increase the volume to more easily transfer the oocytes.
13. Using the oocyte pipette, immediately transfer all the oocytes (6–8 oocytes) from the well in the 48-well plate into the first washing solution, ensuring that as little as possible of the esculin solution follows the oocytes.
14. After approximately 5 s, transfer all the oocytes together to the second washing solution. Repeat this procedure for the third and fourth washing solutions. Slight agitation by hand can be applied, but is not needed; the oocytes are washed solely by sequential transfer between wash solutions.
15. After the final washing step, transfer the oocytes into individual microcentrifuge tubes (one oocyte per tube) and remove the excess washing solution using a P200 pipette.
Note: Supplementary File S2 contains a template for an assay sheet; Script 1 (Data analysis) uses a filled-out example to add metadata.
16. Repeat steps D1.12–15 every 5 min until all samples are done.
17. Blank samples: Included in the standard curve (D2) are blank samples (#0). If no standard curve is made, take an additional three oocytes that have not been incubated in an assay solution with substrate into individual tubes and treat them like the assay samples.
18. Once all samples have been transferred, follow the steps in section A using 20% methanol as the extraction solvent.
19. Measure fluorescence on the plate reader using 340 nm excitation and 452 nm emission.
D2. Standard curve
To quantify the amount of fluorescent substrate imported, prepare a standard dilution series of the compound in the extraction solvent. To account for the matrix effect of the oocyte, oocytes are added to each sample in the dilution series.
1. Prepare a 1 mM esculin stock from the 50 mM esculin stock solution.
2. From the 1 mM stock, prepare 1 mL of 20 μM esculin solution (20 μL from the 1 mM stock) in the extraction solvent (20% methanol).
Note: The intermediate 1 mM stock is prepared to ensure accurate and reproducible preparation of the 20 μM working solution for subsequent dilution series; however, this step is not strictly required.
3. Perform the dilution series (Table 1).
Table 1. Preparation of a standard curve for quantification. Serial dilution series ranging from 1 to 10,000 nM in extraction solvent. Starting from a 20 μM working solution, each dilution is prepared from the previous stock solution using the indicated volumes and extraction solvent to a final volume of 800 μL. For standard #12 (10,000 nM), the previous stock refers to the 20 μM working solution. Standard #0 contains extraction solvent only and serves as the blank. The dilution series is subsequently added to individual oocytes and processed identically to assay samples to account for matrix effects from oocyte extracts.
| No. | Concentration (nM) | μL of previous stock | μL solvent for 800 μL in total |
| 12 | 10000 | 400 | 400 |
| 11 | 5000 | 400 | 400 |
| 10 | 2000 | 320 | 480 |
| 9 | 1000 | 400 | 400 |
| 8 | 500 | 400 | 400 |
| 7 | 200 | 320 | 480 |
| 6 | 100 | 400 | 400 |
| 5 | 50 | 400 | 400 |
| 4 | 25 | 400 | 400 |
| 3 | 10 | 320 | 480 |
| 2 | 5 | 400 | 400 |
| 1* | 1 | 160 | 640 |
| 0 | 0 | 0 | 800 |
*No. 1 can be below detection (same as 0), and 2 can be close to the background.
4. Add individual oocytes to 13 × 3 microcentrifuge tubes and remove excess liquid.
Note: Oocytes do not need to be of good quality; as long as excess liquid can be removed, compromised oocytes can be used.
5. Add 110 μL of each dilution to three single oocytes and homogenize the oocytes in the standard solution.
6. Centrifuge the homogenate at >19,000× g for 10 min.
7. Transfer 100 μL of supernatant into wells of a black 96-well plate for fluorescence measurement.
8. Measure fluorescence on the plate reader using 340 nm excitation and 452 nm emission together with assay samples.
Data analysis
Data analysis was performed using R (version 4.5.3) in RStudio (version 2026.7.1.147). Three R markdown scripts, example datasets, and corresponding knitted HTML reports are provided in Supplementary File S3. Full session information, including package versions, is provided in the HTML reports. R scripts were created to convert the raw fluorescence data exported from the plate reader, in a plate-based format, into a structured dataset more suitable for downstream analysis and visualization. Additional scripts were used to generate the standard curve and apply it for quantitative analysis of the fluorescence in the samples. Furthermore, scripts were used to produce a range of different plots, tailored to the specific data type; examples can be seen in the Validation of protocol. The mean RFU of the blank samples (#0 in standard curve D2) was subtracted from the RFU of the assay samples.
Script 1: Plate to data frame
The provided example represents random numbers.
1. Copy the raw plate reader data into the Data sheet in plate_to_df.xlsx.
Note: If the plate reader gives data in long format, this script is not needed. Metadata should then just be added to the data file, and data can be used directly with script 2.
2. Fill in relevant metadata information in sheets Metadata1, Metadata2, and Metadata3 (for example, number of oocytes, compound concentration, and sample ID). Leave empty if not needed. (Optional) Assay sheet(s) can be combined with the data frame in R as well. Metadata information in the assay sheet does not need to be repeated in the plate_to_df.xlsx data file.
3. Add the Excel file, script (plate_to_df.Rmd), and assay sheet(s) to the same folder.
4. Open R Studio and specify the working directory (the path to the folder) in the code: setwd(“…”).
5. Specify the file name of the input data.
6. In the function load_plate, adjust the metadata names if needed (see comments in script).
7. If assay sheets are included, specify their file names in the relevant section of the script.
8. Run script to generate a long format data frame.
9. Save the final data frame and continue with script 2.
Script 2: Calculate sample concentration using the standard curve
The provided example contains all data visualized in the Validation of protocol section (Figure 4).
1. Add the input data (Example_uptake_data.csv) and script (Standard_curve_calculation.Rmd) to the same folder. Input data should contain, at a minimum, the following columns:
• Signal (RFU from plate reader)
• Concentration (empty/NA for all but the standard samples)
• Sample_type (assay vs. standard)
• Metadata
2. Open R Studio and specify the working directory (the path to the folder) in the code: setwd(“…”).
3. Specify the file name of the input data.
4. The script performs the following steps:
a. Identifies the blank samples (#0 in the standard curve), calculates the average background signal, and subtracts the value from all samples and standards. Furthermore, it checks that all samples fall within the range of the standard curve.
b. Generates a standard curve using a linear model (fluorescence signal vs. concentration), with the equation and R2 value displayed on the plot. Additionally, the summary of the model is displayed.
c. Estimates sample concentration based on the standard curve and corrects for the dilution factor. Calculated concentrations are in μM.
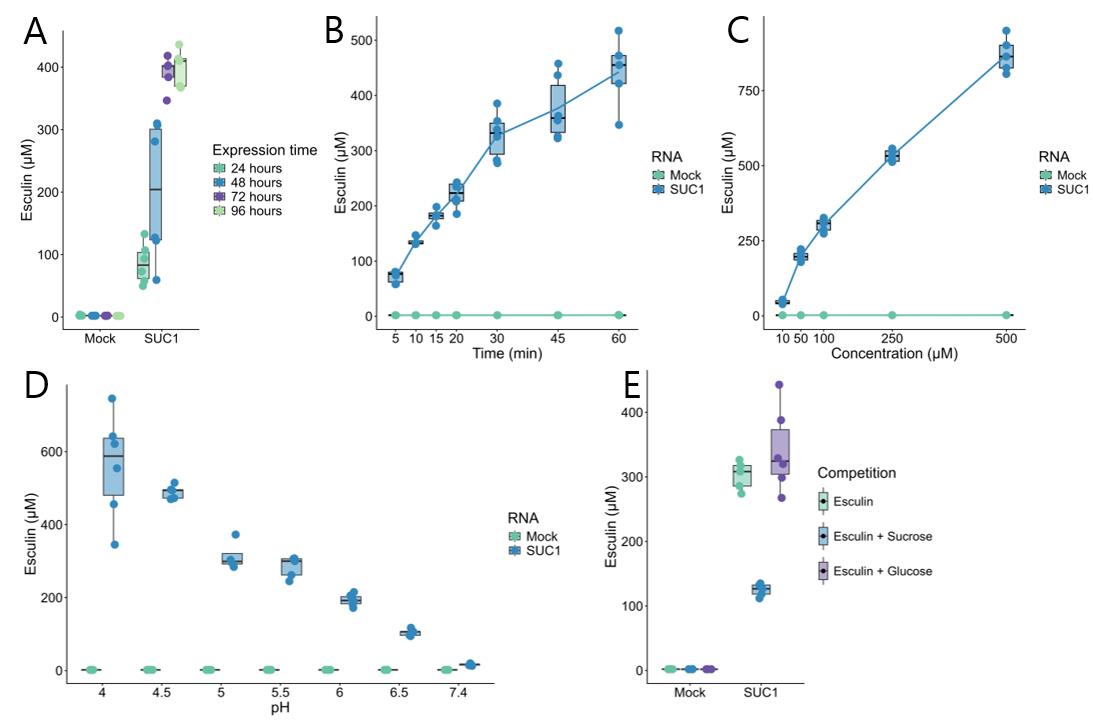
Figure 4. Characterization of SUC1-mediated esculin uptake. (A) Expression time. SUC1-expressing and mock (water-injected) oocytes were incubated in 100 μM esculin in Kulori pH 5 for 30 min after 24, 48, 72, or 96 h of expression. (B) Time course. SUC1-expressing and mock oocytes were incubated in 100 μM esculin in Kulori pH 5 for 5, 10, 15, 20, 30, 45, or 60 min. Supplementary Table S1 provides an example schedule with 2-min intervals between groups. (C) Dose response analysis. SUC1-expressing and mock oocytes were incubated in 10, 50, 100, 250, or 500 μM esculin in Kulori pH 5 for 30 min. (D) pH dependency. SUC1-expressing and mock oocytes were incubated in 100 μM esculin in Kulori at pH 4, 4.5, 5, 5.5, 6, 6.5, or 7.4 for 30 min. (E) Competition. SUC1-expressing and mock oocytes were incubated in 100 μM esculin alone or together with 2.5 mM sucrose or glucose in Kulori pH 5 for 30 min. Fluorescence was measured at 340/452 nm; single-point measurement; optics position: top; gain: 100 (default); read height: 7.00 mm (default); esculin concentrations were determined using a standard curve. Data are presented as boxplots. The center line indicates the median, the box represents the interquartile range (25th–75th percentile), and whiskers extend to the most extreme data points within 1.5 × the interquartile range.
Script 3: Optional plot types
Script 3 uses the output file from script 2 to generate the plots shown in the Validation of protocol section.
Validation of protocol
This protocol, or parts of it, has been used in the following research article using a different transporter–substrate combination: Kanstrup et al. [12]. Artificial Fluorescent Glucosinolates (F-GSLs) Are Transported by the Glucosinolate Transporters GTR1/2/3. International Journal of Molecular Sciences.
The following examples illustrate how the general assay workflow shown in section D1 can be adapted to test different parameters, including expression time, incubation time, substrate concentration, pH dependence, and competition with native substrates. All oocytes were injected with cRNA encoding SUC1 (At1g71880) or with MilliQ (mock). Unless otherwise stated, oocytes were incubated for 3 days at 16 °C in Kulori buffer pH 7.4 to express SUC1 prior to assay.
Expression time: To assess SUC1 expression over time, uptake assays were performed 24, 48, 72, and 96 h post-injection. All oocytes were injected on the same day, and assays were performed at the same time on four subsequent days. Mock oocytes did not accumulate esculin at any time point. Uptake was already detectable after 24 h in SUC1-expressing oocytes, although at a lower level than at the later time points (Figure 4A). At 72 and 96 h, uptake levels were similar, suggesting that a plateau had been reached. This plateau may indicate that SUC1 expression is comparable in all oocytes; alternatively, it may reflect chemical equilibrium at this time point. In contrast to the other time points, oocytes assayed 48 h post-injection showed a wider distribution of uptake values. This heterogeneity in the oocyte population could be due to some oocytes having already reached maximal uptake capacity or equilibrium, whereas others were still in earlier stages of expression. These results indicate that 72 h post-injection is sufficient to achieve reproducible SUC1-mediated uptake for transporter assays.
Time course: To assess optimal assay time, uptake assays were performed using incubation times ranging from 5 to 60 min. Uptake was already detectable after 5 min in SUC1-expressing oocytes (Figure 4B). Uptake increased in a steep linear manner up to 30 min, whereafter the increase in accumulation slowed down. The continued increase observed from 45 to 60 min suggests that a plateau in esculin accumulation had not yet been reached within this timeframe. These results indicate that an assay time of 30 min captures the end of the linear phase while providing a clear detectable accumulation. Furthermore, 30 min represents a practical timeframe that allows for multiple oocyte groups to be sampled without excessive assay time.
Substrate concentration: To assess how increasing substrate concentration affects accumulation, uptake assays were performed using concentrations ranging from 10 to 500 μM. Uptake was detectable at concentrations as low as 10 μM esculin, and accumulation increased continuously across the tested range without reaching a clear plateau (Figure 4C). These results indicate that SUC1-mediated uptake can be quantified across this concentration range. However, because substrate saturation was not reached up to 500 μM esculin, higher substrate concentrations would be required for kinetic analyses or for assays where transporter saturation is desired.
pH dependency assay: To assess the pH dependency of SUC1, uptake assays were performed at pH values ranging from pH 4 to 7.4. At all tested pHs, no esculin was detected in mock oocytes (Figure 4D). The highest accumulation of esculin was observed in SUC1-expressing oocytes assayed at pH 4, which is consistent with SUC1 functioning as a proton-coupled transporter [34]. The lowest accumulation was observed at pH 7.4, where proton availability is limited, and hence, transport activity is expected to be low. The observed pH dependence closely matches previous characterizations of SUC1, supporting the ability of the fluorescence-based assay to reproduce established SUC1 transport properties [34].
Competition assay: To assess the use of esculin in competition assays and the ability of the assay to reflect substrate specificity, uptake assays were performed in the presence of sucrose or glucose at a 25-fold higher concentration than esculin. A reduction in esculin upon the addition of a competing compound indicates that the transporter is able to transport that compound.
No change in esculin accumulation was observed in the presence of glucose, whereas the addition of sucrose resulted in a clear reduction in esculin accumulation (Figure 4E). This suggests that sucrose, but not glucose, competes with esculin for transport by SUC1. Previous studies showed that uptake of 14C-labeled sucrose is reduced in the presence of both esculin and glucose, although the inhibitory effect of glucose is substantially smaller than that of esculin. This suggests that glucose and esculin compete with sucrose for the binding in SUC1 [34]. In contrast, in this study, glucose does not appear to compete with esculin, whereas sucrose does. These results indicate that esculin can be used as a reporter substrate in competition assays to investigate substrate specificity and identify competing substrates of SUC1, although the degree of competition observed may differ from assays using sucrose as the reporter substrate.
General notes and troubleshooting
General notes
Oocyte matrix effect on fluorescence signal: how to handle buffer samples
The fluorescence signal is influenced by the presence of an oocyte matrix in the well. In this protocol, both standards and uptake samples contain one oocyte per tube. Buffer samples without oocytes, therefore, do not share the same matrix, and their apparent concentrations cannot be directly quantified using the oocyte-containing standard curve. To obtain quantitatively comparable buffer samples, it is recommended to either 1) add one oocyte to the tubes before collecting the 1 μL buffer sample, so that standards, uptake samples, and buffer controls all share the same matrix; or 2) include a separate standard curve prepared in buffer without oocytes, together with a blank containing only solvent, for use with oocyte-free buffer samples. If optimization of the number of oocytes from C1 results in more than one oocyte, an equally high number of oocytes should be added to the standard dilution.
Alternative oocyte homogenization procedure
Some users in our lab find it convenient to homogenize oocytes in a smaller volume of MilliQ (e.g., 10 μL) before the addition of the extraction solvent (ethanol), including a quick mix by pipetting up and down. In some cases, this approach has resulted in a clearer lysate after centrifugation, and it may be beneficial in teaching situations where fume hoods are less available. However, if this modified extraction procedure is adopted, all assay optimization steps, including fluorescence spectrum scans, should be repeated using the same extraction conditions.
Size of fluorophore for artificial fluorescent compounds
In our previous work with fluorescent glucosinolates [12], we found that smaller fluorophores tended to support more efficient transport. However, fluorophore compatibility is highly substrate- and transporter-dependent, and experimental testing is recommended when designing new fluorescent analogs.
Test for transporter-independent accumulation of compounds in the oocytes
Before performing uptake assays with new compounds, it may be relevant to determine whether the substrate accumulates in the oocyte in the absence of the heterologously expressed transporter, due to passive membrane permeation or nonspecific surface binding, before larger experiments are conducted. Follow the general assay workflow (section D1) using different concentrations and pH values relevant for your assay. Supplementary Figure S3 shows an example using esculin. Uninjected oocytes were incubated in 100 μM esculin at Kulori pH 4, 5, 6, and 7.4 for 1 h. The low fluorescence signal observed across all conditions indicates negligible transporter-independent accumulation or surface binding of esculin.
Combination of different oocyte batches
Data obtained from different oocyte batches can be combined; however, it is important that assays are performed within a short time frame. Oocytes from different seasons may exhibit differences in transporter expression levels as well as differences in quality, and hence, it might not be possible to pool the data. To minimize variability between batches, consistent experimental conditions should be maintained. Data may be normalized to internal controls (e.g., buffer samples) or expressed relative to controls within each batch to account for potential inter-batch variability.
Other options for assays
This protocol can be adapted for other applications, including uptake assays using CCCP (carbonyl cyanide m-chlorophenyl hydrazone, a protonophore) and export assays.
CCCP is commonly used to disrupt proton gradients across membranes in order to investigate proton-coupled transport. In our lab, we typically perform a longer pre-incubation (≥20 min) in the presence or absence of CCCP (100 μM) prior to the assay to allow CCCP uptake and dissipation of proton gradients. CCCP is also included in the assay buffer together with the substrate. Oocytes not treated with CCCP serve as controls to assess the effect.
Alternatively, CCCP can be used to acidify the oocyte cytosol. This enables the establishment of an outward-facing proton gradient (neutral or alkaline outside, acidic inside), allowing the measurement of transport from the cytosol to the external medium (export). In this setup, CCCP-mediated cytosolic acidification establishes a proton gradient that can be used to drive and characterize proton-coupled export activity [35]. Another method for investigating export is to inject the compound directly into the oocytes [35,36] (as in Figure 2B, C) and subsequently incubate them in substrate-free Kulori.
Troubleshooting
Low or no fluorescence signal in assay samples
Ensure that oocytes are healthy and properly injected with cRNA. Verify that the cRNA is not degraded by running it on an agarose gel, and observe definite bands, opposed to a smear, and that the concentration is correct. For a new transporter, optimization of both cRNA concentration and expression time may be required to achieve sufficient protein expression (consider verification of expression using western blot [31]). Verify plate reader settings using the procedures in sections B and C. If the signal remains low, increase substrate concentration, extend incubation time, or increase the number of oocytes analyzed per replicate. In the latter case, remember to investigate the effect of the increased amount of oocyte matrix on signal detection (C1).
Signal saturation or out-of-range values
If sample signals exceed the range of the standard curve, dilute samples with the same solvent/matrix before measurement. Alternatively, reduce substrate concentration or shorten incubation time. Samples with fluorescence values above the highest standard cannot be accurately quantified using the standard. Any sample dilution should be taken into account when calculating the final concentration.
High variability between replicates
Variability may arise from differences in oocyte quality, injection efficiency, or experience in working with oocytes. SUC1 and esculin uptake can be used as a teaching tool when training new people working with oocytes. Avoid transferring excess buffer between steps and ensure consistent handling across samples.
Supplementary information
The following supporting information can be downloaded here:
1. Figure S1. Additional excitation and emission scan where an oocyte was included.
2. Figure S2. Narrow excitation and emission scan around the initial maximum.
3. Figure S3. Esculin diffusion test in uninjected oocytes at different pHs.
4. Table S1. Time course example setup.
5. File S1. Example workflow for cRNA synthesis with mMessage mMachine T7 Transcription kit.
6. File S2. Assay sample sheet: template.
7. File S3. Rmarkdown Scripts, knitted HTML, and example datasets.
Acknowledgments
This work was supported by Novo Nordisk Foundation NNF23OC0082218. This protocol was used in [12].
The graphical abstract was created with illustrations from Bioicons and Microsoft PowerPoint.
Author contributions
C.K. conceived the study, developed the methodology, performed the assays, conducted visualization and R-script analyses, and wrote the original manuscript. V.P. contributed to the conceptualization and methodology and reviewed the manuscript. H.N. contributed funding support and reviewed the manuscript. All authors read and approved the final version of the manuscript.
Competing interests
The authors declare no conflicts of interest.
Ethical considerations
This work did not use human or animal subjects and has no ethical considerations.
References
- Bergeron, M. J., Boggavarapu, R., Meury, M., Ucurum, Z., Caron, L., Isenring, P., Hediger, M. A. and Fotiadis, D. (2011). Frog Oocytes to Unveil the Structure and Supramolecular Organization of Human Transport Proteins. PLoS One. 6(7): e21901. https://doi.org/10.1371/journal.pone.0021901
- Fastner, A., Absmanner, B. and Hammes, U.Z. (2017). Use of Xenopus laevis Oocytes to Study Auxin Transport. In: Kleine-Vehn, J., Sauer, M. (Eds.). Plant Hormones. Methods in Molecular Biology, vol 1497. Humana Press, New York, NY. pp. 259–270. https://doi.org/10.1007/978-1-4939-6469-7_21
- Ivorra, I., Alberola-Die, A., Cobo, R., González-Ros, J. M. and Morales, A. (2022). Xenopus Oocytes as a Powerful Cellular Model to Study Foreign Fully-Processed Membrane Proteins. Membranes. 12(10): 986. https://doi.org/10.3390/membranes12100986
- Miller, A. and Zhou, J. (2000). Xenopus oocytes as an expression system for plant transporters. Biochimica et Biophysica Acta (BBA) – Biomembranes. 1465: 343–358. https://doi.org/10.1016/s0005-2736(00)00148-6
- Sobczak, K., Bangel-Ruland, N., Leier, G. and Weber, W. M. (2010). Endogenous transport systems in the Xenopus laevis oocyte plasma membrane. Methods. 51(1): 183–189. https://doi.org/10.1016/j.ymeth.2009.12.001
- Dascal, N. (2000). Voltage Clamp Recordings from Xenopus Oocytes. Curr Protoc Neurosci. 10(1): ens0612s10. https://doi.org/10.1002/0471142301.ns0612s10
- Giovannardi, S., Soragna, A., Magagnin, S. and Faravelli, L. (2007). Functional Expression of Type 1 Rat GABA Transporter in Microinjected Xenopus laevis Oocytes. In: Grandi, G. (Ed). In Vitro Transcription and Translation Protocols. Humana Press, NJ. pp. 235–255. https://doi.org/10.1007/978-1-59745-388-2_12
- Markovich, D. (2008). Expression cloning and radiotracer uptakes in Xenopus laevis oocytes. Nat Protoc. 3(12): 1975–1980. https://doi.org/10.1038/nprot.2008.151
- Fairweather, S. J., Okada, S., Gauthier-Coles, G., Javed, K., Bröer, A. and Bröer, S. (2021). A GC-MS/Single-Cell Method to Evaluate Membrane Transporter Substrate Specificity and Signaling. Front Mol Biosci. 8: e646574. https://doi.org/10.3389/fmolb.2021.646574
- Theodorou, C., de-Prado-Parralejo, V., Xu, D., Todoroki, Y., Svenningsen, L., Mori, T., Crocoll, C., Hirai, M. Y., Tsugawa, H., Nour-Eldin, H. H., et al. (2025). Development of plant extracts as substrates for untargeted transporter substrate identification in Xenopus oocytes. Front Plant Sci. 16: e1640426. https://doi.org/10.3389/fpls.2025.1640426
- Jørgensen, M., Crocoll, C., Halkier, B. and Nour-Eldin, H. (2017). Uptake Assays in Xenopus laevis Oocytes Using Liquid Chromatography-mass Spectrometry to Detect Transport Activity. Bio Protoc. 7(20): e2581. https://doi.org/10.21769/bioprotoc.2581
- Kanstrup, C., Jimidar, C. C., Tomas, J., Cutolo, G., Crocoll, C., Schuler, M., Klahn, P., Tatibouët, A. and Nour-Eldin, H. H. (2023). Artificial Fluorescent Glucosinolates (F-GSLs) Are Transported by the Glucosinolate Transporters GTR1/2/3. Int J Mol Sci. 24(2): 920. https://doi.org/10.3390/ijms24020920
- Kottra, G., Spanier, B., Verri, T. and Daniel, H. (2013). Peptide transporter isoforms are discriminated by the fluorophore-conjugated dipeptides β-Ala- and d-Ala-Lys-N-7-amino-4-methylcoumarin-3-acetic acid. Physiol Rep. 1(7): e00165. https://doi.org/10.1002/phy2.165
- Tal, I., Zhang, Y., Jørgensen, M. E., Pisanty, O., Barbosa, I. C. R., Zourelidou, M., Regnault, T., Crocoll, C., Erik Olsen, C., Weinstain, R., et al. (2016). The Arabidopsis NPF3 protein is a GA transporter. Nat Commun. 7(1): e1038/ncomms11486. https://doi.org/10.1038/ncomms11486
- Cinquetti, R., Imperiali, F. G., Bozzaro, S., Zanella, D., Vacca, F., Roseti, C., Peracino, B., Castagna, M. and Bossi, E. (2021). Characterization of Transport Activity of SLC11 Transporters in Xenopus laevis Oocytes by Fluorophore Quenching. SLAS Discovery. 26(6): 798–810. https://doi.org/10.1177/24725552211004123
- Illing, A. C., Shawki, A., Cunningham, C. L. and Mackenzie, B. (2012). Substrate Profile and Metal-ion Selectivity of Human Divalent Metal-ion Transporter-1*. J Biol Chem. 287(36): 30485–30496. https://doi.org/10.1074/jbc.m112.364208
- Kolb, H. C., Finn, M. G. and Sharpless, K. B. (2001). Click Chemistry: Diverse Chemical Function from a Few Good Reactions. Angew Chem Int Ed. 40(11): 2004–2021. https://doi.org/10.1002/1521-3773(20010601)40:11<2004::aid-anie2004>3.0.co;2-5
- Sletten, E. and Bertozzi, C. (2009). Bioorthogonal Chemistry: Fishing for Selectivity in a Sea of Functionality. Angew Chem Int Ed. 48(38): 6974–6998. https://doi.org/10.1002/anie.200900942
- Venrooij, K. R., de Bondt, L. and Bonger, K. M. (2024). Mutually Orthogonal Bioorthogonal Reactions: Selective Chemistries for Labeling Multiple Biomolecules Simultaneously. Top Curr Chem. 382(3): 24. https://doi.org/10.1007/s41061-024-00467-8
- Mehak, Singh, G., Singh, R., Singh, G., Stanzin, J., Singh, H., Kaur, G. and Singh, J. (2024). Clicking in harmony: exploring the bio-orthogonal overlap in click chemistry. RSC Adv. 14(11): 7383–7413. https://doi.org/10.1039/d4ra00494a
- Reinders, A. (2012). Evolution of plant sucrose uptake transporters. Front Plant Sci. 3: e00022. https://doi.org/10.3389/fpls.2012.00022
- Zhou, J. J., Theodoulou, F., Sauer, N., Sanders, D. and Miller, A. (1997). A Kinetic Model with Ordered Cytoplasmic Dissociation for SUC1, an Arabidopsis H+/Sucrose Cotransporter Expressed in Xenopus Oocytes. J Membr Biol. 159(2): 113–125. https://doi.org/10.1007/s002329900275
- Riesmeier, J., Willmitzer, L. and Frommer, W. (1992). Isolation and characterization of a sucrose carrier cDNA from spinach by functional expression in yeast. EMBO J. 11(13): 4705–4713. https://doi.org/10.1002/j.1460-2075.1992.tb05575.x
- Sauer, N. and Stolz, J. (1994). SUC1 and SUC2: two sucrose transporters from Arabidopsis thaliana; expression and characterization in baker's yeast and identification of the histidine‐tagged protein. Plant J. 6(1): 67–77. https://doi.org/10.1046/j.1365-313x.1994.6010067.x
- Gora, P. J., Reinders, A. and Ward, J. M. (2012). A novel fluorescent assay for sucrose transporters. Plant Methods. 8(1): 13. https://doi.org/10.1186/1746-4811-8-13
- Aguero, T., Newman, K. and King, M. L. (2018). Microinjection of Xenopus Oocytes. Cold Spring Harb Proto. 2018(2): pdb.prot096974. https://doi.org/10.1101/pdb.prot096974
- Liu, X. S. and Liu, X. J. (2006). Oocyte Isolation and Enucleation. In: Liu, X. J. (Ed.). Xenopus Protocols. Methods in Molecular BiologyTM. Humana Press, NJ. pp. 31–41. https://doi.org/10.1007/978-1-59745-000-3_3
- Maldifassi, M. C., Wongsamitkul, N., Baur, R. and Sigel, E. (2016). Xenopus Oocytes: Optimized Methods for Microinjection, Removal of Follicular Cell Layers, and Fast Solution Changes in Electrophysiological Experiments. J Visualized Exp.: e3791/55034. https://doi.org/10.3791/55034
- Marchant, J. S. (2017). Heterologous Protein Expression in the Xenopus Oocyte. Cold Spring Harb Protoc. 2018(4): pdb.prot096990. https://doi.org/10.1101/pdb.prot096990
- Tammaro, P., Shimomura, K. and Proks, P. (2008). Xenopus Oocytes as a Heterologous Expression System for Studying Ion Channels with the Patch-Clamp Technique. In: Lippiat, J. D. (Ed.). Potassium Channels. Methods in Molecular Biology. Humana Press, NJ. pp. 127–139. https://doi.org/10.1007/978-1-59745-526-8_10
- Jørgensen, M. E., Nour-Eldin, H. H. and Halkier, B. A. (2016). A Western Blot Protocol for Detection of Proteins Heterologously Expressed in Xenopus laevis Oocytes. In: Fett-Neto, A. G. (Ed.). Biotechnology of Plant Secondary Metabolism. Methods in Molecular Biology. New York, NY: Springer. pp. 99–107. https://doi.org/10.1007/978-1-4939-3393-8_10
- Nour-Eldin, H. H., Hansen, B. G., Nørholm, M. H. H., Jensen, J. K. and Halkier, B. A. (2006). Advancing uracil-excision based cloning towards an ideal technique for cloning PCR fragments. Nucleic Acids Res. 34(18): e122–e122. https://doi.org/10.1093/nar/gkl635
- Spectrum [Esculin] | AAT Bioquest, https://www.aatbio.com/fluorescence-excitation-emission-spectrum-graph-viewer/esculin (accessed 25 August 2026).
- Bavnhøj, L., Driller, J. H., Zuzic, L., Stange, A. D., Schiøtt, B. and Pedersen, B. P. (2023). Structure and sucrose binding mechanism of the plant SUC1 sucrose transporter. Nat Plants. 9(6): 938–950. https://doi.org/10.1038/s41477-023-01421-0
- Belew, Z. M., Kanstrup, C., Hua, C., Crocoll, C. and Nour-Eldin, H. H. (2024). Inverse pH Gradient-Assay for Facile Characterization of Proton-Antiporters in Xenopus Oocytes. Membranes. 14(2): 39. https://doi.org/10.3390/membranes14020039
- Xu, D., Sanden, N. C. H., Hansen, L. L., Belew, Z. M., Madsen, S. R., Meyer, L., Jørgensen, M. E., Hunziker, P., Veres, D., Crocoll, C., et al. (2023). Export of defensive glucosinolates is key for their accumulation in seeds. Nature. 617(7959): 132–138. https://doi.org/10.1038/s41586-023-05969-x
Article Information
Publication history
Received: Jul 15, 2026
Accepted: Sep 1, 2026
Available online: Sep 17, 2026
Published: Oct 5, 2026
Copyright
© 2026 The Author(s); This is an open access article under the CC BY-NC license (https://creativecommons.org/licenses/by-nc/4.0/).
How to cite
de Prado Parralejo, V., Nour-Eldin, H. H. and Kanstrup, C. (2026). Step-by-Step Protocol for Fluorescence-Based Analysis of Uptake in Transporter-Expressing Xenopus laevis Oocytes. Bio-protocol 16(19): e5834. DOI: 10.21769/BioProtoc.5834.

 Download Citation in RIS Format
Category
Biochemistry > Protein > Activity
Do you have any questions about this protocol?
Post your question to gather feedback from the community. We will also invite the authors of this article to respond.
 Post a Question


