


- Protocols

- Articles and Issues
- For Authors
- About
- Become a Reviewer


Calcium Imaging in H4IIE Liver Cells and Primary Rodent Hepatocytes: A Cost-Effective Protocol for Use With Fura-2 AM Ca2+ Indicator

(*contributed equally to this work) Published: Vol 16, Iss 16, Aug 20, 2026 DOI: 10.21769/BioProtoc.5783 Views: 722
Reviewed by: Swetha MurthygowdaAnonymous reviewer(s)
 PDF
PDF  Ask a question
Original research article
The authors used this protocol in:
Jul 2021
Advertisement


Protocol Collections
Comprehensive collections of detailed, peer-reviewed protocols focusing on specific topics




Abstract
Calcium signaling is a universal, versatile process in which ionized or free calcium (Ca2+) acts as a second messenger to regulate various cellular activities, including hormone secretion, contraction, proliferation, gene expression, and apoptosis. Changes in the cytoplasmic free Ca2+ concentration ([Ca2+]cyt) in hepatocytes play a central role in mediating the actions of insulin, glucagon, catecholamines, and other hormones on carbohydrate, lipid, and protein metabolism in the liver. Ratiometric chemical Ca2+ indicators are fluorescent dyes that change their emission or excitation spectrum upon binding to calcium, allowing for precise, quantitative measurements of changes in the intracellular Ca2+ concentration. They enable calibration by calculating the ratio of two fluorescence intensities, correcting for artifacts such as uneven dye loading, photobleaching, and cell volume variations. Fura-2 acetoxymethyl ester (AM) (hereinafter referred to as Fura-2), a ratiometric and sensitive indicator dye, is a popular fluorescent Ca2+ reporter for measuring intracellular calcium. Here, we describe a comprehensive and detailed protocol for Ca2+ imaging of the H4IIE cell line and primary rodent hepatocytes in vitro via the chemical reporter Fura-2, which can also be employed on a wide variety of cell types. Unlike previously published protocols, this protocol addresses the challenge of facilitating the attachment of liver cell lines and primary hepatocytes to glass coverslips for imaging using an inverted fluorescence microscope. Our protocol describes two different loading/labeling strategies for Fura-2 dye: one is cost-effective but requires skillful pipettor handling, and the second one is easy but expensive as it needs a large volume of Krebs-Ringer HEPES (KRH)-Fura-2 solution. If the coverslips are handled properly, the cost-effective coverslip-only loading approach produces similar quality results as the large volume method. Finally, we describe a simple and user-friendly procedure to analyze Ca2+ signals over time using Microsoft Excel’s functional equations.
Key features
• This protocol enables real-time monitoring of intracellular Ca2+ in living hepatocytes.
• The method is based on fluorescence microscopy of hepatocytes loaded with Fura-2 fluorescent dye; moreover, the protocol can be extended to other mammalian cell lines.
• We used this protocol to monitor the activity of store-operated Ca2+ channels or SERCA pumps, but it could also be extended to other intracellular phenomena.
• If the Fura-2 loading strategy and incubation time are followed properly, this protocol produces highly reproducible imaging results.
Keywords: Calcium signaling Single-cell imaging
H4IIE liver cells
Hepatocytes
Store-operated Ca2+ entry
Fura-2 AM
Single-cell imaging
H4IIE liver cells
Hepatocytes
Store-operated Ca2+ entry
Fura-2 AM
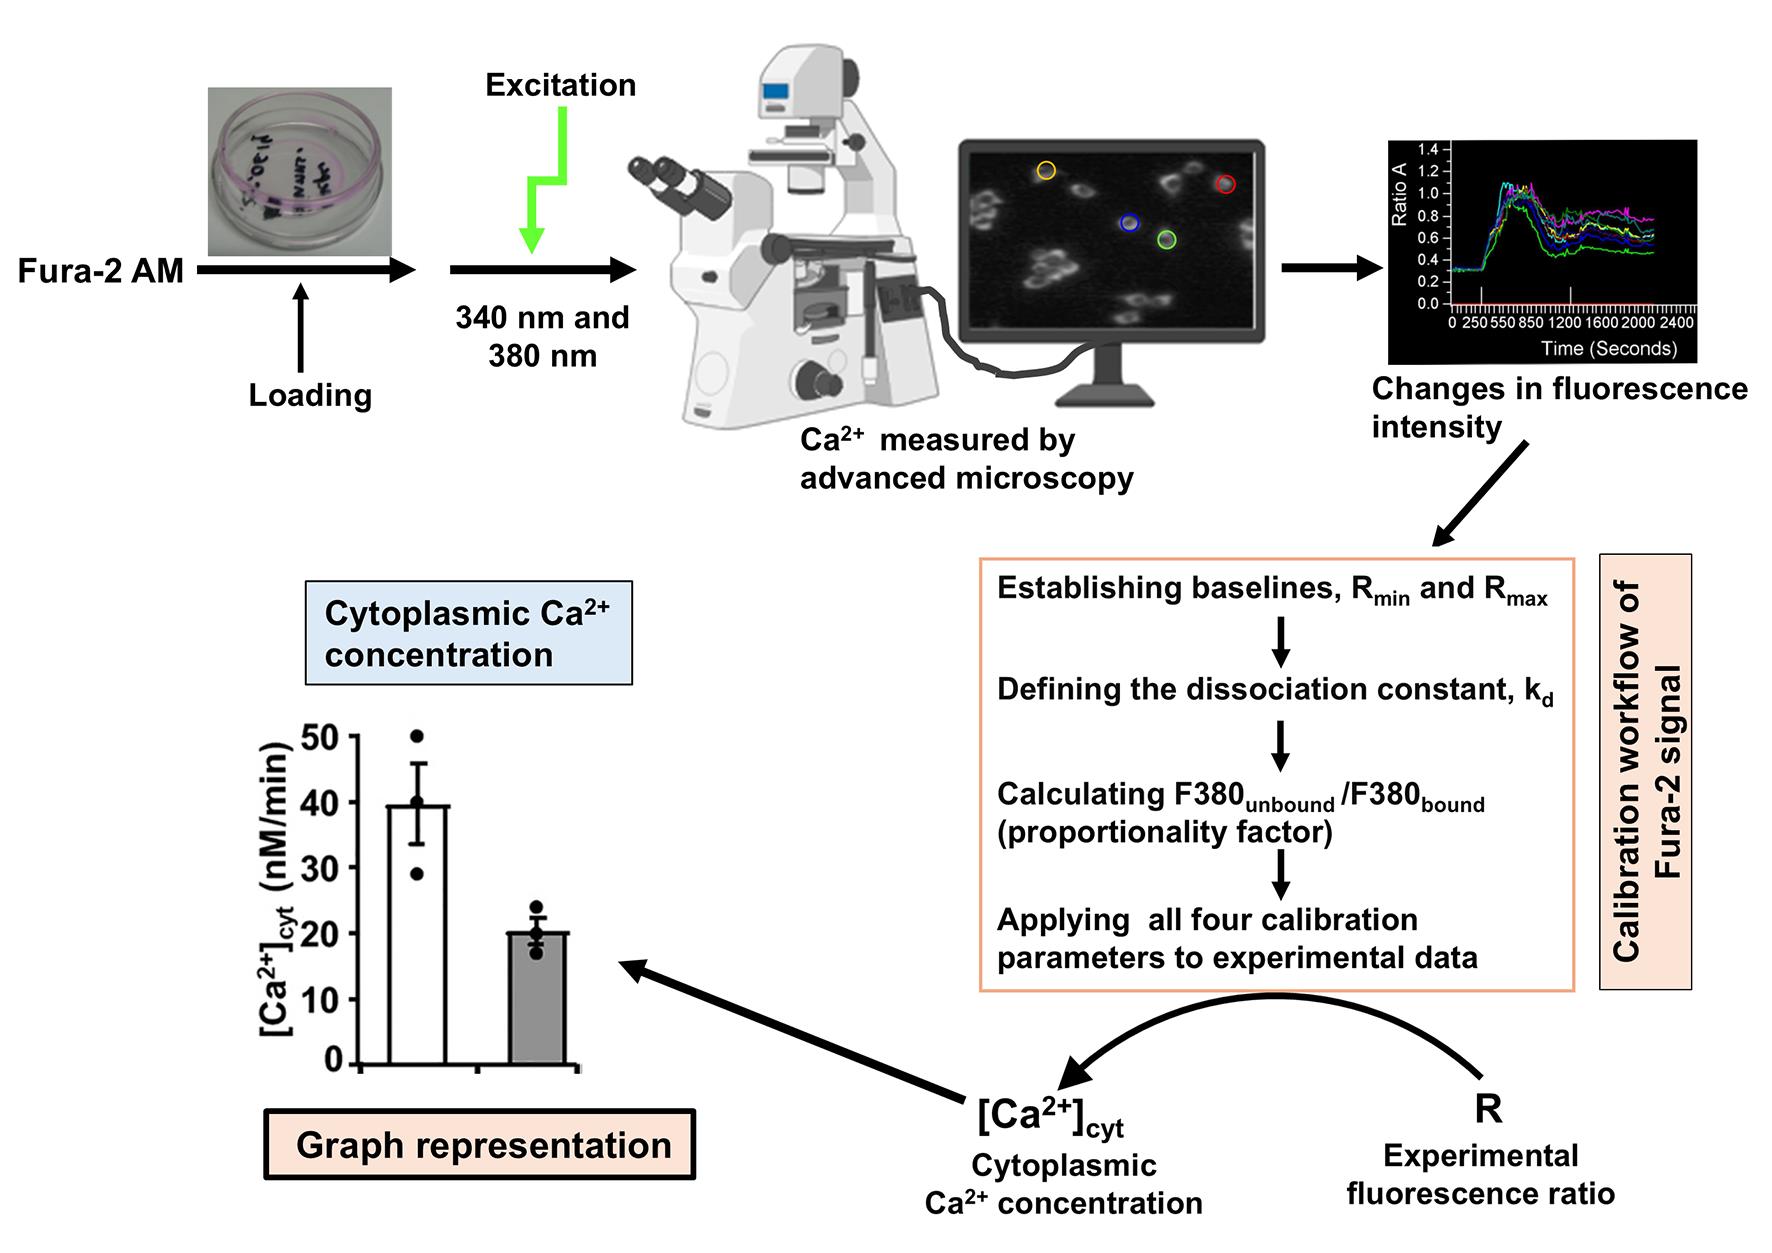
Graphical overview
Background
Intracellular calcium plays a central role in regulating key cellular processes, including transcription, signal transduction, excitability, motility, and apoptosis in hepatocytes [1,2]. The concentration of free ionized Ca2+ in the cytoplasmic space of hepatocytes is approximately 10-7 M (0.1 μM) at rest, whereas a large proportion (99%) of total Ca2+ in the cytoplasmic space is bound to proteins and metabolites [3]. Ca2+ is stored (accumulated) in the endoplasmic reticulum (ER), sarcoplasmic reticulum, mitochondria, and other intracellular organelles. For example, the total Ca2+ concentration in the ER can be 10 mM, with a free Ca2+ concentration of 10 μM. Hormones, neurotransmitters, and other extracellular signals increase cytoplasmic free Ca2+ concentration ([Ca2+]cyt) from 0.1 to 1–5 μM [4]. Since the hormonal and metabolic cues are associated with dynamic fluctuations of intracellular Ca2+, accurate quantification of cytosolic Ca2+ dynamics has been central to interpreting liver-specific signaling pathways. Intracellular fluorescent Ca2+ reporters provide one of the best techniques to measure the free Ca2+ concentration in the cytoplasmic space and organelles. Fura-2 acetoxymethyl ester (Fura-2 AM), which enables calibrated measurements of absolute intracellular Ca2+ concentrations in isolated cells, is one of the most widely used fluorescent indicators for intracellular Ca2+ imaging.
With a variety of calcium indicators available, such as fluorescence dyes including Fluo-3, Fluo-4, Fura-2, and Indo-1, or genetically encoded calcium indicators (e.g., GCaMP), it is important to consider the specific requirements of the experiment, including the type of cells being investigated, the desired emission wavelengths, and the sensitivity needed for detecting calcium binding events. Since chemical Ca2+ indicators are not required to be transfected or expressed into cells, they provide an unparalleled flexibility in experimental design for tracking intracellular calcium dynamics, largely outperforming genetically encoded indicators in terms of commercial availability and customization. The main advantage of using ratiometric dyes (e.g., Fura-2) compared to single-wavelength probes (e.g., Fluo-3) is that the ratio signal remains unchanged by variations in dye concentration, optical path length, and/or light intensity. This property of ratiometric dyes permits investigators to determine the intracellular calcium concentration with greater accuracy. The primary advantage of Fura-2 over other calcium reporters is its ratiometric capability, which calculates calcium concentration by taking the ratio of fluorescence emitted at 340 and 380 nm excitation [5–7]. This mathematically cancels out experimental artifacts like uneven dye loading, cell thickness variations, and photobleaching, allowing for absolute calcium quantification [4]. While both Fura-2 and Indo-1 are ratiometric indicators, Fura-2 remains the superior choice for fluorescence imaging because of its high resistance to photobleaching compared to the Indo-1 reporter [8]. The principle for the measurement of cytoplasmic Ca2+ using this Ca2+ fluorescent dye is that the acetoxymethyl ester (AM) form of the fluorescent dyes can diffuse passively across the cell membrane (and intracellular membranes); once the dye is inside the cell, esterases cleave off the AM groups [5,6]. Intracellular or cytoplasmic Ca2+ binds to Fura-2 free acid and provides fluorescence intensity (Figure 1).
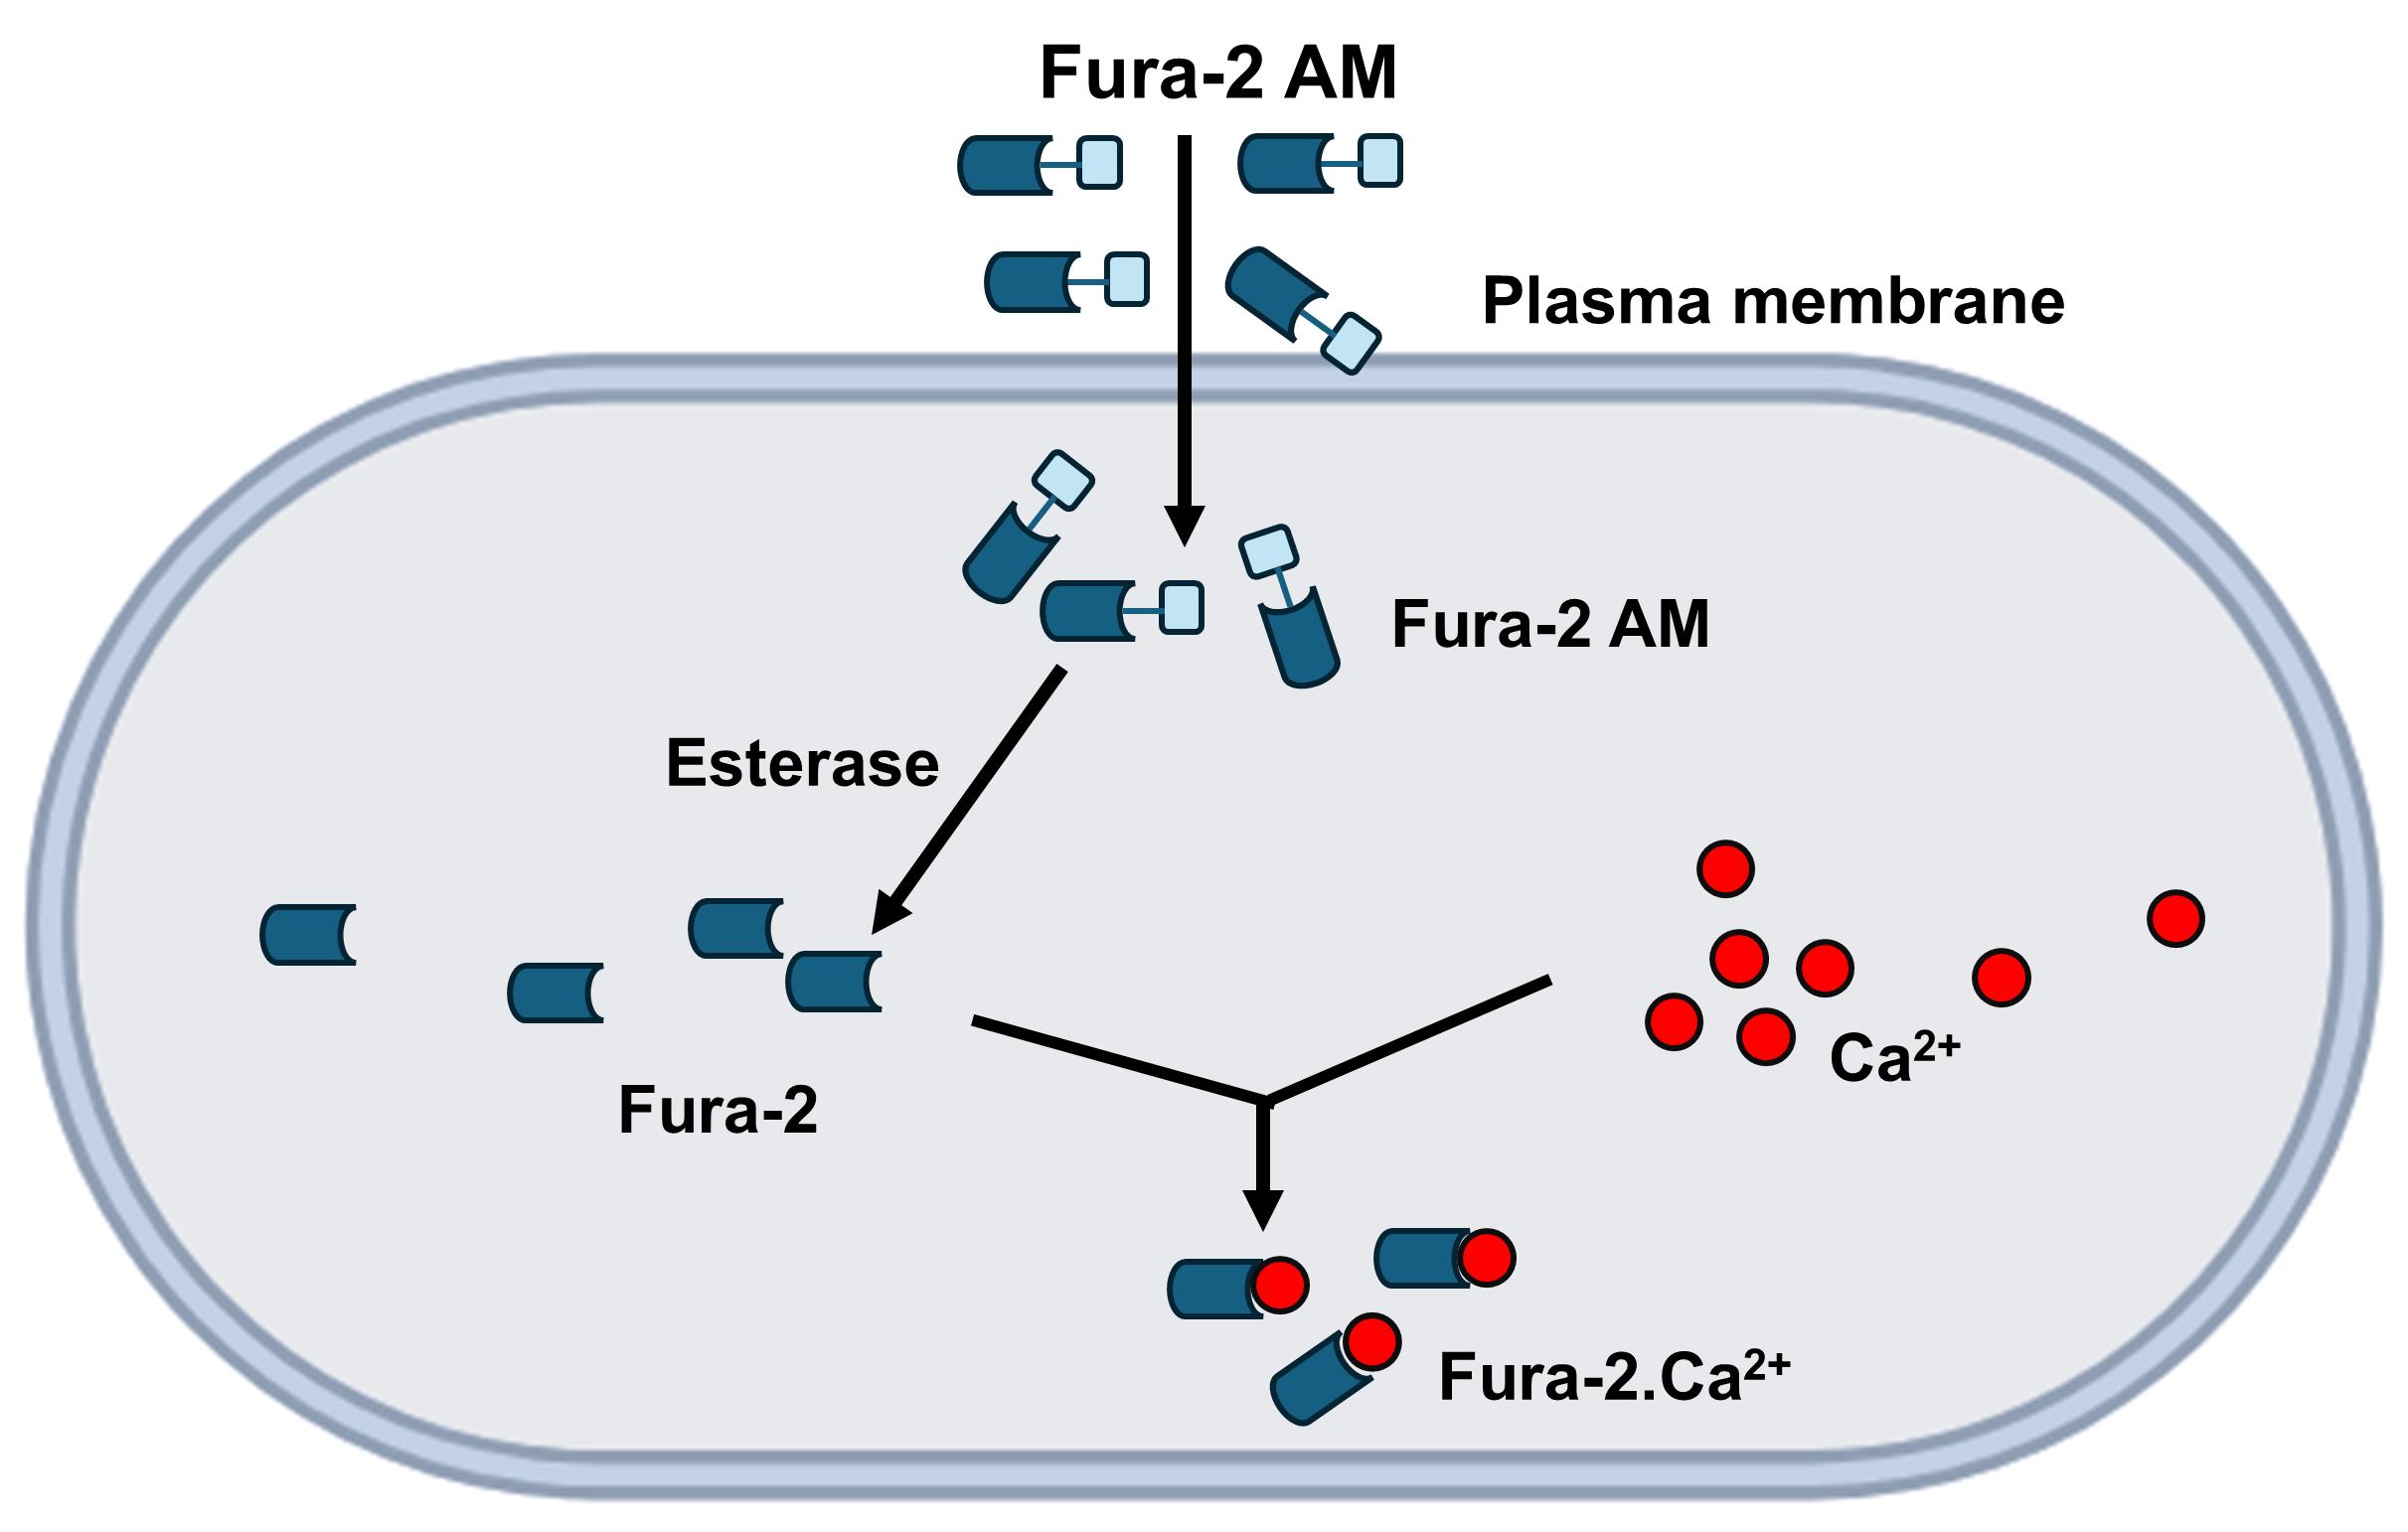
Figure 1. Principles of Fura-2 AM calcium imaging. Once the Fura-2 AM dye is inside the cell, intracellular esterases cleave the AM groups [5,6]. Intracellular or cytoplasmic Ca2+ can bind to Fura-2 free acid, providing fluorescence intensity.
One important methodological gap in existing Fura-2 imaging protocols and tutorials is the lack of a framework for relating image-based measurements to quantitative interpretation. The Grynkiewicz formula (for details, see section E of this protocol) is used to accurately calculate intracellular free Ca2+ concentrations using ratiometric fluorescent indicators like Fura-2 [9]. Eventually, the formula translates background-corrected fluorescence ratios into a reliable Ca2+ concentration. In this protocol, to successfully use the formula in calibration-based analysis, we have followed a specific protocol (ionomycin-EGTA assay) to acquire the values of different variables and parameters used in the formula. In the case of the image-based implementation workflow, before calculating the ratio, we have subtracted background noise (from optics or autofluorescence) for each excitation wavelength to prevent large calculation errors. With the imaging software, we also computed the pixel-by-pixel intensity ratio 340 nm/380 nm across the entire image through the selection of 10–15 regions of interest. This ratiometric approach inherently corrects for uneven dye loading, minor dye leakage, and photobleaching. Finally, we performed the calibration assay to convert the Fura-2 dye fluorescence ratio into the cytoplasmic Ca2+ concentration.
Our group used Fura-2 dye to examine Ca2+ signaling by fluorescence microscopy in hepatocytes isolated from Alms1 mutant mice [10], hepatocytes from obese Zucker rats and Hooded Wistar rats [11], and H4IIE rat liver cell lines [12]. Hepatocytes can be easily isolated and purified from rat or mouse liver tissue. Freshly isolated primary hepatocytes, however, only survive for a few hours in non-adherent suspension culture [13,14] and are not amenable to attaching onto commercially available coverslips. This protocol addresses the well-known challenge of cell adhesion by employing an acid (hydrochloric acid, 1 M) washing strategy. As attachment-dependent cells, acid washing provides conditions on the coverslips in which primary hepatocytes can survive. Hydrochloric acid (1 M) washing removes microscopic debris, dust, and toxic manufacturing residues from the glass surface of coverslips, ensuring a chemically sterile environment. The acid treatment hydroxylates the glass surface and yields a highly charged, hydrophilic surface that facilitates robust bonding of extracellular matrix (ECM) proteins of hepatocytes [15]. From our experience, if the acid washing protocol for coverslip is appropriately followed, freshly isolated hepatocytes are shown to adhere and survive up to 36–40 h. It is worth noting that the acid washing strategy is reasonably cost-effective compared to the collagen- or Polylysine-coating method. Furthermore, in this protocol, we have adopted a new and cost-effective Fura-2 dye loading approach, which produces similar quality results as the traditional method using a large dye volume.
The detailed step-by-step protocol described below, using chemical Ca2+ indicators, can also be readily adapted to various suspensions and other adherent cell types.
Materials and reagents
Biological materials
1. H4IIE rat hepatoma cells (ATCC CRL-1548)
Note: The H4IIE is an epithelial rat hepatoma cell line widely used in toxicology, cancer research, and pharmacology. Derived from the Reuber H-35 rat hepatoma, it serves as a critical in vitro model for evaluating how the liver responds to toxins, metabolic regulation, and drug-induced enzymatic activities [11,12].
2. Freshly isolated primary hepatocytes (isolated in-house from C57BL/6J Alms1 mouse; Hooded Wistar rat, Obese Zucker rat [10–12])
Reagents
1. Dulbecco's modified Eagle medium (DMEM) (Thermo Fisher Scientific, catalog number: 11-965-092)
2. F-12 (Thermo Fisher Scientific, catalog number: 11-765-054)
3. Fetal bovine serum (FBS) (Bovogen Biologicals, Keilor East VIC, catalog number: SFBS-AU)
4. Glucose (Millipore Sigma, catalog number: G7021)
5. Dimethyl sulfoxide (DMSO) (Thermo Fisher Scientific, catalog number: D12345)
6. Penicillin-Streptomycin (Gibco, catalog number: 15140122)
7. Phosphate-buffered saline (PBS), cell culture grade (Corning, catalog number: 21-040-CV)
8. Trypsin–ethylenediaminetetraacetic acid (Trypsin-EDTA) (Millipore Sigma, catalog number: T4049)
9. Pluronic acid, F-127 (Thermo Fisher Scientific, catalog number: P3000MP)
10. Fura-2 AM (Thermo Fisher Scientific, catalog number: F3021)
11. Ethylene glycol-bis(2-aminoethylether)-N,N,N′,N′-tetraacetic acid (EGTA) (Sigma-Aldrich, catalog number: E8145)
12. 4-(2-hydroxyethyl)-1-piperazineethanesulfonic acid (HEPES); chemical formula: C8H18N2O4S (EMD Millipore, catalog number: 391338)
13. Dexamethasone (Sigma-Aldrich, catalog number: D4902)
14. Insulin (Millipore Sigma, catalog number: 91077C)
15. Sodium chloride (NaCl) (Sigma-Aldrich, catalog number: S9888)
16. Potassium chloride (KCl) (Millipore Sigma, catalog number: P5405)
17. Calcium chloride (CaCl2) (Millipore Sigma, catalog number: C5670)
18. Magnesium chloride (MgCl2) (Millipore Sigma, catalog number: M4880)
19. Sodium hydroxide (NaOH) (Sigma-Aldrich, catalog number: S2770)
20. Hydrochloric acid (HCl) (Sigma-Aldrich, catalog number: 320331)
21. Ethanol 200-proof (Westlab, catalog number: AL048X)
22. Collagenase Type IV (working concentration: 0.2 mg/mL) (Worthington Biochemical Corporation, catalog number: CLS-4)
23. Digitonin (Sigma-Aldrich, catalog number: D141)
24. Tris(hydroxymethyl)aminomethane (Tris base) (Sigma-Aldrich, catalog number: 252859)
25. Ionomycin (Sigma-Aldrich, catalog number: AABH9A95673F)
26. 2,5-di-tert-butylhydroquinone (DBHQ) (Sigma-Aldrich, catalog number: 112976)
Solutions
1. Krebs Ringer’s (KRH) solution (see Recipes)
2. Calcium-free KRH solution (see Recipes)
3. Pluronic acid 20% (w/v) in DMSO (see Recipes)
4. Complete DMEM medium (see Recipes)
5. Growth medium (see Recipes)
6. Attachment medium (see Recipes)
Recipes
1. KRH solution
| Reagent | Final concentration | Quantity or volume (for 500 mL) |
|---|---|---|
| NaCl | 136 mM | 3.97 g |
| KCl | 4.7 mM | 0.175 g |
| CaCl2 | 2.4 mM | 0.133 g |
| MgCl2 | 1.25 mM | 59.51 mg |
| HEPES (stock 1 M) | 10 mM | 5 mL |
| Glucose | 10 mM | See note |
Prepare the KRH solution in ddH2O and adjust to pH 7.4 with NaOH. Store at room temperature.
Note: Prepare KRH without glucose and add the required amount of glucose on the day of the experiment. For example, to prepare 50 mL of KRH working buffer, add 90.1 mg of glucose to the tube containing 50 mL of KRH. For the calibration experiment, 5 mM CaCl2 is used instead of 2.4 mM CaCl2.
2. Calcium-free KRH solution
| Reagent | Final concentration | Quantity or volume (for 500 mL) |
|---|---|---|
| NaCl | 136 mM | 3.97 g |
| KCl | 4.7 mM | 0.175 g |
| MgCl2 | 1.25 mM | 59.51 mg |
| HEPES (stock 1 M) | 10 mM | 5 mL |
| EGTA | 1 mM | 0.19018 g |
| Glucose | 10 mM | See note |
Prepare the Ca2+-free KRH solution in ddH2O and adjust to pH 7.4 with NaOH. Store at room temperature.
Note: KRH buffer is prepared with or without Ca2+ (CaCl2) according to the experimental need. Prepare KRH without glucose and add the required amount of glucose on the day of the experiment.
3. Pluronic acid 20% (w/v) in DMSO
Add 0.2 g of Pluronic acid to 1 mL of DMSO and vortex until dissolved. Pluronic acid is difficult to dissolve, so vortex continuously for ~30 min or until dissolved. Keep at room temperature.
4. Complete DMEM medium
| Reagent | Final concentration | Volume (for ~500 mL) |
|---|---|---|
| DMEM | 89% | 445 mL |
| FBS | 10% (v/v) | 50 mL |
| Penicillin/Streptomycin (Penicillin 10,000 units/mL and Streptomycin 10,000 μg/mL) | 100 units/mL (penicillin), 0.1 mg/mL streptomycin | 5 mL |
5. Growth medium
| Reagent | Final concentration | Volume (for ~500 mL) |
|---|---|---|
| DMEM | 44% | 220 mL |
| F-12 | 44% | 220 mL |
| FBS | 10% (v/v) | 50 mL |
| Penicillin/Streptomycin (Penicillin 10,000 units/mL and Streptomycin 10,000 μg/mL) | 100 units/mL (penicillin), 0.1 mg/mL streptomycin | 5 mL |
| HEPES (stock 1 M) | 10 mM | 5 mL |
For preparing FBS aliquots, thaw frozen FBS (500 mL bottle) in a 37 °C water bath. In the laminar flow hood, prepare 10× 50 mL aliquots. For penicillin/streptomycin (concentration 100×), after thawing, prepare 5 mL aliquots. Additionally, prepare HEPES stock buffer 1 M by dissolving 47.66 g of HEPES in 200 mL of ddH2O, and adjust the pH to 7.4. Then, filter-sterilize in a laminar flow hood. Finally, prepare 500 mL of growth medium containing DMEM and F-12 (1:1), supplemented with 10% (v/v) FBS, penicillin (100 units/mL), streptomycin (0.1 mg/mL), and 10 mM HEPES.
6. Attachment medium
| Reagent | Final concentration | Volume (for ~500 mL) |
|---|---|---|
| DMEM | 44% | 220 mL |
| F-12 | 44% | 220 mL |
| FBS | 10% (v/v) | 50 mL |
| Penicillin/Streptomycin (Penicillin 10,000 units/mL and Streptomycin 10,000 μg/mL) | 100 units/mL (penicillin), 0.1 mg/mL streptomycin | 5 mL |
| HEPES (1 M stock) | 10 mM | 5 mL |
| Dexamethasone (100 μM stock) | 100 nM | 500 μL |
| Insulin (100 μM stock) | 100 nM | 500 μL |
Prepare 500 mL of attachment medium containing DMEM and F-12 (1:1), supplemented with 10% (v/v) FBS, penicillin (100 units/mL), streptomycin (0.1 mg/mL), 10 mM HEPES, and the required amount of dexamethasone (final concentration 100 nM) and insulin (final concentration 100 nM).
Laboratory supplies
1. 35 mm TC-treated culture dish (Corning, catalog number: 430165)
2. 22 mm diameter, 1-mm thick glass coverslip (Oxford Instruments, catalog number: 51-1625-0129)
3. Gloves (Westlab, catalog number: 100714-3007)
4. Forceps (Westlab, catalog number: 663-938)
5. Cell scrapers (TH Geyer, catalog number: 7696760)
6. 15 mL conical tubes (TH Geyer, catalog number: 7696714)
7. 50 mL conical tubes (Greiner Bio-One, catalog number: 227261)
8. 5 mL serological pipettes (Greiner Bio-One, catalog number: 606180)
9. 10 mL serological pipettes (Greiner Bio-One, catalog number: 607180)
10. 20 μL pipette tips (TH Geyer, catalog number: 7695882)
11. 200 μL pipette tips (TH Geyer, catalog number: 7695884)
12. 1,250 μL pipette tips (TH Geyer, catalog number: 7695887)
13. Racks (John Morris Scientific, catalog number: 0030119819)
14. Glass beaker (John Morris Scientific, catalog number: 632417010400)
15. Aluminum foil (John Morris Scientific/LabFriend, catalog number: 60032)
16. Silicon grease (Molykote/Dow Corning, catalog number: 408524)
17. 75 cm2 sterile flasks (Greiner Bio-One, catalog number: 658175)
Equipment
1. Nikon TE300 Eclipse microscope equipped with a Sutter DG-4 (this Sutter DG4 also combines a high-intensity xenon light source) wavelength switcher (to generate alternating excitation light 340 and 380 nm), Omega XF04 filter set for Fura-2 Photonic Science ISIS-3 ICCD camera
2. CO2 incubator
3. Computer system equipped with MetaFluor software
4. Freezer (-20 °C)
5. Refrigerator (2–8 °C)
6. Liquid nitrogen (N2) tank
7. Water bath (Westlab, catalog number: 663-311)
8. Tissue culture hood (NuAire, catalog number: NU-978-002)
9. Fume hood (Westlab, catalog number: 665-846)
10. Oven
11. Centrifuge (Eppendorf, model: Centrifuge 5420, catalog number: 5420000245D)
Software and datasets
1. MetaFluor suite (https://imagxcell.com/metafluor)
2. Microsoft Excel (https://www.microsoft.com/en-us/microsoft-365/excel)
3. GraphPad Prism (https://www.graphpad.com/)
Procedure
A. Preparation of coverslips for the attachment and growth of H4IIE liver cells and primary rodent hepatocytes
1. Prepare and sterilize coverslips (22 mm diameter) for the attachment and growth of H4IIE cells: Using forceps to hold the coverslip, dip it into 100% ethanol, put it in contact with the flame, immediately take it away from the flame, and shake it in the air until the flame stops burning. Then, place it into the 35 mm Petri dish. The coverslips are now ready to be used to grow H4IIE cells.
Note: Shake the coverslips when they are in contact with the fire; if you leave them in direct contact with the flame, they will break, as they are very thin. Do this inside the hood to maintain sterile conditions.
2. Prepare and sterilize coverslips (22 mm diameter) for attachment and growth of freshly isolated primary hepatocytes:
a. Add 1 M HCl to an appropriate open beaker in a chemical fume hood with the appropriate precautions.
Note: The beaker should be glass or other acid- or heat-resistant material.
b. Add one whole box of coverslips (~100 coverslips) to the HCl.
c. Incubate the coverslips overnight inside the chemical fume hood at room temperature.
d. Wash the coverslips 3–4 times with normal water (running water). This step should be carried out outside of the hood.
e. Wash the coverslips several times with distilled water. This step can also be carried out outside of the hood.
f. Remove all the water from the beaker (using a pipette inside the tilted beaker), wait 10 min for air drying, and cover the beaker with aluminum foil.
Note: Aluminum foil should cover the top to avoid contamination.
g. Place the covered container in an oven for 4 h at 90 °C to sterilize.
h. After that period, take the container out of the oven carefully and place it inside the hood.
Note: Leave the container inside the hood, since the coverslips are already sterile. If you leave them outside, they can become contaminated.
B. Subculturing cells onto coverslips
1. Subculture H4IIE cells onto coverslips:
a. Start with H4IIE cells growing in 75 cm2 sterile flasks in complete DMEM medium (see Recipe 4).
b. When cells become 80% confluent (growing in one 75 cm2 sterile flask), wash the cells three times with 1× PBS.
c. Add 1 mL of trypsin 0.25% plus EDTA 1 mM for 2 min at 37 °C to detach the cells.
d. Once the cells are detached, add 9 mL of DMEM medium and resuspend the cells by pipetting up and down.
e. To attach the cells to the coverslips, place the coverslips in a 35 mm Petri dish and add 1 mL of fresh DMEM.
Note: The coverslips need to be previously sterilized by immersion in 100% ethanol, as described above.
f. Add approximately 3,000–5,000 cells (1–3 drops) of the above cell suspension to the medium in the Petri dish and stir gently.
g. Place the cells in the CO2 incubator at 37 °C until use.
h. The cells can be used as soon as they are attached. This normally occurs after 4–5 h.
Note: From our experience, it is better to use the cells at least 24 h after they are attached. The cells will then have between 30%–50% confluence, which is more than enough.
2. Culture freshly isolated primary hepatocytes on coverslips:
a. After obtaining the solution or mixture of fresh isolated hepatocytes, plate them on a coverslip for the experiments. For primary hepatocytes, the coverslips need to be treated specially with 1 M HCl to allow the hepatocytes to attach properly (see step A2).
Note: For the isolation of hepatocytes, we used the collagenase perfusion method [16], which involves the disruption of intercellular junctions with a calcium-free buffer and the digestion of the extracellular matrix with collagenase.
Caution: Collagenase handling requires maintaining strict temperature controls to preserve enzymatic activity, following strict digestion time, and avoiding contamination.
Critical: The perfusion medium must be at 36–37 °C, and the digestion time of the liver is 12–15 min.
Note: For comprehensive details on the collagenase-based dissociation method, readers are referred to [16].
b. Place coverslip(s) onto 35 mm Petri dishes.
c. Add 1 mL of the attachment medium (see Recipe 6) to each Petri dish.
d. Add the volume (usually 200 μL to 1 mL) of hepatocytes mixture/solution required for the experiment.
e. Place the Petri dish with hepatocytes in an incubator at 37 °C with 5% CO2 for 4 h.
f. Replace the attachment medium with growth medium (see Recipe 5) and place the Petri dish back into the incubator. After 4–16 h, hepatocytes are ready to be used in Fura-2 loading experiments.
C. Preparation of dye solution and loading of cells with Fura-2 dye for measurement of [Ca2+]cyt
1. Preparation of 2 mL of Fura-2-KRH solution:
a. Add 5 μL of DMSO into the Fura-2 vial, which contains 50 μg of Fura-2 acetoxymethyl ester. This gives a 10 mM concentration of Fura-2. Stocks can be stored at -20 °C. Thaw stocks to room temperature before imaging.
b. Prepare Pluronic acid (20%) with DMSO (see Recipe 3).
Note: Pluronic acid is used to facilitate the loading of the dye by enhancing the dispersal of the hydrophobic Fura-2 [17].
c. Mix the Fura-2 and Pluronic acid solution (1:1 vol) by pipetting up and down several times. This gives a 5 mM concentration of Fura-2.
d. Spin down the content by brief centrifugation (94× g for 5–7 s).
e. Repeat the mixing process and centrifuge once more in order to ensure complete mix of Fura-2 with Pluronic acid solution.
f. After that, add 2 mL of KRH buffer (see Recipe 1) into a new tube. Then, add 2 μL of the Fura-2 (5 mM) Pluronic acid (10%) solution into the 2 mL KRH buffer. Final Fura-2 concentration is 5 μM.
g. Mix the solution by pipetting up and down.
2. Loading of H4IIE cells with Fura-2:
Note: H4IIE cells previously grown on glass coverslips are loaded with Fura-2 at room temperature for 30 min with 5 μM Fura-2 in KRH buffer containing 0.02% (w/v) Pluronic acid (these are final concentrations).
a. Take the Petri dish containing the coverslip with the cells attached out of the incubator.
b. Wash the coverslip twice with KRH solution.
c. Add 1 mL of Fura-2-KRH solution (preparation shown in step C1) to the Petri dish. Stir gently by pipetting up and down, cover the Petri dish, and incubate at room temperature for 30 min. Alternatively, we developed and implemented a cost-effective method for loading cells with Fura-2 (Figure 2). All the necessary steps involved in this cost-effective and cost-efficient method are clearly described in the legend of Figure 2. First, grow cells on a coverslip as described in section B. Then, use forceps to remove the coverslip from the 35 mm Petri dish, invert the lid of the dish, and place the coverslip upright onto the inverted lid. Next, using a P200 pipettor, carefully add 270 μL of Fura-2-KRH solution onto the coverslip (the solution should not overflow). Finally, remove the media from the bottom part of the Petri dish and invert to cover the coverslip and avoid contamination. While this method is cost-effective, it requires skillful pipettor handling.
Note: If delivered properly with the optimal volume, 270 μL of Fura-2-KRH solution is shown to stay only on the coverslip because of its surface tension, without flowing toward the Petri dish.
d. After 30 min of incubation at room temperature with Fura-2-KRH, gently wash the cells and coverslips with KRH twice and incubate the cells for 20–30 min at room temperature. This way, the total incubation time is approximately 60 min. This double wash-out provides better results, removing any residual chemicals and washing away any unattached cells.
Note: After washing cells twice with KRH, add KRH solution again to the Petri dish and incubate for an additional 20–30 min to allow de-esterification of the acetoxymethyl ester by intracellular esterases. De-esterification is the process in which membrane-permeable Fura-2 AM is cleaved by esterases into active, fluorescent Fura-2.
e. After the incubation (de-esterification) period, image the fluorescence emission of Fura-2 using the MetaFluor software.
f. Synchronize the timing for Fura-2 loading and imaging of multiple samples: During imaging of multiple coverslips in a single session, ensure the same loading times of Fura-2 between different samples for reproducibility.
Note: Fura-2 is light sensitive; working with Fura-2 should be performed in a relatively dark room.
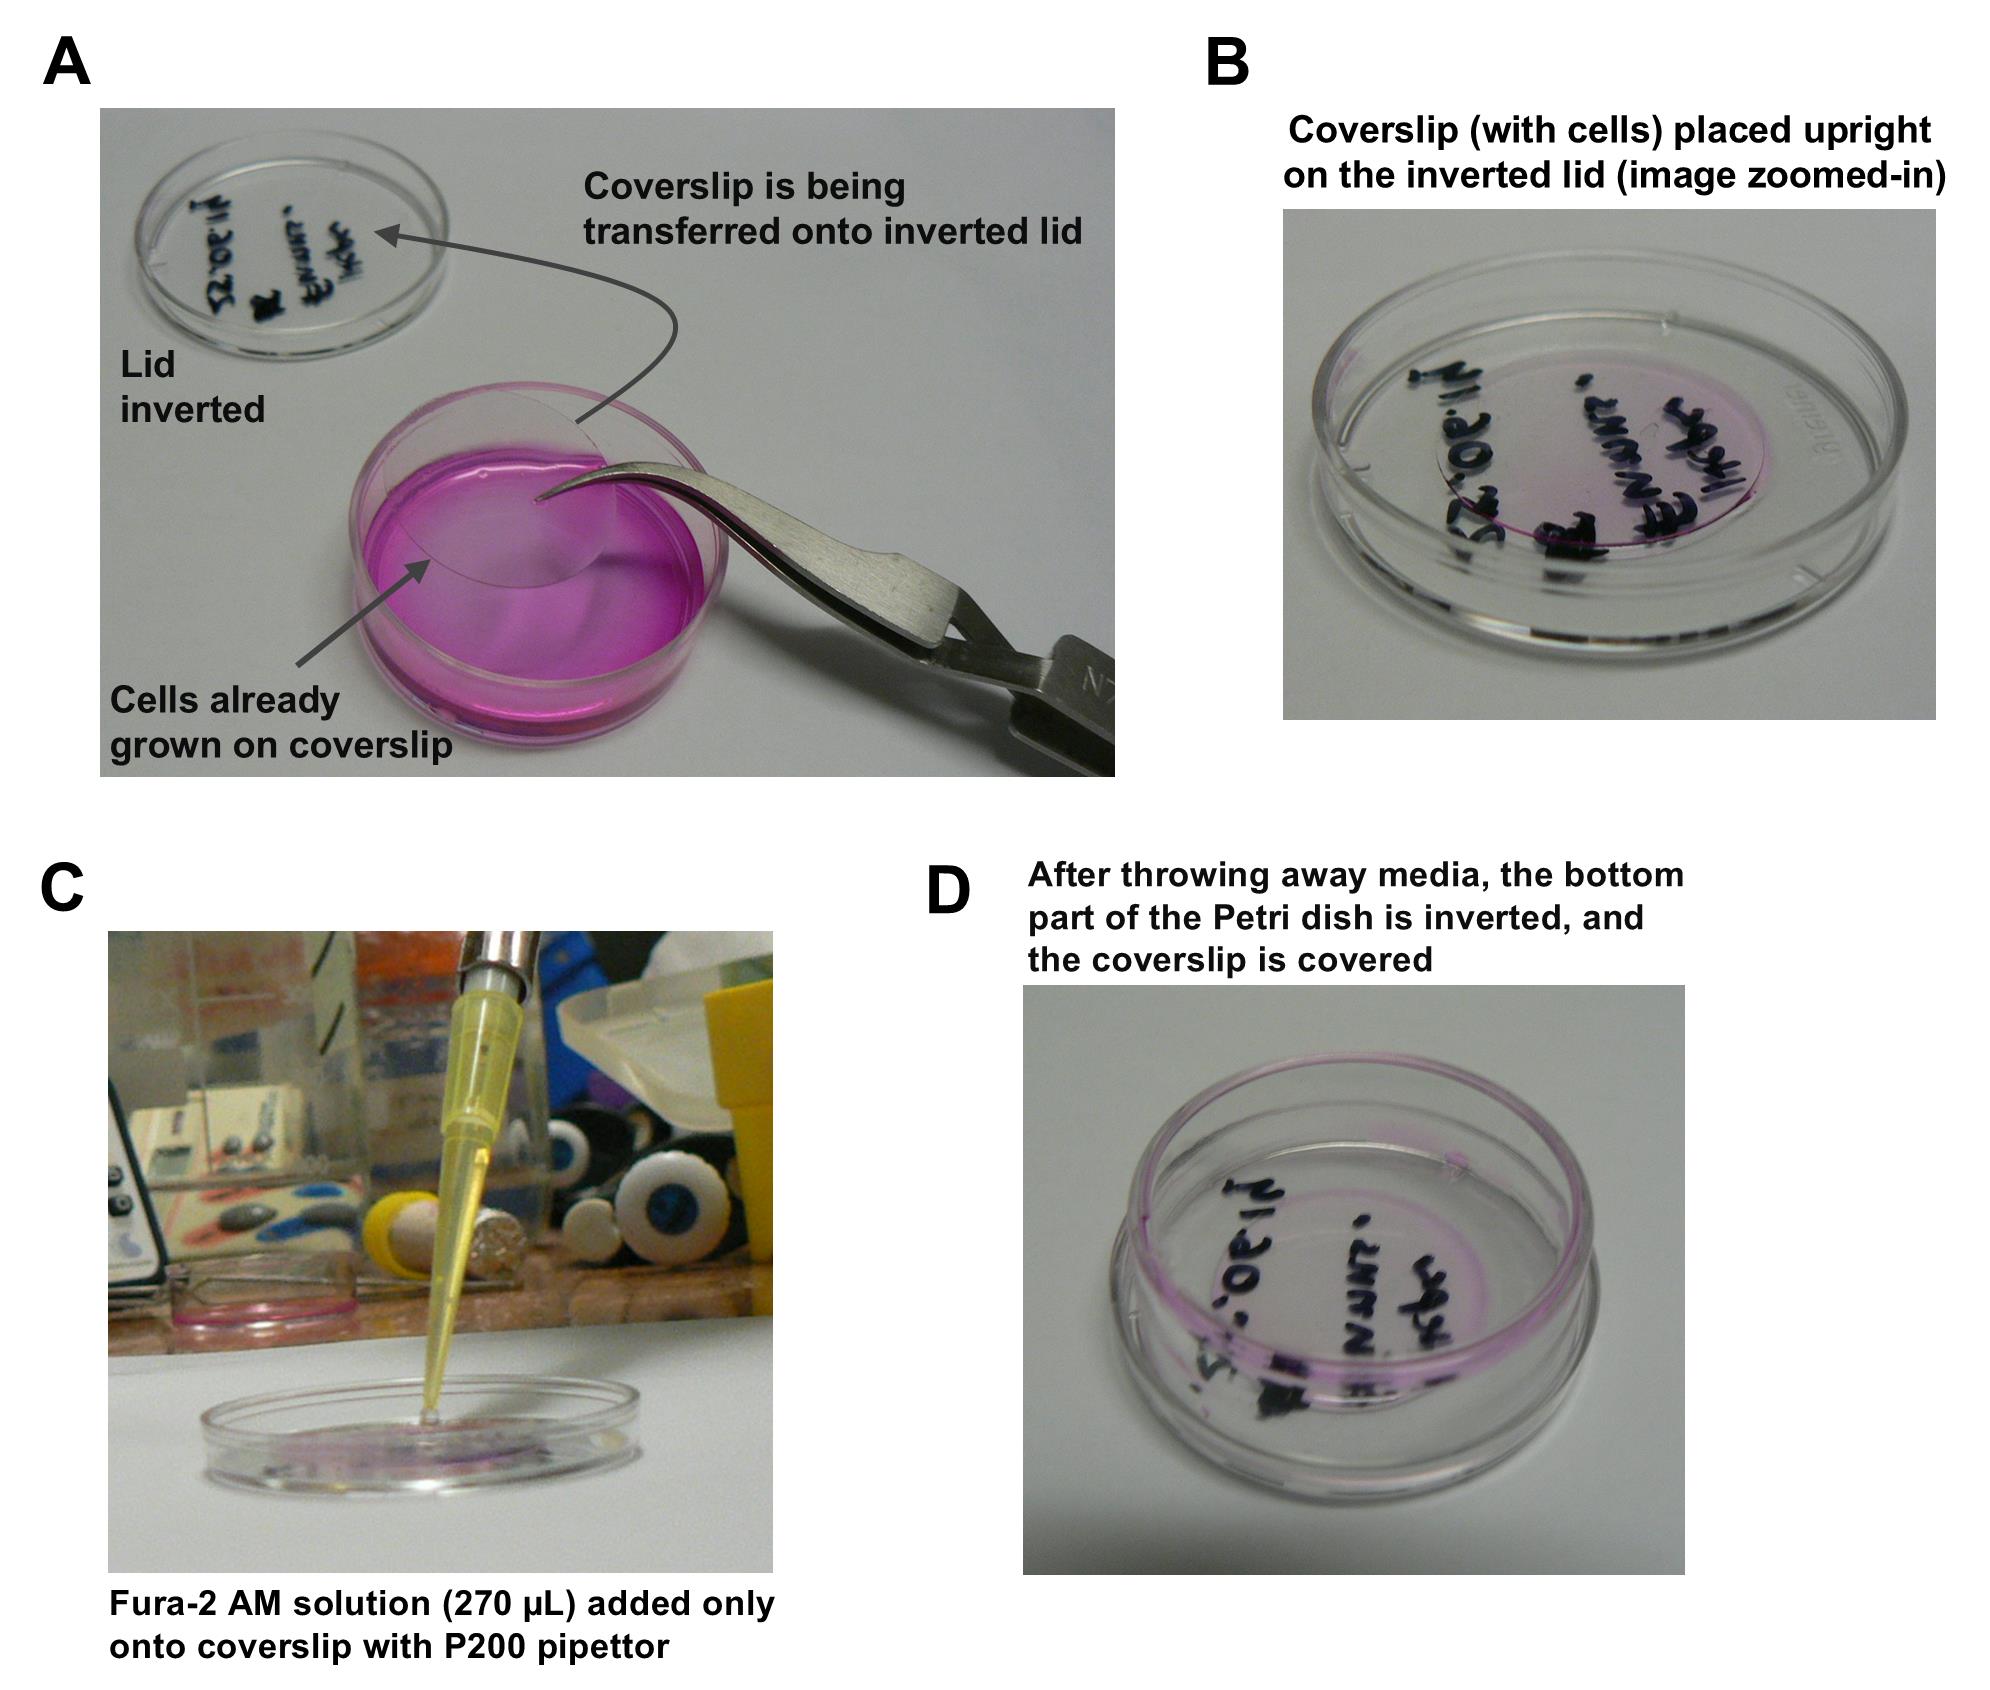
Figure 2. A cost-effective method for loading cells with Fura-2 for measurement of [Ca2+]cyt. (A) Cells are grown on a coverslip as described in section (B) above. A tweezer is used to take out the coverslip from a 35-mm diameter Petri dish. (B) Coverslip (with cells) placed upright on the inverted lid (zoomed-in image). (C) Fura-2-KRH solution (270 μL) is added carefully to the coverslip only (the solution should not overflow) with a P200 pipettor. (D) Medium is removed, the bottom part of the Petri dish is inverted, and the coverslip is covered to avoid contamination.
3. Loading/labeling of rat or mouse hepatocytes with Fura-2:
a. Follow the same procedure as mentioned above (step C2) for H4IIE cells, but instead of Fura-2-KRH incubation for 30 min at room temperature, this incubation period needs to be for 60 min at 37 °C in a 5% CO2 incubator.
b. After 60-min incubation with Fura2-KRH, wash the cells and coverslips with KRH twice, and incubate the cells with KRH for an additional 30 min at 37 °C in a 5% CO2 incubator. This is the Fura-2 AM de-esterification period.
c. After the de-esterification period, image the fluorescence emission of Fura-2 using the MetaFluor software.
D. Measurement of cytoplasmic Fura-2 fluorescence in liver cells
1. After completion of the loading and de-esterification of Fura-2 into cells, place coverslips with cells in an open working chamber (metal incubation chamber) containing 300 μL of KRH buffer (with or without Ca2+, as needed) for the measurement of the Fura-2 dye fluorescence (Figure 3A–D).
2. Measure fluorescence of the Ca2+-Fura-2 complex with a Nikon TE300 Eclipse inverted microscope using the MetaFluor software (Figure 3E, F).
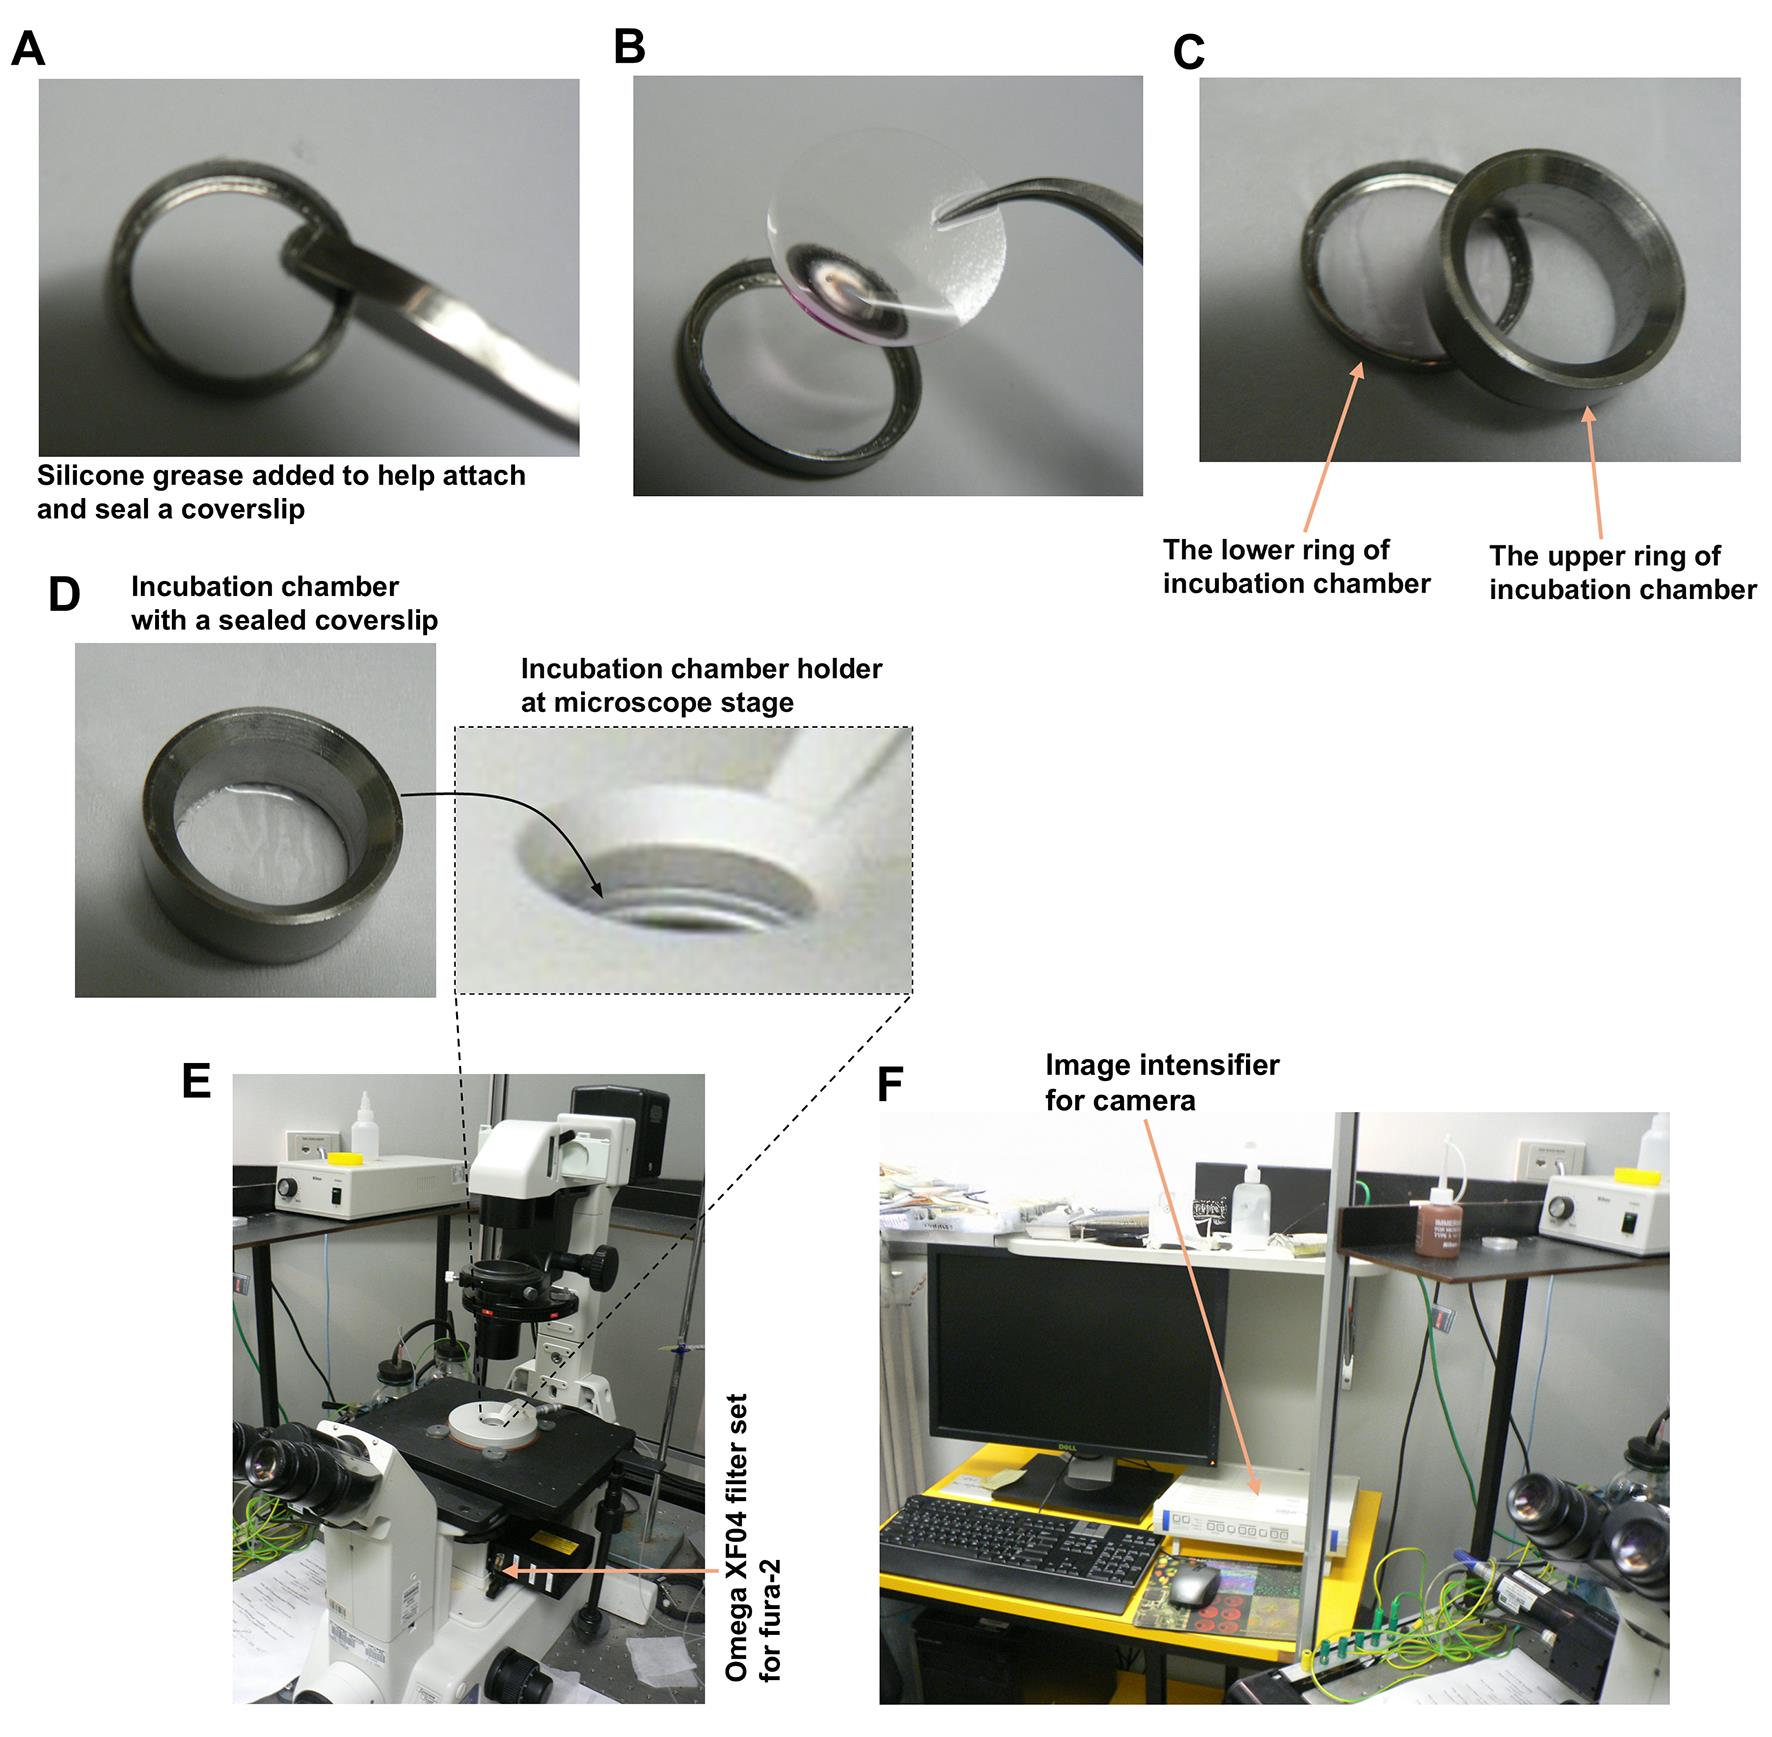
Figure 3. Nikon TE300 Eclipse microscope imaging system, including the incubation chamber. (A) Application of silicon grease onto the lower part/ring of the incubation chamber. (B) Handling of the coverslip for the proper mounting of the coverslip onto the lower ring. (C) Image showing the lower and upper ring(s) of the incubation chamber. (D) Incubation chamber after proper mounting. (E, F) Nikon TE300 Eclipse microscope, located at Flinders Medical Centre, used in these studies [10–12]. It operates in conjunction with the Sutter DG-4 wavelength switcher, Omega XF04 filter set for Fura-2, Photonic Science ISIS-3 ICCD camera, and MetaFluor software installed on a computer. A zoomed-in image of the holder of the incubation chamber is provided for clarification.
3. Follow the MetaFluor user’s guide for image acquisition and saving. During configuration of MetaFluor to save data, in the Experiment Control Panel, in the Status box, click on Log Data and Save Ratios. Click F4: Acquire. Key steps involved in managing the MetaFluor imaging software are summarized in Figure 4.
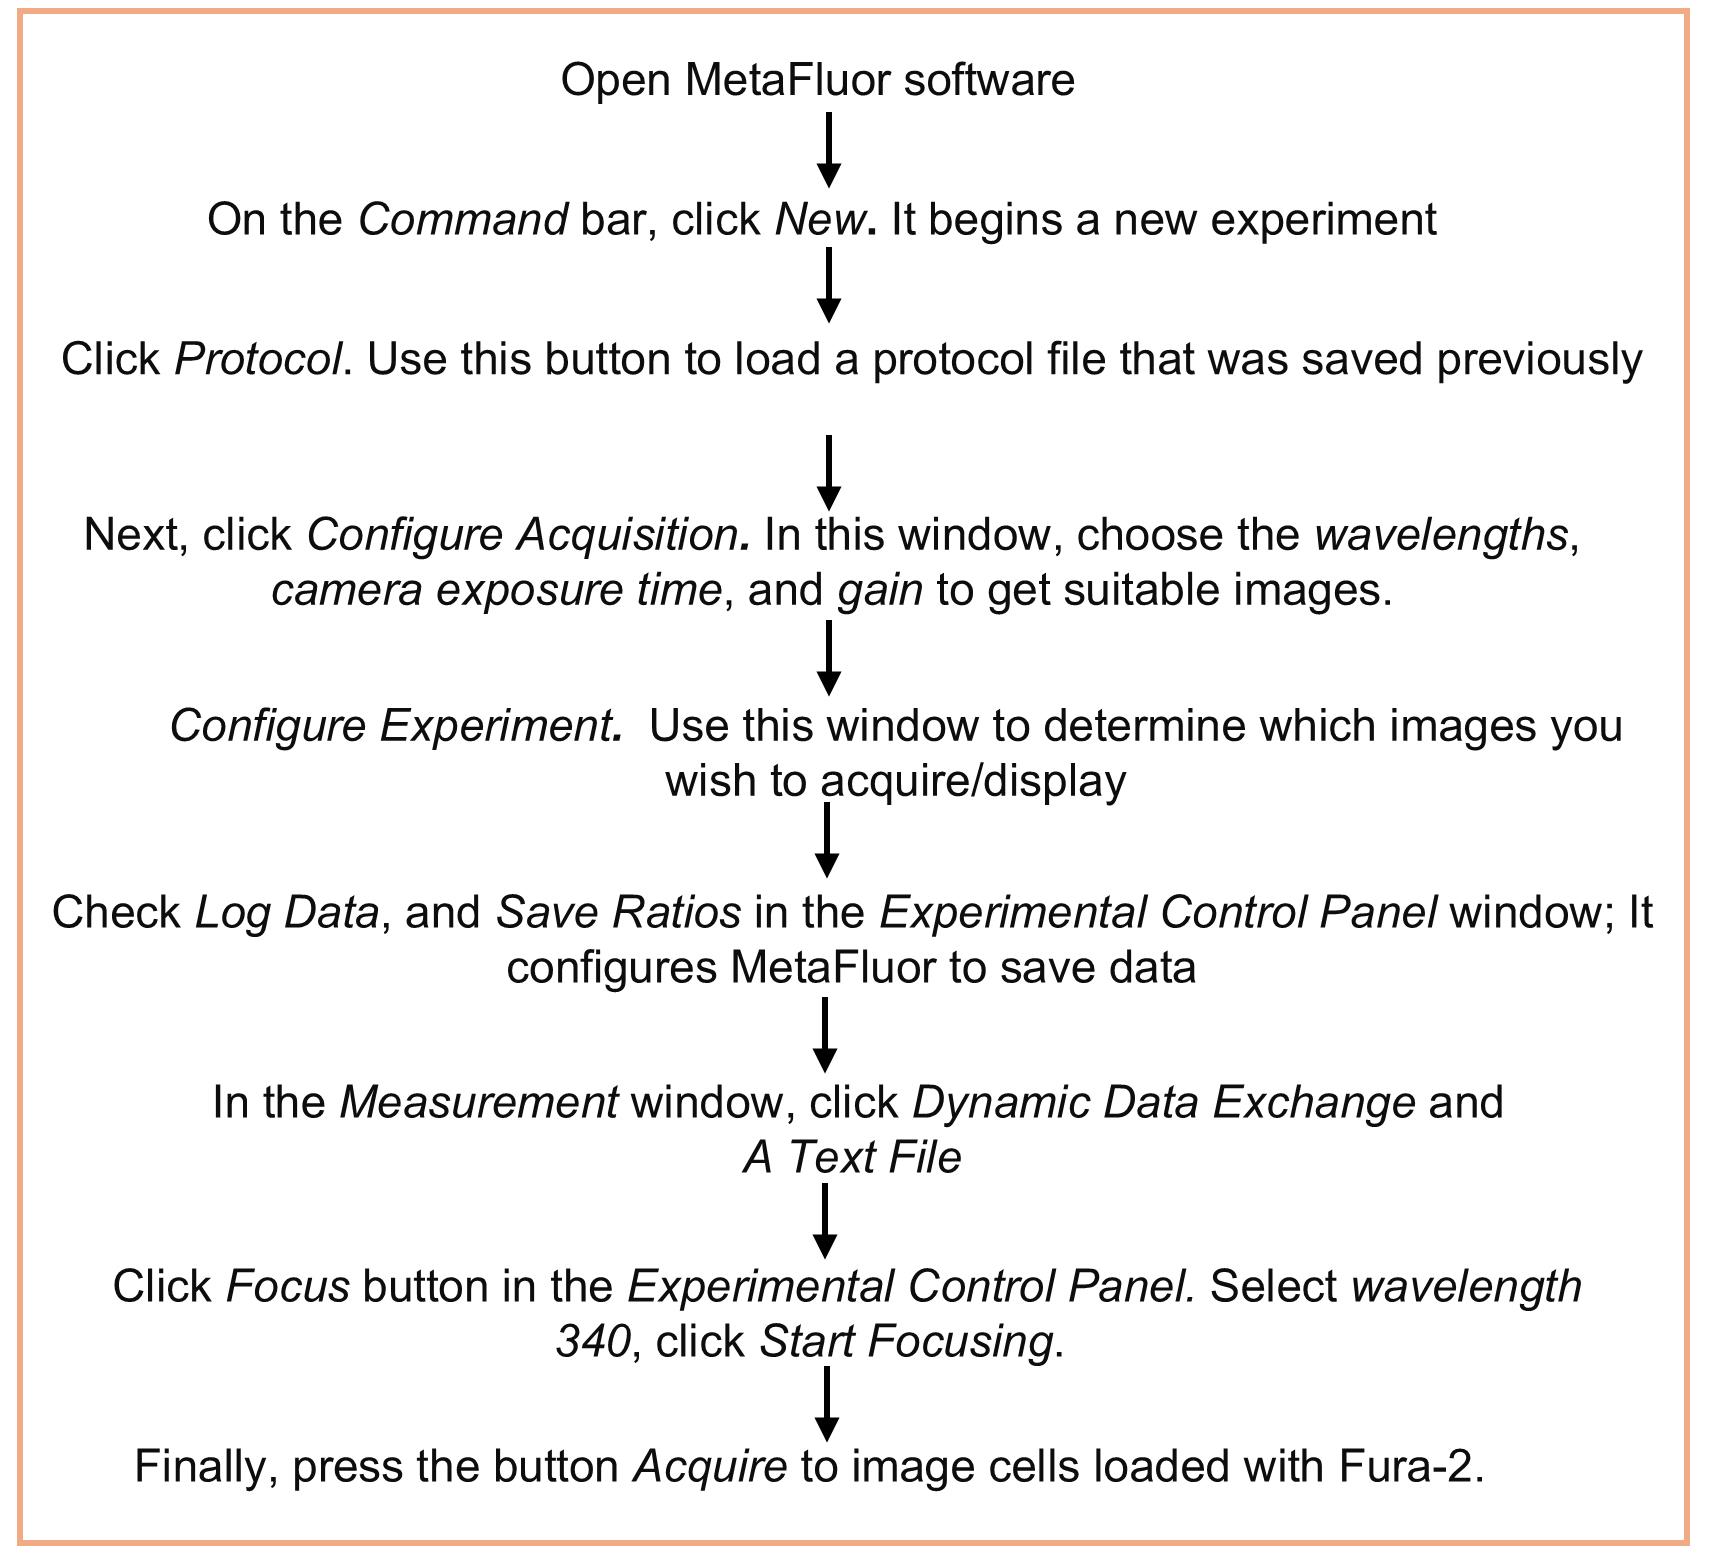
Figure 4. Key steps involved in the MetaFluor imaging software. For details on image acquisition and saving, readers are referred to the MetaFluor user’s guide.
4. Check/click under Log Measurements to Dynamic Data Exchange (DDE), and A Text File option when the Measurements window pops up. Acquire images every 10 s using a 40× objective.
Note: The microscope is connected to a Sutter Lambda DG-4 wavelength switcher (Sutter Instrument Company, Novato, CA, USA), and the temperature of the microscope stage is maintained at 37 °C with a temperature controller device (Warner Instruments, Hamden, CT, USA). A Photonic Science ISIS-3 ICCD camera (under appropriate settings of the intensifier and video gain for the CCD camera) is also controlled by a computer running this MetaFluor software. For Ca2+ measurement, fluorescence measurements are performed via ratiometric acquisition of Fura-2 fluorescence (excitation wavelengths of 340 and 380 nm) [5]. The fluorescence emission is measured at a wavelength of 510 nm.
5. Add experimental agents directly to the working chamber and mix three times by gently drawing the buffer+agents solution into the pipette tip (P200) and gently ejecting it back into the chamber.
Note: To acquire the fluorescence of Fura-2, regions of interest (ROI) in the cytoplasmic regions are selected. The background noise is, in each experiment, subtracted from each individual ROI by selecting and setting a reference ROI in a region where no cells are present. Cells with a fluorescence intensity below the saturation set point of the camera, as well as homogeneous fluorescence, are selected for the experiments. Cells with diffuse fluorescence need to be carefully excluded. In this way, normally, 10–15 out of 30 cells in a field or coverslip are chosen. The total fluorescence intensity within each ROI is analyzed with the MetaFluor software and stored as text files. Data points from a text file (.txt) are converted into an Excel spreadsheet. Using the data obtained, graphs can be generated with GraphPad Prism software. The results of the individual experiments are expressed as the mean ± SEM (between 10 and 15 cells for each experiment).
E. Calibration of Fura-2 signals and conversion of Fura-2 fluorescence ratio into the cytoplasmic Ca2+ concentration
Ratiometric indicators can be calibrated very precisely. Ratiometric chemical Ca2+ indicators are fluorescent dyes whose emission or excitation spectrum changes upon binding to calcium, allowing for quantitative measurements of the intracellular Ca2+ concentration. By following best practices in calibration, data acquisition, and analysis, researchers can confidently interpret calcium signals, uncovering the complex relationships between intracellular calcium dynamics and cellular function across a wide range of cell types and experimental conditions. Calibrating calcium imaging experiments with ionomycin ensures that fluorescent signals of Fura-2 translate to absolute intracellular calcium concentrations [Ca2+]. This is achieved by generating a calibration curve to define the minimum and maximum fluorescence states of the dye. The fluorescence emission excited by two separate wavelengths is measured, the background signal is subtracted, and the ratio between the intensity levels is used to calculate the free calcium concentration. The mathematical relationship between the measured ratio (R) of fluorescence intensity and the calcium ion concentration is expressed by the Grynkiewicz equation, as follows [9]:
[Ca2+]cyt = kd × (F380 unbound/F380 bound) × (R - Rmin)/(Rmax - R) (i)
Where kd is the binding affinity of Fura-2 to Ca2+, and where R is the fluorescence ratio at any given time.
To successfully use the formula in calibration-based analysis, researchers should follow a specific protocol (calibration experiment) to acquire those constants mentioned in the formula. The whole calibration process consists of several important steps (Figure 5A), as follows:
1. Establish baselines (Rmin and Rmax): Before analyzing live cells or samples, determine the boundaries of the dye's fluorescent response (ionomycin-EGTA assay).
2. Define the dissociation constant (kd): The dissociation constant represents the binding affinity of the Fura-2 indicator. While a general kd is typically provided by the manufacturer, calibration-based analyses often measure an in situ kd because intracellular conditions (e.g., viscosity, protein binding, and temperature) can alter the dye's binding behavior compared to a simple buffer solution.
3. Calculate F380unbound/F380bound: The ratio of the fluorescence intensity of the calcium-free dye to the calcium-bound dye, both measured at the 380 nm excitation wavelength, is occasionally called the proportionality factor. This parameter accounts for the fact that the dye does not fluoresce equally in its free and bound states at a given wavelength.
4. Apply to experimental data: Once all four calibration parameters are defined for the specific experimental conditions, users can map real-time changes in experimental fluorescence (R) into the formula to generate precise, quantifiable concentrations of free calcium.
In experimental conditions, in the presence of KRH buffer containing 5 mM extracellular Ca2+, Fura-2 loaded cells are exposed to the Ca2+ ionophore, ionomycin (10 μM), to obtain the equilibrium of cytoplasmic Ca2+ with extracellular Ca2+ [18] (see Figure 5B, C). The values of fluorescence intensity obtained at 380 nm excitation correspond to the Fura-2 emission fluorescence when totally bound to Ca2+ (F380 bound). After reaching the given plateau, 20 mM EGTA in 0.15 M Tris buffer (pH 8.7) is added to the incubation chamber (replacing the earlier KRH buffer with 5 mM CaCl2) and, in so doing, chelation of Ca2+ is performed [18]. The values of fluorescence intensity obtained at 380 nm denote Fura-2 emission fluorescence when free or unbound to Ca2+ (F380 unbound). Fura-2 displays a peak excitation shift from 380 to 340 nm when bound to Ca2+, enabling a ratiometric measurement of the intracellular Ca2+ concentration (Figure 5B, C).
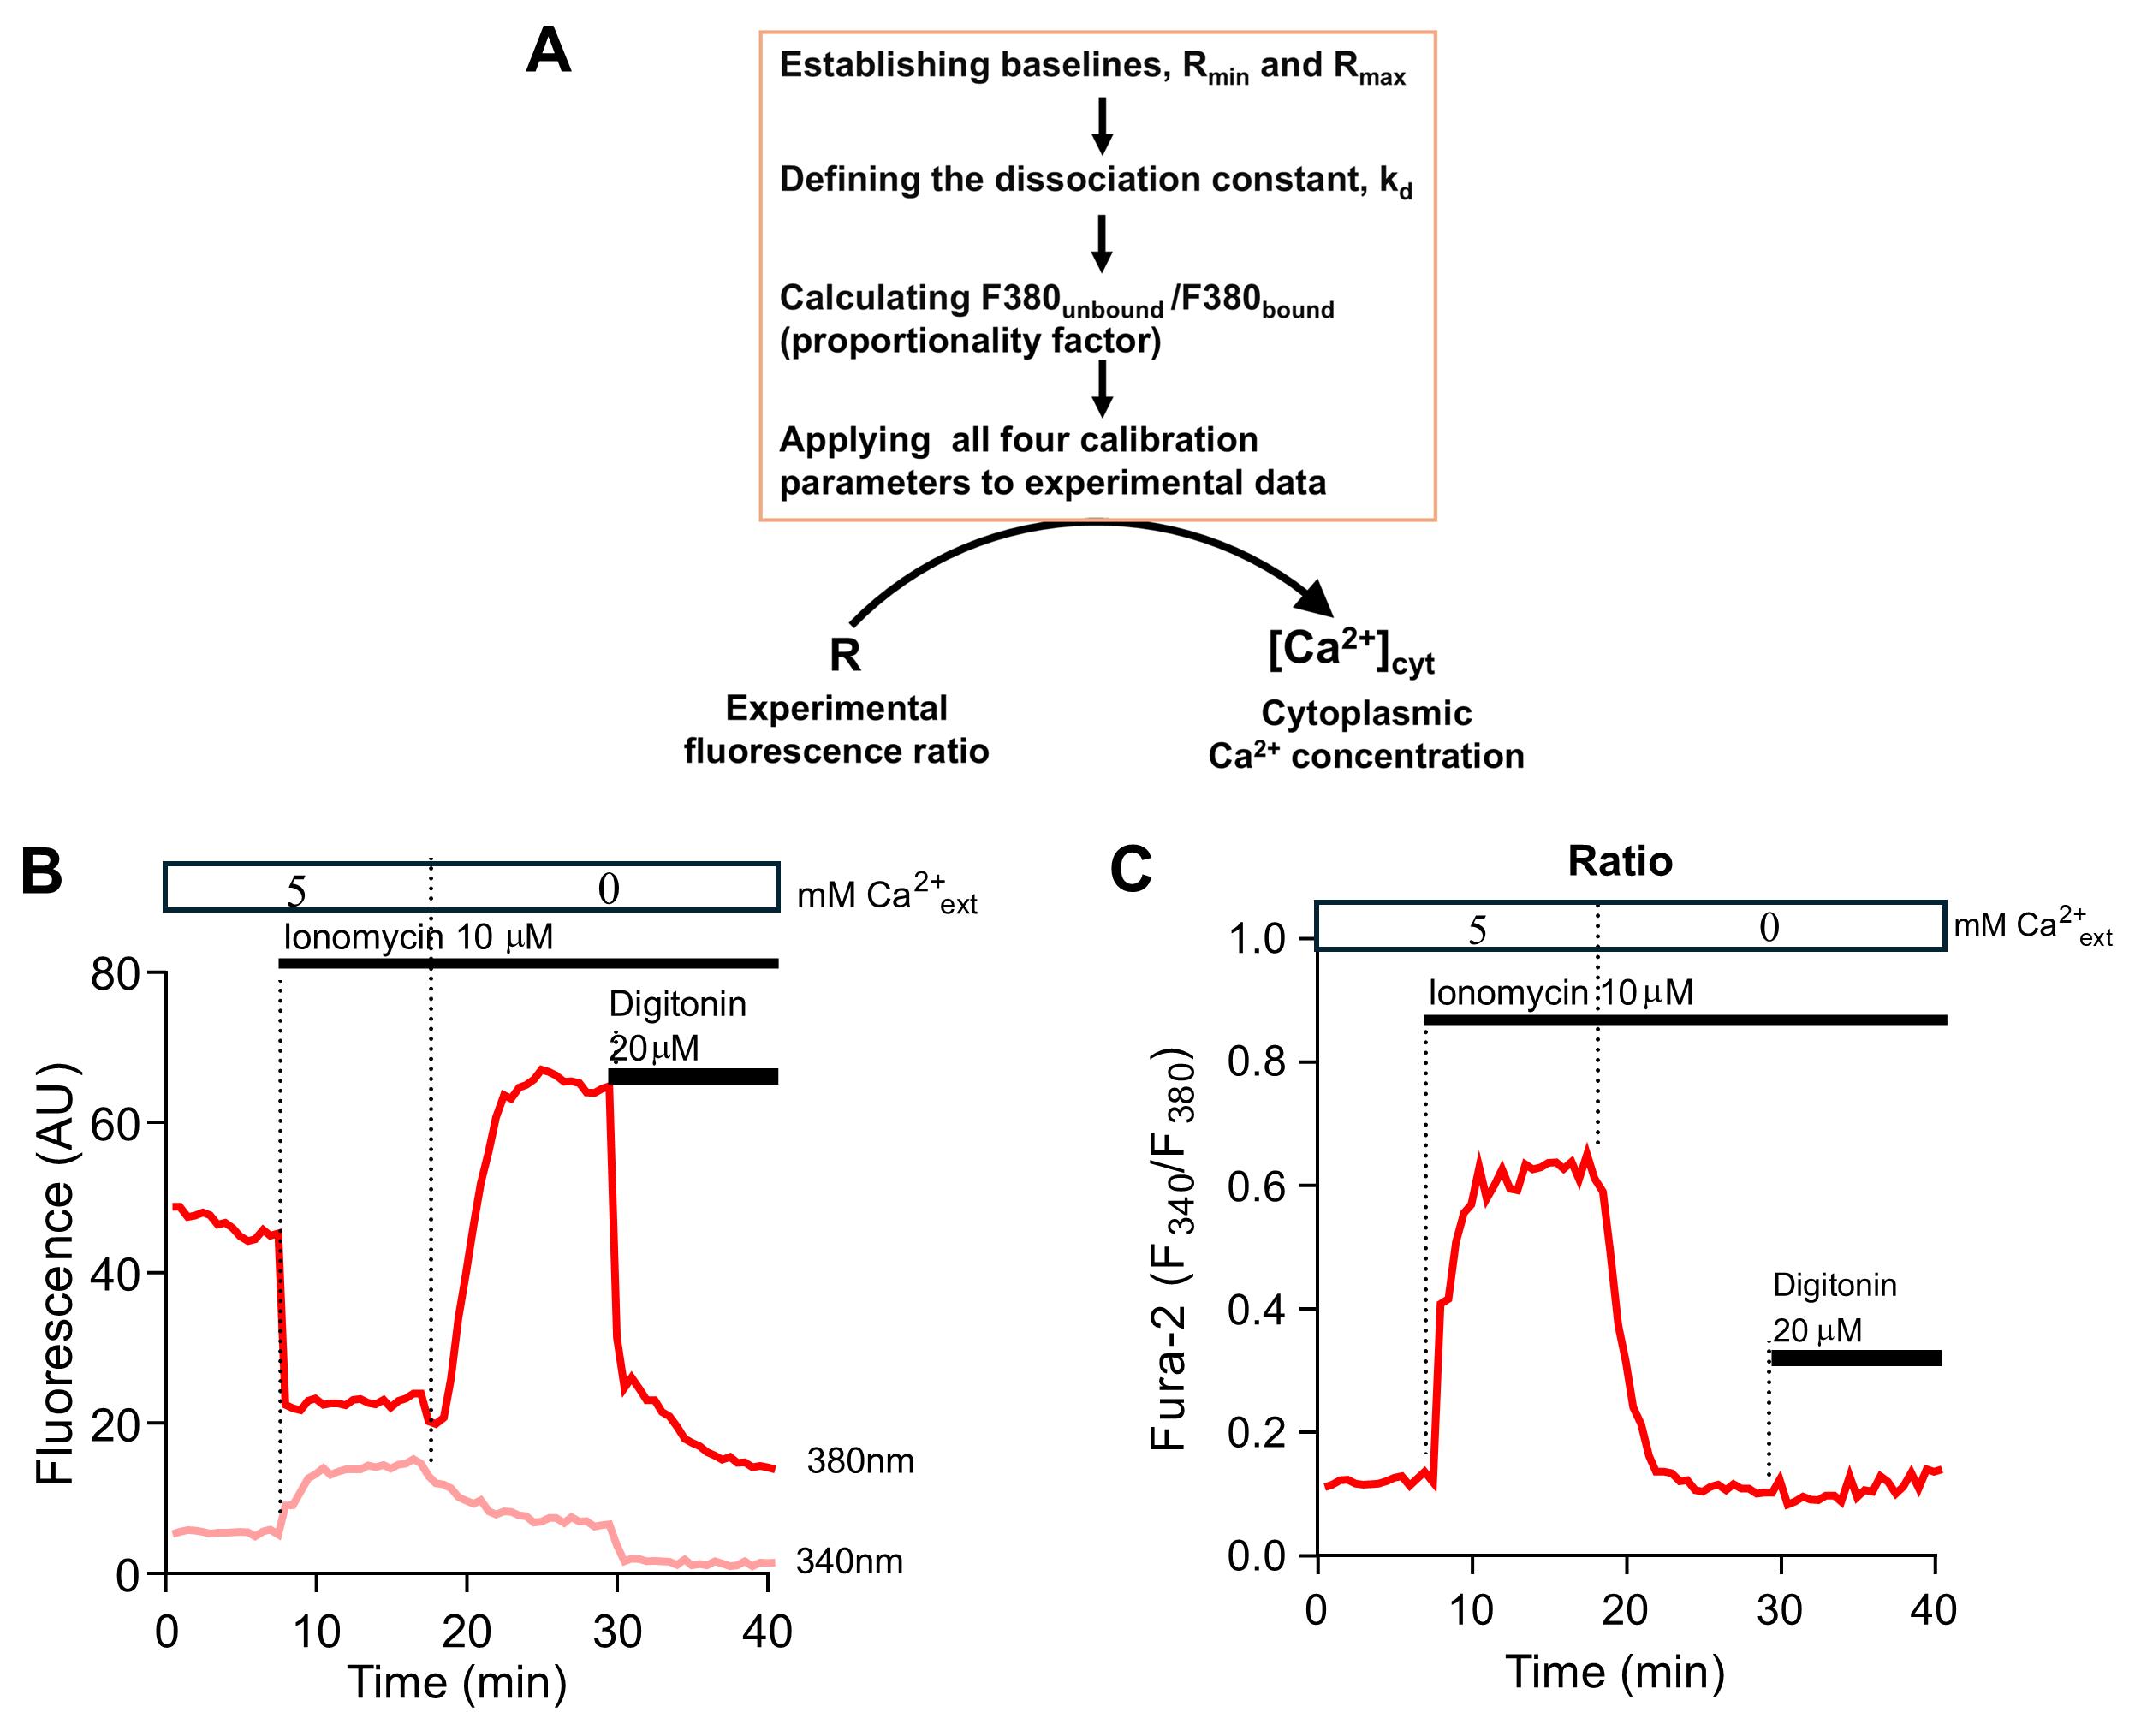
Figure 5. Workflow for the calibration of Fura-2 signals and ionomycin-EGTA assay to convert Fura-2 fluorescence to cytoplasmic Ca2+ concentration. (A) Calibration workflow. (B) Changes in fluorescence measured at 510 nm associated with Ca2+-bound (340 nm) and Ca2+-unbound (380 nm) Fura-2 after the addition of ionomycin. Ionomycin, a calcium ionophore, is a molecule that is able to insert it in the plasma membrane, creating holes (or pores) that will only allow the passage of calcium ions from the medium into the cytoplasmic space. Digitonin is a smooth biological detergent that disrupts the plasma membrane, leading all soluble cytosolic content to be washed out from the cell [18]. (C) Corresponding fluorescence ratio F340/F380 of the data displayed in panel B. Panels B and C have been modified from [18].
After the calibration assay, the ratio of 340/380 nm fluorescence is determined. The maximum ratio (Rmax) and minimum ratio (Rmin) are obtained after the addition of ionomycin and EGTA, respectively. The kd for binding of Fura-2 to Ca2+ is 224 nM [19]. The calibration for dual-wavelength (Fura-2) data is performed using the Ca2+ ionophore in our microscopy setup. The dissociation constant for the binding of Fura-2 to Ca2+ for our experimental setup was obtained from several established studies [7,9,19]. Considering that the buffer pH is 7.05 at 37 °C, Grynkiewicz et al. (1985) determined the kd value to be 224 nM for Fura-2 [9]. In our experimental procedure, the associated buffer (KRH) is adjusted to 7.4 and, during the experiment, the temperature of the buffer is kept at 37 °C in the incubation chamber (with the help of an appropriate temperature controller). Furthermore, numerous groups have used kd = 224 nM (Fura-2) for primary hepatocytes and liver cell lines [7,20]. Using the equation above (i) and the given values where needed, Fura-2 fluorescence is converted to cytoplasmic Ca2+ concentration ([Ca2+]cyt).
F. Quantification of Ca2+ release from the ER and the initial rate of Ca2+ entry across the plasma membrane
To measure the amount of the agonist-induced Ca2+ release from intracellular or ER stores and Ca2+ entry across the plasma membrane, a so-called Ca2+-add back protocol can be used. For instance, 2,5-di-tert-butylhydroquinone (DBHQ)-induced Ca2+-add back protocol (illustrated in Figure 6) can be employed. In this experimental protocol, in the absence of extracellular Ca2+ (Ca2+ext), a specific Ca2+ release inducer, in this case DBHQ [7,21], is added to induce Ca2+ release from ER stores. Extracellular Ca2+ is added back to the incubation chamber/bath after the [Ca2+]cyt returns to the basal levels, creating a second increase in the [Ca2+]cyt until a new plateau is established. This second increase in [Ca2+]cyt is due to store-operated Ca2+ entry via store-operated Ca2+ channels (SOCs) across the plasma membrane.
Figure 6 shows a representative plot of Ca2+cyt as a function of time for cells incubated in the absence of Ca2+ext, and subsequent addition of DBHQ and Ca2+ext. The plot shows means ± SEM (n = 10–15 cells) for one representative experiment. The frequency of image acquisition is every 10 s. The quantity of Ca2+ released is estimated by measuring the height of the peak of the agonist-induced increase in [Ca2+]cyt. The SLOPE function of MS Excel is used to determine the initial rate of Ca2+ entry. The rate of Ca2+ entry can be estimated by calculating the slope of a line drawn through the initial linear part of the influx curve (see Figure 6). Calculating the difference between the maximum [Ca2+]cyt observed after Ca2+ext addition and the [Ca2+]cyt obtained immediately before Ca2+ext addition leads to the values of the peak of Ca2+ entry observed after Ca2+ext addition, as shown in Figure 6. For each experimental condition, Fura-2 imaging is performed on a total of 5–10 coverslips on 3–5 separate days (3–5 independent experiments).
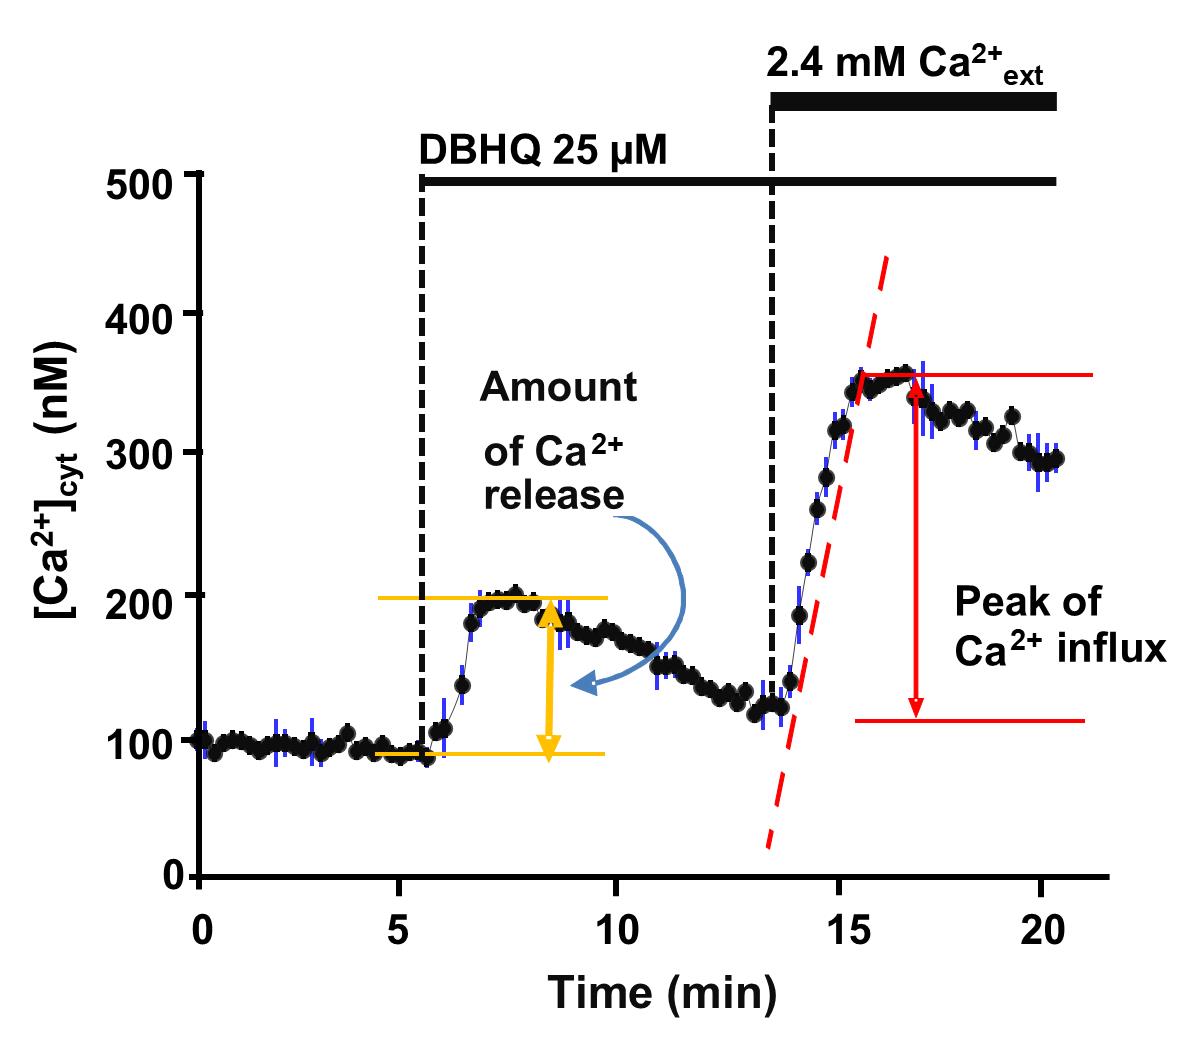
Figure 6. Quantitation of the amount of Ca2+ released from the ER and Ca2+ entry through store-operated calcium channels (SOCs) with the Ca2+-add back protocol. A representative trace (averaged for 15 cells on a coverslip) is presented, showing the alterations in [Ca2+]cyt resulting from the release of Ca2+ by DBHQ in the absence of Ca2+ext, from ER stores, and Ca2+ entry (through SOCs) by Ca2+ re-addition into the working solution in the incubation chamber. Error bars were calculated from the standard error of the mean of [Ca2+]cyt of 10–15 cells on a coverslip. Yellow lines indicate the basal (cytosolic) free calcium concentration and the maximum [Ca2+]cyt after DBHQ addition, whereas red lines represent the minimum and maximum level of Ca2+ influx after extracellular Ca2+ (Ca2+ext) addition. The yellow and red arrow bars represent the height of the peak of DBHQ-induced increase in [Ca2+]cyt and the height of the peak of Ca2+ influx, respectively. The figure has been adapted from [12].
G. Data analysis and presentation
1. Data analysis in the MetaFluor program (one coverslip):
a. Measure 340 and 380 nm wavelength as a function of time for one coverslip.
b. Identify approximately 10–15 cells, which will become a region of interest. To define a region of interest (ROI) via the MetaFluor software, follow these steps:
i. Select 10–15 cells with intermediate brightness.
Note: Selected cells should have similar brightness or intensities. Cells should be individual (not overlapping with other cells).
ii. Select a ROI within the cell boundaries (selected diameter should be 90% of the cell diameter).
iii. Exclude images of the corresponding damaged cells.
iv. Very carefully check the cell images on the computer screen to exclude damaged cells. Damaged cells look unusually diffused; they do not have solid and nice brightness. Figure 7 demonstrates a representative image of example cells for ROI selection.
c. Obtain data for the ratio and 340 and 380 fluorescence values over time for each cell.
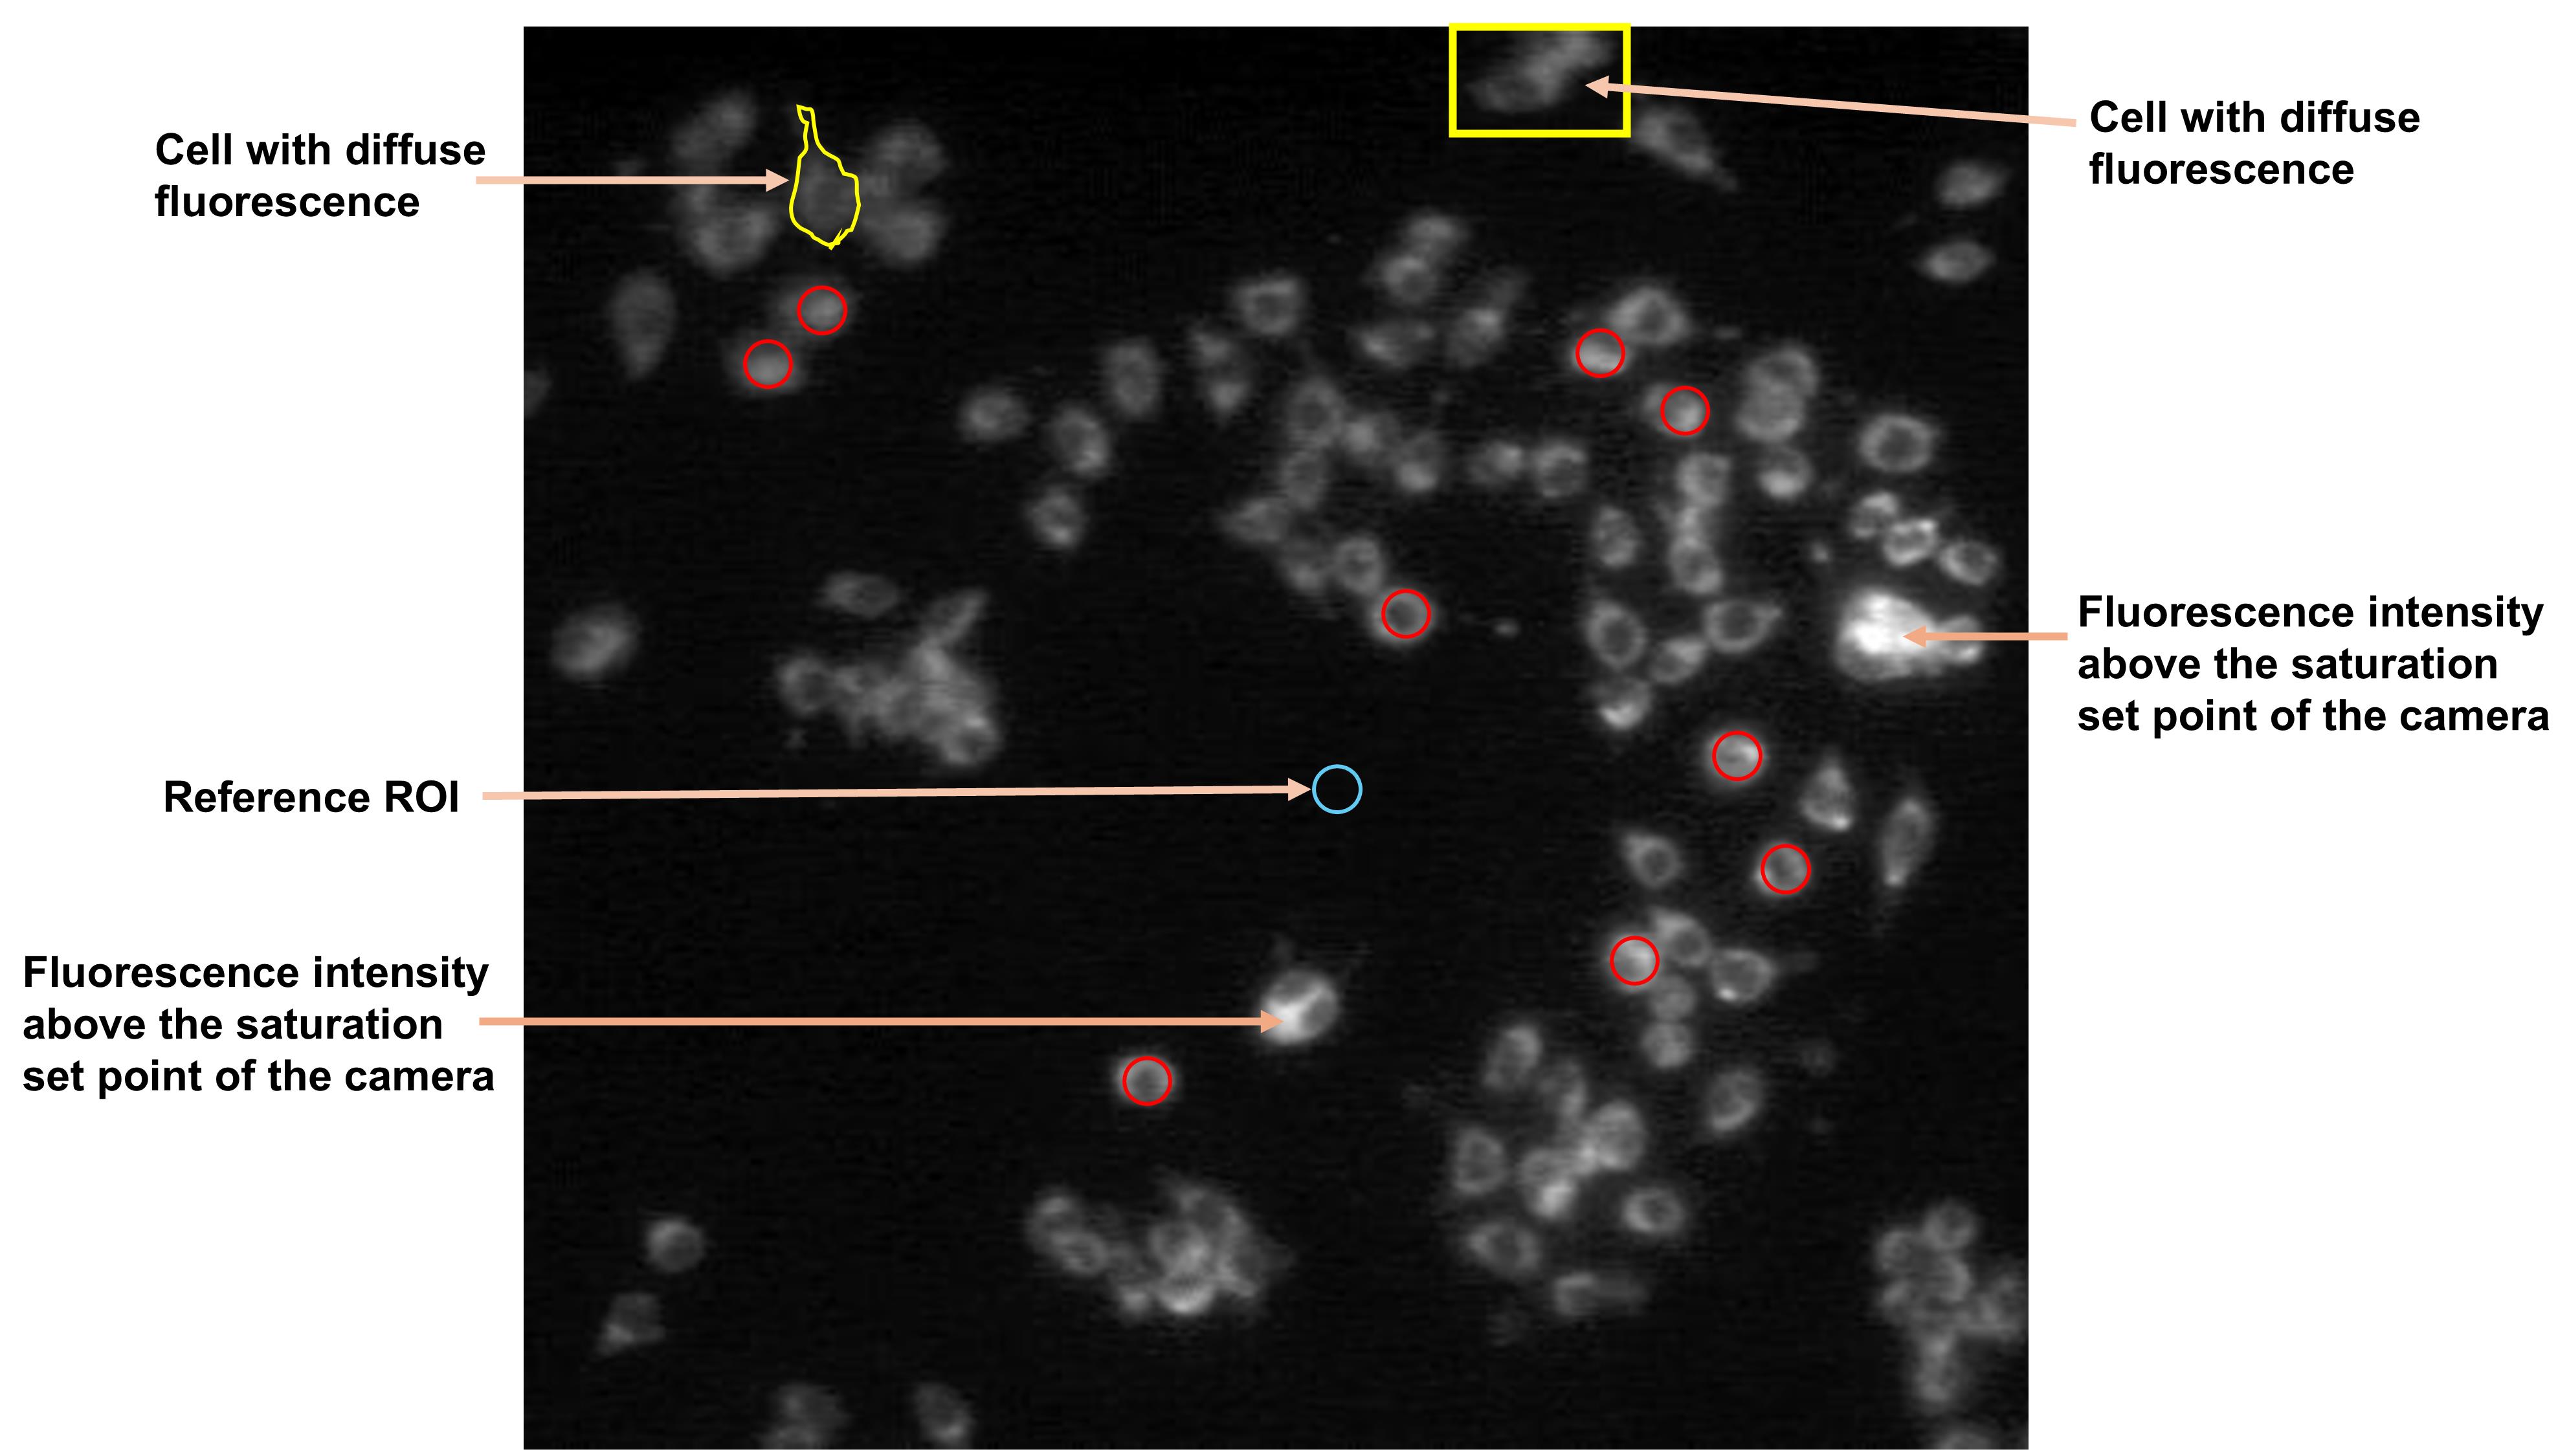
Figure 7. Representative image showing example cells for ROI selection. A reference ROI (cyan colored) is selected in a region where no cells are present. Cells circled in red are chosen on this coverslip/field as regions of interest (ROI) to acquire the fluorescence of Fura-2. Cells with fluorescence intensity above the saturation set point of the camera, as well as non-homogeneous fluorescence, are not selected for the experiments. The cells with diffuse fluorescence (yellow lines) are also excluded.
2. Determination of the mean value for the ratio over time for cells on one coverslip:
a. Import data (for the 10–15 cells) into Excel from a MetaFluor-saved text file (saved during image acquisition).
Note: This enables plots of the ratio as a function of time for each cell to be created in Excel if needed.
b. Use Excel to determine the mean value for the ratio as a function of time for the 10–15 cells.
c. Plot the mean value for the ratio in Excel as a function of time.
3. Conversion of the ratio to cytoplasmic free calcium concentrations:
a. For data for one coverslip (10–15 cells), use Rmax and Rmin, Fmax and Fmin, and the conversion equation to convert the ratio to cytoplasmic free calcium concentration in Excel.
b. Then, generate a plot of Ca2+cyt as a function of time, which will be one line: the mean for the 10–15 cells from the one coverslip. As an example, Figure 6 shows a representative plot of Ca2+cyt as a function of time for cells incubated in the absence of Ca2+ext, and subsequent addition of DBHQ and Ca2+ext. The graph shows the mean ± SEM (n = 10–15 cells) for one representative experiment. The quantity of Ca2+ released is estimated by measuring the height of the peak of the agonist-induced increase in [Ca2+]cyt. The SLOPE function of MS Excel was used to determine the initial rate of Ca2+ entry. The rate of Ca2+ entry can be estimated by calculating the slope of a line drawn through the initial linear part of the influx curve (see Figure 6). Calculating the difference between the maximum [Ca2+]cyt observed after Ca2+ext addition and the value of [Ca2+]cyt obtained immediately before Ca2+ext addition leads to the values of peak Ca2+ entry observed after Ca2+ext addition, as shown in Figure 6.
Note: The values of Rmax, Rmin, F380 unbound, and F380 bound used for this are obtained from independent experiments (calibration) in which Rmax and Rmin and F380 unbound and F380 bound are calculated.
4. Analysis of three or more independent experiments:
a. Conduct experiments with three or more coverslips of cells as in step G1a above and acquire data in MetaFluor.
b. Obtain the mean of the 10–15 cells on each coverslip and Ca2+cyt as a function of time as in step G3 above.
c. Use Excel to determine the mean and SEM of the three or more separate coverslips.
5. Data presentation:
a. Data can be presented as the mean and SEM of 10–15 cells from one coverslip, as in step G3 above.
As mentioned above, for each experimental condition, Fura-2 imaging is performed on a total of 5–10 coverslips on 3–5 separate days (3–5 independent experiments). The data points are plotted using GraphPad Prism. The average baseline and average peak amplitude can be plotted as a scatter bar graph (see [12]). For comparisons between two groups, use a Student’s T-test to determine statistical significance. Use one-way ANOVA with multiple comparisons if there are more than two test groups to compare.
Validation of protocol
This protocol (or parts of it) has been used and validated in the following research article:
• Ali et al. [10]. Impaired Ca2+ signaling due to hepatic steatosis mediates hepatic insulin resistance in Alström syndrome mice that is reversed by GLP-1 analog treatment. American Journal of Physiology-Cell Physiology. (Figure 3B–C, F–H).
This protocol is an optimized version of our previous Ca2+ imaging protocol, which was used and validated in the following research articles:
• Wilson et al. [11]. Steatosis inhibits liver cell store-operated Ca2+ entry and reduces ER Ca2+ through a protein kinase C-dependent mechanism. Biochemical Journal. (Figure 1B–D; Figure 2B–D).
• Ali et al. [12]. The glucagon-like peptide-1 analogue exendin-4 reverses impaired intracellular Ca2+ signalling in steatotic hepatocytes. Biochim Biophys Acta-Molecular Cell Research. (Figure 1A–D; Figure 2A–H).
General notes and troubleshooting
General notes
Conduct imaging experiments in the dark to preserve dye integrity.
Troubleshooting
Problem 1: Poor Fura-2 AM dye loading.
Possible causes: Dye degradation, insufficient cell permeability, or incorrect incubation conditions.
Solutions: To improve loading, ensure cells are healthy and well adhered. Use freshly prepared KRH buffer. Check that the incubation temperature is properly maintained.
Problem 2: High background fluorescence.
Possible causes: Out-of-focus light or excessive indicator expression (dye loading).
Solution: If fluorescence is weak, check the accuracy of the dye concentration and check for light exposure during preparation.
Problem 3: Inconsistent calcium signals.
Possible cause: An uneven signal may result from cell detachment.
Solution: Optimize re-plating density and washing technique.
Acknowledgments
Conceptualization, E.S.A.; Investigation, E.S.A.; Writing—Original Draft, L.F., A.G.K.H., E.S.A.; Writing—Review & Editing, L.F., A.G.K.H., M.H., A.B., E.S.A.; Funding acquisition (in part), E.S.A.; Supervision, E.S.A. The corresponding author thanks Dr. Greg Barritt and the Microscopy Core at Flinders Medical Centre for training and use of the Nikon TE300 Eclipse Microscope. This work was partly funded by Mylexa Pty Ltd. and Endeavor Fellowship to E.S.A. Part of the graphical abstract was created with Biorender.com. This protocol describes techniques used in [10] but is largely applicable to live cell imaging of intracellular calcium signals using chemical probes in various cell types.
Competing interests
The authors declare no conflicts of interest.
Ethical considerations
The experimental protocols for animals were conducted according to the criteria outlined in the “Australian Code of Practice for the Care and Use of Animals for Scientific Purposes” (National Health and Medical Research Council of Australia). The study [10] was approved by the Animal Ethics Committee of Flinders University under the Approval No. 671/08.
References
- Ali, E. S. and Petrovsky, N. (2019). Calcium Signaling As a Therapeutic Target for Liver Steatosis. Trends Endocrin Met. 30(4): 270–281. https://doi.org/10.1016/j.tem.2019.02.005
- Clapham, D. E. (2007). Calcium Signaling. Cell. 131(6): 1047–1058. https://doi.org/https://doi.org/10.1016/j.cell.2007.11.028
- Heaney, R. P. (2011). Chapter 34: Vitamin D: Role in the Calcium and Phosphorus Economies. Feldman, D., Pike, J. W. and Adams, J. S. (Eds.) Vitamin D (Third Edition). Academic Press, 607–624.
- Thomas, D., Tovey, S. C., Collins, T. J., Bootman, M. D., Berridge, M. J. and Lipp, P. (2000). A comparison of fluorescent Ca2+ indicator properties and their use in measuring elementary and global Ca2+ signals. Cell Calcium. 28(4): 213–223. https://doi.org/10.1054/ceca.2000.0152
- Bootman, M. D., Rietdorf, K., Collins, T., Walker, S. and Sanderson, M. (2013). Ca2+-sensitive fluorescent dyes and intracellular Ca2+ imaging. Cold Spring Harb Protoc. 2013(2): 83–99. https://doi.org/10.1101/pdb.top066050
- Ghosh, S., Dahiya, M., Kumar, A., Bheri, M. and Pandey, G. K. (2023). Calcium imaging: a technique to monitor calcium dynamics in biological systems. Physiol Mol Biol Plants. 29(12): 1777–1811. https://doi.org/10.1007/s12298-023-01405-6
- Castro, J., Aromataris, E. C., Rychkov, G. Y. and Barritt, G. J. (2009). A small component of the endoplasmic reticulum is required for store-operated Ca2+ channel activation in liver cells: evidence from studies using TRPV1 and taurodeoxycholic acid. Biochem J. 418(3): 553–566. https://doi.org/10.1042/bj20081052
- Takahashi, A., Camacho, P., Lechleiter, J. D. and Herman, B. (1999). Measurement of intracellular calcium. Physiol Rev. 79(4): 1089–1125. https://doi.org/10.1152/physrev.1999.79.4.1089
- Grynkiewicz, G., Poenie, M. and Tsien, R. Y. (1985). A new generation of Ca2+ indicators with greatly improved fluorescence properties. J Biol Chem. 260(6): 3440–3450. https://doi.org/10.1016/s0021-9258(19)83641-4
- Ali, E. S., Girard, D. and Petrovsky, N. (2021). Impaired Ca2+ signaling due to hepatic steatosis mediates hepatic insulin resistance in Alström syndrome mice that is reversed by GLP-1 analog treatment. Am J Physiol Cell Physiol. 321(1): C187–C198. https://doi.org/10.1152/ajpcell.00020.2021
- Wilson, C. H., Ali, E. S., Scrimgeour, N., Martin, A. M., Hua, J., Tallis, G. A., Rychkov, G. Y. and Barritt, G. J. (2015). Steatosis inhibits liver cell store-operated Ca2+ entry and reduces ER Ca2+ through a protein kinase C-dependent mechanism. Biochem J. 466(2): 379–390. https://doi.org/10.1042/bj20140881
- Ali, E. S., Hua, J., Wilson, C. H., Tallis, G. A., Zhou, F. H., Rychkov, G. Y. and Barritt, G. J. (2016). The glucagon-like peptide-1 analogue exendin-4 reverses impaired intracellular Ca2+ signalling in steatotic hepatocytes. Biochim Biophys Acta. 1863(9): 2135–2146. https://doi.org/10.1016/j.bbamcr.2016.05.006
- Guillouzo, A., Morel, F., Ratanasavanh, D., Chesne, C. and Guguen-Guillouzo, C. (1990). Long-term culture of functional hepatocytes. Toxicol In Vitro. 4(4–5): 415–427. https://doi.org/10.1016/0887-2333(90)90092-8
- Uehara, M. K., Bual, R., Shafiq, M., Yoshida, K. and Ijima, H. (2025). Proposal for a non-adhesive single-cell culture technology for primary hepatocytes. Cytotechnology. 77(1): 30. https://doi.org/10.1007/s10616-024-00696-1
- Cras, J., Rowe-Taitt, C., Nivens, D. and Ligler, F. (1999). Comparison of chemical cleaning methods of glass in preparation for silanization. Biosens Bioelectron. 14: 683–688. https://doi.org/10.1016/s0956-5663(99)00043-3
- Berry, M. N., Barritt, G. J. and Edwards, A. M. (1991). Isolated hepatocytes: preparation, properties and applications: preparation, properties and applications. Elsevier. ISBN: 0080858902.
- Sutachan, J. J., Montoya, G. J., Xu, F., Chen, D., Blanck, T. J. and Recio-Pinto, E. (2006). Pluronic F-127 affects the regulation of cytoplasmic Ca2+ in neuronal cells. Brain Res. 1068(1): 131–137. https://doi.org/10.1016/j.brainres.2005.11.003
- Castro, J. (2008). Store operated Ca2+ channels in liver cells: regulation by bile acids and a sub-region of the endoplasmic reticulum. PhD Dissertation from the Department of Medical Biochemistry, Flinders University School of Medicine.
- Conn, P. M. (2012). Imaging and spectroscopic analysis of living cells: live cell imaging of cellular elements and functions. Elsevier Science. ISBN: 9780123919076.
- Malhi, H., Irani, A. N., Rajvanshi, P., Suadicani, S. O., Spray, D. C., McDonald, T. V. and Gupta, S. (2000). KATP Channels Regulate Mitogenically Induced Proliferation in Primary Rat Hepatocytes and Human Liver Cell Lines: IMPLICATIONS FOR LIVER GROWTH CONTROL AND POTENTIAL THERAPEUTIC TARGETING *. J Biol Chem. 275(34): 26050–26057. https://doi.org/10.1074/jbc.M001576200
- Parekh, A. B., Fleig, A. and Penner, R. (1997). The Store-Operated Calcium Current ICRAC: Nonlinear Activation by InsP3 and Dissociation from Calcium Release. Cell. 89(6): 973–980. https://doi.org/10.1016/s0092-8674(00)80282-2
Article Information
Publication history
Received: May 15, 2026
Accepted: Jul 5, 2026
Available online: Jul 22, 2026
Published: Aug 20, 2026
Copyright
© 2026 The Author(s); This is an open access article under the CC BY-NC license (https://creativecommons.org/licenses/by-nc/4.0/).
How to cite
Fang, L., Habib, A. G. K., Harris, M. D., Begley, A. J. and Ali, E. S. (2026). Calcium Imaging in H4IIE Liver Cells and Primary Rodent Hepatocytes: A Cost-Effective Protocol for Use With Fura-2 AM Ca2+ Indicator. Bio-protocol 16(16): e5783. DOI: 10.21769/BioProtoc.5783.

 Download Citation in RIS Format
Category
Cell Biology > Cell-based analysis > Ca2+ homeostasis
Cell Biology > Cell imaging > Live-cell imaging
Cell Biology > Cell imaging > Fluorescence
Do you have any questions about this protocol?
Post your question to gather feedback from the community. We will also invite the authors of this article to respond.
 Post a Question


