


- Protocols

- Articles and Issues
- For Authors
- About
- Become a Reviewer


Coupled Enzyme Assay for Measuring Ornithine Decarboxylase Activity in Cell Lysates Using a Liquid-Stable CO2 Detection Reagent

Published: Vol 16, Iss 15, Aug 5, 2026 DOI: 10.21769/BioProtoc.5768 Views: 175
Reviewed by: Joyce ChiuKannapiran PonrajNishya Mohamed Raseek
 PDF
PDF  Ask a question
Original research article
The authors used this protocol in:

Oct 2025

Protocol Collections
Comprehensive collections of detailed, peer-reviewed protocols focusing on specific topics




Related protocols
Abstract
Ornithine decarboxylase (ODC) is a rate-limiting enzyme in polyamine biosynthesis that plays a critical role in cell proliferation and tumorigenesis. Reliable quantification of ODC activity is essential for mechanistic and therapeutic studies. Traditional assays often rely on radiolabeled substrates or discontinuous endpoint measurements. Here, we describe a non-radioactive, continuous spectrophotometric assay for measuring ODC activity in cell lysates using a commercially available liquid-stable CO2 detection reagent. In this assay, CO2 generated by ODC is captured as bicarbonate and utilized in a coupled enzymatic system containing phosphoenolpyruvate carboxylase (PEPC) and malate dehydrogenase (MDH), leading to oxidation of thio-NADH. The decrease in absorbance at 405 nm due to thio-NADH oxidation is monitored in real time and is proportional to ODC activity. The protocol is performed in a 96-well plate format, requires minimal reagent preparation, and is suitable for medium- to high-throughput applications.
Key features
• Non-radioactive, continuous assay for measuring ODC activity.
• Utilizes a commercially available liquid-stable CO2 detection reagent, requiring minimal preparation and enabling improved reproducibility.
• Real-time monitoring at 405 nm using a standard microplate reader.
• Adaptable to a high-throughput 96-well format.
Keywords: Ornithine decarboxylase (ODC) Enzyme assay
Phosphoenolpyruvate carboxylase (PEPC)
Malate dehydrogenase (MDH)
Thionicotinamide adenine dinucleotide
Reduced form (thio-NADH)
CO2 detection
Polyamine metabolism
Enzyme assay
Phosphoenolpyruvate carboxylase (PEPC)
Malate dehydrogenase (MDH)
Thionicotinamide adenine dinucleotide
Reduced form (thio-NADH)
CO2 detection
Polyamine metabolism
Graphical overview
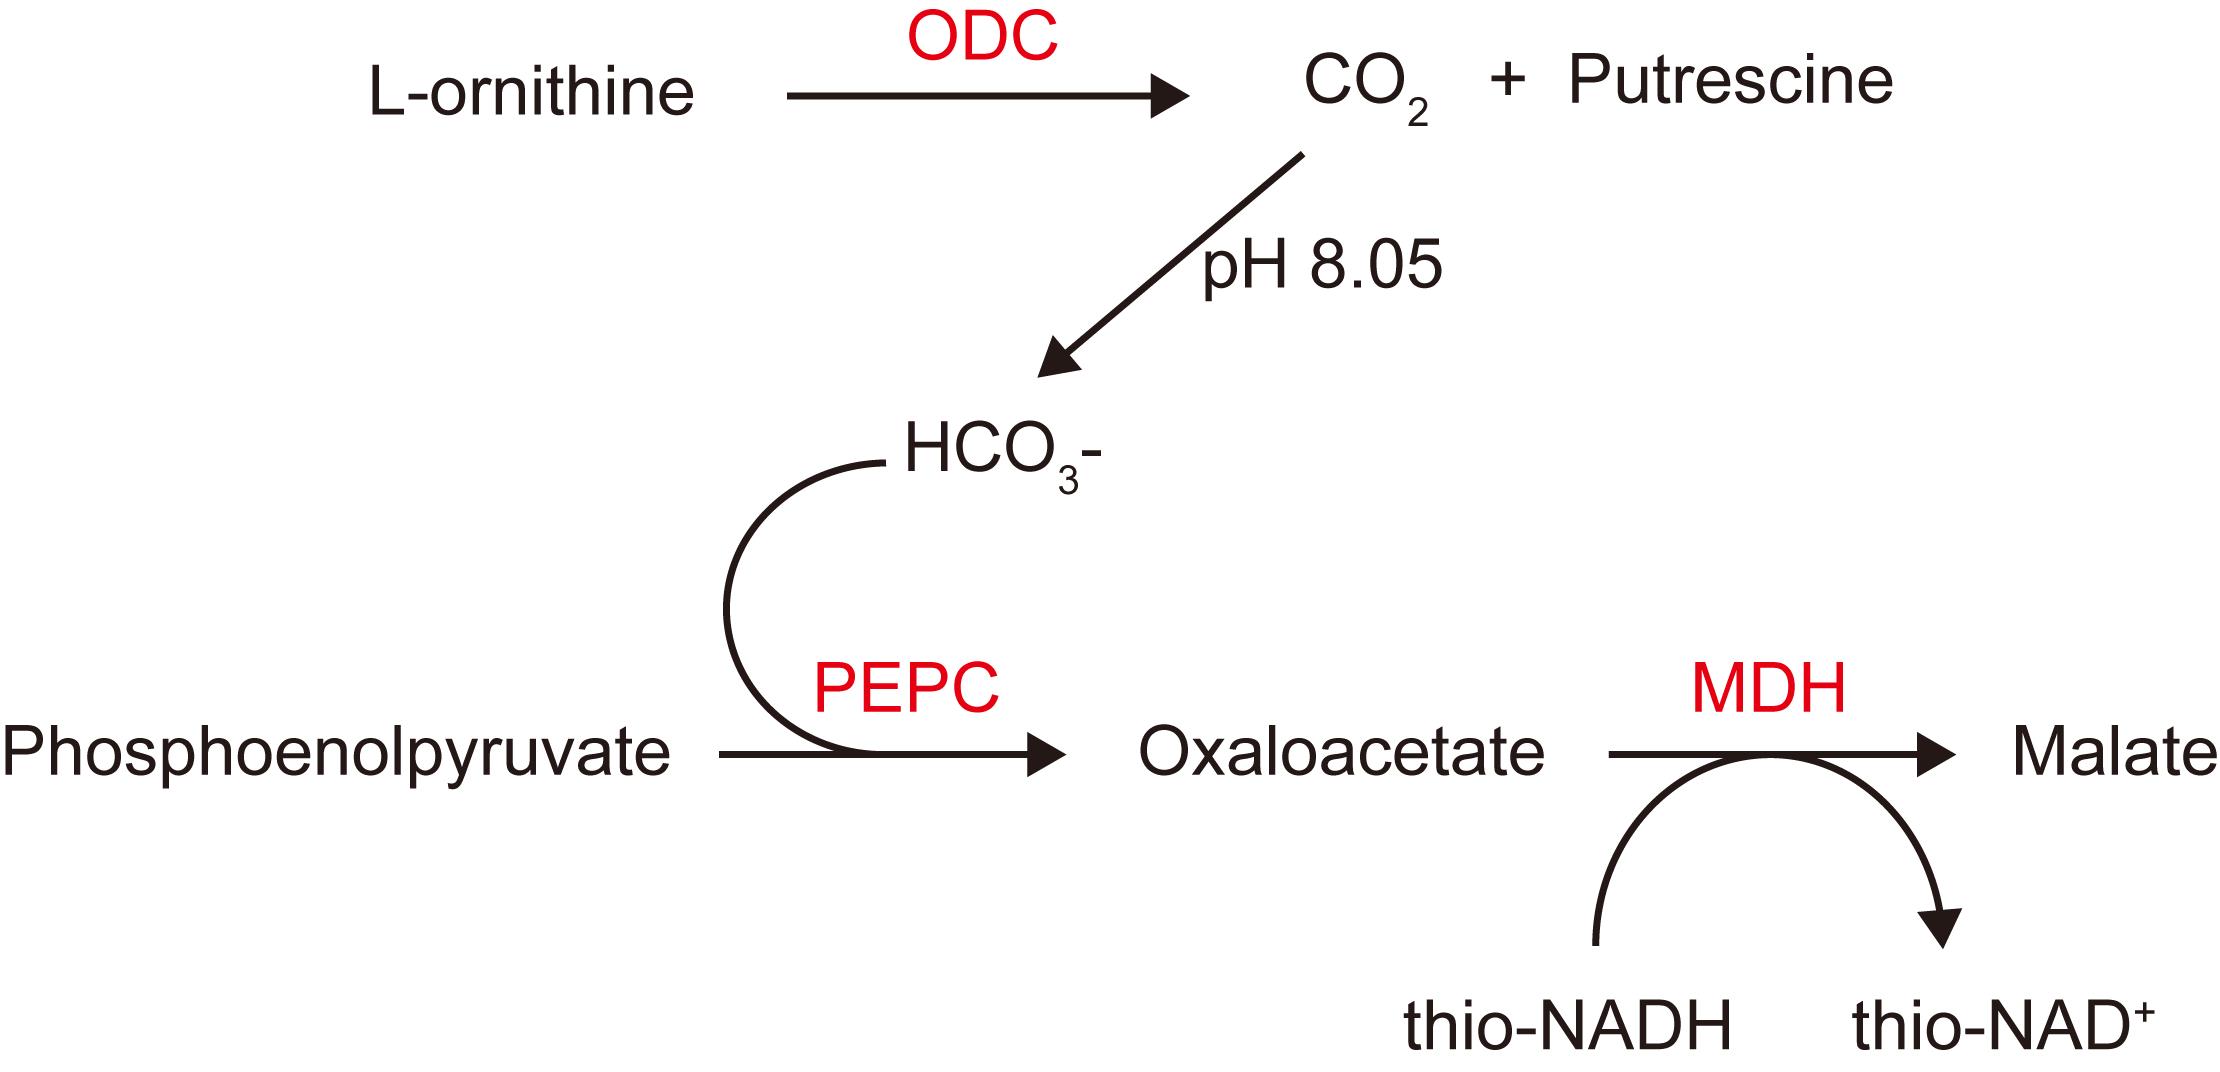
Schematic overview of the coupled enzyme assay for measuring ornithine decarboxylase (ODC) activity. ODC-catalyzed decarboxylation of L-ornithine releases CO2, which is converted to bicarbonate at pH 8.05 and channeled through a phosphoenolpyruvate carboxylase (PEPC)–malate dehydrogenase (MDH) coupled reaction, resulting in stoichiometric oxidation of thio-NADH. The consequent decrease in absorbance at 405 nm provides a continuous, quantitative readout of ODC activity.
Background
Ornithine decarboxylase (ODC) catalyzes the decarboxylation of L-ornithine to generate putrescine and CO2, representing the first and rate-limiting step in polyamine biosynthesis [1]. Elevated ODC activity is associated with increased cellular proliferation and is frequently observed in cancer [2–4]. Beyond oncology, enhanced ODC activity has also been reported in parasitic infections [5], alcohol-associated liver pathologies [6], and immune activation and inflammatory responses [7,8], underscoring the broad relevance of reliable ODC activity quantification across multiple disease contexts and biological systems.
Traditional ODC assays rely on radiolabeled substrates to detect released CO2, which requires specialized handling and limits throughput [9,10]. Coupled enzymatic assays provide a safer and more accessible alternative by linking CO2 production to oxidation of reduced pyridine nucleotides [11,12]. In such systems, CO2 is converted to bicarbonate and utilized by phosphoenolpyruvate carboxylase (PEPC) to generate oxaloacetate, which is subsequently reduced by malate dehydrogenase (MDH), resulting in oxidation of NADH or an analog thereof [11,12].
In this protocol, we employ a commercially available liquid-stable CO2 detection reagent that contains PEPC, MDH, phosphoenolpyruvate, magnesium ions, and thio-NADH, an NADH analog. This simplifies assay setup and improves reproducibility by eliminating the need for manual enzyme preparation. The decrease in absorbance at 405 nm is monitored continuously and provides a direct readout of ODC activity in cell lysates.
Materials and reagents
Biological materials
1. Cell lysates (prepared as described below)
Reagents
1. Liquid-stable CO2 reagents (Pointe Scientific, catalog number: 22-666-300), containing 6 mM PEP, 10 mM magnesium ions, thio-NADH, MDH (≥1,200 U/L), PEPC (≥200 U/L), and buffer (pH 7.4)
2. L-Ornithine (Selleckchem, catalog number: S4857)
3. Pyridoxal-5′-phosphate (PLP) (Sigma-Aldrich, catalog number: 82870)
4. Dithiothreitol (DTT) (Sigma-Aldrich, catalog number: D9779)
5. Tris base (VWR, catalog number: 0497)
6. Sodium chloride (NaCl) (VWR, catalog number: 0241)
7. Magnesium sulfate (MgSO4) (Sigma-Aldrich, catalog number: M7506)
8. Triton X-100 (Sigma-Aldrich, catalog number: T8787)
9. Phosphate-buffered saline (PBS) (Hyclone, catalog number: SH30258.02)
10. Bradford reagent or equivalent protein assay kit (Thermo Scientific, catalog number: 23227)
11. HCl (Honeywell-Fluka, catalog number: 30721-1L-GL)
12. NaOH (UniRegion Bio-Tech, catalog number: UR-7708-500G)
Solutions
1. Assay buffer (see Recipes)
2. Cell lysis buffer (see Recipes)
3. Substrate mix (see Recipes)
Recipes
1. Assay buffer
| Reagent | Concentration |
|---|---|
| Tris | 66 mM |
| NaCl | 25 mM |
| MgSO4 | 8 mM |
| Triton X-100 | 0.01% |
Note: Adjust pH to 8.05 with HCl. Prepare fresh before use.
2. Cell lysis buffer
Assay buffer supplemented with 5.7 mM DTT.
3. Substrate mix
| Reagent | Concentration |
|---|---|
| L-Ornithine | 5 mM |
| PLP | 10 μM |
| DTT | 5.7 mM |
Notes:
1. Prepare the substrate mix in assay buffer immediately before use. After adding DTT, verify that the pH remains at 8.05 ± 0.1 using a calibrated pH meter or pH indicator strip, and re-adjust with diluted NaOH if necessary. This is particularly important when preparing small volumes (<1 mL), where the buffering capacity of Tris may be less robust.
2. DTT is included at 5.7 mM in both the lysis buffer and substrate mix to maintain the reduced state of ODC active site cysteine residues in crude cell lysates, where competing thiol-oxidizing species may be present. If reduced signal quality or nonlinear kinetics are observed, we recommend performing a DTT titration (1–10 mM) to empirically determine the optimal concentration for the specific cell lysate being tested. A working range of 2–5 mM DTT is appropriate for lysates with lower oxidative burden.
Laboratory supplies
1. 96-well clear-bottom microplate (JET BIOFIL, catalog number: TCP-011-096)
2. Plate sealer
Equipment
1. Microplate reader capable of measuring absorbance at 405 nm with temperature control (BioTek, model: Synergy H1)
2. Centrifuge capable of reaching 12,000× g with temperature control (Thermo Scientific, model: Fresco 21)
3. Sonicator (Sonics & Materials, model: VCX130PB)
Procedure
A. Preparation of cell lysates
1. Harvest cells and wash twice with cold PBS.
2. Resuspend cells in cold lysis buffer (1 mL per 107 cells).
3. Lyse cells by sonication using a probe sonicator (20 kHz, 3 × 10 s pulse cycles on ice with 30-s intervals between pulses, 20% amplitude, 3 mm probe diameter).
4. Centrifuge at 12,000× g for 15 min at 4 °C.
5. Collect the supernatant and keep it on ice.
6. Determine protein concentration using the Bradford assay.
7. Dilute lysates to 1 mg/mL in lysis buffer.
B. Assay setup
1. Pre-set the microplate reader to 37 °C.
2. Set the microplate reader for the specific wavelength (405 nm), cycle time (every 1 min for 60 min), and positions of the well.
3. Equilibrate the CO2 detection reagent and all solutions to room temperature.
4. Prepare a 96-well plate layout including sample wells (in triplicate) and blank wells (lysis buffer instead of lysate).
5. Add 120 μL of CO2 detection reagent to each well.
6. Add 40 μL of cell lysate (1 mg/mL) to each sample well.
7. Add 40 μL of lysis buffer to blank wells.
8. Preincubate the plate at 37 °C for 10 min to allow temperature equilibration.
C. Reaction initiation and measurement
1. Initiate the reaction by adding 80 μL of substrate mix to each well. Final reaction volume: 240 μL.
Note: The 240 μL reaction volume is intentionally set close to the maximum working capacity of a standard 96-well plate to minimize headspace above the assay solution, thereby limiting CO2 exchange between the liquid and gas phases. Users should maximize the reaction volume within the capacity of their microplate format for the same reason.
2. Immediately seal the plate with a plate sealer to minimize CO2 exchange.
Note: After substrate addition across all wells, mix briefly by orbital shaking (3–5 s) and seal the plate with a plate sealer as promptly as possible to minimize CO2 exchange with the atmosphere. When using a robotic dispenser or multichannel pipette, complete dispensing and mixing for all wells before sealing. Note that any delay between substrate addition and sealing will contribute to signal loss in early time points; users should therefore standardize the interval between substrate addition and sealing across experiments to ensure reproducibility.
3. Place the plate in a microplate reader pre-set to 37 °C.
4. Measure absorbance at 405 nm in kinetic mode with the following settings: measurement interval every 1 min for 60 min, and orbital shaking (3 mm, normal speed) between reads to ensure homogeneous mixing.
Note: Begin data acquisition immediately after substrate addition to ensure accurate capture of the initial linear phase.
Data analysis
1. Plot absorbance at 405 nm vs. time for each well.
2. Determine the slope of the linear region: ΔA405/min.
3. Subtract the slope obtained from blank wells from all sample values.
4. Calculate ODC activity using the following equation:
ODC activity (nmol CO2/h/mg protein) = 60,000 × [ΔA405/min × reaction volume (mL)]/[ε × d × protein amount (mg)]
where ε is the extinction coefficient of thio-NADH at 405 nm (~11.9 mM-1·cm-1), and d is the pathlength of the solution in the well (typically 0.63 cm for 240 μL in a 96-well plate).
5. Example calculation: A representative sample is shown in Figure 1. The linear range of the absorbance curve was 0–20 min, and the enzymatic activity was calculated as follows:
a. Blank slope = (0.428 - 0.371)/20 = 0.0029 absorbance units/min
b. Sample slope = (0.423 - 0.322)/20 = 0.0051 absorbance units/min
c. Net slope = 0.0022 absorbance units/min
d. ODC activity = (60,000 × 0.0022 × 0.24)/(11.9 × 0.63 × 0.04) = 105.6 nmol CO2/h/mg protein
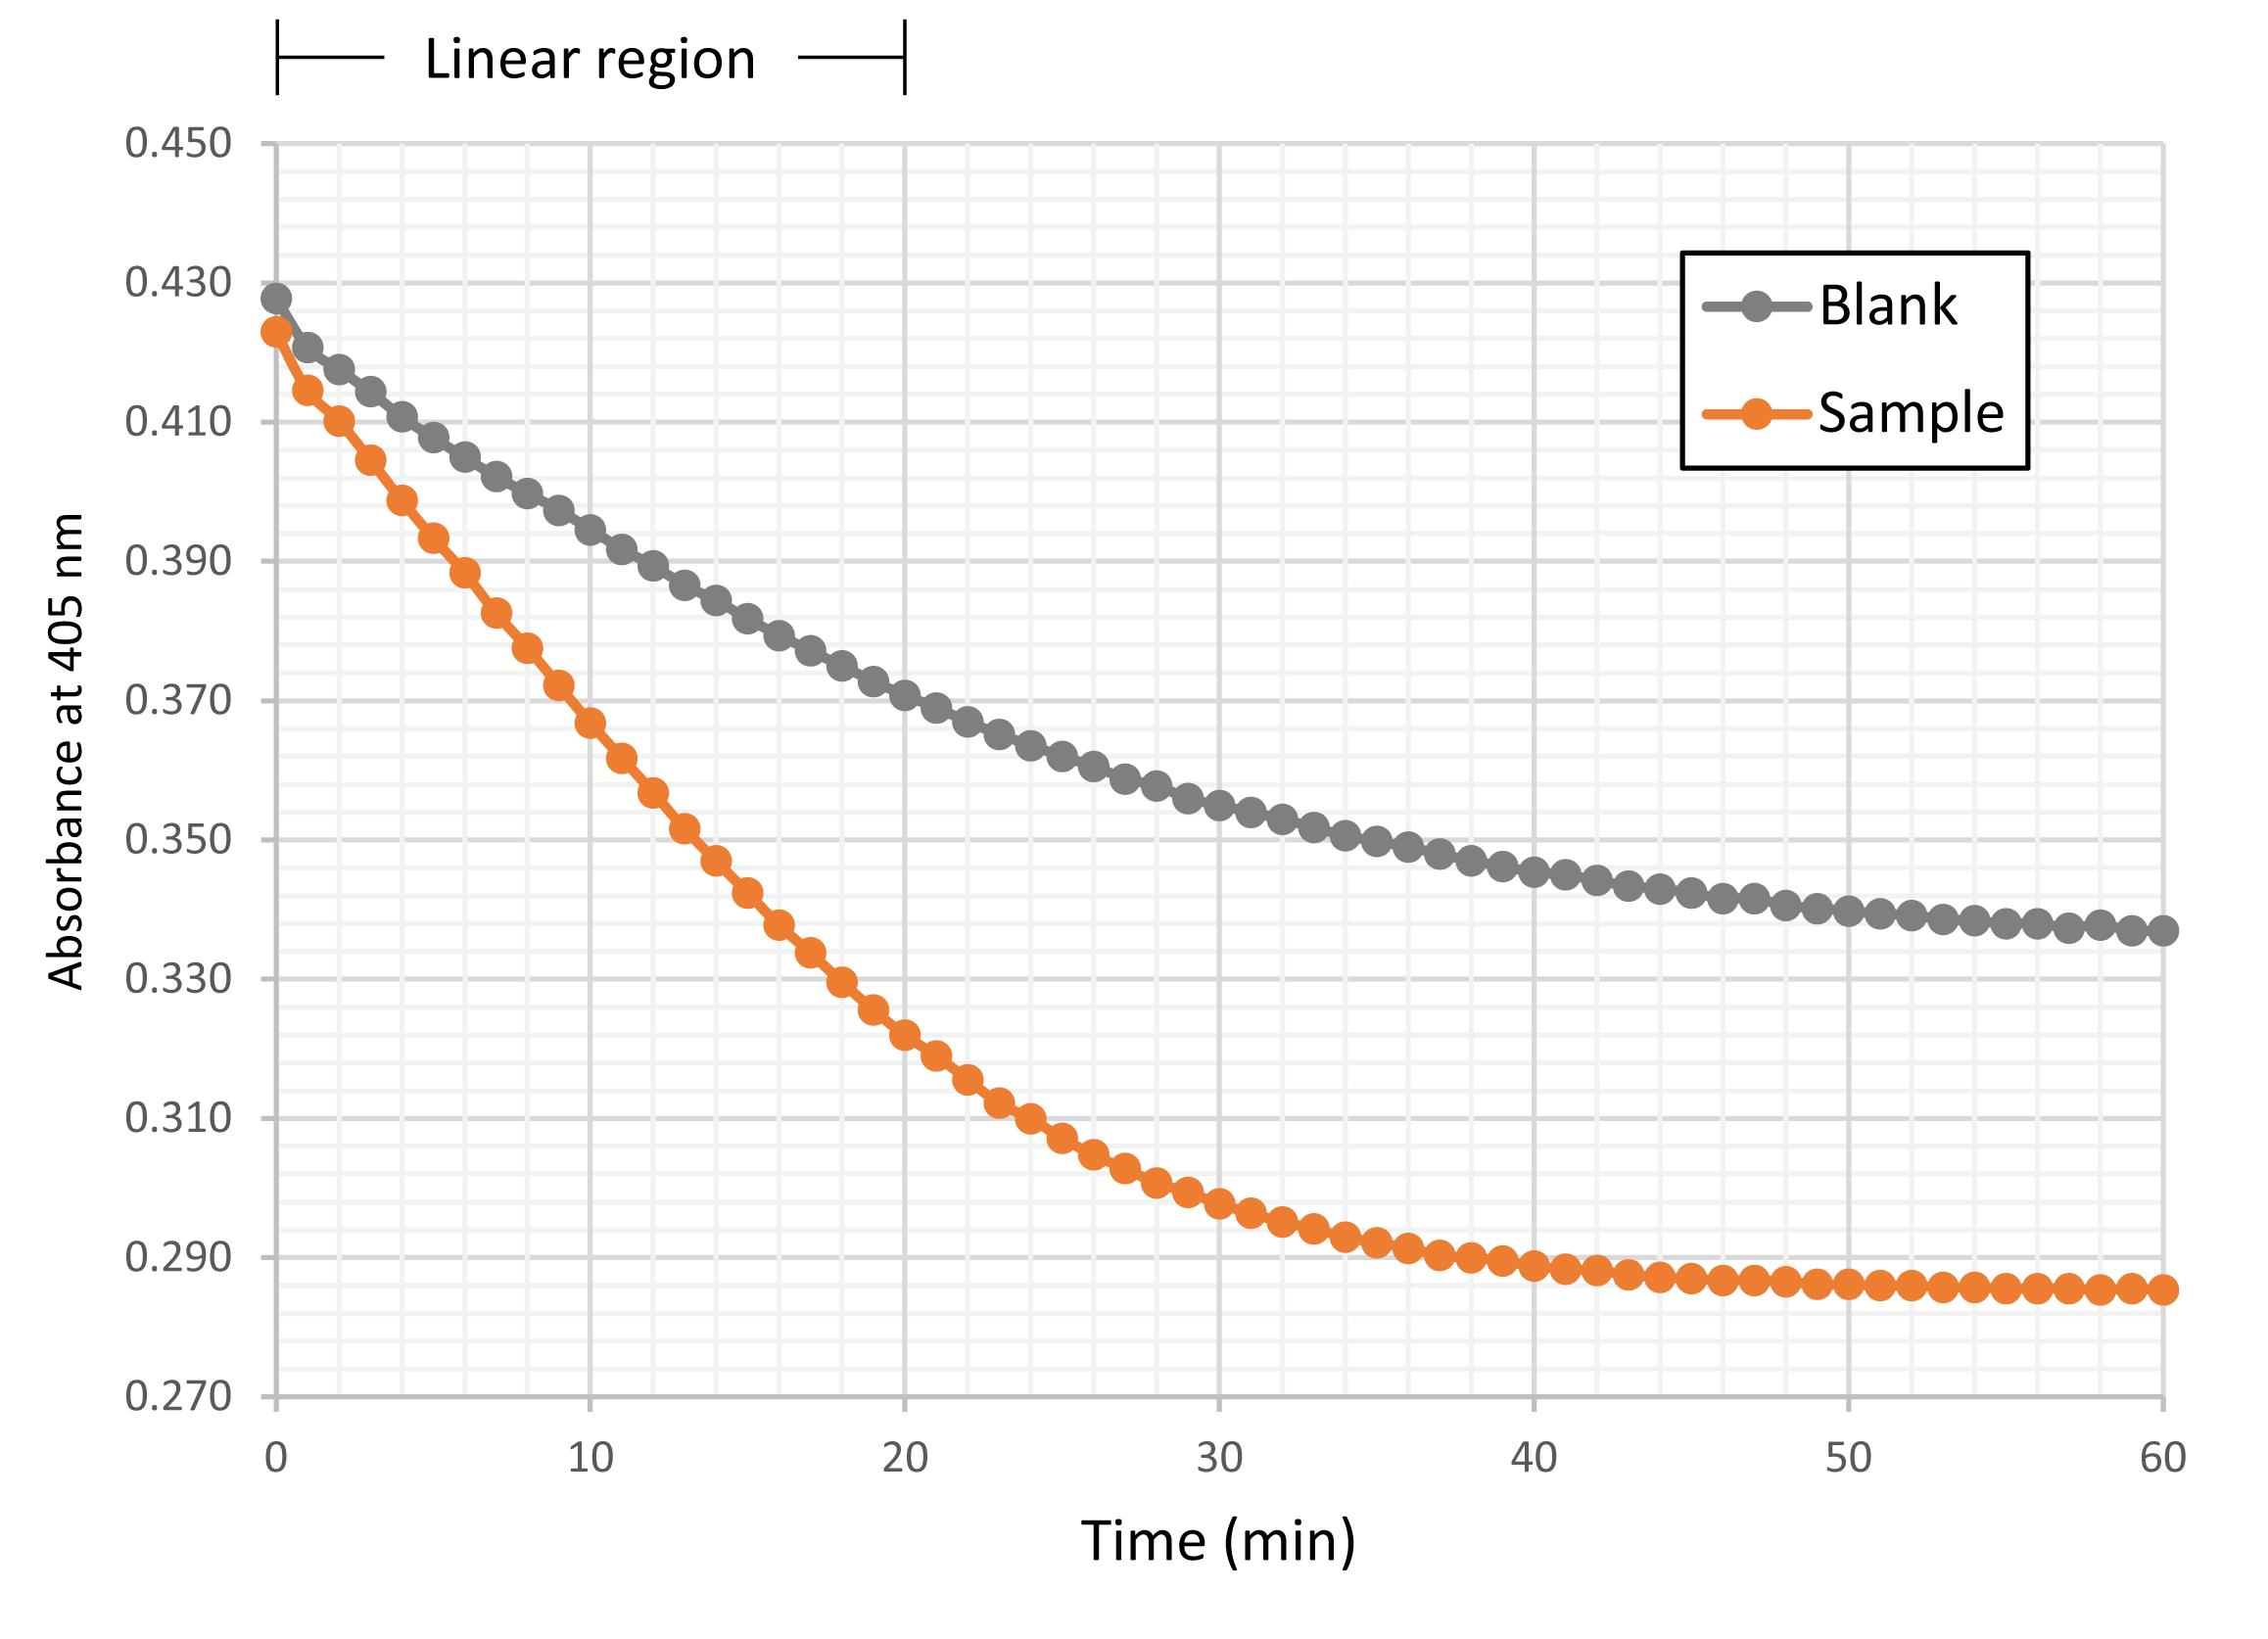
Figure 1. Representative kinetic curve for measuring ornithine decarboxylase (ODC) activity. Representative absorbance traces at 405 nm obtained from blank and cell lysate samples in the coupled enzyme assay. The linear portion of the kinetic curve (0–20 min) was used to determine the reaction rate (ΔA405/min) for subsequent calculation of ODC activity.
Validation of protocol
This protocol has been used and validated in the following research article:
• Hsu et al. [13]. MTAP deficiency confers resistance to cytosolic nucleic acid sensing and STING agonists. Science. 2025 Oct 9; 390(6769): eadl4089. doi: 10.1126/science.adl4089 (Supplementary Figure S6).
General notes and troubleshooting
General notes
1. The CO2 detection reagent contains PEPC, MDH, phosphoenolpyruvate, magnesium ions, and thio-NADH; no additional coupling enzymes are required.
2. Ensure consistent plate sealing to reduce variability due to atmospheric CO2.
3. Verify that measurements are taken within the linear range of the reaction.
4. Avoid introducing bubbles into wells, as they interfere with absorbance readings.
5. Because the assay relies on oxidation of a reduced pyridine nucleotide analog, endogenous dehydrogenases or transhydrogenases present in crude cell lysates may contribute to a background signal. Appropriate blank controls should be included in each experiment, and background activity should be subtracted from sample measurements. For samples expected to contain unusually high levels of NADH-consuming enzymes, additional controls such as omission of L-ornithine or inclusion of an ODC inhibitor (e.g., DFMO, α-difluoromethylornithine; 1 mM, 48 h) are recommended to confirm assay specificity.
Troubleshooting
1. High background signal
Ensure fresh preparation of buffers and minimize CO2 exposure during setup.
2. Low activity signal
1) Increase protein input and 2) verify the enzymatic activity of ODC in samples. ODC protein levels can be confirmed by western blot using a commercial anti-ODC antibody. Alternatively, ODC activity can be verified by pre-treating cells with the irreversible ODC inhibitor DFMO (α-difluoromethylornithine; 1 mM, 48 h), which should abolish the signal. This pharmacological validation confirms that the measured absorbance decrease is attributable specifically to ODC-dependent CO2 production rather than nonspecific background.
3. Nonlinear kinetics
Confirm substrate concentration is not limiting and ensure consistent temperature control.
4. Inconsistent readings
Check for bubbles in wells and ensure uniform mixing and timing across wells.
Acknowledgments
This work was supported by the Taiwan National Science and Technology Council grant (MOST 109-2314-B-039-006-MY2, MOST 111-2320-B-039-045-MY3, and NSTC 115-2320-B-039-024) to J.-M.H. This protocol was described and validated in [13].
Competing interests
The authors declare no competing interests.
Ethical considerations
No animal or human subjects have been used in the elaboration of this protocol.
References
- Gerner, E. W. and Meyskens, F. L., Jr. (2004). Polyamines and cancer: old molecules, new understanding. Nat Rev Cancer.4(10): 781–792. https://doi.org/10.1038/nrc1454
- Casero, R. A., Jr., Murray Stewart, T. and Pegg, A. E. (2018). Polyamine metabolism and cancer: treatments, challenges and opportunities. Nat Rev Cancer.18(11): 681–695. https://doi.org/10.1038/s41568-018-0050-3
- Shantz, L. M. and Levin, V. A. (2007). Regulation of ornithine decarboxylase during oncogenic transformation: mechanisms and therapeutic potential. Amino Acids.33(2): 213–223. https://doi.org/10.1007/s00726-007-0531-2
- Auvinen, M., Paasinen, A., Andersson, L. C. and Holtta, E. (1992). Ornithine decarboxylase activity is critical for cell transformation. Nature.S60(6402): 355–358. https://doi.org/10.1038/360355a0
- Heby, O., Persson, L. and Rentala, M. (2007). Targeting the polyamine biosynthetic enzymes: a promising approach to therapy of African sleeping sickness, Chagas' disease, and leishmaniasis. Amino Acids.33(2): 359–366. https://doi.org/10.1007/s00726-007-0537-9
- Diehl, A. M., Chacon, M. and Wagner, P. (1988). The effect of chronic ethanol feeding on ornithine decarboxylase activity and liver regeneration. Hepatology.8(2): 237–242. https://doi.org/10.1002/hep.1840080208
- Hardbower, D. M., Asim, M., Luis, P. B., Singh, K., Barry, D. P., Yang, C., Steeves, M. A., Cleveland, J. L., Schneider, C., Piazuelo, M. B., et al. (2017). Ornithine decarboxylase regulates M1 macrophage activation and mucosal inflammation via histone modifications. Proc Natl Acad Sci USA. 114(5): E751–E760. https://doi.org/10.1073/pnas.1614958114
- Singh, K., Coburn, L. A., Asim, M., Barry, D. P., Allaman, M. M., Shi, C., Washington, M. K., Luis, P. B., Schneider, C., Delgado, A. G., et al. (2018). Ornithine Decarboxylase in Macrophages Exacerbates Colitis and Promotes Colitis-Associated Colon Carcinogenesis by Impairing M1 Immune Responses. Cancer Res. 78(15): 4303–4315. https://doi.org/10.1158/0008-5472.CAN-18-0116
- Bitonti, A. J., McCann, P. P. and Sjoerdsma, A. (1982). Restriction of bacterial growth by inhibition of polyamine biosynthesis by using monofluoromethylornithine, difluoromethylarginine and dicyclohexylammonium sulphate. Biochem J. 208(2): 435–441. https://doi.org/10.1042/bj2080435
- Thyssen, S. M. and Libertun, C. (2002). Quantitation of polyamines in hypothalamus and pituitary of female and male developing rats. Neurosci Lett. 323(1): 65–69. https://doi.org/10.1016/s0304-3940(02)00097-6
- Burns, D. H. and Aberhart, D. J. (1988). A general coupled spectrophotometric assay for decarboxylases. Anal Biochem. 171(2): 339–345. https://doi.org/10.1016/0003-2697(88)90495-2
- Smithson, D. C., Shelat, A. A., Baldwin, J., Phillips, M. A. and Guy, R. K. (2010). Optimization of a non-radioactive high-throughput assay for decarboxylase enzymes. Assay Drug Dev Technol. 8(2): 175–185. https://doi.org/10.1089/adt.2009.0249
- Hsu, J. M., Liu, C., Xia, W., Chen, C. Y., Cheng, W. C., Hou, J. and Hung, M. C. (2025). MTAP deficiency confers resistance to cytosolic nucleic acid sensing and STING agonists. Science. 390(6769): eadl4089. https://doi.org/10.1126/science.adl4089
Article Information
Publication history
Received: May 10, 2026
Accepted: Jun 21, 2026
Available online: Jul 2, 2026
Published: Aug 5, 2026
Copyright
© 2026 The Author(s); This is an open access article under the CC BY-NC license (https://creativecommons.org/licenses/by-nc/4.0/).
How to cite
Readers should cite both the Bio-protocol article and the original research article where this protocol was used:
- Hsu, J. (2026). Coupled Enzyme Assay for Measuring Ornithine Decarboxylase Activity in Cell Lysates Using a Liquid-Stable CO2 Detection Reagent. Bio-protocol 16(15): e5768. DOI: 10.21769/BioProtoc.5768.
- Hsu, J. M., Liu, C., Xia, W., Chen, C. Y., Cheng, W. C., Hou, J. and Hung, M. C. (2025). MTAP deficiency confers resistance to cytosolic nucleic acid sensing and STING agonists. Science. 390(6769): eadl4089. https://doi.org/10.1126/science.adl4089

 Download Citation in RIS Format
Category
Biochemistry > Protein > Activity
Cell Biology > Cell-based analysis > Enzymatic assay
Biochemistry > Other compound > NAD+/NADH
Do you have any questions about this protocol?
Post your question to gather feedback from the community. We will also invite the authors of this article to respond.
 Post a Question


