


- Protocols

- Articles and Issues
- For Authors
- About
- Become a Reviewer


Measuring PINK1 Activity in Single Cells Using a PINK1 Kinase Activity Reporter

Published: Vol 16, Iss 14, Jul 20, 2026 DOI: 10.21769/BioProtoc.5746 Views: 341
Reviewed by: Sébastien GillotinAnonymous reviewer(s)
 PDF
PDF  Ask a question
Original research article
The authors used this protocol in:

Feb 2026
Advertisement


Protocol Collections
Comprehensive collections of detailed, peer-reviewed protocols focusing on specific topics




Related protocols

Abstract
Phosphatase and tensin homolog-induced kinase 1 (PINK1) is a serine/threonine kinase that plays a key role in mitophagy initiation. Loss-of-function autosomal recessive mutations in PINK1 cause early onset Parkinson’s disease (EOPD). Current approaches for studying PINK1 function depend on bulk techniques that can only provide snapshots of activity and could miss the dynamics and cell-to-cell heterogeneity of PINK1 activity or provide an indirect readout of PINK1 activity. Here, we present a protocol using our newly developed phase separation–based PINK1 biosensor (PINK1-SPARK) to observe real-time activity of endogenous PINK1 in single cells. Following transfection of live cells with PINK1-SPARK, cells are treated with mitochondrial depolarizing agents and visualized using widefield or confocal fluorescence microscopy, either following the same cells over time for time-lapse imaging of PINK1 activity or end-point measurements. Thus, PINK1-SPARK is a new tool that enables the measurement of PINK1 activity in single live cells, allowing for further elucidation of the role of PINK1 in mitophagy and cell function.
Key features
• Detailed protocol for use of PINK1-SPARK, a new PINK1 biosensor introduced in Vineall et al. [1].
• PINK1-SPARK, based on phase separation, has a high signal-to-noise, enabling robust detection of PINK1 activity in multiple cell types under multiple activating conditions.
• Enables measurement of real-time endogenous PINK1 activation at the single-cell level.
Keywords: PINK1 Kinase activity reporter
Biosensor
Functional imaging
Mitophagy
Fluorescence microscopy
Kinase activity reporter
Biosensor
Functional imaging
Mitophagy
Fluorescence microscopy
Graphical overview
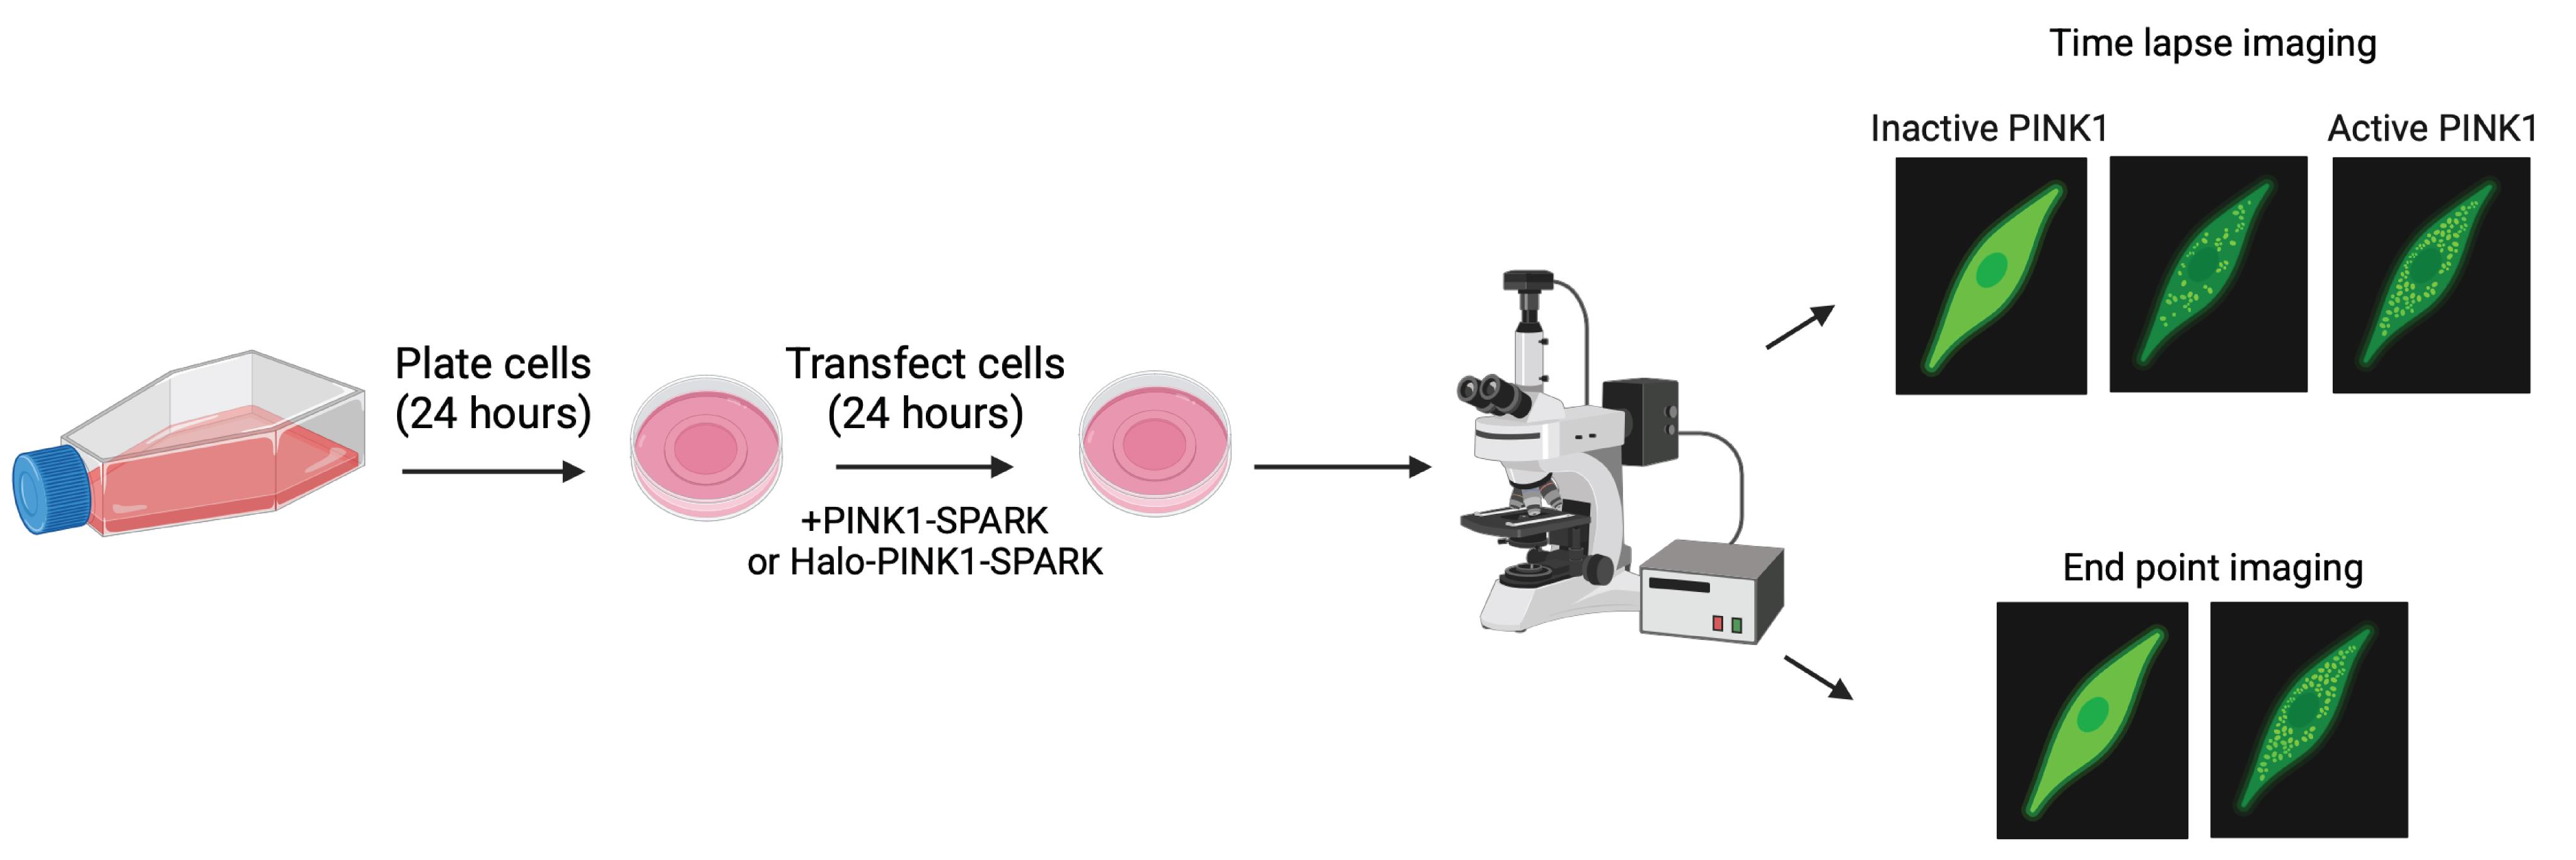
PINK1-SPARK protocol overview. Following plating of cells onto imaging dishes (24 h), cells are transfected with the desired SPARK reporter (24 h) and imaged following treatment with phosphatase and tensin homolog-induced kinase 1 (PINK1) activators or dimethyl sulfoxide (DMSO). Either time-lapse or end-point imaging can be conducted using PINK1-SPARK. PINK1 activity is visualized as the presence of green fluorescent puncta within the cell.
Background
Phosphatase and tensin homolog-induced kinase 1 (PINK1) is a mitochondrial serine/threonine kinase involved in mitophagy, the selective degradation of damaged mitochondria. In healthy mitochondria, PINK1 is constitutively recruited to the outer mitochondrial membrane and imported into the inner membrane space, where it undergoes N-terminal cleavage by proteases and subsequent degradation in the cytosol [2]. Following mitochondrial damage, the inner mitochondrial membrane becomes depolarized, and PINK1 is stabilized in its full-length form. This results in the dimerization, trans-autophosphorylation, and activation of PINK1, allowing it to phosphorylate and activate the E3 ubiquitin ligase Parkin and ubiquitin [3]. Parkin catalyzes the ubiquitination of outer mitochondrial membrane proteins, tagging damaged mitochondria for degradation by autophagic machinery [4,5]. Loss-of-function autosomal recessive mutations in PINK1 are known to cause early onset Parkinson’s disease (EOPD) [6], leading to the onset of symptoms, including tremor, rigidity, and bradykinesia, at a mean age of 31 years [7]. While advances have been made in understanding the role of PINK1 in mitochondrial dynamics and involvement of PINK1 in the development of Parkinson’s disease, current tools available to study PINK1 typically only provide snapshots of PINK1 activity, provide indirect readouts of PINK1 activity, or rely on overexpression of PINK1 [8–10]. We therefore sought to develop a kinase activity reporter capable of characterizing endogenous PINK1 activity dynamics in live cells using both time-lapse microscopy and end-point imaging.
Fluorescent protein-based kinase activity reporters (KARs) offer a unique approach to study kinase activity dynamics in single cells with high spatiotemporal resolution [11]. KARs have been developed for several kinases, including AMP-activated protein kinase (AMPK), protein kinase A (PKA), and protein kinase C (PKC) [12]. One KAR design—separation of phase-based activity reporter of kinase (SPARK)—takes advantage of liquid–liquid phase separation for the detection of kinase activity [13]. In this KAR design, phosphorylation of the SPARK construct increases the local concentration of fluorophores, observed as puncta, resulting in a simple readout of kinase activity that can be multiplexed with other biosensors [14]. SPARK-based biosensors have been made for kinases, including PKA, ataxia-telangiectasia mutated (ATM), and AMPK [13–15]. As the SPARK design enables both time-lapse imaging and snapshots of kinase activity in single cells with high signal-to-noise, we sought to design a SPARK-based KAR for PINK1 (Figure 1).
While several methods exist to measure mitochondrial function, none are capable of directly reporting PINK1 activity in real time. Western blot analysis has so far been the standard for measuring PINK1 activity, but it only provides bulk readouts of activity at specific points in time. Other fluorescence protein–based tools have been created to provide readouts of mitophagy, for example, MT-Keima and Mito-QC [16]. Both rely on pH-dependent changes in fluorescent proteins to visualize mitochondria being taken up by autophagic machinery, but this is an indirect readout of PINK1 activity, as PINK1-independent mitophagy mechanisms have been described [17]. A more recent tool is MitoPain, which uses a mitochondrial PINK1 accumulation index to quantify mitochondrial stress by comparing PINK1-GFP and RFP-Omp25 signals [10]. While MitoPain allows for the quantification of mitochondrial stress, this reporter does not provide a direct readout of PINK1 activity and requires overexpression of PINK1. Our newly developed PINK1-SPARK utilizes the PINK1 phosphomotif from ubiquitin, a canonical PINK1 substrate, to overcome these limitations and measure endogenous PINK1 activity. Furthermore, we developed a HaloTag-based PINK1-SPARK for multiplexing of PINK1 activity with other markers of mitochondrial damage. We validated the use of PINK1-SPARK in a variety of cell lines, including PINK1 knockout HeLa cervical cancer cells, and found minimal response of PINK1-SPARK in PINK1 knockout HeLa cells. While PINK1-SPARK has a large dynamic range, its spatial resolution falls short of that of other KARS, notably Förster resonance energy transfer (FRET)-based KARS, which can measure kinase activity at distinct subcellular locations [11]. Additionally, we did not test the reversibility of PINK1-SPARK, as PINK1 inhibitors are nonspecific [18]; thus, PINK1-SPARK functions best as a “turn on” reporter of PINK1 activity. Nevertheless, PINK1-SPARK represents a significant advancement in the detection and quantification of endogenous PINK1 activity. In this protocol, we provide an overview of how to use PINK1-SPARK to study endogenous PINK1 activity at the single-cell level.
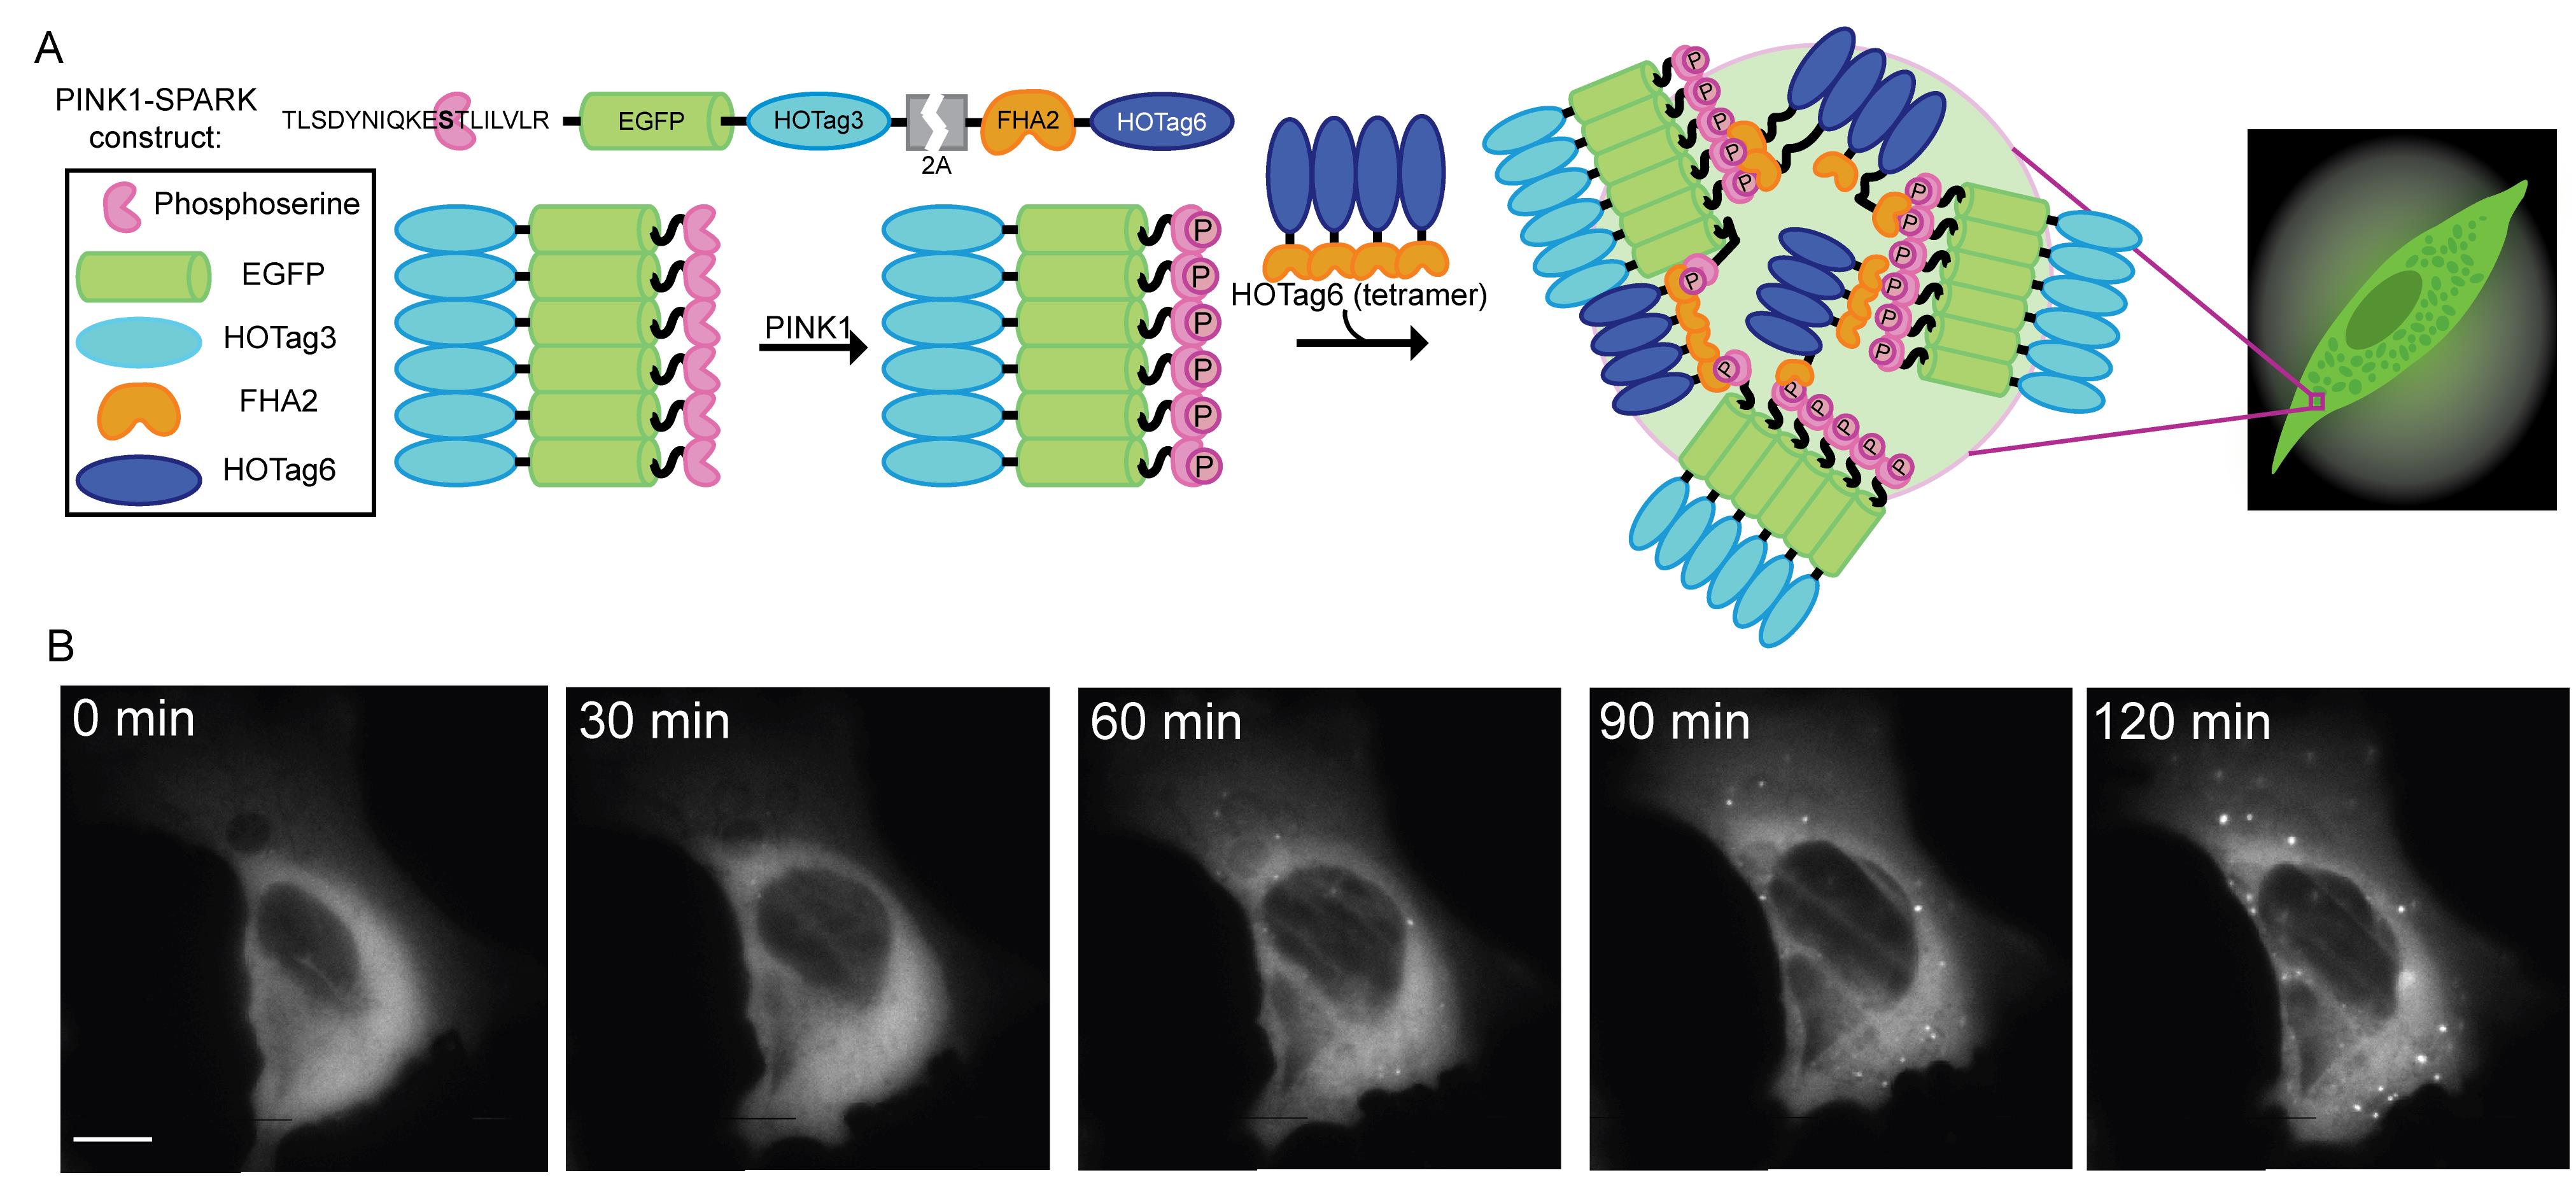
Figure 1. PINK1-SPARK protocol overview. (A) General scheme of reporter function. The first component consists of the tensin homolog-induced kinase 1 (PINK1)-specific ubiquitin consensus sequence, EGFP, and the hexameric homooligomeric tag, HOTag3. The phosphoamino acid binding domain, FHA2, and the tetrameric HOTag6 make up the second component. PINK1 phosphorylates Ser65 within its consensus sequence, allowing recognition and binding by FHA2. The resulting proximity of multivalent interactions promotes phase separation and allows for the visualization of PINK1 activity as green fluorescent droplets. (B) Time-lapse images of U2OS cells transiently expressing PINK1-SPARK following the addition of 10 μM CCCP. Adapted from Vineall et al. [1] under a CC BY-NC-ND 4.0 license.
Materials and reagents
Biological materials
1. HeLa cervical cancer cells (ATCC, CRM-CCL-2)
Note: While we describe the use of PINK1-SPARK in HeLa cells in this protocol, this method can be applied to any cell line that can be easily transfected; we have previously used this protocol in U2OS (Figure 1) and SHSY5Y cells.
2. PINK1-SPARK plasmid (Addgene, catalog number: 248086)
3. PINK1-SPARK S/A plasmid (Addgene, catalog number: 248087)
4. Halo-PINK1-SPARK plasmid (Addgene, catalog number: 248088)
5. Halo-PINK1-SPARK S/A plasmid (Addgene, catalog number: 248089)
Reagents
1. Dulbecco’s modified Eagle medium (DMEM) (Thermo Scientific, catalog number: 10569010)
2. Hank’s buffered saline solution (HBSS) (Thermo Scientific, catalog number: 14185052)
3. Opti-MEM (Thermo Scientific, catalog number: 31985070)
4. FuGene 4K (Promega, catalog number: E5911)
5. Fetal bovine serum (FBS) (Thermo Scientific, catalog number: A4736101)
6. Penicillin/streptomycin (pen/strep) (Thermo Scientific, catalog number: 15140122)
7. Ultrapure water (Fisher Scientific, catalog number: 10-977-023)
8. HEPES (Fisher Scientific, catalog number: SH3023701)
9. D-glucose (VWR, catalog number: BT132735-500G)
10. Trypsin (Thermo Scientific, catalog number: 12604013)
11. CCCP (Fisher Scientific, catalog number: 04-525-00)
12. Kinetin riboside (MedChem Express, catalog number: HY-101055)
13. MTK458 (MedChem Express, catalog number: HY-152943)
14. DMSO
15. Janelia Fluor HaloTag ligand, 646 (JF646) (Promega, catalog number: HT1060)
16. TrypLE Express Enzyme (Thermo Scientific, catalog number: 12604039)
17. Bleach
18. Ethanol
Solutions
1. HeLa cell growth media (see Recipes)
2. 1× HBSS imaging buffer (see Recipes)
Recipes
1. HeLa cell growth media
| Reagent | Final concentration | Quantity or volume |
|---|---|---|
| DMEM | 1× | 500 mL |
| FBS | 10% | 50 mL |
| Pen/strep | 99 units/mL | 5.5 mL |
| Total | n/a | 555.5 mL |
2. 1× HBSS imaging buffer
| Reagent | Final concentration | Quantity or volume |
|---|---|---|
| 10× HBSS | 1× | 100 mL |
| Ultrapure water | n/a | 900 mL |
| HEPES | 20 mM | 20 mL |
| D-glucose | 10 mM | 1 g |
| Total | n/a | 1 L |
Note: HBSS is frequently used for live cell imaging [19–21]. While not tested here, other imaging media, like Fluorobrite, could be used.
Laboratory supplies
1. 35 mm glass bottom dishes (Cellvis, catalog number: d35-14-1.5-n)
2. 25 cm cell culture flasks (Corning, catalog number: 353138)
3. 5, 10, and 25 mL serological pipettes (Corning, catalog numbers: 357543, 357551, 357525)
4. 15 and 50 mL conical tubes (Fisher Scientific, catalog numbers: 14-959-49B, 14-432-22)
5. Countess cell counting slides (Thermo Scientific, catalog number: C10228) or hemocytometer (Sigma-Aldrich, catalog number: MDH-2N1)
6. Micropipettes (Eppendorf, catalog numbers: 3123000020, 3123000047, 3123000063)
7. Micropipette tips (USA Scientific, catalog numbers: 1111-3730, 1110-9880, 1112-1860)
8. Aspiration pipettes (Fisher Scientific, catalog number: 14-955-135)
9. Nikon immersion oil (Nikon, catalog number: MXA22168)
10. Leica immersion oil (Thorlabs, catalog number: MOIL-10LF)
11. Sterile Petri dishes (Fisher Scientific, catalog number: 08-757-100D)
12. Microcentrifuge tubes (Fisher Scientific, catalog number: 05-408-129)
13. Loctite mounting putty (Amazon, catalog number: 079340685444)
Equipment
1. Light microscope for tissue culture (Fisher Scientific, model: LMI3PH2)
2. Countess FL cell counter (Thermo Scientific, model: AMQAF2000)
3. HeraCell CO2 incubator at 37 °C and 5% CO2 (Thermo Scientific, catalog number: 13998254)
4. 1300 Series Class II, Type A2 Biological Safety Cabinet (Fisher Scientific, catalog number: 13-261-222)
5. Bead bath (Genesee Scientific, catalog number: 31-149) with thermal glass beads (USA Scientific, catalog number: 9123-220)
6. Nikon ECLIPSE Ti2 epifluorescence microscope with a CHI60 Plan Fluor 40× oil immersion objective lens and stage-top heater (Nikon)
7. Leica Stellaris 5 with an HC PL APO 63×/1.40 oil immersion CS2 lens and stage-top heater (Leica)
Note: Any microscope with a live-imaging setup can be used.
Software and datasets
1. Fiji Is Just Image J (FIJI), free to use (Version 2.16.0)
2. Prism v10; requires a license (GraphPad)
Procedure
A. Cell line maintenance
Maintain HeLa cells in T-25 cell culture flasks in a 37 °C incubator at 5% CO2. Passage cells every two to three days (when they reach ~80% confluence) according to the following protocol. Passage should be done in a biosafety cabinet, following aseptic techniques. For instance, every container going into the biosafety cabinet should be sterilized with 70% ethanol, and the user should wear appropriate personal protective equipment (i.e., lab coat, gloves, etc.).
Note: While we describe the use of PINK1-SPARK in HeLa cells in this protocol, this method can be applied to any cell line that can be easily transfected.
1. In a biosafety cabinet, aspirate old media from the flask into a container with 10% bleach.
2. Add 1 mL of TrypLE Express and incubate cells in the HeraCell incubator at 37 °C for 5 min.
3. Neutralize the trypsin with 3 mL of fresh HeLa culture medium, for a total of 4 mL.
4. In a new flask, add 5 mL of fresh HeLa culture medium that has been warmed in a glass bead bath.
5. Add 1 mL of suspended HeLa cells to the new flask. Swirl and rock the flask to ensure an even distribution of cells. Put cells in a 37 °C incubator at 5% CO2.
B. Seeding cells onto imaging dishes
Note: Cells should be seeded one day before transfection.
1. Add 1.95 mL of cell culture media to a 35 mm glass-bottom imaging dish. Using suspended HeLa cells from section A, add 50 μL of cells (~0.3 × 10⁶ cells) to the center of the dish.
2. Add HeLa cells, dropwise, to the imaging dish in a circular motion, focused on the middle part of the glass dish. Gently swirl the dish to ensure even distribution of cells. Put the dish in a 10 cm Petri dish for safe handling and transfer to a 37 °C incubator at 5% CO2 for 24 h before transfection.
C. Transfection
Prior to transfection, check cell density. If cells are 70%–80% confluent, proceed with transfection (Figure 2). If not, exchange media for fresh HeLa culture medium and incubate in a 37 °C incubator at 5% CO2 for another 24 h.
1. In a sterile biological safety cabinet, prepare the transfection mix according to the recipe in Table 1.
a. Add 100 μL of Opti-MEM to a sterile microcentrifuge tube.
b. Add 0.5 μg of plasmid DNA for each biosensor to be expressed to the medium.
c. Add 1.5 μL of FuGENE 4K to the plasmid dilution.
Note: We have found that FuGENE 4K is the most efficient transfection reagent for the expression of PINK1-SPARK in HeLa cells; however, the transfection reagent is dependent upon the cell line being used.
d. Mix by gently pipetting up and down. Incubate the transfection mix for 15 min at room temperature.
2. Place imaging dishes containing HeLa cells in the biological safety cabinet. Add transfection mix dropwise to each dish, focusing on adding the mix to cells adherent to the glass portion of the dish. Gently swirl to mix and incubate overnight in a 37 °C incubator at 5% CO2.
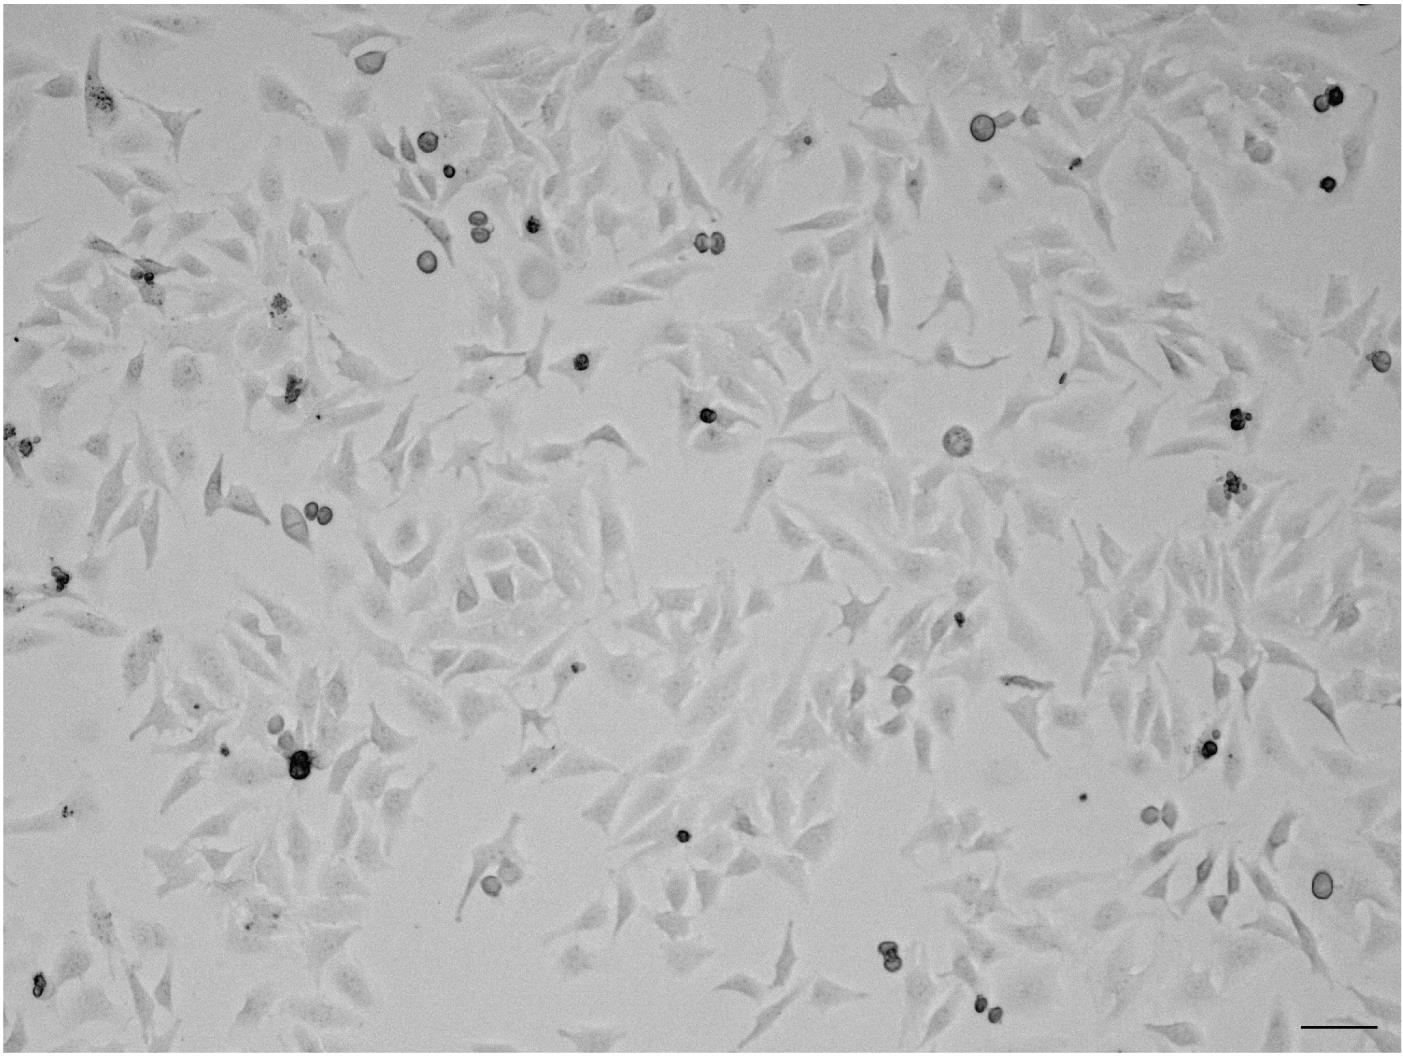
Figure 2. Brightfield image of HeLa cells at ~70% confluence
Table 1. Transfection conditions for HeLa cells
| Reagent | Dish 1 | Dish 2 | Dish 3 | Dish 4 |
|---|---|---|---|---|
| Biosensor | PINK1-SPARK | PINK1-SPARK S/A | Halo-PINK1-SPARK | Halo-PINK1-SPARK S/A |
| Opti-MEM (μL) | 100 | 100 | 100 | 100 |
| DNA (μg) | 0.5 | 0.5 | 0.5 | 0.5 |
| FuGENE 4K transfection reagent (μL) | 1.5 | 1.5 | 1.5 | 1.5 |
D. Imaging preparation for widefield fluorescence microscopy
1. At ~24 h post-transfection, check imaging dishes for cell health.
Note: For imaging, a confluence of 70%–80% allows for many cells to be observed within a single field of view.
a. If cells look sparse or transfection efficiency is low, imaging can be performed 48 h after transfection.
Note: Imaging should be performed no longer than 48 h after transfection. Some toxicity and cell death is expected following chemical transfection. Healthy cells will be adherent and flat, while dead cells or cells in the process of apoptosis will appear round or floating in the cell culture medium.
2. In a biological safety cabinet, aspirate off culture medium from one 35 mm imaging dish into a bottle containing bleach.
a. Wash cells with 2 mL of 1× HBSS imaging buffer prewarmed to 37 °C. Gently add the buffer to the side of the dish to avoid disturbing the cells on the glass.
b. Swirl gently and aspirate off 1× HBSS.
c. Repeat steps D2a–b once more, then add 2 mL of fresh 1× HBSS imaging buffer.
d. Incubate at 37 °C for 5 min prior to imaging.
Note: We suggest performing at least two technical replicates per experiment and three or more independent biological replicates done on different days and with cells at different passage numbers.
3. While cells are incubating in 1× HBSS, turn on the camera, microscope power source, microscope base, light source, incubator, and computer. Allow the incubator to warm to 37 °C. Open the image acquisition software.
Note: For image acquisition and analysis, we use NIS-Elements, a software platform for controlling Nikon microscopes.
4. Configure a time-course protocol for imaging PINK1-SPARK. Ensure that the light source and filter configuration are suitable for imaging PINK1-SPARK (e.g., 480 nm excitation and 520 nm emission). Set the objective to the correct magnification (≥40× preferred for imaging PINK1-SPARK) and imaging interval to 1 min for 2 h.
5. Wet the objective lens with a small drop of immersion oil and mount the imaging dish on the stage using mounting putty (Figure 3). Bring cells into focus and identify a region of a dish with several transfected cells. Once cells have been identified, set a perfect focus.
Note: An area containing three or more healthy cells expressing PINK1-SPARK is suitable for imaging.
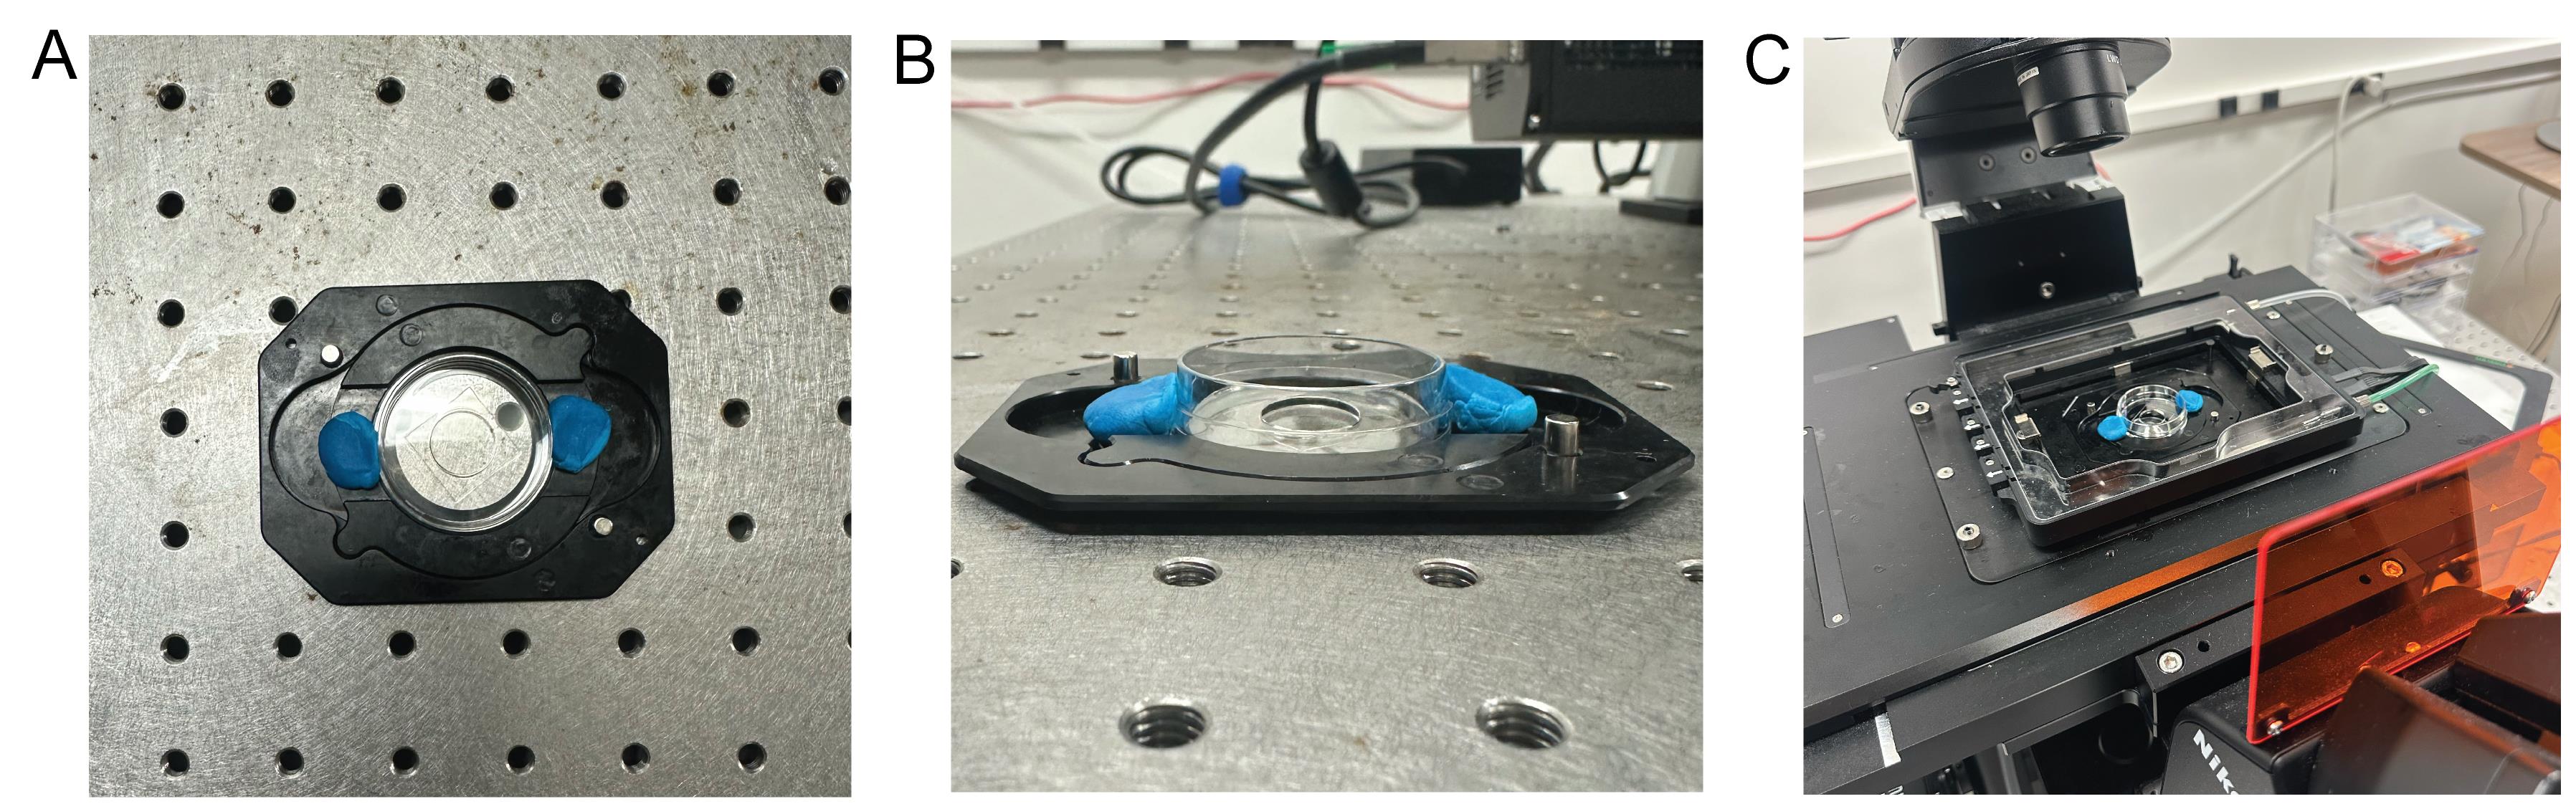
Figure 3. Snapshots of the imaging dish stabilized with mounting putty. (A) Overhead shot of imaging dish stabilized on the plate holder with mounting putty. Two small pieces (~1 cm diameter) are pressed onto the sides of the imaging dish, securing it to the plate holder. (B) Side view of mounted imaging dish. (C) Full setup (mounted imaging dish on the stage of the fluorescence microscope).
E. Data and image acquisition using time-lapse widefield fluorescence microscopy
1. Begin experiment. Collect a time series of the field of view.
2. After acquiring ~3 min of basal activity, pause acquisition to add stimulus to the dish.
3. Remove ~500 μL of imaging medium and add to a microcentrifuge tube containing 2 μL of CCCP (10 μM final), MTK458+CCCP (3.1 μM and 0.5 μM final), or kinetin riboside (KR) (50 μM final). Gently pipette up and down to mix. Recommended concentrations and volumes of each small molecule are summarized in Table 2.
Table 2. Recommended stock concentrations, final concentrations, and volumes of small molecule activators of PINK1
| Small molecule | Stock concentration (mM) | Final/working concentration (μM) | Volume (μL) to treat cells (assuming 2 mL imaging dish) |
|---|---|---|---|
| CCCP | 10 | 10 | 2 |
| MTK458 | 3.1 | 3.1 | 2 |
| CCCP (used with MTK458) | 0.5 | 0.5 | 2 |
| KR | 50 | 50 | 2 |
4. Carefully add dilution to the edges of the imaging dish and pipette up and down to mix.
Note: Ensure media is well mixed, but be careful to avoid pipetting directly on the cells being imaged, as this can cause the cells to lift off the dish.
5. Repeat steps D2–E4 until all dishes have been imaged. Upon completion of data acquisition, export for data analysis.
Note: When imaging multiple dishes, wait until the first time course is done to wash the next dish. Cells will not survive for prolonged periods of time (>1 h) in HBSS.
F. Imaging preparation for end-point confocal microscopy
1. Treat cells with the desired small molecule activator (or DMSO) prior to imaging. Allow cells to incubate with CCCP or MTK+CCCP for 2 h or with KR for 12 h.
2. Repeat steps D1–2 to prepare cells for imaging.
3. While cells are incubating in 1× HBSS, turn on the microscope power source, laser, and computer and turn the laser interlock key to the vertical position (emission light on).
4. Configure the desired excitation laser(s) (e.g., 488 nm with 520 nm emission) and set the objective to the correct magnification (≥40× preferred for imaging PINK1-SPARK).
5. Wet the objective lens with immersion oil and mount the imaging dish on the stage. Bring cells into focus and identify a region of a dish with several transfected cells.
6. Focus and visualize the sample through the eyepiece using fluorescent light.
G. Imaging using confocal microscopy
1. Acquire an image of the selected field of view.
Note: An area containing three or more healthy cells expressing PINK1-SPARK is suitable for imaging; however, more cells are ideal for end-point imaging.
2. Repeat until all dishes have been imaged. Upon completion of data acquisition, export for data analysis.
Note: We recommend that at least 50 cells be imaged per dish for end-point imaging experiments to most accurately represent the population.
H. Imaging with Halo-PINK1-SPARK
1. Prepare the cells for imaging as described in sections D or F.
2. While cells are incubating in HBSS, equilibrate a vial of 1 nmol JF646 to room temperature and add 1 mL of HBSS. Incubate for 2–3 min to dissolve the ligand. This yields a 5× (1 μM) stock solution.
3. Incubate the cells with the Janelia Fluor ligand for 30 min at 37 °C and 5% CO2.
Note: Optimization of concentration and incubation time may be necessary.
4. Configure the desired excitation light or laser depending on the Janelia Fluor being used. For JF646, 646 nm excitation with 664 nm emission should be used.
5. Follow instructions in sections E or G for image acquisition.
Data analysis
A. Set up the segmentation classifier
1. Open FIJI (http://fiji.sc/#) [22].
2. Open the Trainable Weka Segmentation plugin (plugins → segmentation → trainable Weka segmentation).
3. Make a classifier according to the instructions (https://imagej.net/plugins/tws/).
B. Processing of time-course imaging
1. Open FIJI (http://fiji.sc/#).
2. Open the image(s) to be analyzed.
3. Make ROIs around each of the cells to be analyzed and save them to the ROI manager by clicking T.
Note: Ensure that the ROIs cover the whole cell over the entire time course to ensure no information is being lost or added.
4. Open Trainable Weka Segmentation and load the classifier.
5. Once the classifier is loaded, click create result.
Note: The segmentation software may take up to 5 min to complete the task, depending on the number of images taken.
6. Threshold the image (image → adjust → threshold).
7. Select one ROI at a time and use the analyze particles feature (analyze → analyze particles) to measure the number of puncta per cell (Figure 4).
Note: Depending on the features you wish to measure, you can add/take away measurements to be performed (analyze → set measurements). Useful measures used in the original paper include puncta area and integrated density.
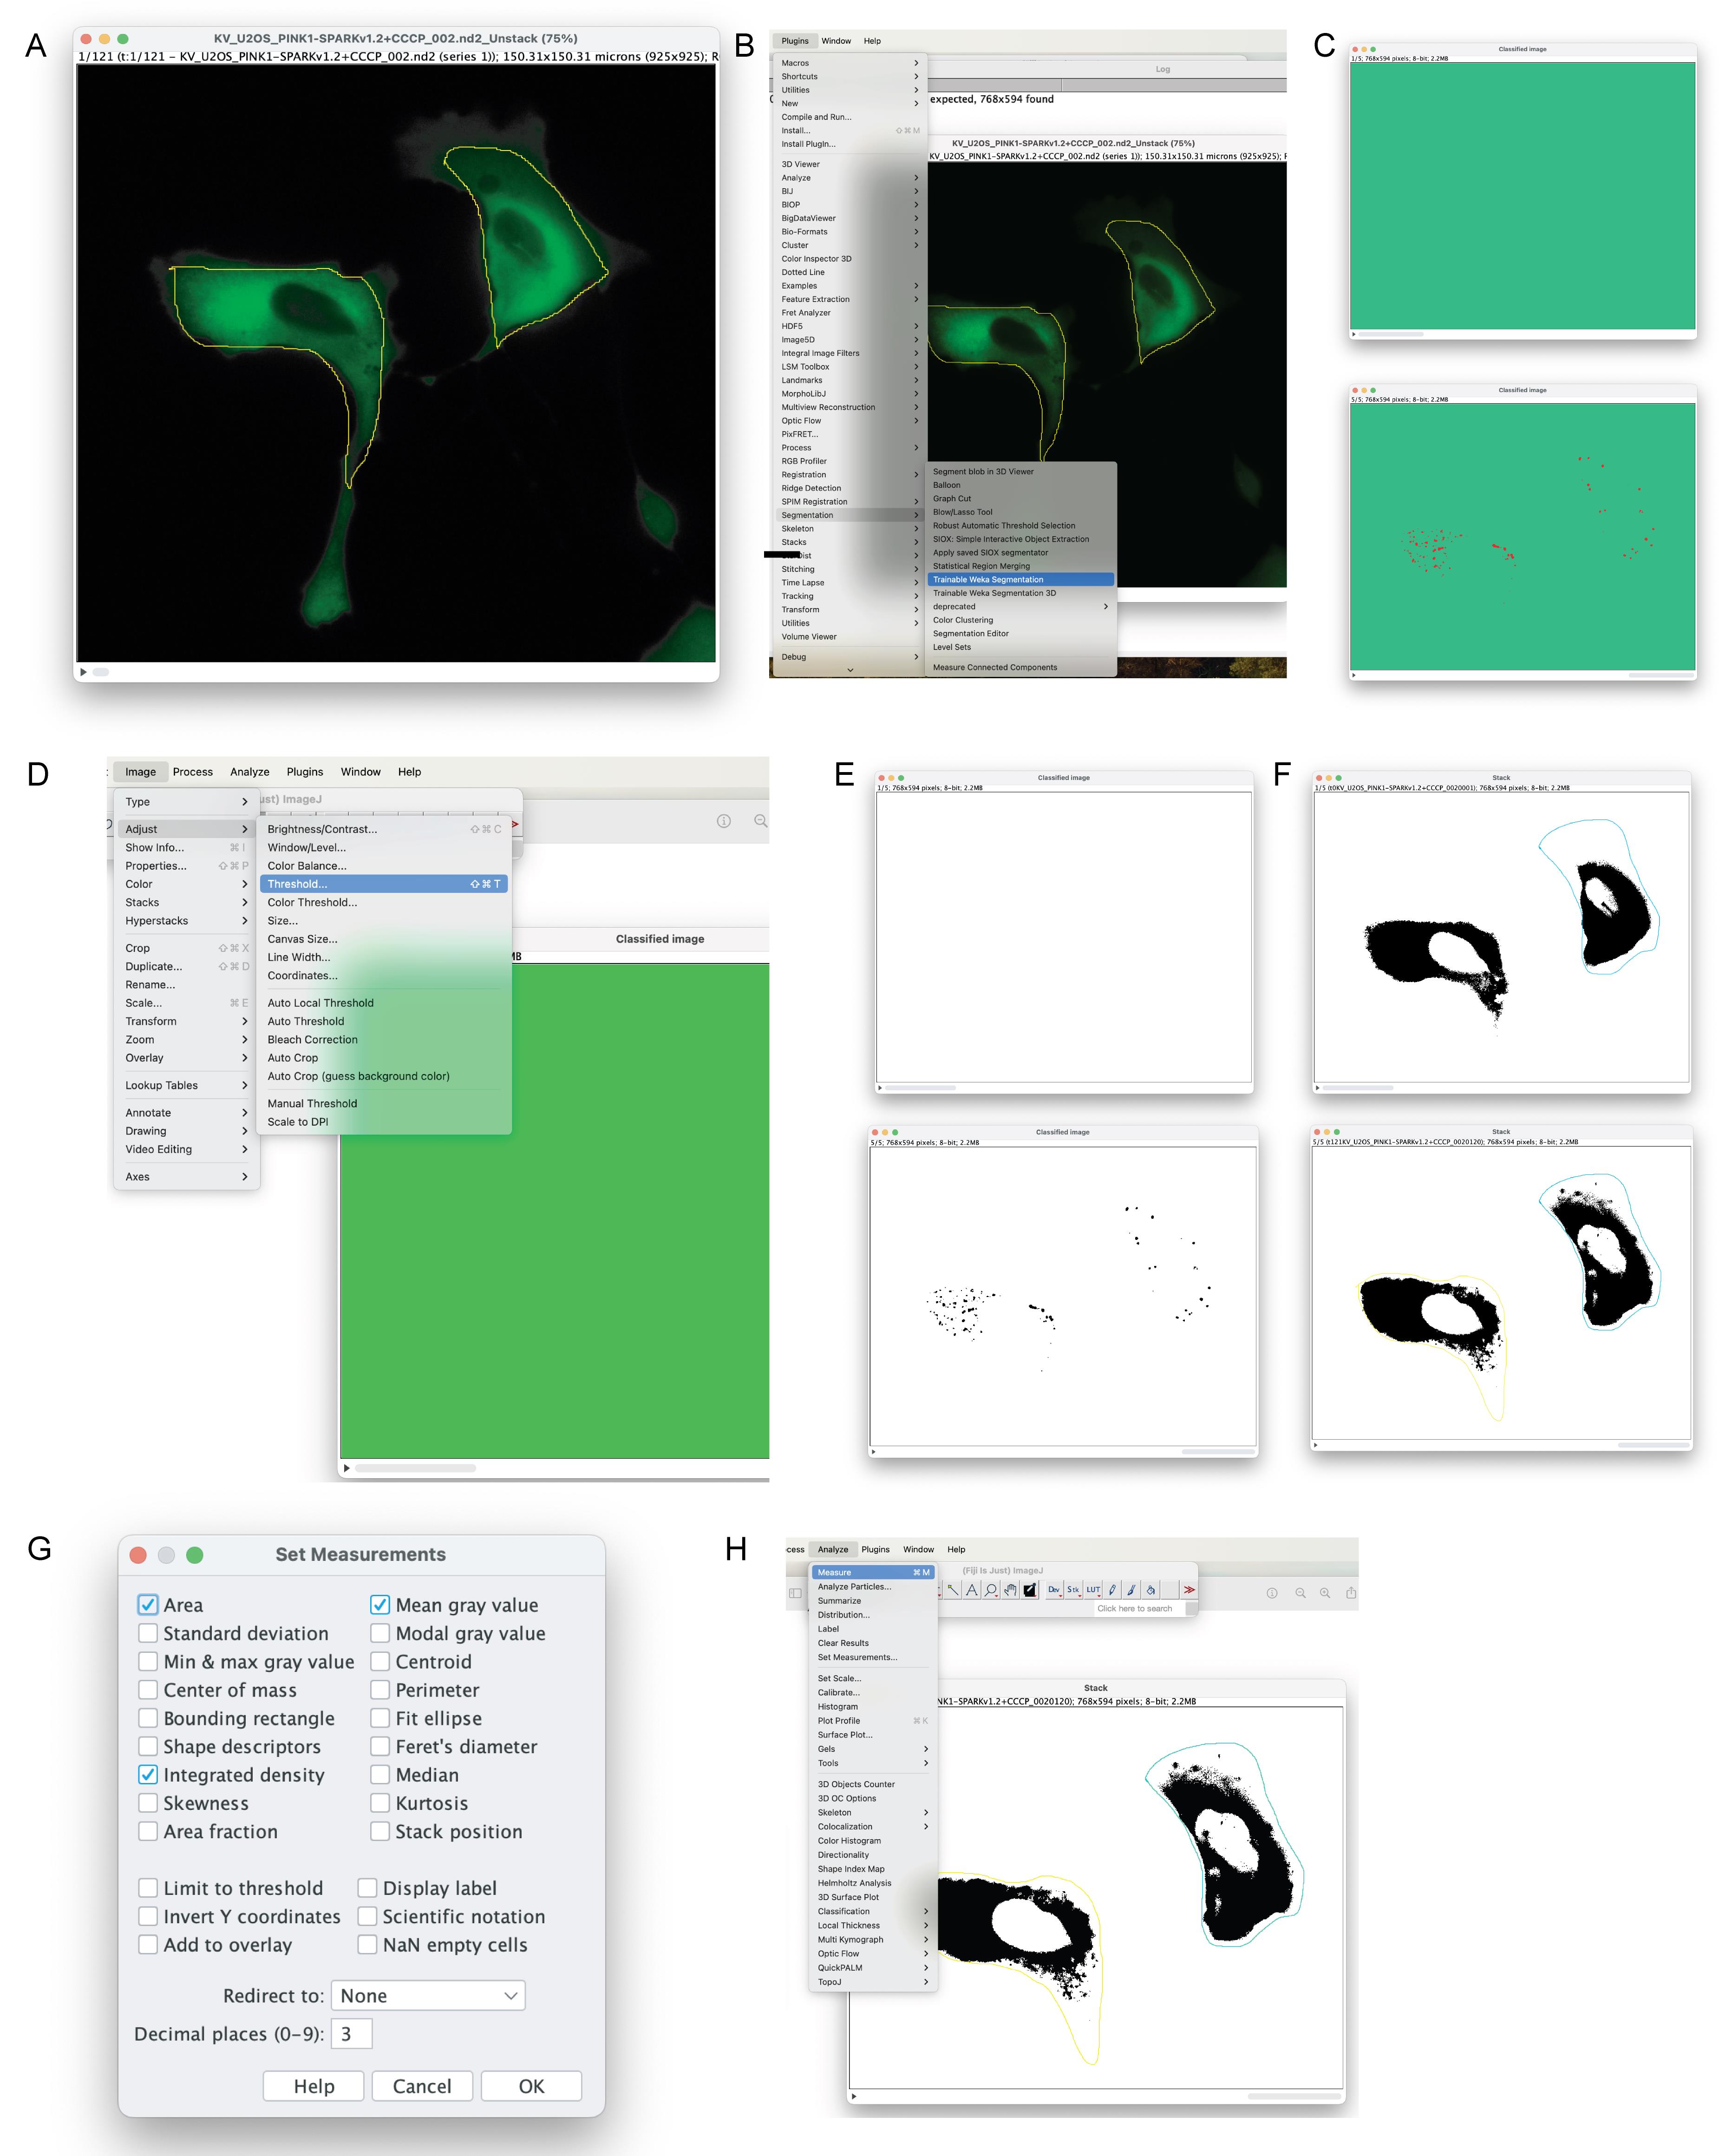
Figure 4. Image analysis of time-course images of PINK1-SPARK. (A) Once the image has been opened in Fiji, draw regions of interest around the cells to be analyzed. (B) Use the Trainable Weka Segmentation plugin to segment PINK1-SPARK puncta from the background signal. (C) Representative images of the segmentation output. Top: Output of image taken immediately prior to 10 μM CCCP addition. Bottom: Output of image taken 120 min after CCCP addition. (D) Threshold the output images. (E) Representative images of thresholded outputs. Top: Output of image taken immediately prior to 10 μM CCCP addition. Bottom: Output of image taken 120 min after CCCP addition. (F) Threshold the original images such that the whole cell is segmented from the background. (G) Set the measurements you wish to take. (H) Take measurements for each ROI in both the whole cell and puncta segmented images and export your data to Excel.
8. Copy and paste measurements into an Excel sheet.
9. Determine SPARK signal for each time point according to Equation 1.
Equation 1
10. Determine the mean SPARK signal at each time point for each cell.
11. Calculate the normalized SPARK signal to 120 min for each cell (or your preferred final time point) according to Equation 2.
Equation 2
12. Plot the normalized SPARK signal for each cell and corresponding standard deviation using GraphPad Prism or similar statistical software (Figure 5).
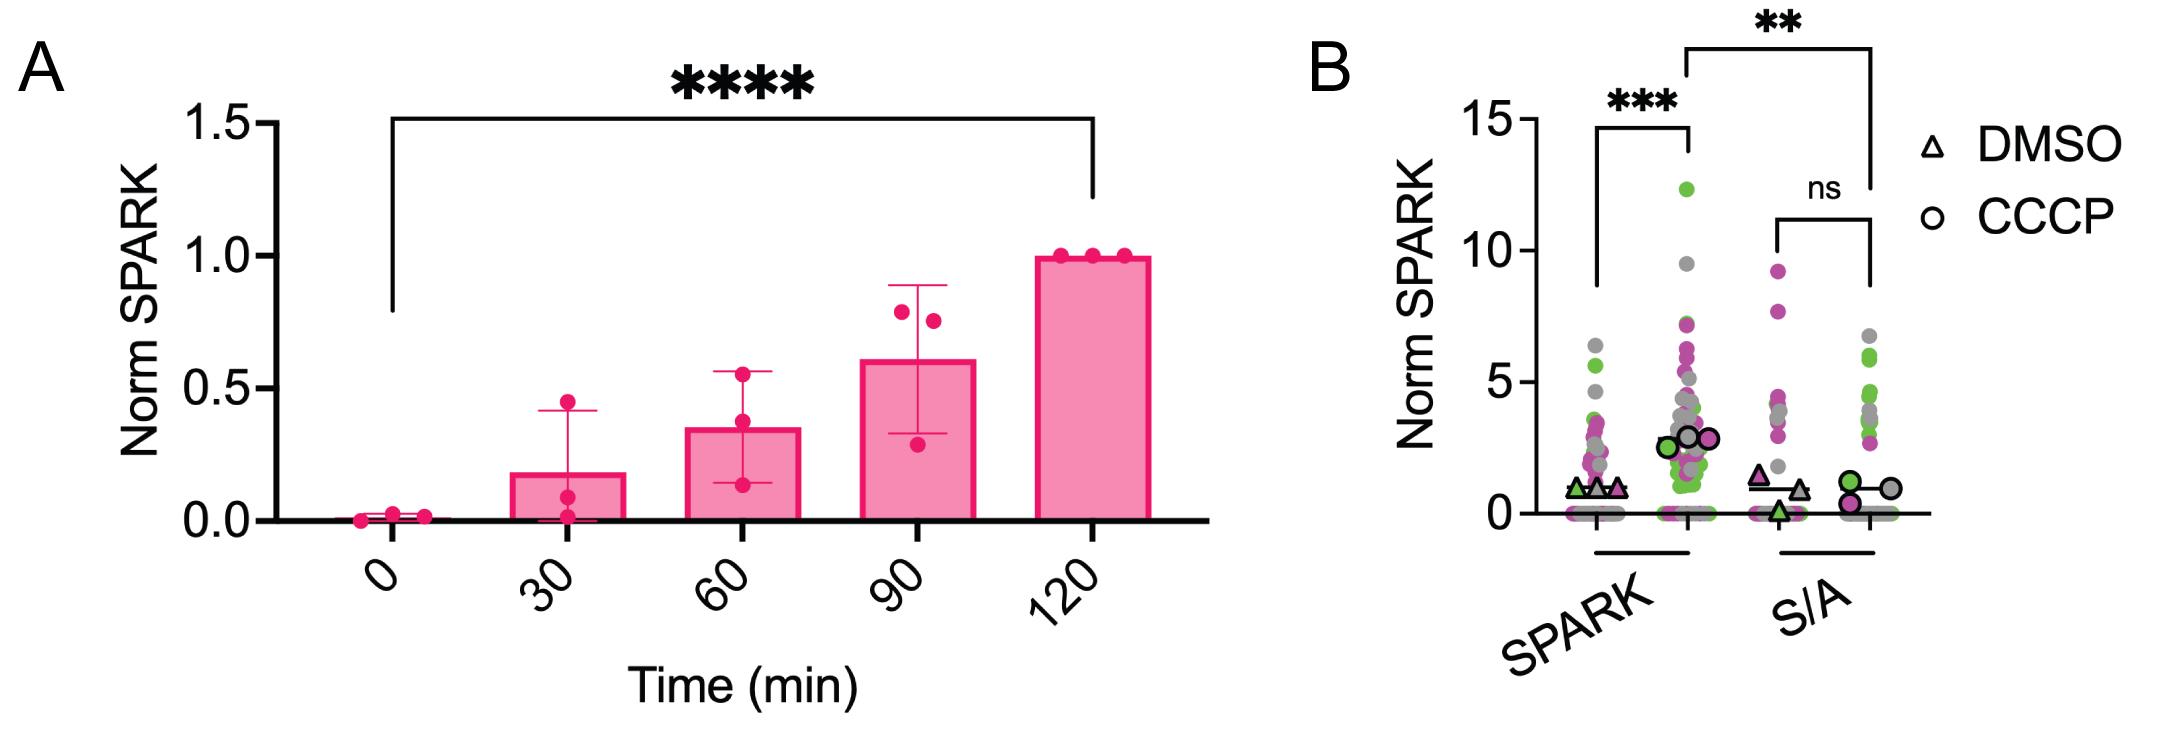
Figure 5. Data visualization for time-course and end-point imaging of PINK1-SPARK. (A) Normalized PINK1-SPARK signal plotted against time after 10 μM CCCP addition (n = 10 cells from 3 experiments; ****p < 0.0001, unpaired t-test). SPARK signal was normalized to the signal at 120 min. (B) Normalized SPARK signal in cells expressing PINK1-SPARK treated with DMSO (n = 191 cells from 3 experiments) or CCCP (n = 224 cells from 3 experiments) or cells expressing the phosphonull mutant (S/A) following treatment with DMSO (n = 156 cells from 3 experiments) or CCCP (n = 143 cells from 3 experiments; **p = 0.0033; **p = 0.0082; ns = 0.7556, ordinary one-way ANOVA). Error bars indicate standard deviation. Adapted from Vineall et al. [1] under a CC BY-NC-ND 4.0 license.
C. Processing of end-point imaging
1. Repeat steps B1–7 for each image to be analyzed.
Note: Importing your images as a stack in Trainable Weka Segmentation allows you to segment all images at the same time.
2. Determine SPARK signal for each time point according to Equation 1.
3. Calculate the normalized SPARK signal according to Equation 3.
Equation 3
4. Plot the normalized SPARK signal for each cell and corresponding standard deviation using GraphPad Prism or similar statistical software (Figure 5b).
Note: Halo-PINK1-SPARK images should be analyzed using the same process.
Validation of protocol
This protocol (or parts of it) has been used and validated in the following research article(s):
• Vineall et al. [1]. Visualizing PINK1 Activity Dynamics with a Phase Separation-Based Kinase Activity Reporter. ACS Sensors. https://doi.org/10.1021/acssensors.5c03859
General notes and troubleshooting
Troubleshooting
Common problems with imaging PINK1-SPARK, possible causes, and solutions can be found in Table 3.
Table 3. Troubleshooting guide for PINK1-SPARK and Halo-PINK1-SPARK
| Problem | Possible cause | Potential solution |
|---|---|---|
| Dim cells or minimal transfection | Poor transfection | Optimize transfection for each cell line, including DNA amount, transfection reagent type, transfection reagent ratio, and transfection reagent medium. Optimize imaging time post-transfection (18–48 h) |
| Halo-PINK1-SPARK: low concentration of HaloTag dye used | Increase the concentration of the HaloTag dye (Janelia Fluor). Some optimization of dye concentration and incubation time may be necessary based on cell type. | |
| Minimal response or slow response | Incorrect drug addition | Ensure medium is well mixed when drug is added; ensure consistency in adding drug between trials or use a perfusion system. |
| Incorrect drug concentration | Optimize the concentration of the drug to be used. Validate concentrations previously used to successfully activate PINK1 via western blotting for ubiquitin and phosphoubiquitin. | |
| Aggregation/clumping of biosensor | Extreme overexpression of PINK1-SPARK | Optimize transfection of PINK1-SPARK, focusing on decreasing the amount of DNA used; optimize the time of imaging post-transfection. |
Acknowledgments
K.G.V. and D.L.S. wrote and edited the protocol. This work was supported by the National Institutes of Health (1DP2GM154012 to D.L.S. and T32GM007185 to K.G.V.).
PINK1-SPARK was developed from [13].
Competing interests
The authors declare no conflicts of interest.
References
- Vineall, K. G., Andrikopoulos, A., Sun, M. J., Yan, A., Hartanto, E. R. and Schmitt, D. L. (2026). Visualizing PINK1 Activity Dynamics in Single Cells with a Phase Separation-Based Kinase Activity Reporter. ACS Sens. 11(2): 1517–1526. https://doi.org/10.1021/acssensors.5c03859
- Narendra, D. P., Jin, S. M., Tanaka, A., Suen, D. F., Gautier, C. A., Shen, J., Cookson, M. R. and Youle, R. J. (2010). PINK1 Is Selectively Stabilized on Impaired Mitochondria to Activate Parkin. PLoS Biol. 8(1): e1000298. https://doi.org/10.1371/journal.pbio.1000298
- Trempe, J. F. and Gehring, K. (2023). Structural Mechanisms of Mitochondrial Quality Control Mediated by PINK1 and Parkin. J Mol Biol. 435(12): 168090. https://doi.org/10.1016/j.jmb.2023.168090
- Wauer, T., Simicek, M., Schubert, A. and Komander, D. (2015). Mechanism of phospho-ubiquitin-induced PARKIN activation. Nature. 524(7565): 370–374. https://doi.org/10.1038/nature14879
- Gladkova, C., Maslen, S. L., Skehel, J. M. and Komander, D. (2018). Mechanism of parkin activation by PINK1. Nature. 559(7714): 410–414. https://doi.org/10.1038/s41586-018-0224-x
- Valente, E. M., Abou-Sleiman, P. M., Caputo, V., Muqit, M. M. K., Harvey, K., Gispert, S., Ali, Z., Del Turco, D., Bentivoglio, A. R., Healy, D. G., et al. (2004). Hereditary Early-Onset Parkinson's Disease Caused by Mutations in PINK1. Science. 304(5674): 1158–1160. https://doi.org/10.1126/science.1096284
- Riboldi, G. M., Frattini, E., Monfrini, E., Frucht, S. J. and Di Fonzo, A. (2022). A Practical Approach to Early-Onset Parkinsonism. J Parkinsons Dis. 12(1): 1–26. https://doi.org/10.3233/jpd-212815
- Hernandez, G., Thornton, C., Stotland, A., Lui, D., Sin, J., Ramil, J., Magee, N., Andres, A., Quarato, G., Carreira, R. S. et al. (2013). MitoTimer: a novel tool for monitoring mitochondrial turnover. Autophagy. 9(11): 1852–1861. https://doi.org/10.4161/auto.26501
- McWilliams, T. G., Prescott, A. R., Allen, G. F., Tamjar, J., Munson, M. J., Thomson, C., Muqit, M. M. and Ganley, I. G. (2016). mito-QC illuminates mitophagy and mitochondrial architecture in vivo. J Cell Biol. 214(3): 333–345. https://doi.org/10.1083/jcb.201603039
- Schmitt, D. L., Mehta, S. and Zhang, J. (2022). Study of spatiotemporal regulation of kinase signaling using genetically encodable molecular tools. Curr Opin Chem Biol. 71: 102224. https://doi.org/10.1016/j.cbpa.2022.102224
- Gest, A. M. M., Sahan, A. Z., Zhong, Y., Lin, W., Mehta, S. and Zhang, J. (2024). Molecular Spies in Action: Genetically Encoded Fluorescent Biosensors Light up Cellular Signals. Chem Rev. 124(22): 12573–12660. https://doi.org/10.1021/acs.chemrev.4c00293
- Zhang, Q., Huang, H., Zhang, L., Wu, R., Chung, C. I., Zhang, S. Q., Torra, J., Schepis, A., Coughlin, S. R., Kornberg, T. B., et al. (2018). Visualizing Dynamics of Cell Signaling In Vivo with a Phase Separation-Based Kinase Reporter. Mol Cell. 69(2): 334–346.e4. https://doi.org/10.1016/j.molcel.2017.12.008
- Erdoğan, Y. C., Pilic, J., Gottschalk, B., Yiğit, E. N., Zaki, A. G., Öztürk, G., Eroğlu, E., Okutan, B., Sommer, N. G., Weinberg, A. M., et al. (2024). Development of a Dual Reporter System to Simultaneously Visualize Ca2+ Signals and AMPK Activity. ACS Sens. 9(9): 4680–4689. https://doi.org/10.1021/acssensors.4c01058
- Li, X., Chung, C. I., Yang, J., Chaudhuri, S., Munster, P. N. and Shu, X. (2023). ATM-SPARK: A GFP phase separation–based activity reporter of ATM. Sci Adv. 9(9): eade3760. https://doi.org/10.1126/sciadv.ade3760
- Rodger, C. E., McWilliams, T. G. and Ganley, I. G. (2017). Mammalian mitophagy – from in vitro molecules to in vivo models. FEBS J. 285(7): 1185–1202. https://doi.org/10.1111/febs.14336
- McWilliams, T. G., Prescott, A. R., Montava-Garriga, L., Ball, G., Singh, F., Barini, E., Muqit, M. M., Brooks, S. P. and Ganley, I. G. (2018). Basal Mitophagy Occurs Independently of PINK1 in Mouse Tissues of High Metabolic Demand. Cell Metab. 27(2): 439–449.e5. https://doi.org/10.1016/j.cmet.2017.12.008
- Rasool, S., Shomali, T., Truong, L., Croteau, N., Veyron, S., Bustillos, B. A., Springer, W., Fiesel, F. C. and Trempe, J. F. (2024). Identification and structural characterization of small molecule inhibitors of PINK1. Sci Rep. 14(1): e1038/s41598–024–58285–3. https://doi.org/10.1038/s41598-024-58285-3
- Schmitt, D. L., Dranchak, P., Parajuli, P., Blivis, D., Voss, T., Kohnhorst, C. L., Kyoung, M., Inglese, J. and An, S. (2023). High-throughput screening identifies cell cycle-associated signaling cascades that regulate a multienzyme glucosome assembly in human cells. PLoS One. 18(8): e0289707. https://doi.org/10.1371/journal.pone.0289707
- Schmitt, D. L., Curtis, S. D., Lyons, A. C., Zhang, J. f., Chen, M., He, C. Y., Mehta, S., Shaw, R. J. and Zhang, J. (2022). Spatial regulation of AMPK signaling revealed by a sensitive kinase activity reporter. Nat Commun. 13(1): e1038/s41467–022–31190–x. https://doi.org/10.1038/s41467-022-31190-x
- Ranzau, B. L., Robinson, T. D., Scully, J. M., Kapelczak, E. D., Dean, T. S., TeSlaa, T. and Schmitt, D. L. (2024). A Genetically Encoded Fluorescent Biosensor for Intracellular Measurement of Malonyl-CoA. ACS Bio Med Chem Au. 5(1): 184–193. https://doi.org/10.1021/acsbiomedchemau.4c00103
- Schindelin, J., Arganda-Carreras, I., Frise, E., Kaynig, V., Longair, M., Pietzsch, T., Preibisch, S., Rueden, C., Saalfeld, S., Schmid, B., et al. (2012). Fiji: an open-source platform for biological-image analysis. Nat Methods. 9(7): 676–682. https://doi.org/10.1038/nmeth.2019
Article Information
Publication history
Received: Mar 16, 2026
Accepted: May 25, 2026
Available online: Jun 14, 2026
Published: Jul 20, 2026
Copyright
© 2026 The Author(s); This is an open access article under the CC BY-NC license (https://creativecommons.org/licenses/by-nc/4.0/).
How to cite
Vineall, K. G. and Schmitt, D. L. (2026). Measuring PINK1 Activity in Single Cells Using a PINK1 Kinase Activity Reporter. Bio-protocol 16(14): e5746. DOI: 10.21769/BioProtoc.5746.

 Download Citation in RIS Format
Category
Neuroscience > Cellular mechanisms > Mitochondria
Cell Biology > Cell imaging > Live-cell imaging
Biochemistry > Protein > Activity
Do you have any questions about this protocol?
Post your question to gather feedback from the community. We will also invite the authors of this article to respond.
 Post a Question


