- Protocols

- Articles and Issues
- For Authors
- About
- Become a Reviewer

Detecting the Activation of Endogenous Small GTPases via Fluorescent Signals Utilizing a Split mNeonGreen: Small GTPase ActIvitY ANalyzing (SAIYAN) System
Published: Vol 16, Iss 1, Jan 5, 2026 DOI: 10.21769/BioProtoc.5557 Views: 556
Reviewed by: David PaulAleksandra J. WierzbaShruthi Balachandra
Original research article
The authors used this protocol in:

Oct 2024
Advertisement


Protocol Collections
Comprehensive collections of detailed, peer-reviewed protocols focusing on specific topics


Abstract
Small GTPases function as molecular switches in cells, and their activation triggers diverse cellular responses depending on the GTPase type. Therefore, visualizing small GTPase activation in living cells is crucial because their activity is tightly regulated in space and time, and this spatiotemporal pattern of activation often determines their specific cellular functions. Various biosensors, such as relocation-based sensors and fluorescence resonance energy transfer (FRET)-based sensors, have been developed. However, these methods rely on interactions between activated GTPases and their downstream effectors, which limits their applicability for detecting activation of GTPases with unknown or atypical effectors. Recently, we developed a novel method utilizing split fluorescence technology to detect membrane recruitment of small GTPases upon activation, designated the Small GTPase ActIvitY ANalyzing (SAIYAN) system. This approach offers a new strategy for monitoring small GTPase activation based on membrane association and is potentially applicable to a wide range of small GTPases, including those with uncharacterized effectors.
Key features
• Visualizes the activation of small GTPases in living cells as mNeonGreen fluorescence signal.
• Can be applied to small GTPases whose effectors have not yet been identified.
• SAIYAN exploits the intrinsic property of small GTPases to associate with cellular membranes upon activation.
Keywords: Small GTPaseGraphical overview
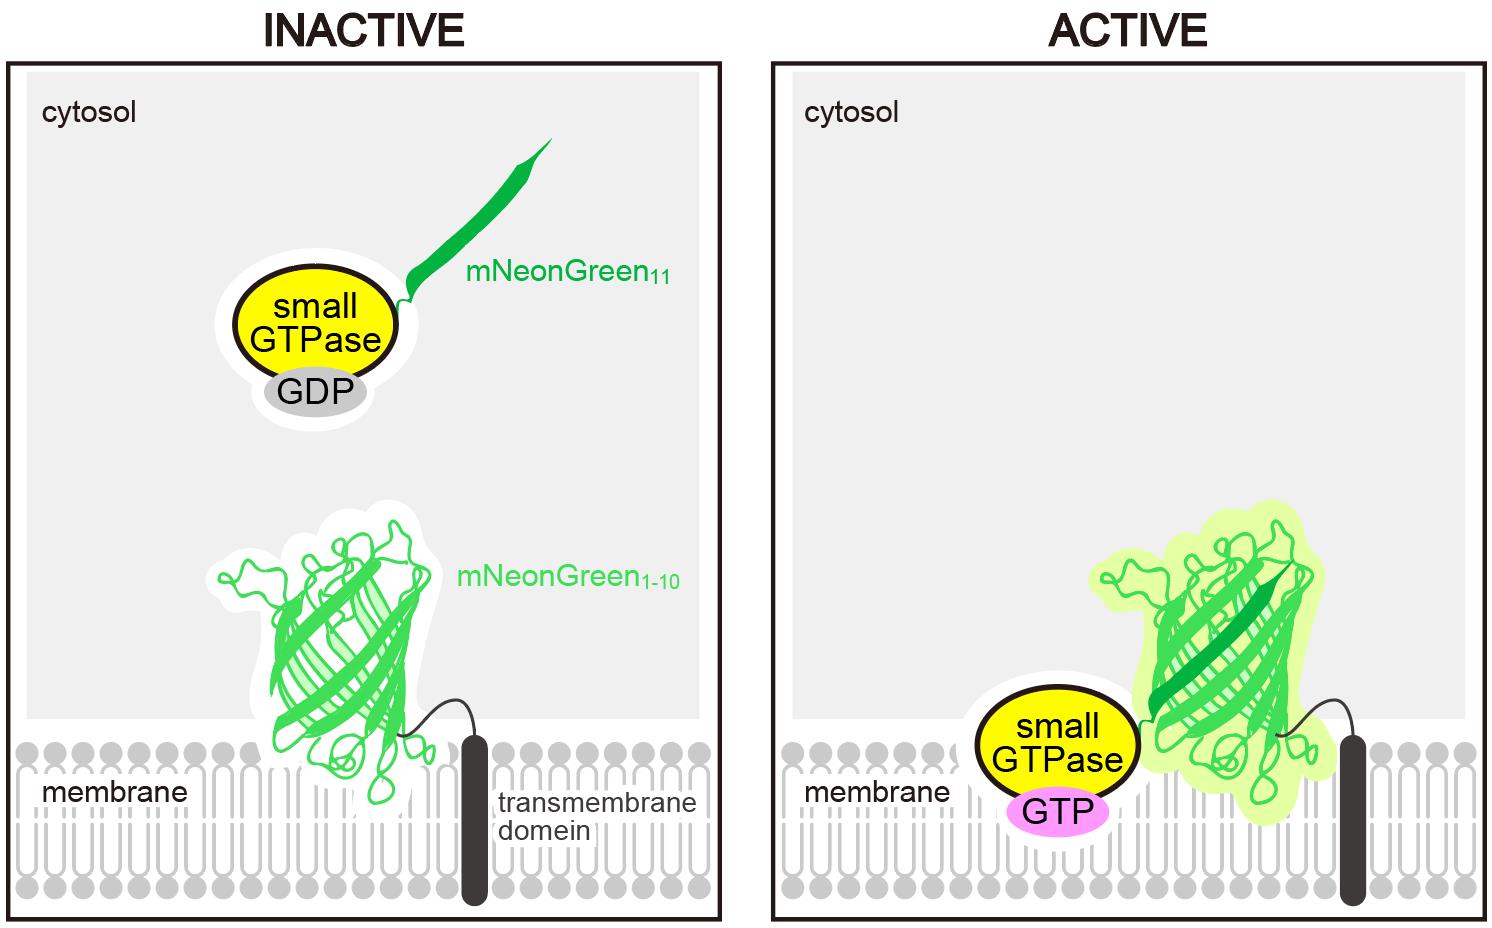
Schematic representation of the Small GTPase ActIvitY ANalyzing (SAIYAN) system. A short fragment of mNeonGreen (mNeonGreen11) is knocked into a small GTPase. Upon activation and membrane localization of the GTPase, mNeonGreen11 complements the remaining portion of mNeonGreen fused to a transmembrane domain, thereby reconstituting a functional fluorescent protein.
Background
Small GTPases function as molecular switches in a wide range of intracellular processes. The GDP-bound form is considered inactive, whereas guanine nucleotide exchange factors (GEFs) catalyze the exchange of GDP for GTP, converting the GTPase to its active form. Activated small GTPases interact with effector proteins to trigger various cellular responses. GTP hydrolysis, which is stimulated by GTPase-activating proteins (GAPs), then returns them to the inactive GDP-bound state. Thus, evaluating the activated form of small GTPases is of critical importance [1].
Several approaches have been developed to quantitatively assess the GTP-bound forms of small GTPases, such as assays using radioisotopes or pull-down techniques [2,3]. However, these methods require cell lysis and therefore cannot reveal the spatial distribution of activated small GTPases in living cells. The Raichu system enables detection of activated Ras using a fluorescence resonance energy transfer (FRET)-based biosensor, but this method requires overexpression of the GTPase itself as well as effector proteins that specifically bind to the GTP-bound state [4]. Relocation sensors, in which small GTPases are fused to fluorescent proteins, allow monitoring of their localization; however, because fluorescence is emitted from both GDP- and GTP-bound forms, background signals are often high [5].
Sar1 is a member of the Arf family of small GTPases that plays a pivotal role in COPII vesicle formation [6]. Upon activation by the GEF Sec12, Sar1 binds to the endoplasmic reticulum (ER) membrane. Membrane-bound Sar1 then recruits the Sec23/24 complex, forming the prebudding complex while concentrating cargo proteins destined for export. Together with Sec13/31, this leads to COPII vesicle budding from the ER membrane. Although Sec23 binds activated Sar1, it also functions as a GAP for Sar1, and thus, no conventional effector proteins for Sar1 exist. Consequently, the localization of activated Sar1 has remained elusive using traditional approaches [7].
We developed a new approach termed the SAIYAN system [8]. This method is based on a split mNeonGreen (mNG) strategy: a short fragment of mNeonGreen11 is fused to Sar1, while the complementary portion of mNG is expressed on the ER membrane. In this configuration, only activated Sar1, which binds to the ER membrane, can reconstitute the fluorescent mNG signal. This enables selective detection of the activated pool of Sar1, even in the absence of conventional effector proteins. Using this system, we revealed that activated Sar1 exhibits a distinctive distribution specifically in collagen-secreting cells [8]. Because this method allows visualization of GTPase activity in a manner dependent on activation state and subcellular localization, it can be broadly applied to other small GTPases whose localization is altered upon activation [9].
In this protocol, we provide a more detailed explanation of the methodology originally described in the previous publication, while also presenting ideas to generalize the approach for other small GTPases beyond Sar1. This overview clarifies the scope and purpose of the protocol and guides readers in adapting the method to different targets.
Materials and reagents
Biological materials
1. HEK293T cells (ATCC, catalog number: CRL-3216)
2. HeLa cells (ATCC, catalog number: CCL-2)
3. BJ-5ta cells (ATCC, catalog number: CRL-4001)
4. PrimeSTAR GXL DNA Polymerase (TAKARA, catalog number: R050A)
5. CUGA7 gRNA Synthesis kit (NIPPON Gene, catalog number: 314-08691)
6. DNeasy Blood & Tissue kit (QIAGEN, catalog number: 69504)
7. In-Fusion HD cloning kit (TAKARA, catalog number: 639649)
8. Guide-it Long ssDNA production system v2 (TAKARA, catalog number: 632666)
9. FastGene Gel/PCR Extraction kit (NIPPON GENE, catalog number: FG-91202)
10. Cas9 (TAKARA, catalog number: 632678)
11. Goat anti-rabbit IgG (H+L) highly cross-adsorbed secondary antibody, Alexa Fluor 488 (Thermo Fisher, catalog number: A-11034)
12. Goat anti-mouse IgG (H+L) highly cross-adsorbed secondary antibody, Alexa Fluor 647 (Thermo Fisher, catalog number: A-21236)
13. pENTR/TRE vector (a gift from Dr. Kenji Kontani, Meiji Pharmaceutical University, Japan)
14. pSLIK-Neo vector (Addgene, catalog number: 25735)
15. pcDNA3.1(+) (Invitrogen, catalog number: V79020)
16. pRSV-Rev vector (Addgene, catalog number: 12253)
17. pMDLg/pRRE vector (Addgene, catalog number: 12251)
18. pMD2.G vector (Addgene, catalog number: 12259)
Reagents
1. D-MEM (SHIMADZU, catalog number: 05915)
2. Lipofectamine RNAi Max Transfection Reagent (Thermo Fisher, catalog number: 13378150)
3. DMEM (4.5 g/L Glucose) with L-Gln, sodium pyruvate, and 1.5 g/L sodium hydrogen carbonate, liquid (Nacalai, catalog number: 16971-55)
4. Medium 199 (Sigma, catalog number: M4530-500ML)
5. Fetal bovine serum (FBS) (Gibco, catalog number: 12662-029)
6. 0.5 g/L Trypsin/0.53 mM EDTA solution, with phenol red (Nacalai Tesque, catalog number: 32778-34)
7. Opti-MEM (Thermo Fisher, catalog number: 31985070)
8. Lipofectamine 2000 transfection reagent (Thermo Fisher, catalog number: 11668019)
9. Polyethylenimine, linear MW (25,000) (Polysciences, catalog number: 23966)
10. FuGENE 4K transfection reagent (Promega, catalog number: E5911)
11. GatewayTM LR ClonaseTM II enzyme mix (Thermo Fisher, catalog number: 11791020)
12. Polybrene solution (10 mg/mL) (Nacalai Tesque, catalog number: 12996-81)
13. Doxycycline hydrochloride n-hydrate (Fujifilm WAKO, catalog number: 049-31121)
14. Antibiotic G418 sulfate (Nacalai Tesque, catalog number: 08973-14)
15. NucleoSpin Gel and PCR Clean-Up kit (Macherey-Nagel, catalog number: 740609.50)
16. BSA (Sigma, catalog number: A7906)
17. NaN3 (Nacalai Tesque, catalog number: 31233-42)
18. PBS(-)
19. MilliQ
20. Anti-HA high affinity (3F10) (Roche, catalog number: 11867423001)
21. Goat anti-rat IgG (H+L) cross-adsorbed secondary antibody, Alexa FluorTM 568 (Thermo Fisher, catalog number: A-11077)
22. L-ascorbic acid phosphate magnesium salt n-hydrate (Fujifilm WAKO, catalog number: 013-12061)
23. Methanol (Nacalai Tesque, catalog number: 21915-93)
24. 4% paraformaldehyde (PFA) phosphate buffer solution (Nacalai Tesque, catalog number: 09154-56)
25. PermaFluor aqueous mounting medium (Epredia, catalog number: TA-030-FM)
Solutions
1. DMEM supplemented with 10% FBS (see Recipes)
2. Blocking buffer (see Recipes)
Recipes
1. DMEM supplemented with 10% FBS
| Reagent | Final concentration | Quantity or volume |
|---|---|---|
| D-MEM | 500 mL | |
| FBS | 10% (v/v) | 50 mL |
2. Blocking buffer
| Reagent | Final concentration | Quantity or volume |
|---|---|---|
| BSA | 5% (w/v) | 25 g |
| NaN3 | 0.1% (w/v) | 0.5 g |
| PBS(-) 10× | 1× | 50 mL |
| MilliQ | top up to 500 mL |
Laboratory supplies
1. Adjustable micropipettes set, 0.1–1,000 μL
2. 50 mL tubes (Corning, catalog number: 430829)
3. 15 mL tubes (Corning, catalog number: 430791)
4. 1.5 mL tubes (BIOBIK, catalog number: ST-0150F)
5. 1.5 mL tubes (BIOBIK, catalog number: RC-0150)
6. 5 mL tubes (BIOBIK, catalog number: ST-500)
7. 5 mL pipettes (Greiner, catalog number: 606180)
8. 10 mL pipettes (Greiner, catalog number: 607180)
9. 25 mL pipettes (Greiner, catalog number: 760180)
10. 100 mm TC-treated culture dish (Corning, catalog number: 430167)
11. 60 mm TC-treated culture dish (Corning, catalog number: 430166)
12. Cell culture plate 6-well (WATSON, catalog number: 197-06CPS)
13. Cell culture plate 24-well (Corning, catalog number: 197-24CPS)
14. Tissue culture dish (surface: Cell+) (SARSTEDT, catalog number: 83.3902.300)
15. 0.22 µm syringe filter (gamma sterilized) (Membrane Solutions, catalog number: 61-9639-01)
16. 12 mm microscope cover glasses (thickness 0.13–0.16 mm) (Paul Marienfeld, catalog number: 0111520)
Equipment
1. Biosafety cabinet (PHCbi, catalog number: MHE-S1301A2)
2. Bioclean bench (PHCbi, catalog number: MCV-B131F)
3. CO2 incubator (PHCbi, catalog number: MCO-230AICUV)
4. Biomedical freezer (PHCbi, catalog number: MDF-MU539H)
5. Neon transfection system (Thermo Fisher, catalog number: MPK5000)
6. Vortex mixer (Scientific Industries, catalog number: SI-0286)
7. Centrifuge (KUBOTA, catalog number: S300T)
8. Cell sorter (BD Biosciences, model: BD FACS Melody)
9. Confocal microscope (Carl Zeiss, model: LSM900 with Airyscan2)
Software and datasets
1. ZEN Blue (Carl Zeiss, https://www.zeiss.com/microscopy/en/products/software/zeiss-zen.html) for microscopic image acquisition
2. ImageJ/Fiji for image analysis
3. Prism 10 for data analysis
Procedure
A. Validation of the construction
The first step is to validate the SAIYAN constructs. The SAIYAN system consists of two constructs (Figure 1):
Construct A: Generated by fusing the mNG1-10 sequence to an HA tag sequence and the transmembrane domain of a protein that localizes to the target organelle (in our case, a 1–92 aa region of TANGO1S).
Construct B: Generated by inserting the mNG11 sequence, along with a FLAG tag sequence and linkers of various lengths (see Troubleshooting), at the N-terminal or C-terminal of the target small GTPase (in our case, the C-terminal of Sar1a).
Notes:
1. The sequences of mNG1–10 and mNG11 were synthesized based on Feng et al. [11].
2. It is known that small GTPases undergo lipid modification at their N-terminal or C-terminal regions. Inserting mNG11 at these locations may disrupt correct localization. Therefore, it is recommended to insert mNG11 at the terminal regions that are known to show correct localization when tagged with small molecular tags, as these regions typically maintain the native localization of the protein.
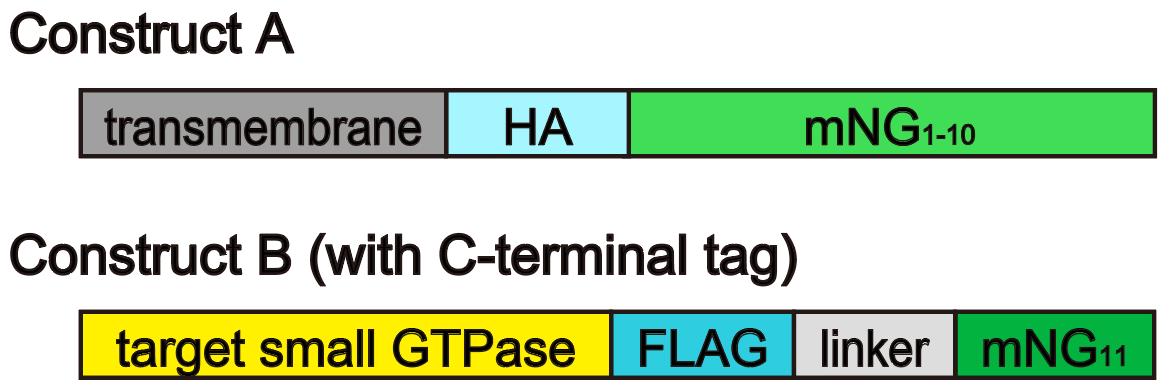
Figure 1. Schematic of the SAIYAN system construct
Before generating a stable SAIYAN cell line, these constructs are cloned into an expression vector such as pcDNA3.1(+) and transiently transfected into cells to confirm that the SAIYAN system works properly, i.e., that the SAIYAN signal is detected at the intended subcellular location (Figure 2). The following protocol describes the procedure for transiently transfecting HeLa cells with SAIYAN constructs using lipofection.
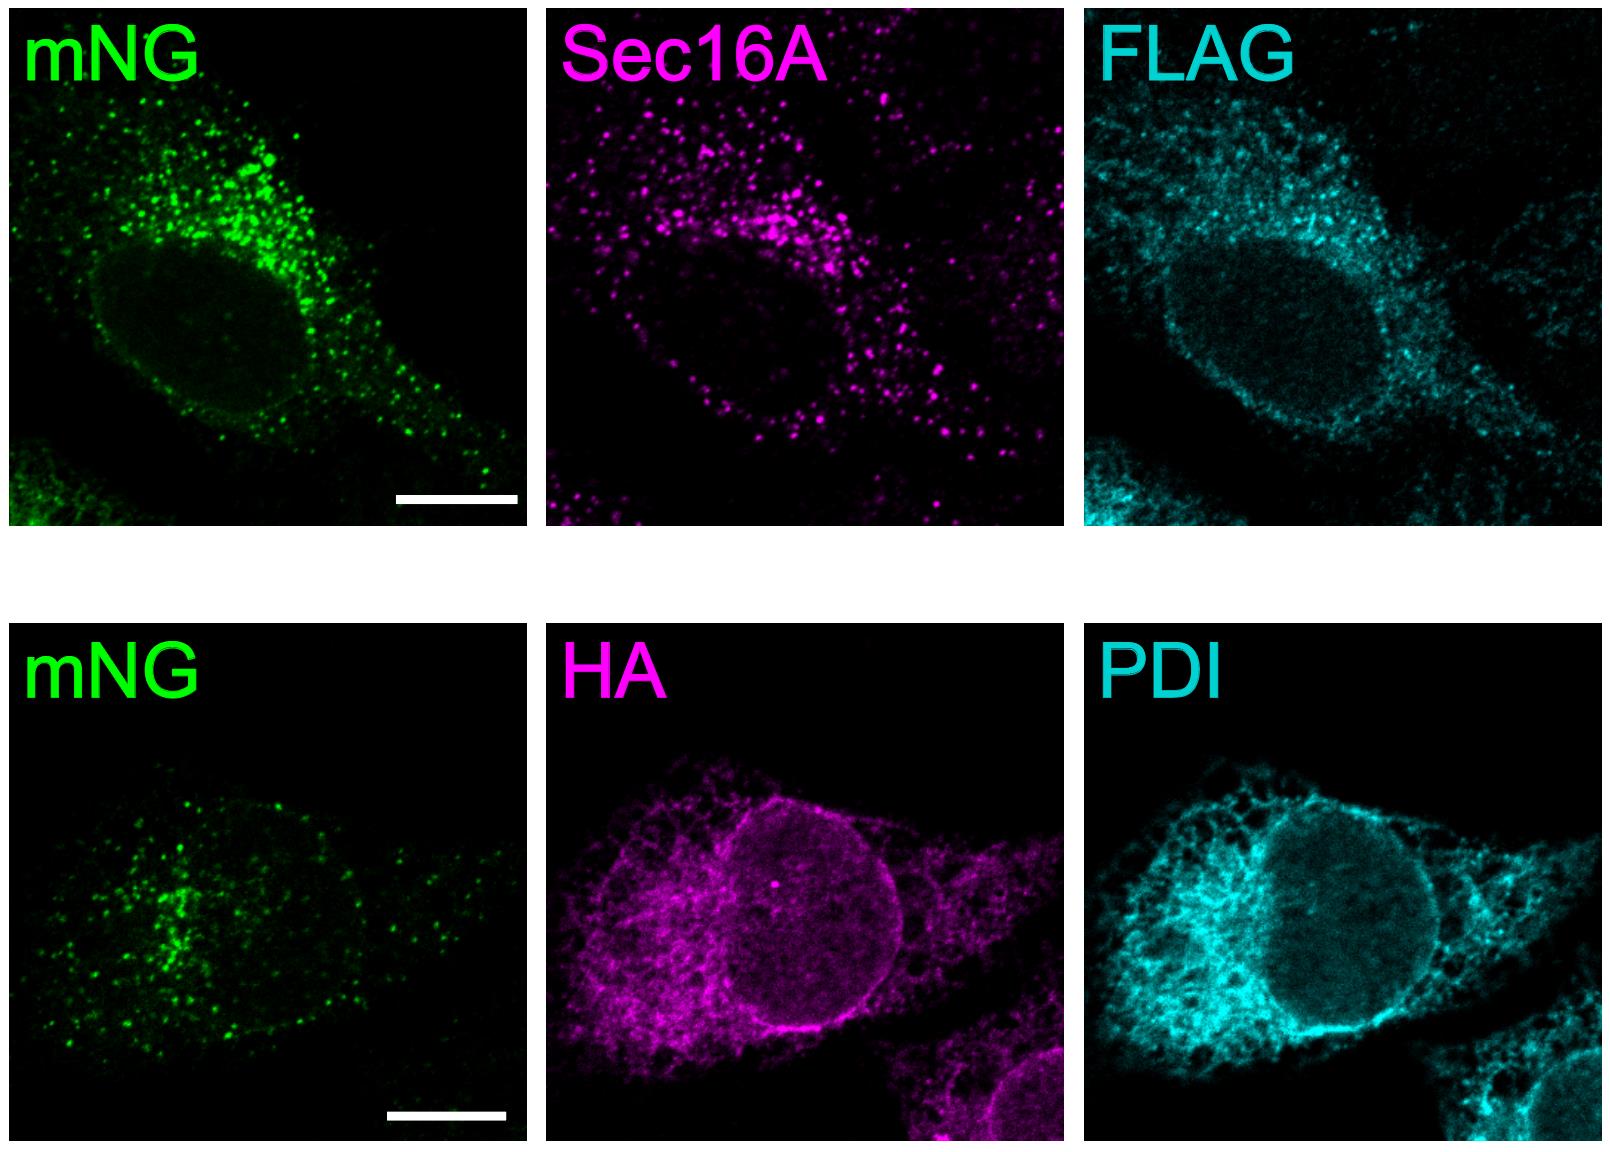
Figure 2. Validation of the Sar1A-SAIYAN construct. SAIYAN constructs (constructs A and B) were transfected into HeLa cells, followed by fixation and staining with the indicated antibodies. Images were acquired using an LSM900 microscope. Scale bars, 10 μm. FLAG (construct A) was colocalized with the ER exit site marker Sec16A, whereas HA (Construct B) was colocalized with the ER marker PDI. The mNG signal showed colocalization with Sec16A rather than PDI, indicating that Sar1A is activated at the ER exit sites. ©2024 Maeda et al. [8]. Originally published in Journal of Cell Biology (2024), DOI: 10.1083/jcb.202403179. SAIYAN: Small GTPase ActIvitY Analyzing system. ER, endoplasmic reticulum.
1. Seed HeLa cells onto 12 mm coverslips in a 24-well dish, aiming for approximately 20% confluence.
Note: Although SAIYAN can be applied to any cell line, we recommend using cells with high transfection efficiency, such as HeLa cells, for construct validation.
2. Incubate for 24 h. Replace the medium with 500 μL/well of fresh DMEM supplemented with 10% FBS.
3. In a sterile 1.5 mL tube, add 25 μL of Opti-MEM, 250 ng of plasmid DNA for construct A, and 250 ng for construct B.
4. Add 3 μL of FuGENE 4K to the tube from step A3 and mix the solution by pipetting several times.
5. Incubate the mixture at room temperature for 15 min.
6. Add the mixture dropwise to the cells and incubate for 24 h.
7. Remove the culture medium and wash the cells with PBS.
8. Add 600 μL of methanol pre-chilled to -30 °C and incubate at -30 °C for 6 min by placing the cell-cultured dish in a freezer.
9. Wash the cells with PBS three times consecutively.
10. Apply the mounting medium onto the coverslips, then mount the glass slides on top.
11. Observe intracellular mNG fluorescence signals under a microscope.
Notes:
1. Confocal images were acquired using an LSM 900 microscope (Carl Zeiss) equipped with a 63× oil immersion objective lens (NA 1.4). mNeonGreen was excited with a 488 nm laser, and emission was collected at 450–570 nm. All observations were performed at room temperature, and images were obtained using Zen Blue software.
2. In cases where no signal is observed, perform immunostaining with HA or FLAG antibodies to verify the expression and proper localization of construct A and construct B, respectively.
3. If the conditions under which mNG signal enhancement occurs upon small GTPase activation are unknown (e.g., when the activation conditions for the target small GTPase are unclear), we will test the mNG signal change by transiently expressing mutants that fail to localize to the membrane due to the absence of lipid modification sites, as well as inactive mutant forms. These will be compared to wild-type or activated mutant forms to observe changes in the mNG signal for each linker length. We used a similar approach when applying this system to Sar1 [8].
B. Establishment of mNG1-10-expressing cells
Note: To create a cell line stably expressing mNG1-10, we obtained a third-generation tet-inducible lentiviral vector from Addgene, which we modified for our use [10]. This method requires one additional step, as the expression of the construct is induced only after the addition of doxycycline. However, by adjusting the doxycycline concentration, the expression level can be partially controlled. This approach is also beneficial when introducing constructs with potential cytotoxicity. Depending on the purpose, it is recommended to choose whether to express the construct stably or transiently.
1. The construct, in which mNG1-10 is fused to the transmembrane domain of a protein localized to the validated target organelle in A, is cloned into the pENTR/TRE vector, and subsequently transferred to the pSLIK-Neo vector using the Gateway system with LR Clonase.
2. Culture HEK293T cells in a 10 cm tissue culture dish (surface: Cell+) until they reach 100% confluence. Before transfection, replace the medium with 5 mL of fresh DMEM supplemented with 10% FBS.
Note: HEK293T cells were used for virus production because of their high transfection efficiency and robust viral particle assembly capacity.
3. In a sterile 5 mL tube, mix 1.5 mL of Opti-MEM with 60 μL of polyethylenimine (PEI) and incubate at room temperature for 5 min.
4. In a separate sterile tube, add 1.5 mL of Opti-MEM and the plasmids (pSLIK vector and other viral packaging vectors) at the ratios indicated in Table 1.
Table 1. Vectors used for virus packaging
| Plasmid | Quantity (μg) |
| pSLIK-Neo vector | 4 |
| pRSV-Rev | 3 |
| pMDLg/pRRE, | 3 |
| pMD2.G | 2.1 |
5. Add the PEI–Opti-MEM mixture prepared in step B3 to the tube prepared in step B4.
6. Incubate the mixture at room temperature for 20 min.
7. Add the mixture dropwise to HEK293T cells.
8. Incubate the transfected cells for 48 h in a CO2 incubator at 37 °C with 5% CO2.
Caution: Since the culture medium generated in step B8 contains lentivirus, all procedures should be performed in a Biosafety Level 2 environment. Carefully dispose of waste materials, including used equipment from step B9 to step B14.
9. Collect the culture medium and filter it through a 0.22 μm filter.
10. Add the filtered medium to the culture medium of target cells (in our case, either HeLa cells or BJ-5ta cells) grown in a 10 cm dish.
Note: Adjust the target cells’ confluence to approximately 20% at this stage.
11. Add polybrene to a final concentration of 10 μg/mL.
12. Incubate for 48 h in a CO2 incubator at 37 °C with 5% CO2.
13. Add G418 to the culture medium at a final concentration of 100–1,000 μg/mL. Adjust the concentration according to the specific cell lines.
14. Continue culturing the cells in the presence of G418 until no dead cells are detected and cell proliferation is observed.
Note: This process typically takes about 7–10 days.
15. To confirm the expression of the mNG1-10 construct, seed a portion of the cells from step B14 onto 12 mm coverslips placed in a 24-well dish at approximately 20% confluence.
16. Incubate for 24 h in a CO2 incubator at 37 °C with 5% CO2.
17. Replace the medium with 500 μL/well of fresh DMEM supplemented with 10% FBS and 1,000 ng/mL doxycycline.
18. Incubate for 24 h in a CO2 incubator at 37 °C with 5% CO2.
19. Remove the culture medium and wash the cells with PBS.
20. Fix the cells with 600 μL of methanol pre-chilled to -30 °C and incubate at -30 °C for 6 min by placing the cell-cultured dish in a freezer.
21. Wash the cells with PBS three times consecutively.
22. Add 250 μL/well of blocking buffer and incubate at room temperature for 15 min.
23. Remove the blocking buffer and add primary antibody [anti-HA high affinity (3F10), 1:250 dilution in blocking buffer].
24. Incubate for 1 h at room temperature.
25. Wash the cells with PBS and add secondary antibody [goat anti-rat IgG (H+L) cross-adsorbed secondary antibody, Alexa FluorTM 568, 1:2,000 dilution in blocking buffer].
26. Incubate for 1 h at room temperature.
27. Wash the cells with PBS.
28. Apply the mounting medium onto the coverslips, then mount the glass slides on top.
29. Observe intracellular fluorescence signals using a fluorescence microscope (excitation at 561 nm). If more than 50% of the cells express the construct, proceed to section C.
C. Preparation of sgRNA for CRISPR-Cas9 editing
Note: The preparation of sgRNA was performed by overlapping PCR following the protocols described previously [11–13]. For the selection of the target sequence of the sgRNA against Sar1, we directly referred to the sequence used by OpenCell, which successfully tagged Split mNeonGreen2 [14]. For other small GTPases, sequences that have already been constructed in this publication can also be used as references [14]. For small GTPases not available in OpenCell, databases such as CHOPCHOP are useful for designing knock-in targets [15].
1. Primer synthesis: Synthesize the following two primers:
a. BS7R (part of the crRNA/tracerRNA sequence):
5′-AAA AAA AGC ACC GAC TCG GTG C-3′
b. ML611R (crRNA/tracerRNA sequence):
5′-AAA AAA AGC ACC GAC TCG GTG CCA CTT TTT CAA GTT GAT AAC GGA CTA GCC TTA TTT AAA CTT GCT ATG CTG TTT CCA GCA TAG CTC TTA AAC-3′
2. Insertion of the sgRNA sequence: Insert the sgRNA sequence between the T7 promoter sequence and the region complementary to the 3′ end of ML611R. To improve the efficiency of in vitro transcription, follow the Guide-it sgRNA In Vitro Transcription and Screening Systems (TAKARA) protocol by adding an extra CCTC sequence upstream of the T7 promoter. Depending on the first nucleotide(s) of the target sequence, add G bases between the T7 promoter and the target sequence as follows:
a. If the target sequence does not begin with G, add two Gs.
b. If the target sequence begins with a single G, add one additional G.
c. If the target sequence begins with two Gs, no G is added.
In the present case, since the target sequence contains no G at all, two G nucleotides were added. For example, in the case of Sar1A, the following primers were designed:
Sar1a_sgRNA_F:
5′-CCT CTA ATA CGA CTC ACT ATA GGC AAT ATA CTG GGA GAG CCA GGT TTA AGA GCT ATG CTG GAA-3′
Double underlined sequence: T7 promotor sequence including extra sequence.
Plain sequence: added two Gs.
Underlined sequence: Sar1a target sequence.
Dashed underlined sequence: Sequence complementary to ML611R for annealing.
3. Overlapping PCR: Perform overlapping PCR using In Vitro Transcription and Screening Systems (TAKARA) or CUGA7 gRNA Synthesis kit (NIPPON GENE) as a reference. A typical 50 μL reaction mixture is shown in Table 2.
Table 2. Composition of the reaction mixture for overlapping PCR
| Component | Volume |
|---|---|
| 5× PrimeStar GXL buffer (Mg2+ Plus) | 10 μL |
| 2.5 mM dNTPs | 5 μL |
| BS7R (10 μM) | 2 μL |
| ML611R (0.1 μM) | 2 μL |
| Sar1a_sgRNA_F (10 μM) | 2 μL |
| PrimeStar GXL DNA polymerase (1.25 U/μL) | 1 μL |
| Distilled water (DDW) | 38 μL |
| Total | 50 μL |
PCR cycling conditions:
98 °C for 2 min
35 cycles of:
98 °C for 10 s
55 °C for 15 s
68 °C for 30 s
4. DNA purification: Purify the PCR product using the FastGene Gel/PCR Extraction kit according to the manufacturer’s instructions to obtain clean DNA for subsequent in vitro transcription.
5. In vitro transcription: Perform in vitro transcription using the DNA generated in step C4 as a template, with the CUGA7 gRNA Synthesis kit, according to the manufacturer’s protocol.
D. Preparation of ssODN for CRISPR-Cas9 knock-in
Notes:
1. To prepare the single-stranded oligodeoxynucleotides (ssODNs) for knock-in, the relevant genomic DNA region of the target small GTPase was first isolated and cloned into a plasmid. Next, a restriction enzyme site was introduced immediately before the knock-in site (in this case, just before the stop codon), and the knock-in sequence (here, the FLAG tag with linker sequence and mNG11) was inserted. This plasmid then served as a template to produce single-stranded DNA using an ssDNA preparation kit.
2. Both sense and antisense single-stranded DNA can be prepared; since it is not clear which orientation will be more successful, it is recommended to prepare both.
1. Preparation of genomic DNA: Genomic DNA was purified from cultured cells (here, HeLa cells in a 6 cm dish) using the DNeasy Blood & Tissue kit according to the manufacturer’s protocol.
2. Cloning of the target genomic DNA: To construct the donor plasmid for homology-directed repair, the Sar1 genomic template was amplified from the genomic DNA purified in step D1 using the following primers:
a. 5′-CCG CTC TAG AAC TAG TAC CCA AAT GAG CTC TGG C-3′
b. 5′-CGG TAT CGA TAA GCT TGC ATC AGT ATT AAA TAC ACA TG-3′
The PCR product (~1,000 bp) was cloned into pBSIISK(-) using the In-Fusion HD Cloning kit. It is recommended to clone a genomic region of approximately 1,000 bp.
3. Introduction of the knock-in sequence: To insert the desired knock-in sequence into the genomic DNA, a restriction enzyme recognition site was introduced at the intended insertion site (in this case, immediately upstream of the Sar1 stop codon; BamHI was used). The knock-in cassette—comprising the FLAG tag, a GS linker (GGGS), and the mNG11 sequence—was then inserted at this site.
4. Preparation of ssODN: ssODNs were generated from the knock-in template created in step D3 using the Guide-it Long ssDNA Production System v2 according to the manufacturer’s protocol. PCR was performed using primers in which only one primer was phosphorylated. As the optimal strand orientation for efficient genome editing was unknown, both phosphorylated and non-phosphorylated primers were prepared to generate two types of single-stranded DNA.
a. Primer synthesis:
i. Synthesize both phosphorylated and non-phosphorylated primers.
ii. The primer sequences we used are as follows:
5′-GCA TCA GTA TTA AAT ACA CAT G-3′ and 5′-ACC CAA ATG AGC TCT GGC CTC CAT ATC-3′
b. PCR amplification
i. Perform PCR using primers with phosphorylation on only one side, following the manufacturer’s protocol.
ii. Purify the PCR products using the NucleoSpin Gel and PCR Clean-Up kit, as instructed.
c. ssDNA generation: Produce ssDNA by performing the strand-displacement reaction with Strandrase, following the instructions of the Guide-it Long ssDNA Production System v2.
d. Purification of ssDNA: Purify the resulting ssDNA using the NucleoSpin Gel and PCR Clean-Up kit, taking care to use the appropriate buffer specified for ssDNA purification, which differs from the buffer used in step D2.
E. Electroporation
1. In a sterile 1.5 mL tube, incubate 7.5 pmol of recombinant Cas9 with 7.5 pmol of sgRNA at room temperature for 20 min prior to transfection. Because the Neon system has a volume limitation, prepare the mixture at the highest possible concentration (ideally, ≤1 μL).
2. Detach the target cell line (generated in section B) by trypsinization and resuspend in Buffer R (included with the Neon Transfection System) at a density of 1 × 10⁵ cells/10 μL.
3. Add the cell suspension from step E2 and 0.64 pmol of ssODN to the tube from step E1 and mix by pipetting several times.
4. Load the mixture into a 10 μL Neon tip, avoiding air bubbles.
5. Apply electroporation using the appropriate protocol. Since optimal voltage and pulse settings differ depending on the cell line, refer to the protocols provided by Thermo Fisher. For cell lines not listed, several conditions may need to be tested.
6. Plate the electroporated cells into a 24-well dish and culture for 5–7 days.
F. Selection and single-cell cloning of SAIYAN knock-in cells by flow cytometry
1. Expand the electroporated cells until they reach approximately a 6-cm dish in size.
2. Split the cells into two groups and seed them into a 6-well dish.
3. Add an appropriate concentration of doxycycline to one group only and culture for 24 h.
4. Detach both groups of cells using trypsin and resuspend them in medium.
5. Subject the cells to FACS Melody.
6. First, run the cells without doxycycline treatment to set the gate based on cell size. Confirm the fluorescence intensity at the GFP wavelength.
7. Next, run the doxycycline-treated cells. In these, a small subpopulation (typically only a few percent) will display stronger fluorescence at the GFP wavelength than untreated cells. Set the gate for this population.
8. Sort the gated cells into a 96-well plate at one cell per well.
9. Continue culturing the sorted cells in the 96-well plate for 7–14 days.
10. Once individual colonies expand to fill the wells, scale up the cultures.
11. During scale-up, seed a subset of the cells onto coverslips, treat with doxycycline for 24 h, and then confirm the presence of the mNeonGreen signal by fluorescence microscopy.
G. Verification of knock-in by sequencing
1. Genomic DNA extraction: To isolate clones in which the knock-in was correctly introduced, genomic DNA was extracted from multiple candidate clones. As with ssODN preparation, genomic DNA was purified from cultured cells (here, HeLa cells grown in a 6-cm dish) using the DNeasy Blood & Tissue kit, according to the manufacturer’s protocol.
2. PCR amplification and sequencing: For each genomic DNA sample, PCR was performed using the same primers employed for generating the genomic template (the primers used for ssODN preparation can also be used). The PCR products were then cloned into a vector and subjected to sequencing. Clones that were confirmed to contain the correct knock-in sequence were selected and used for subsequent experiments.
H. Observation of activated small GTPases by microscopy
1. Seed SAIYAN cells onto 12 mm coverslips in a 24-well dish. If siRNA treatment or other manipulations are required, perform them at this stage.
2. Add an appropriate concentration of doxycycline 24 h before fixation.
3. Fix the cells. Either methanol fixation or 4% PFA fixation can be used.
4. Perform counterstaining if necessary.
5. Apply the mounting medium onto the coverslips, then mount the glass slides on top.
6. Observe the cells using a confocal laser scanning microscope (Figures 3 and 4A).
Note: Fine structures were observed using an LSM 900 microscope equipped with an Airyscan 2 detector (Figure 3). 63× oil immersion objective lens (NA 1.4) was used for imaging. mNeonGreen was excited with a 488 nm laser, and emission was collected at 450–570 nm. All observations were performed at room temperature, and images were acquired using Zen Blue software.
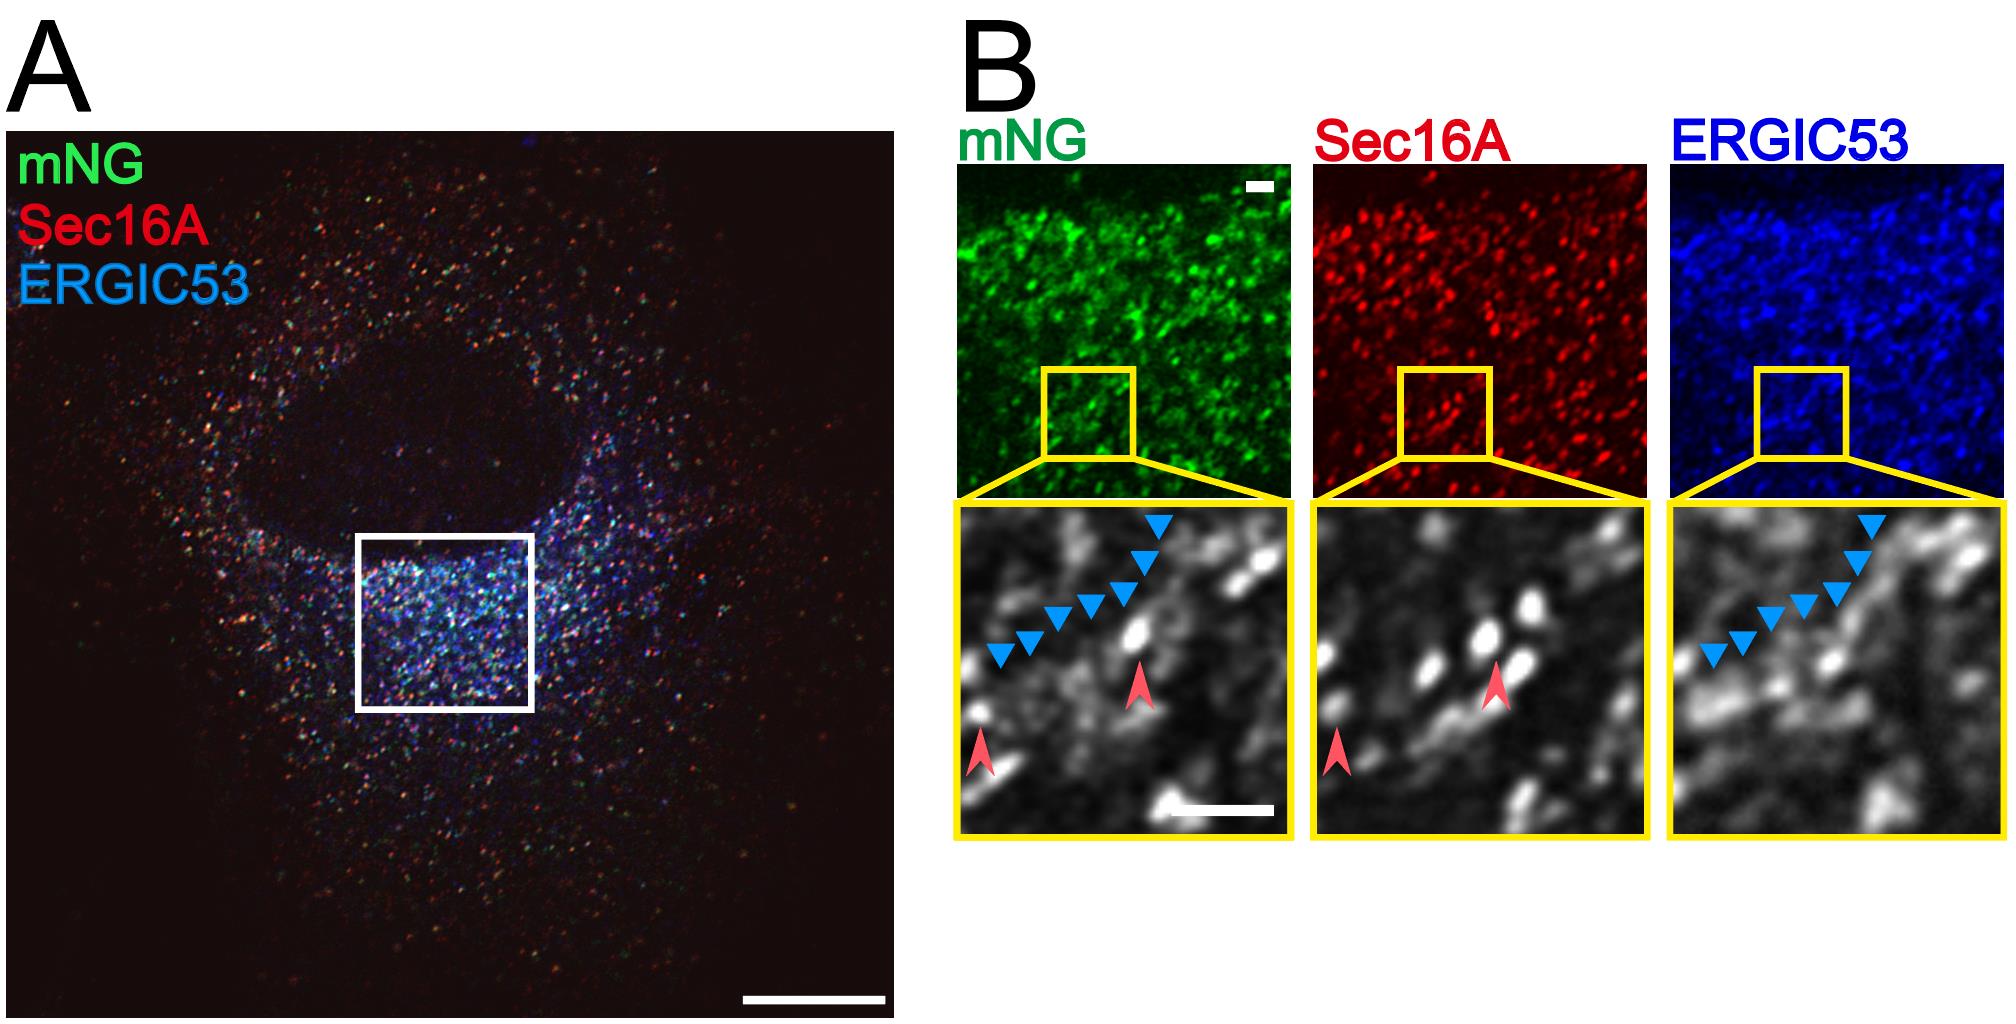
Figure 3. The SAIYAN system in BJ-5ta cells reveals that activated Sar1 localizes not only to endoplasmic reticulum (ER) exit sites but also in close proximity to the ERGIC in collagen-secreting cells. (A) SAIYAN cells derived from BJ-5ta cells were treated with L-ascorbic acid phosphate and cultured for 2 days, followed by fixation and staining with anti-Sec16A and anti-ERGIC53 antibodies. Images were acquired using an Airyscan2 confocal microscope. Scale bars, 10 µm. (B) Magnified view of (A) showing that the mNG signal is distributed adjacent to the ER exit site marker Sec16A (red arrowheads) and along ERGIC-53-positive structures (blue arrowheads). Scale bars, 1 µm. ©2024 Maeda et al. [8]. Originally published in Journal of Cell Biology (2024), DOI: 10.1083/jcb.202403179. SAIYAN: Small GTPase ActIvitY Analyzing system.
Data analysis
Quantification of cellular fluorescence intensity using ImageJ
1. Open the acquired fluorescence images in ImageJ.
Note: It is preferable that each field of view contains multiple cells without being cut off at the edges.
2. Select the mNeonGreen channel image.
3. Use Subtract Background to remove background fluorescence.
4. Outline each cell using the Freehand Selection tool and add each region of interest (ROI) to the ROI Manager.
5. From Measure function, obtain the mean fluorescence intensity of each ROI.
Note: Before imaging, ensure that the brightest region is not saturated and that fluorescence intensity across the field of view falls within a linear detection range.
6. Use the obtained mean value as the mNeonGreen intensity per cell.
7. Input the values into GraphPad Prism to generate graphs and perform statistical analyses (Figure 4B).
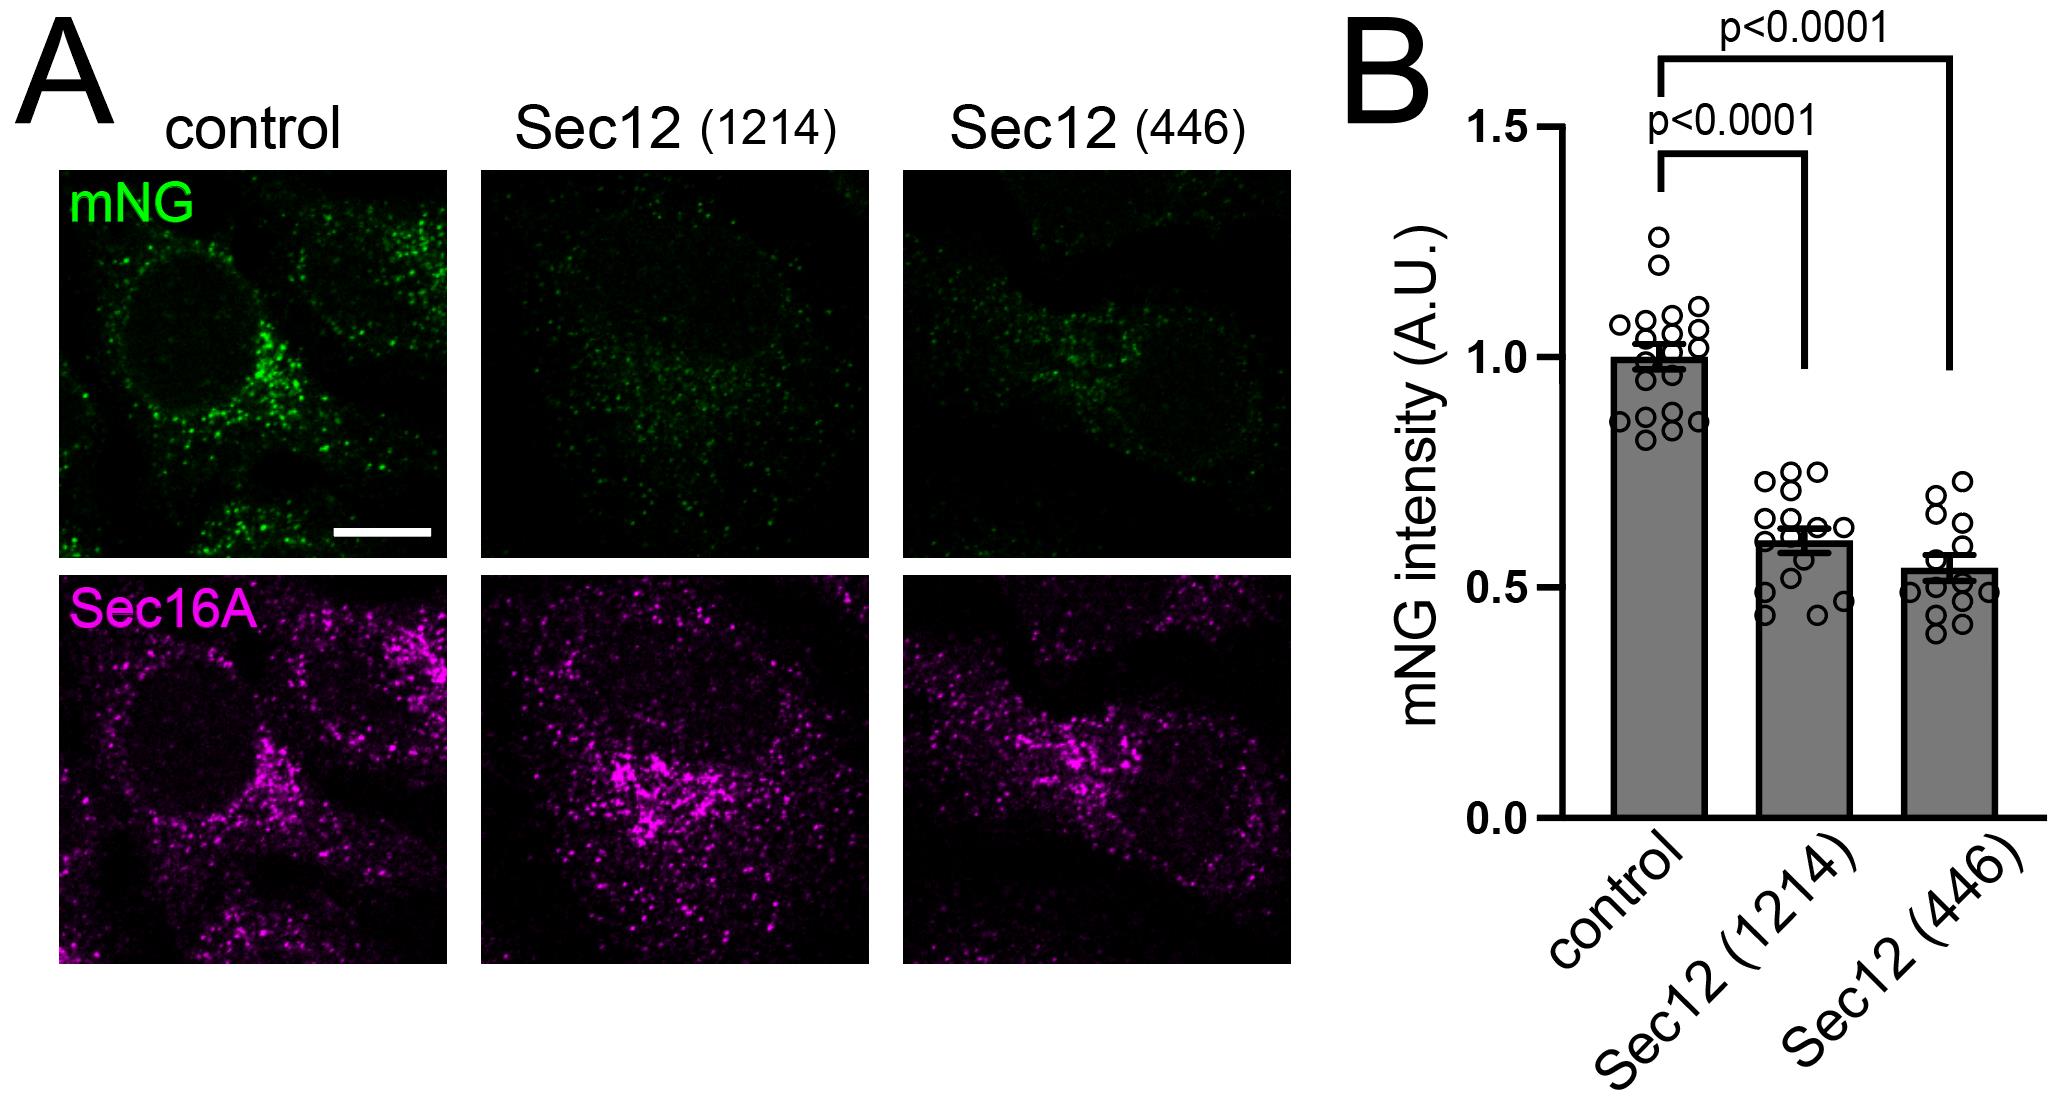
Figure 4. Evaluation of intracellular activated Sar1A upon Sec12 knockdown. (A) SAIYAN cells derived from HeLa cells were transfected with Sec12 siRNAs, followed by fixation and staining with anti-Sec16A antibodies. Images were acquired using an LSM900 microscope. Scale bars, 10 µm. (B) Quantification of mNG signals from (A), indicating a reduction of activated Sar1 upon Sec12 knockdown. Each data point represents the mNG intensity of the analyzed cells. Error bars represent SEM. P-values were calculated using a one-way analysis of variance followed by Dunnett’s test. ©2024 Maeda et al. [8]. Originally published in Journal of Cell Biology (2024), DOI: 10.1083/jcb.202403179. SAIYAN: Small GTPase ActIvitY Analyzing system.
Validation of protocol
This protocol or parts of it have been used and validated in the following research article(s):
• Maeda et al. [8]. Small GTPase ActIvitY ANalyzing (SAIYAN) system: A method to detect GTPase activation in living cells. Journal of Cell Biology (2024), DOI: 10.1083/jcb.202403179
General notes and troubleshooting
General notes
1. The SAIYAN system is designed to visualize small GTPases that associate with membranes upon activation; thus, membrane binding is required for detection. However, by directing the localization of mNeonGreen1-10, it is also possible to assess activation at different intracellular sites for GTPases that function in multiple locations.
2. We generated SAIYAN cells using HeLa and BJ-5ta cell lines, but the method is applicable to other cell types as well. Since viral infection, transfection efficiency, and electroporation conditions vary depending on the cell line, optimization is required for each case.
3. For the Sar1 knock-in, we confirmed that only one allele was in-frame with the mNeonGreen11 insertion; nevertheless, this was sufficient to obtain a robust signal for analysis.
Troubleshooting
1. A flexible linker was introduced between the GTPase and the mNeonGreen11 tag. If the linker is too long, nonspecific signals may appear; therefore, it is advisable to use constructs with inactive mutants or other negative controls to ensure that fluorescence is detected only upon activation.
2. Expression of mNeonGreen1–10 is doxycycline-inducible, allowing fine-tuning of its expression level. Overexpression of mNeonGreen1–10 can increase background fluorescence, so the appropriate expression level should be carefully evaluated before experiments.
Acknowledgments
Conceptualization, M.M., K.S.; Investigation, M.M., K.S.; Writing—Original Draft, M.M., K.S.; Writing—Review & Editing, K.S.; Funding acquisition, M.M., K.S.; Supervision, K.S. This work was supported by JSPS Grants-in-Aid for Scientific Research (22H02760 and 23K24023 to M.M. and 23H02430, 23K27123, and 24K22065 to K.S.) from the Ministry of Education, Culture, Sports, Science, and Technology of Japan and Naito Foundation (K.S. and M.M.). K.S. received support from the Takeda Science Foundation, Asahi Glass Foundation and Princess Takamatsu Cancer Research Foundation. This work was described and validated in Maeda et al. [8].
Competing interests
The authors declare no conflicts of interest.
References
- Cherfils, J. (2023). Small GTPase signaling hubs at the surface of cellular membranes in physiology and disease. FEBS Lett. 597(6): 717–720. https://doi.org/10.1002/1873-3468.14607
- Taylor, S. J. and Shalloway, D. (1996). Cell cycle-dependent activation of Ras. Curr Biol. 6(12): 1621–1627. https://doi.org/10.1016/s0960-9822(02)70785-9
- Northup, J. K., Smigel, M. D. and Gilman, A. G. (1982). The guanine nucleotide activating site of the regulatory component of adenylate cyclase. Identification by ligand binding. J Biol Chem. 257(19): 11416–11423. https://doi.org/10.1016/s0021-9258(18)33775-x
- Aoki, K. and Matsuda, M. (2009). Visualization of small GTPase activity with fluorescence resonance energy transfer-based biosensors. Nat Protoc. 4(11): 1623–1631. https://doi.org/10.1038/nprot.2009.175
- Pertz, O. and Hahn, K. M. (2004). Designing biosensors for Rho family proteins — deciphering the dynamics of Rho family GTPase activation in living cells. J Cell Sci. 117(8): 1313–1318. https://doi.org/10.1242/jcs.01117
- Van der Verren, S. E. and Zanetti, G. (2023). The small GTPase Sar1, control centre of COPII trafficking. FEBS Lett. 597(6): 865–882. https://doi.org/10.1002/1873-3468.14595
- Saito, K., Maeda, M. and Katada, T. (2017). Regulation of the Sar1 GTPase Cycle Is Necessary for Large Cargo Secretion from the Endoplasmic Reticulum. Front Cell Dev Biol. 5: e00075. https://doi.org/10.3389/fcell.2017.00075
- Maeda, M., Arakawa, M., Komatsu, Y. and Saito, K. (2024). mall GTPase ActIvitY ANalyzing (SAIYAN) system: A method to detect GTPase activation in living cells. J Cell Biol. 23(10): 202403179. https://doi.org/10.1083/jcb.202403179
- Maeda, M. and Saito, K. (2025). Various methods to detect small GTPase activation: from radioisotope-based methods to the Small GTPase ActIvitY ANalysing (SAIYAN) system. J Biochem. 77(5): 321–327. https://doi.org/10.1093/jb/mvaf012
- Shin, K. J., Wall, E. A., Zavzavadjian, J. R., Santat, L. A., Liu, J., Hwang, J. I., Rebres, R., Roach, T., Seaman, W., Simon, M. I., et al. (2006). A single lentiviral vector platform for microRNA-based conditional RNA interference and coordinated transgene expression. Proc Natl Acad Sci USA. 103(37): 13759–13764. https://doi.org/10.1073/pnas.0606179103
- Feng, S., Sekine, S., Pessino, V., Li, H., Leonetti, M. D. and Huang, B. (2017). Improved split fluorescent proteins for endogenous protein labeling. Nat Commun. 8(1): e1038/s41467–017–00494–8. https://doi.org/10.1038/s41467-017-00494-8
- Leonetti, M. D., Sekine, S., Kamiyama, D., Weissman, J. S. and Huang, B. (2016). A scalable strategy for high-throughput GFP tagging of endogenous human proteins. Proc Natl Acad Sci USA. 113(25): e1606731113. https://doi.org/10.1073/pnas.1606731113
- Lin, S., Staahl, B. T., Alla, R. K. and Doudna, J. A. (2014). Enhanced homology-directed human genome engineering by controlled timing of CRISPR/Cas9 delivery. eLife. 3: e04766. https://doi.org/10.7554/elife.04766
- Cho, N. H., Cheveralls, K. C., Brunner, A. D., Kim, K., Michaelis, A. C., Raghavan, P., Kobayashi, H., Savy, L., Li, J. Y., Canaj, H., et al. (2022). OpenCell: Endogenous tagging for the cartography of human cellular organization. Science. 375(6585): eabi6983. https://doi.org/10.1126/science.abi6983
- Labun, K., Montague, T. G., Krause, M., Torres Cleuren, Y. N., Tjeldnes, H. and Valen, E. (2019). CHOPCHOP v3: expanding the CRISPR web toolbox beyond genome editing. Nucleic Acids Res. 47: W171–W174. https://doi.org/10.1093/nar/gkz365
Article Information
Publication history
Received: Sep 19, 2025
Accepted: Nov 23, 2025
Available online: Dec 9, 2025
Published: Jan 5, 2026
Copyright
© 2026 The Author(s); This is an open access article under the CC BY-NC license (https://creativecommons.org/licenses/by-nc/4.0/).
How to cite
Readers should cite both the Bio-protocol article and the original research article where this protocol was used:
- Maeda, M. and Saito, K. (2026). Detecting the Activation of Endogenous Small GTPases via Fluorescent Signals Utilizing a Split mNeonGreen: Small GTPase ActIvitY ANalyzing (SAIYAN) System. Bio-protocol 16(1): e5557. DOI: 10.21769/BioProtoc.5557.
- Maeda, M., Arakawa, M., Komatsu, Y. and Saito, K. 2024). mall GTPase ActIvitY ANalyzing (SAIYAN) system: A method to detect GTPase activation in living cells. J Cell Biol. 23(10): 202403179. https://doi.org/10.1083/jcb.202403179
Category
Cell Biology > Cell signaling > Intracellular Signaling
Cell Biology > Cell imaging > Confocal microscopy
Biochemistry > Protein > Activity
Do you have any questions about this protocol?
Post your question to gather feedback from the community. We will also invite the authors of this article to respond.