- Protocols

- Articles and Issues
- For Authors
- About
- Become a Reviewer

Protocol for Quantifying γH2AX Foci in Irradiated Cells Using Immunofluorescence and Fiji Software
(§Technical contact: Lu_Deng0821@outlook.com) Published: Vol 15, Iss 16, Aug 20, 2025 DOI: 10.21769/BioProtoc.5421 Views: 2553
Reviewed by: Pilar Villacampa AlcubierreAnonymous reviewer(s)
Advertisement


Protocol Collections
Comprehensive collections of detailed, peer-reviewed protocols focusing on specific topics


Abstract
Quantification of DNA double-strand breaks (DSBs) is critical for assessing genomic damage and cellular response to stress. γH2AX is a well-established marker for DNA double-strand breaks, but its quantification is often performed manually or semi-quantitatively, lacking standardization and reproducibility. Here, we present a standardized and automated workflow for γH2AX foci quantification in irradiated cells using immunofluorescence and a custom Fiji macro. The protocol includes steps for cell irradiation, immunostaining, image acquisition, and automated foci counting. The protocol is also adaptable to colony-like formations in multi-well plates, extending its utility to clonogenic assays. This protocol enables high-throughput, reproducible quantification of DNA damage with minimal user bias and can be readily implemented in routine laboratory settings.
Key features
• Provides an automated Fiji macro for high-throughput quantification of nuclear γH2AX fluorescence foci with single-nucleus resolution.
• Standardized workflow optimized for reproducibility and cross-sample consistency in DSBs detection.
• Applicable to nuclear fluorescence foci, as well as colony-like structures in multi-well formats for DNA damage and clonogenic assays.
Keywords: γH2AXGraphical overview
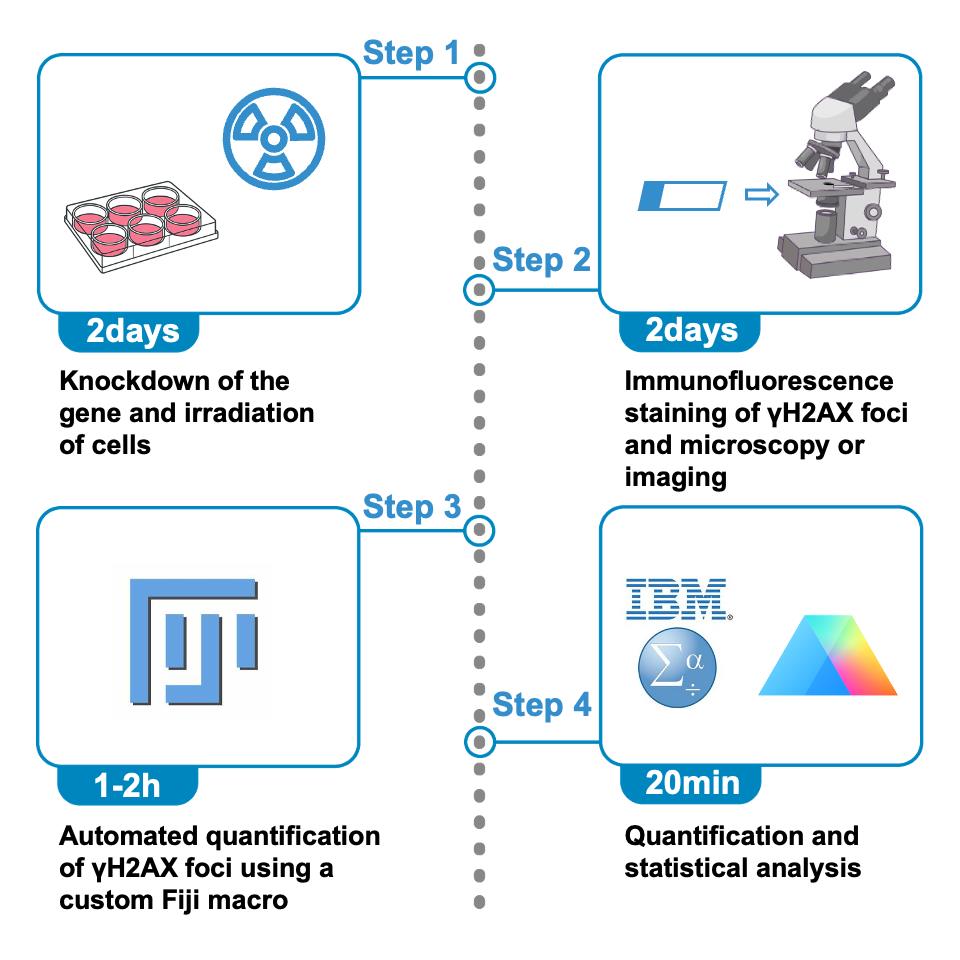
Schematic overview of the protocol for quantifying γH2AX foci in irradiated cells using immunofluorescence and Fiji. The procedure begins with gene knockdown and X-ray irradiation of cultured cells (step 1, ~2 days), followed by immunofluorescence staining of γH2AX foci and image acquisition using fluorescence microscopy (step 2, ~2 days). Automated quantification of γH2AX foci is then performed using a custom Fiji macro (step 3, ~1–2 h). Finally, the resulting data are subjected to statistical analysis and visualization (step 4, ~20 min).
Background
Histone H2AX plays essential roles in nucleosome assembly, chromatin remodeling, and DNA repair [1]. DSBs can be induced by various sources, including ionizing radiation, chemical agents (such as etoposide, doxorubicin, and camptothecin), and endogenous biological processes (such as replication stress). Upon induction of DSBs, H2AX is rapidly phosphorylated at serine 139 to form γH2AX [2]. This phosphorylated histone marks the sites of double-strand breaks and recruits cell cycle checkpoint proteins and DNA repair factors to the damaged regions. Since γH2AX levels rise within minutes after double-strand breaks, it is widely used as a biomarker for DNA damage [1]. Quantitative detection of γH2AX expression can be employed to assess the extent of DNA damage [3].
Currently, the quantification of nuclear fluorescence foci such as γH2AX is predominantly performed using manual or semi-quantitative approaches. Manual counting is labor-intensive and subject to observer bias. Some studies adopt intensity-based or area-based metrics as surrogates for foci number, but these lack spatial resolution and fail to distinguish overlapping or clustered foci. Moreover, many published studies do not explicitly describe how foci are quantified, posing challenges to reproducibility and cross-study comparisons.
To address these limitations, we present an automated, reproducible workflow that performs direct foci counting at the single-nucleus level using a custom Fiji macro. Fiji, a widely adopted open-source platform for biomedical image analysis, supports a wide range of file formats (e.g., TIFF, ND2, CZI) and provides robust tools for fluorescence analysis, morphological quantification, 3D reconstruction, and workflow automation through customizable macros and scripting [4,5]. Our protocol leverages Fiji’s core capabilities while maintaining a user-friendly design that requires little coding experience, making it readily accessible to researchers with diverse technical backgrounds.
This protocol offers a complete and streamlined workflow encompassing sample preparation, immunostaining, image preprocessing, and Fiji macro-based quantification. The approach enables nucleus-by-nucleus quantification of fluorescence foci across experimental groups. It is demonstrated using irradiated C-33A cells, with or without siRNA-mediated knockdown of the target gene, allowing assessment of gene-specific effects on cellular radiosensitivity.
Importantly, beyond γH2AX foci quantification, the macro’s underlying image analysis framework is broadly applicable to other counting tasks based on morphologically similar, segmentable regions of interest (ROIs). For example, it can be used to count colony-like structures in multi-well plate-based assays, including clonogenic assays. This extended applicability underscores the macro’s versatility, enabling a unified and user-friendly workflow for high-throughput quantification of structured, ROI-based image features across diverse experimental settings.
Materials and reagents
Biological materials
1. C-33A cell line (Cell Resource Center, Institute of Basic Medical Sciences, CAMS/PUMC, 1101HUM-PUMC000172)
Reagents
1. LipofectamineTM 2000 (Invitrogen, catalog number: 11668019)
2. GibcoTM basic DMEM, high glucose, pyruvate (Gibco, catalog number: C11995500BT)
3. Fetal bovine serum (FBS) (Gibco, catalog number: A5256701)
4. Pen Strep (Gibco, catalog number: 15140122)
5. Opti-MEMTM (Gibco, catalog number: 31985070)
6. Anti-gamma H2A.X (phospho S139) (mouse) (Abcam, catalog number: ab22551)
7. Goat anti-mouse IgG (H+L) cross-adsorbed secondary antibody, Alexa FluorTM 488 (Thermo Fisher Scientific, catalog number: A-11001)
8. PBS (1×) (Pricella, catalog number: PB180327)
9. Paraformaldehyde, 4% (Solarbio, catalog number: P1110)
10. Triton X-100 (Beyotime, catalog number: P0096)
11. 5% BSA blocking buffer (Solarbio, catalog number: SW3015)
12. Antifade mounting medium with DAPI (Beyotime, catalog number: P0131)
Laboratory supplies
1. Round coverslip (Biosharp, catalog number: BS-18-RC)
2. Size 12 wells, clear polystyrene plate (Corning, catalog number: CLS3513)
3. Parafilm (Sigma-Aldrich, catalog number: P7793)
4. Mendez LASIK forceps (MRP HACO, catalog number: PH2351)
5. Microscope slide (Corning, catalog number: 2947-75X25)
Equipment
1. Upright fluorescence microscope (Leica, catalog number: DM2000)
2. X-ray irradiation (Faxitron, catalog number: MultiRad 225)
Software and datasets
1. Fiji (National Institutes of Health)
2. GraphPad Prism 10 (Dotmatics, Version 10.2.1)
3. IBM SPSS Statistics (IBM Corp., Version 27.0)
Procedure
A. Cell culture and treatment before irradiation
1. Maintain C-33A cells in a CO2 incubator at 37 °C with DMEM medium supplemented with 10% FBS and 1% pen-strep. Passage cells at 80%–90% confluency using 0.25% trypsin-EDTA.
Critical: Routine screening for mycoplasma contamination is critical, as such contamination can induce erratic blue fluorescence in the background of the DAPI channel, significantly compromising nuclear segmentation in image processing.
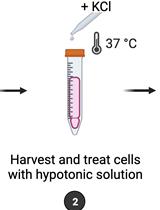
2. Day 0: Seed the cells in a 6-well plate to achieve ~30% confluency.
3. Day 1: Use LipofectamineTM 2000 to perform siRNA transfection according to the manufacturer’s guidelines.
Note: In this protocol, siRNA targeting DCBLD1 was synthesized and provided by GenePharma (Shanghai, China).
Pause point: Continue to culture the cells under standard conditions (37 °C, 5% CO2) for 24 h to allow gene knockdown.
B. Irradiation of cultured cells with X-rays
1. Day 2: Place sterilized round coverslips into a 12-well plate.
2. Seed C-33A cells onto the round coverslip in the 12-well plate. Allow the cells to grow until they reach approximately 50% confluency before irradiation (Figure 1).
Figure 1. Desired cell density before irradiation. Allow the cells to grow until they reach approximately 50% confluency before irradiation. Scale bar: 100 µm.
3. Day 3: Irradiate the cells using X-rays at doses of 2 Gy with a dose rate of 6 Mu.
a. Adjust the height of the 12-well plate to ensure that the radiation focal plane is aligned with the cell monolayer.
b. Set the irradiation dose and dose rate according to experimental requirements.
4. After irradiation, record the irradiation time.
Pause point: After irradiation, cells can either be processed in a short time (within 30 min to 1 h) or cultured for a defined recovery period (up to 24 h), depending on the experimental purpose, before proceeding to the next step.
C. Immunofluorescence staining of γH2AX foci and microscopy or imaging
1. Fix the irradiated cells on coverslips with 4% paraformaldehyde for 30 min at room temperature.
Note: Add at least 200 μL of fixative to fully cover the bottom of each well.
2. Wash the cells three times with 1× PBS, 2 min each time.
Note: Add at least 200 μL of PBS to thoroughly wash the cells. Adjust the shaker to a low speed to avoid damaging the fixed cells.
3. Permeabilize the cells with 0.3% Triton X-100 in PBS for 30 min at room temperature.
4. Block the cells with 5% BSA in PBS for 30 min at room temperature.
5. Incubate the cells with primary antibody against γH2AX (diluted at a ratio of 1:200 in PBS containing 5% BSA) overnight at 4 °C.
Note: Cut Parafilm pieces to fit the size of the wells in a 12-well plate (Figure 2). Add 50 μL of the diluted primary antibody to each well. Carefully cover each well with the Parafilm piece and gently remove any air bubbles using a pipette tip to ensure complete contact between the antibody solution and the cell surface.
Figure 2. Parafilm pieces trimmed to fit the wells of a 12-well plate. Each well is carefully covered with a corresponding Parafilm piece to ensure proper contact during incubation.
6. Day 4: Wash the cells three times with 1× PBS, 2 min each time.
7. Incubate the cells with fluorescently labeled secondary antibody (diluted at a ratio of 1:200 in PBS) for 2 h at room temperature in the dark.
8. Wash the cells three times with 1× PBS, 2 min each time.
9. Carefully remove the coverslip from the well using a pipette tip or fine forceps. Mount the coverslip onto a microscope slide using an antifade mounting medium containing DAPI.
Note: Label the microscope slide to indicate the group information, primary antibody, and fluorescence channel corresponding to the two coverslips placed on the slide.
Critical: Minimize light exposure after adding the fluorescent secondary antibody and DAPI to avoid photobleaching.
10. Observe and capture images of γH2AX foci using a fluorescence microscope. It is recommended that the magnification reaches at least 400×. Try to select fields of view where nuclei do not overlap (Figure 3).
Figure 3. γH2AX foci captured with a fluorescence microscope. (A, B) Overlapping cell nuclei (top), where (A) represents the nuclei and (B) represents γH2AX foci. (C, D) Non-overlapping cell nuclei, with (C) representing the nuclei and (D) representing γH2AX foci. Scale bar: 35 µm.
Note: Acquire fluorescence images using a fluorescence microscope, ensuring that at least 100 cells are imaged per group.
Critical: Prepare images in lossless formats (e.g., .tif) to preserve metadata such as pixel-to-micrometer ratios, which are critical for accurate scaling. Avoid lossy formats (e.g., .jpg, .png), as they compromise resolution and metadata integrity.
D. Install Fiji software
1. Download Fiji.
a. Navigate to https://imagej.net/software/fiji/downloads.
b. Select your platform.
c. Download the appropriate file for your operating system.
2. Unzip the file.
E. Automated quantification of γH2AX foci using a custom Fiji macro
1. Install the custom Fiji macro.
a. Open Fiji software.
b. Navigate to Plugins → Macros → Install and select “count_points.ijm” to install the macro.
The code for “count_points.ijm” (uploaded as Code S1; please rename the file to “count_points.ijm” prior to installation) is as follows:
// The current output is saved to the desktop, with the file named "result.csv". You can change to another output file pathvar outputFile = getDirectory("home") + "Desktop/result.csv";var header = "ROI,Point\n"; // Header of the CSV filevar data = ""; // String for collecting datadata = data + header;// Set parameters for Find MaximanoiseTolerance = 10; // Adjust noise tolerance as neededoutputType = "Point Selection"; // Choose output type: "List" or "Point Selection"excludeEdgeMaxima = true; // Whether to exclude edge maximalightBackground = false; // Set true/false depending on image background; false for dark background// Get the number of ROIs from ROI ManagerroiManager("show all");n = roiManager("Count");command = "noise=" + noiseTolerance + " output=[Point Selection]";if (excludeEdgeMaxima) { command += " exclude";}if (lightBackground) { command += " light";} else { command += " dark";}// Iterate through each ROI
for (i=0; i<n; i++) {
roiManager("select", i); // Select current ROI
run("Find Maxima...", command);
getSelectionCoordinates(xPoints, yPoints);
nMaxima = xPoints.length;
data = data + i + "," + nMaxima + "\n";
}
print(data);
File.saveString(data, outputFile);
Note: Successful installation will display the macro name in the Plugins list (Figure 4).
Figure 4. Screenshot of Plugins after successful installation. The installed macro “count_points.ijm” appears on the Fiji Plugins list.
Note: The first line of the code var outputFile = getDirectory("home") + "Desktop/result.csv"; can be replaced with var outputFile = "/Users/ludeng/Desktop/test/result.csv";. The path /Users/ludeng/Desktop/test/ can be modified to any desired output folder on your computer, and result.csv is the file name.
2. Prepare nuclear images for foci quantification.
a. Open the DAPI channel image in Fiji.
b. Set the image scale.
i. Select the straight-line tool and draw a line along the scale bar in the image.
ii. Go to Analyze → Set Scale and input the “known distance” and “unit of length” (e.g., 50 μm). Click OK (Figure 5).
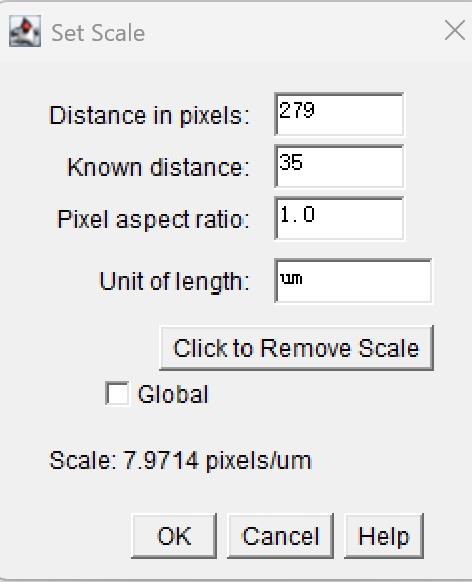
Figure 5. Set Scale screenshot. Setting the image scale using the straight-line tool and the Set Scale dialog.
3. Convert the image to an 8-bit grayscale image: go to Image → Type → 8-bit.
4. Adjust the threshold and binarize the image.
a. Go to Image → Adjust → Threshold.
b. Adjust the minimum and maximum threshold values until the nuclei are properly segmented (Figure 6A).
Note: Avoid including the image scale in the threshold (Figure 6B).
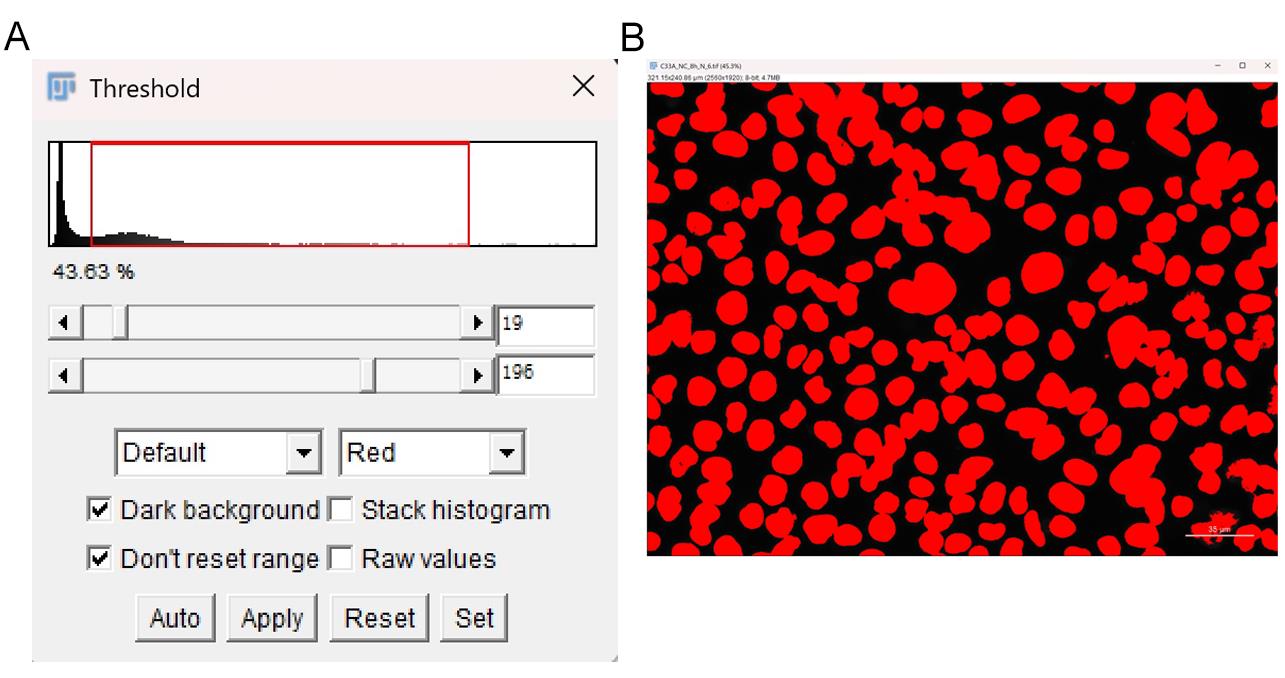
Figure 6. Threshold adjustment for nuclear segmentation. (A) Properly segmented nuclei. (B) Avoid including scale bars in the threshold. Scale bar: 35 µm.
c. Click Apply to binarize the image.
5. Fill holes in the binary image: go to Process → Binary → Fill Holes.
6. Separate overlapping nuclei: go to Process → Binary → Watershed.
7. Open the ROI Manager: navigate to Analyze → Tools → ROI Manager.
8. Analyze particles to identify and quantify nuclei.
a. Go to Analyze → Analyze Particles and set the appropriate “Size” to exclude debris and artifacts (Figure 7).
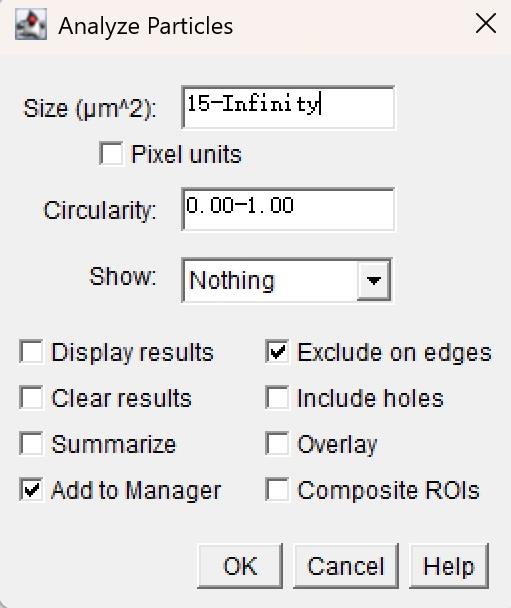
Figure 7. Settings for size and circularity during particle analysis
Note: Estimate the lower bound of particle size according to the calibrated image scale to exclude debris.
b. Select Add to Manager and Exclude on Edges.
c. Click OK to proceed (Figure 8A, B).
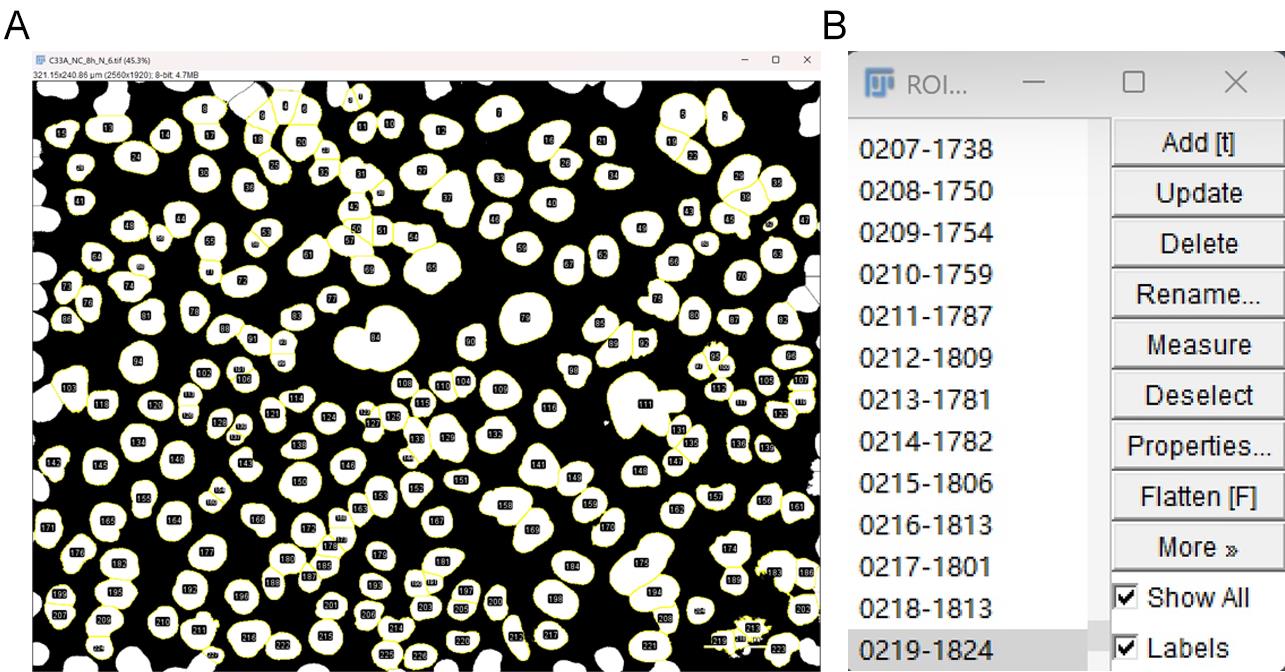
Figure 8. Screenshot of ROIs and ROI manager. (A) ROIs are automatically identified one by one. (B) ROIs are added to the ROI manager. Scale bar: 35 µm.
d. Remove any incorrect ROIs, especially nuclei at the image edge, which may lead to inaccurate counting (Figure 9).
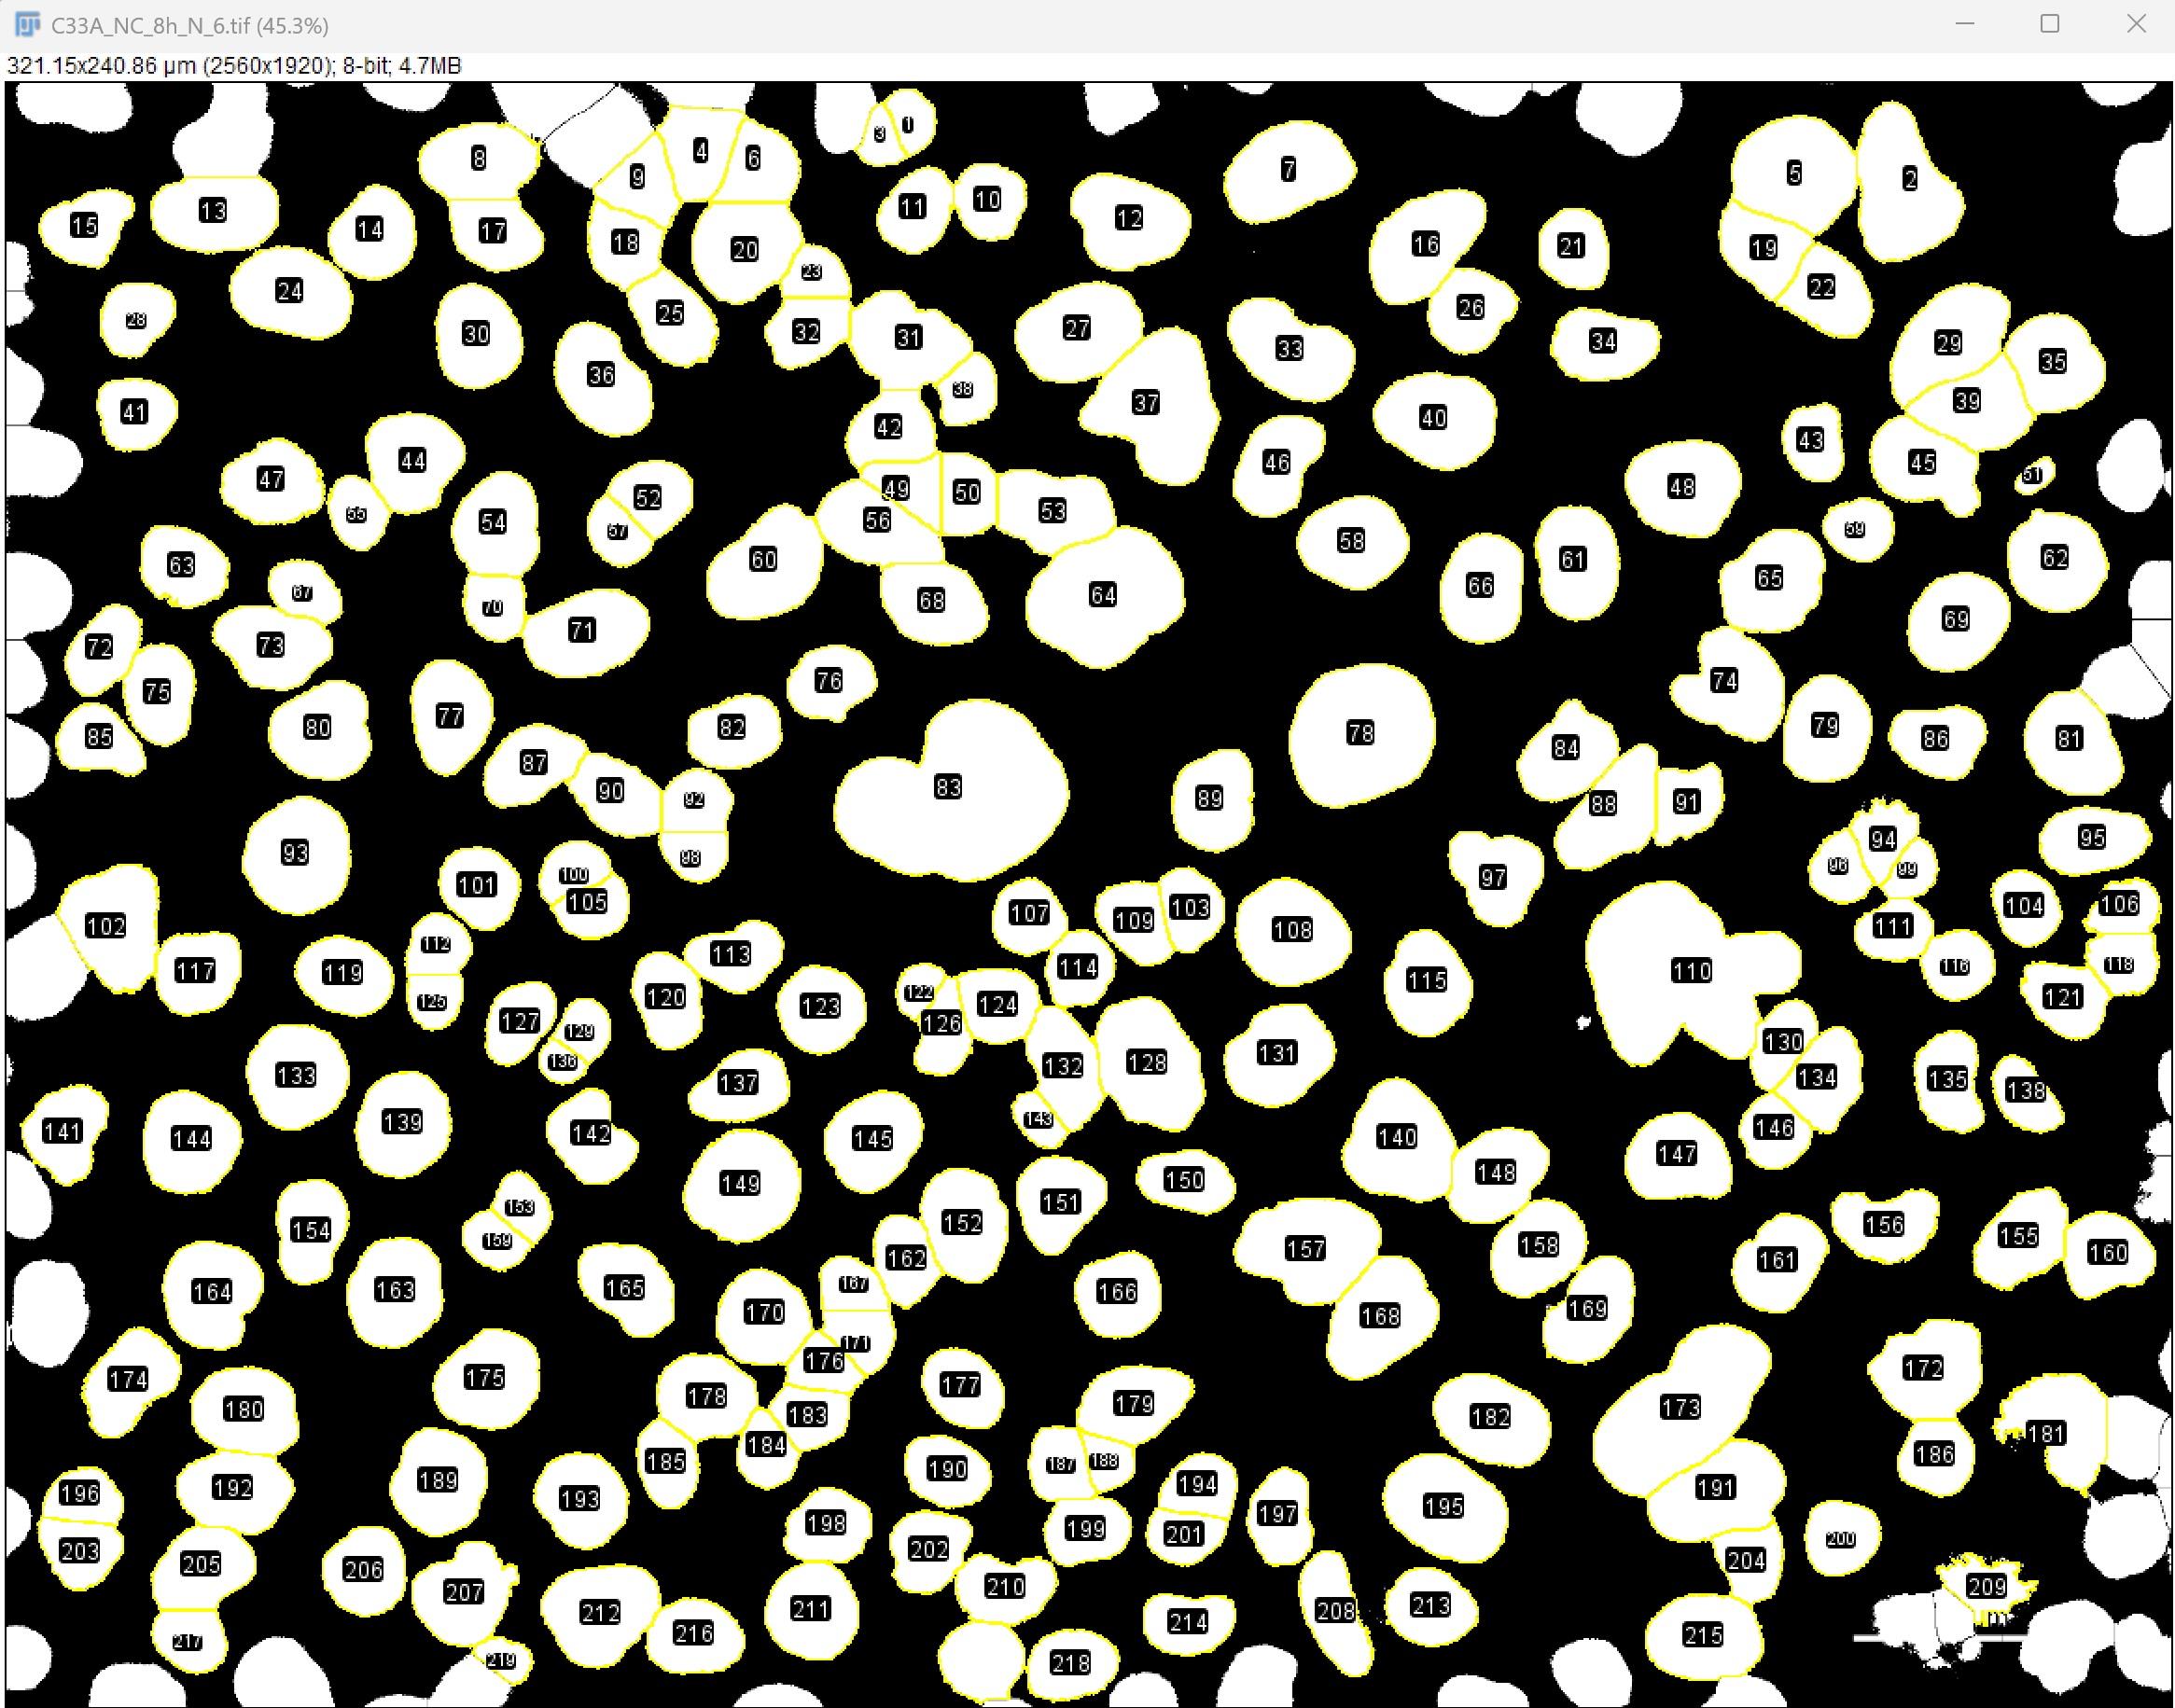
Figure 9. Screenshot of ROIs after adjustment. Scale bar: 35 µm.
Critical: Nuclei located at the edges of the image cannot be accurately quantified for intranuclear foci, and cell segmentation in these regions is often unreliable. Therefore, edge nuclei should be removed. To delete them, click on the edge nucleus in the 8-bit image to select it; the corresponding ROI will be automatically highlighted in the ROI Manager. Then click Delete in the ROI Manager to remove it. Use the same procedure to delete incorrectly segmented ROIs.
9. Quantify γH2AX foci in each nucleus.
a. Open the green fluorescence channel image. Adjust brightness and contrast until foci are clearly visible in Image → Adjust → Brightness/Contrast (Figure 10).
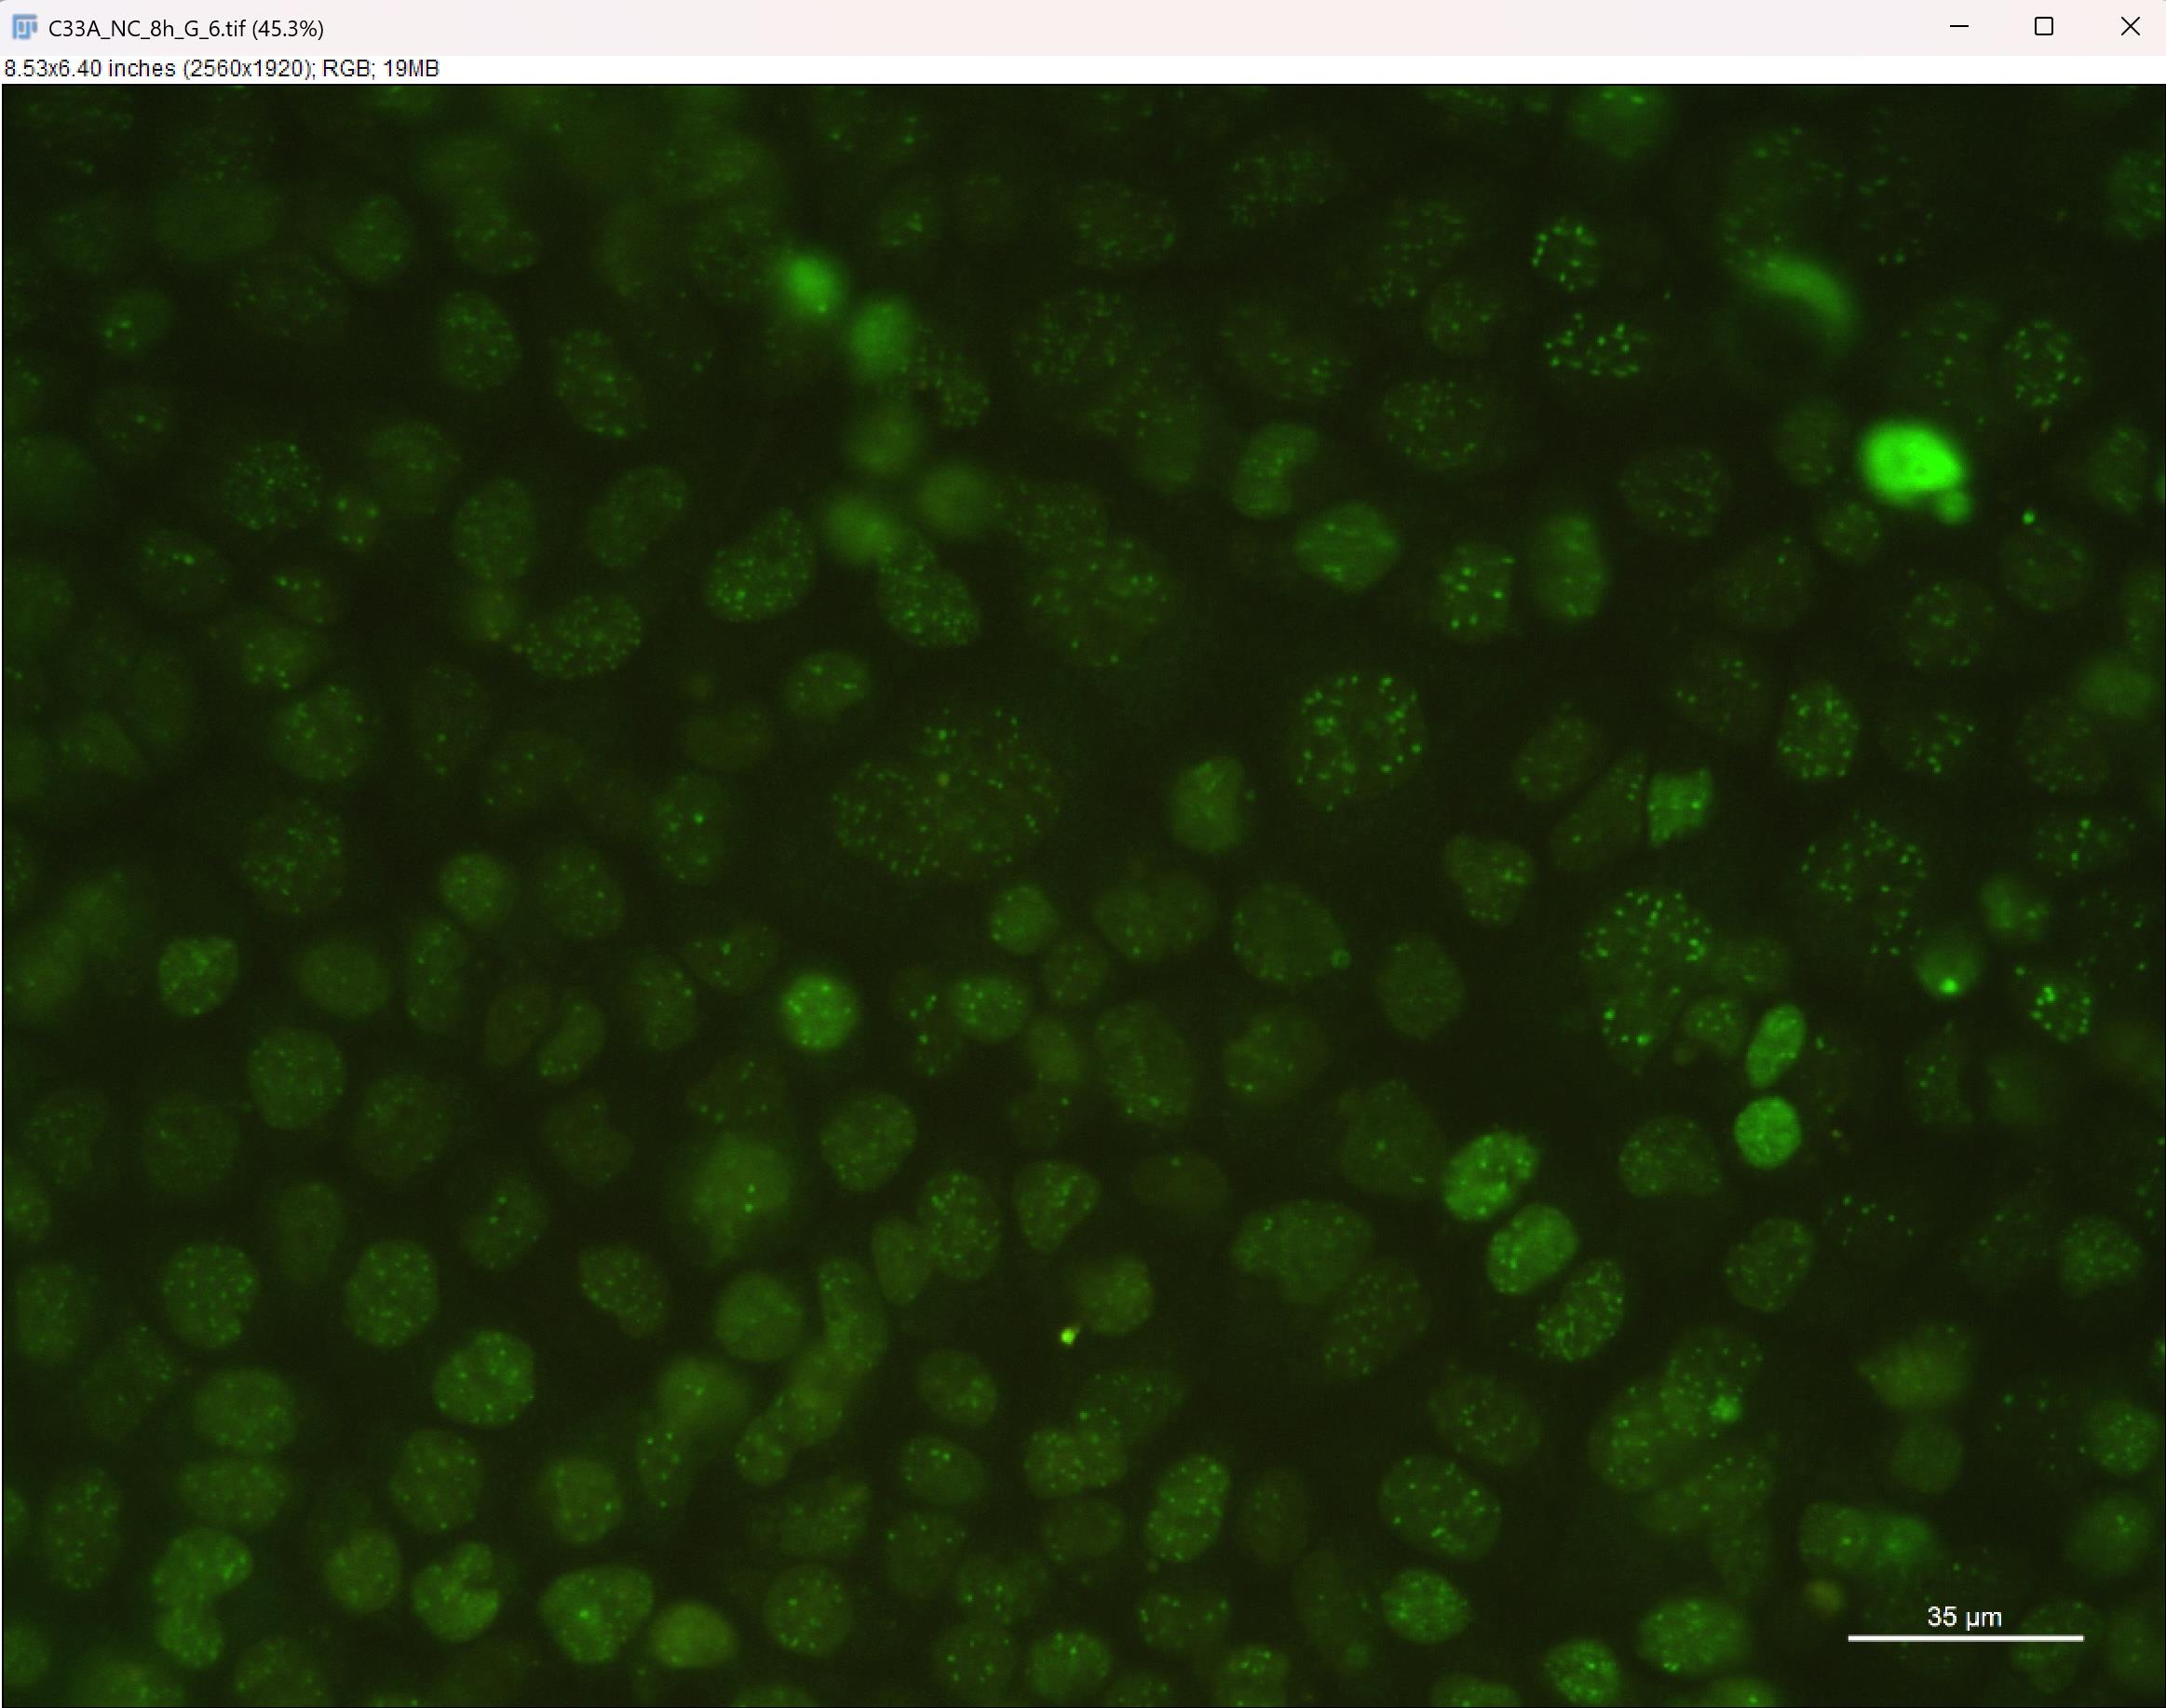
Figure 10. Screenshot of green fluorescence channel image after adjustment. Adjust brightness and contrast to make the green fluorescent foci clearly visible. Scale bar: 35 μm.
b. Run the installed macro: Plugins → Macros → count_points.
c. The macro will automatically quantify the foci and save the results to the desktop, named “result.csv.”
Note: The particle numbering in the analyzed image starts from 1, while the result log starts from 0, leading to a one-index difference.
Critical: If the result is unsatisfactory, delete the problematic ROI and re-run the macro directly.
Data analysis
1. Process the immunofluorescence images of the control and experimental groups (Figure 11) using the steps outlined above to obtain their respective “result.csv” files. (Raw images have been uploaded as Supplementary material Figures S1–4.)
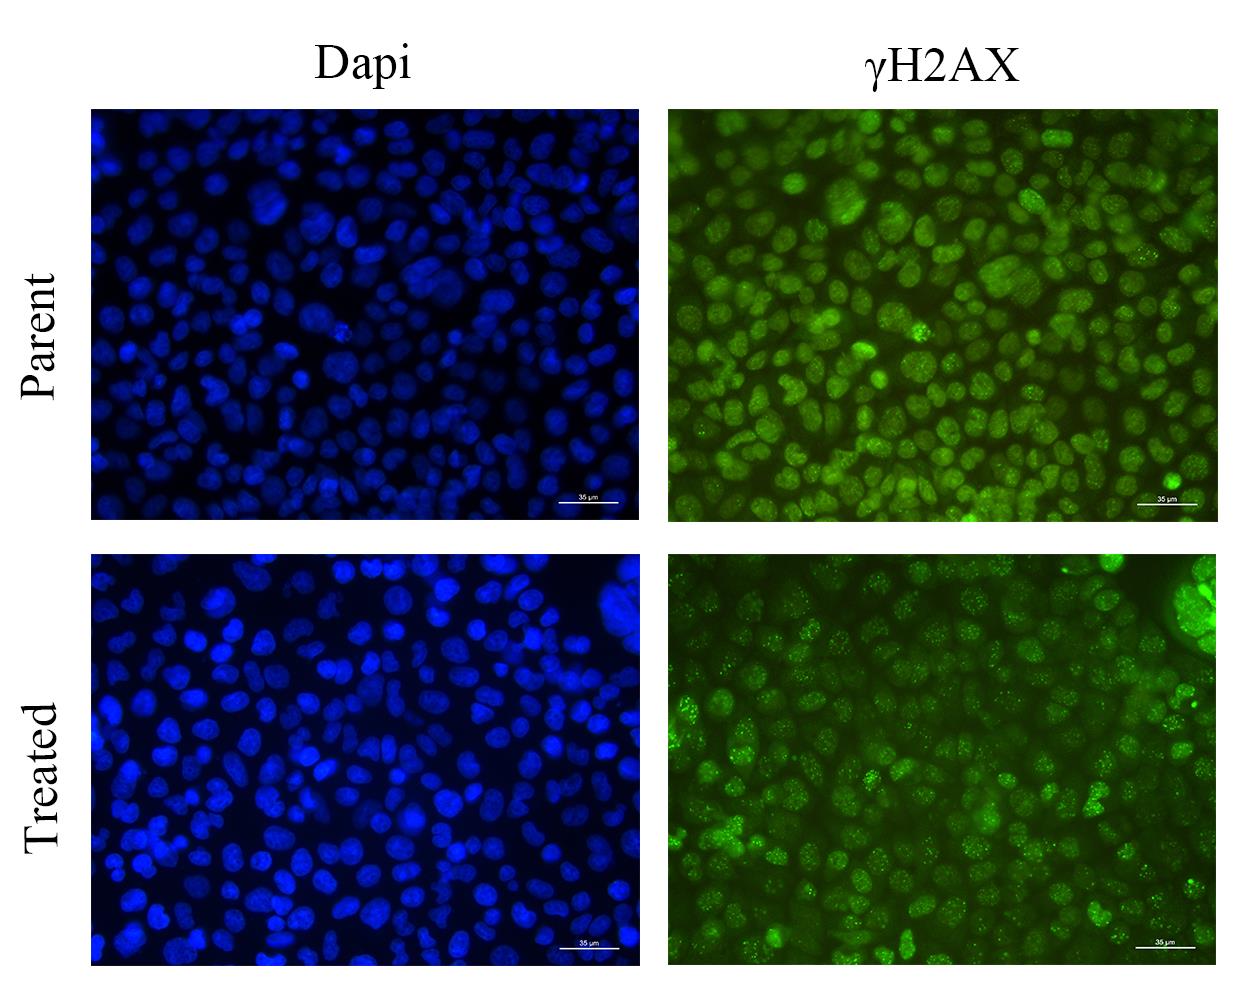
Figure 11. Immunofluorescence images of the parent and treated groups. Nuclei were counterstained with DAPI (blue). Green fluorescent foci indicate DNA damage sites labeled with γH2AX antibody. Scale bar: 35 µm.
Note: The output will be a CSV file named result.csv, automatically saved to the desktop after running the Fiji macro. The file contains two columns: the ROI number and the corresponding foci count, separated by commas. Data can be used for downstream statistical analysis.
2. Drag each group's “result.csv” file into Excel, extract the “Point” column, and perform statistical analysis using SPSS software. The results have been uploaded as Table S1. For data visualization, use GraphPad Prism to generate appropriate graphs (Figure 12).
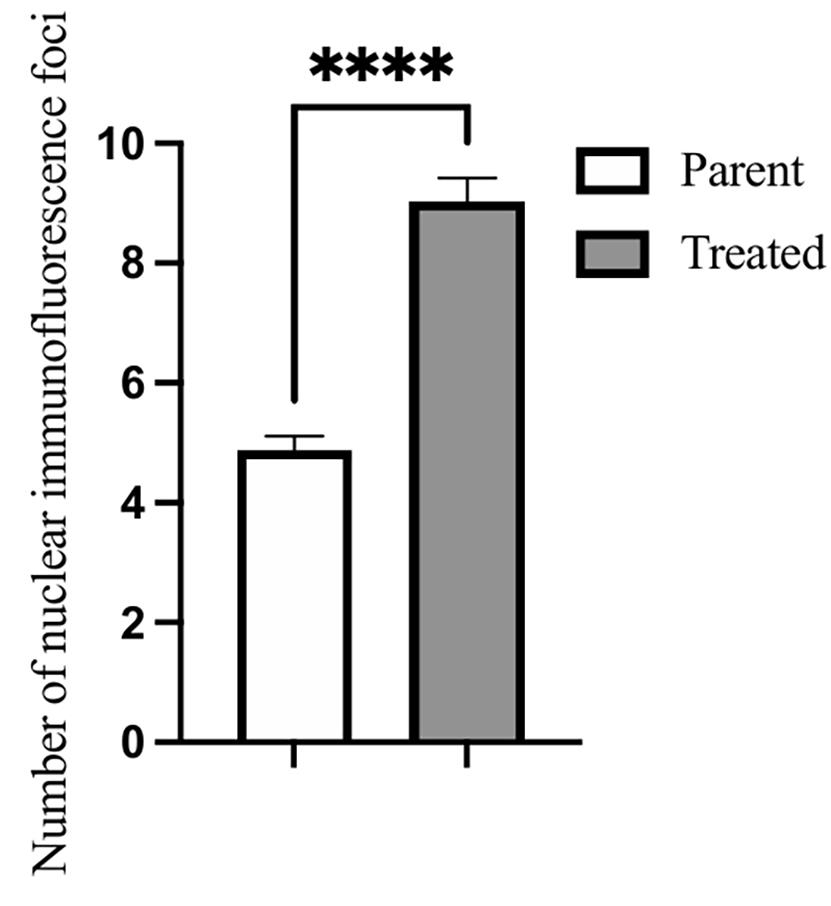
Figure 12. Statistical analysis of the number of γH2AX foci. Data are presented as mean ± SEM. Number of replicates > 100 in each group (parent = 237; treated = 198). Statistical analysis was performed using an unpaired two-tailed Student’s t-test. Error bars are SEM. ****P-value of P < 0.0001 after a two-tailed t-test.
Validation of protocol
Validation information is available in the Data analysis section.
General notes and troubleshooting
General notes
1. The accuracy of nuclear segmentation decreases significantly when nuclei overlap. To reduce segmentation error, choose images in which nuclei are clearly separated.
2. The current macro only supports image-by-image analysis. Batch processing of multiple images is not yet supported, which increases the time and labor cost.
3. The thresholding and particle analysis steps require manual adjustment based on image quality and magnification, potentially introducing user variability.
4. This protocol assumes a relatively clean background. High background fluorescence or DAPI channel noise (e.g., caused by mycoplasma contamination) may compromise ROI identification and lead to inaccurate foci quantification.
5. In Code S2, noiseTolerance is corrected to 70, and then the protocol can also be used to count cell clones, with the following steps:
a. Try to scan the 6-well plate vertically so that the bottom of each well is fully captured, avoiding reflections or occlusion by the edges as much as possible.
b. Open Fiji and install Code S2.
c. Open the image of cell clones and go to Image → Type → 8-bit.
d. Use the circular selection tool to outline the first well. Navigate to Analyze → Tools → ROI Manager → Add (Figure 13).
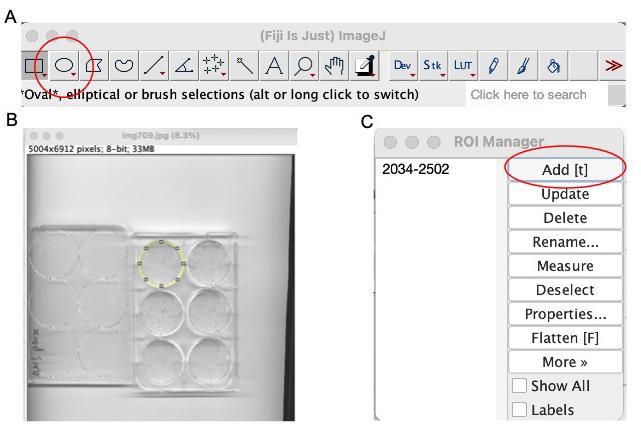
Figure 13. Statistical analysis of the number of γH2AX foci. (A) Circular selection tool. (B) Use the circular selection tool to outline the first well. (C) Navigate to Analyze → Tools → ROI Manager → Add.
e. Move the same circular selection to the remaining five wells without changing its size and click Add to Manager at each position.
f. Run the Code S2 in the macro; the results will be automatically saved to the desktop.
Note: If the counting results are significantly inaccurate, try adjusting the noiseTolerance parameter.
Troubleshooting
Problem 1: γH2AX foci are faint or barely visible under the fluorescence microscope.
Possible cause: Irradiation may not have been precisely targeted at the cellular level, or there may have been errors in the immunofluorescence staining procedure.
Potential solution: Ensure that the radiation is properly focused at the level of the cell monolayer during irradiation. During the immunofluorescence staining step, consider increasing the concentration of the primary antibody. Additionally, make sure there are no air bubbles trapped between the Parafilm and the coverslip, as this may hinder antibody-cell contact and reduce staining efficiency.
Problem 2: High background signal or nonspecific fluorescence observed under the microscope.
Possible cause: Mycoplasma contamination or insufficient removal of background impurities.
Potential solution: Verify that the cells are not contaminated with mycoplasma, as this may produce erratic background fluorescence, particularly in the DAPI channel. UV-treat the coverslips before seeding cells to reduce contamination risk. Ensure thorough washing with PBS at each step to remove unbound antibodies and reduce background staining.
Problem 3: Foci counts are abnormally low or high (visible in step E9).
Possible cause: The noiseTolerance value in the macro file may not suit specific experimental conditions.
Potential solution: Adjust the noiseTolerance parameter in the custom macro (line 10 in count_points.ijm) to match the size and brightness of the foci in your image.
Problem 4: All ROI numbers are duplicated in the result.csv output.
Possible cause: Previous ROIs were not cleared before re-running the macro.
Potential solution: After manually editing the ROIs, ensure that all entries in the ROI Manager are cleared before re-running the macro. To do this, select all ROIs in the ROI Manager and click Delete to avoid duplication in the output file.
Supplementary information
The following supporting information can be downloaded here:
1. Code S1. Code of “count_points.ijm”
2. Figure S1. Original picture of the DAPI channel of Parent group.
3. Figure S2. Original picture of γH2AX channel of Parent group.
4. Figure S3. Original picture of the DAPI channel of Treated group.
5. Figure S4. Original picture of γH2AX channel of Treated group.
6. Table S1. Results of foci analysis.
7. Code S2. Code used to count cell colonies.
Acknowledgments
Conceptualization, Lu Deng and Lingying Wu; Investigation, Lu Deng; Writing—Original Draft, Lu Deng; Writing—Review & Editing, Lu Deng and Danning Wang; Funding acquisition, Lingying Wu; Supervision, Lingying Wu. This work was supported by the National Natural Science Foundation of China (Grant No. 82473116). We gratefully acknowledge Dr. Kun Song for his valuable guidance on the code implementation.
Competing interests
The authors declare no conflicts of interest.
References
- Mah, L. J., El-Osta, A. and Karagiannis, T. C. (2010). γH2AX: a sensitive molecular marker of DNA damage and repair. Leukemia. 24(4): 679–686. https://doi.org/10.1038/leu.2010.6
- Rogakou, E. P., Pilch, D. R., Orr, A. H., Ivanova, V. S. and Bonner, W. M. (1998). DNA Double-stranded Breaks Induce Histone H2AX Phosphorylation on Serine 139. J Biol Chem. 273(10): 5858–5868. https://doi.org/10.1074/jbc.273.10.5858
- Ivashkevich, A., Redon, C. E., Nakamura, A. J., Martin, R. F. and Martin, O. A. (2012). Use of the γ-H2AX assay to monitor DNA damage and repair in translational cancer research. Cancer Lett. 327: 123–133. https://doi.org/10.1016/j.canlet.2011.12.025
- Schindelin, J., Arganda-Carreras, I., Frise, E., Kaynig, V., Longair, M., Pietzsch, T., Preibisch, S., Rueden, C., Saalfeld, S., Schmid, B., et al. (2012). Fiji: an open-source platform for biological-image analysis. Nat Methods. 9(7): 676–682. https://doi.org/10.1038/nmeth.2019
- Schneider, C. A., Rasband, W. S. and Eliceiri, K. W. (2012). NIH Image to ImageJ: 25 years of image analysis. Nat Methods. 9(7): 671–675. https://doi.org/10.1038/nmeth.2089
Article Information
Publication history
Received: May 23, 2025
Accepted: Jul 10, 2025
Available online: Aug 5, 2025
Published: Aug 20, 2025
Copyright
© 2025 The Author(s); This is an open access article under the CC BY-NC license (https://creativecommons.org/licenses/by-nc/4.0/).
How to cite
Deng, L., Wang, D. and Wu, L. (2025). Protocol for Quantifying γH2AX Foci in Irradiated Cells Using Immunofluorescence and Fiji Software. Bio-protocol 15(16): e5421. DOI: 10.21769/BioProtoc.5421.
Category
Cancer Biology > Genome instability & mutation > Cell biology assays > DNA structure and alterations
Molecular Biology > DNA > DNA damage and repair
Do you have any questions about this protocol?
Post your question to gather feedback from the community. We will also invite the authors of this article to respond.