- Protocols

- Articles and Issues
- For Authors
- About
- Become a Reviewer

Integrated Membrane Yeast Two-Hybrid System for the Analysis of Membrane Protein Complexes
Published: Vol 15, Iss 16, Aug 20, 2025 DOI: 10.21769/BioProtoc.5418 Views: 3082
Reviewed by: Asmita PawarAnonymous reviewer(s)
Original research article
The authors used this protocol in:
Jul 2023
Advertisement


Protocol Collections
Comprehensive collections of detailed, peer-reviewed protocols focusing on specific topics


Related protocols
![Metabolic Labeling of Yeast Sphingolipids with Radioactive D-erythro-[4,5-<sup>3</sup>H]dihydrosphingosine](https://en-cdn.bio-protocol.org/imageup/arcimg/20130820012439267.jpg?t=1774026164)
Abstract
Protein–protein interactions facilitate cellular functions through the creation of networks and multi-protein complexes. Mapping the interactions within and between protein networks and elucidating the composition of protein complexes provides critical insight into biological processes. Interactions among soluble cytoplasmic proteins have been extensively investigated through the application of immunoaffinity capture as well as conventional nuclear two-hybrid testing. The integrated membrane yeast two-hybrid provides a method to investigate protein–protein interactions between integral membrane proteins in their native membrane environment. This procedure makes use of the ability of the amino-terminal fragment of ubiquitin (Nub) and the carboxyl-terminal fragment of ubiquitin (Cub) to refold reconstituting functional ubiquitin, which can be recognized by a ubiquitin peptidase. Appending a fusion protein composed of Cub fused to LexA and VP16 (CLV) to a candidate "bait" protein and Nub to candidate "prey" proteins allows a test of their interaction. If the two proteins interact closely, the CLV fragment is cleaved and enters the nucleus to activate the expression of reporter genes, signaling the interaction. When the bait and prey proteins are tagged with CLV and NubG, respectively, at their genomic loci, they are only copies of the bait and prey in the cell and are expressed under the regulation of their native promoters. This avoids overexpression artifacts that can occur if the tagged proteins are expressed from plasmids while the untagged chromosomally encoded copies of the bait and prey continue to be expressed.
Key features
• Allows an in vivo interaction test with integral membrane proteins in the native membrane environment.
• Allows integration of NubG tag at the amino or carboxyl-terminus of prey proteins.
• Avoids overexpression artifacts that can be caused by expression of CLV-tagged bait and NubG-tagged prey proteins from plasmid-based systems.
• Avoids competition from untagged chromosomally encoded bait and prey proteins, as occurs when CLV-tagged bait and NubG-tagged prey are expressed from plasmids.
Keywords: YeastBackground
Protein–protein interactions drive and regulate a broad array of cellular processes [1]. Defining individual protein–protein interactions and mapping entire networks as interactomes has become a key tool for the interpretation of cellular function and complex phenotypes [2]. Protein species display tremendous diversity in structure and the chemical environment in which they accomplish their functions. This diversity ensures that no single approach is capable of effectively detecting all forms of protein–protein interactions that take place in any given cell type. In response to this challenge, a wide range of tools have been developed to investigate protein–protein interactions. These include biochemical strategies of co-fractionation, affinity purification, and proximity labeling [3,4]. Genetic approaches of two-hybrid and synthetic genetic arrays have also provided extensive data sets that add to the catalog of protein–protein interactions [5,6].
Any form of protein–protein interaction analysis that depends on protein isolation or purification has limitations regarding the ability to detect weak or transient interactions and the potential to generate false-positive interactions when cellular compartments are mixed following cell lysis. In vivo approaches to the analysis of protein–protein interactions benefit from sensitivity and an improved likelihood that proteins will retain their native structure. The nuclear yeast two-hybrid that detects the interaction between specified "bait" and "prey" proteins that are imported into the nucleus has allowed extensive interactome analysis and is effective for nuclear and many cytoplasmic proteins; however, some cannot interact correctly when removed from their native context and environment [7].
Integral membrane proteins that reside partially or entirely within the confines of a phospholipid bilayer compose around 30% of the proteome of characterized eukaryotic cells [8]. This class of proteins mediates, among other functions, communication, cell–cell interaction, transport of metabolites and small molecules, energy metabolism, and lipid biosynthesis. Considering the diverse functions and, in some cases, the cell surface localization, it is not surprising that membrane proteins are a large portion of drug targets [9]. The wide range of cellular processes controlled or influenced by this class of proteins highlights the importance of understanding their function and regulation. Proteins do not function in isolation, and their activity, localization, and modification state can be governed by their interaction with other proteins. Developing an understanding of these relationships among integral membrane proteins is challenging owing to the phospholipid membrane environment in which these proteins reside. The phospholipid membrane environment influences the structure and function of integral membrane proteins [10]. Investigations of the structure, function, and protein interactions of integral membrane proteins are complicated by this environment, as in many cases, removal from the membrane leads to loss of structural integrity and protein aggregation. Thus, not all interactions among integral membrane proteins can be reliably identified through biochemical methods that rely on protein removal from the native cellular environment.
A variety of techniques can be applied to investigating protein–protein interactions among integral membrane proteins, including affinity purification and co-immunoprecipitation of detergent-solubilized proteins [11,12]. These have limitations, namely the need to remove the proteins from their native lipid bilayer environment with potential for protein aggregation and loss of any low-affinity protein interactions. In vivo approaches, including proximity labeling experiments using fusions of a membrane protein to a biotin ligase, have been reported but have not been widely applied, possibly owing to the extensive analysis required to identify the binding partners [13]. A variety of fluorescence microscopy strategies, including fluorescence resonance energy transfer (FRET) and fluorescence recovery after photobleaching (FRAP), to investigate the interaction between integral membrane proteins, have been discussed in recent reviews [14,15]. These are dependent on high-resolution microscopy capabilities and require fusing the proteins of interest to fluorescent protein tags. They are most effective with larger cells, such as mammalian cells, and can be challenging when applied to small cells such as Saccharomyces cerevisiae.
A genetic approach based on the two-hybrid concept, modified for the detection of protein–protein interactions between integral membrane proteins, was pioneered by Dünnwald et al. [16]. This strategy was based on the small and highly conserved protein ubiquitin, which can be covalently ligated to target proteins by ubiquitin ligases and removed from proteins by ubiquitin peptidases (Ubp) [17]. A remarkable feature of ubiquitin is that the amino-terminal residues 1–34 can be expressed separately from the carboxyl-terminal residues 35–76; if the two halves are brought into close proximity, they will refold into a functional ubiquitin molecule that can be recognized by ubiquitin peptidases [18]. In this "split-ubiquitin" method, two proteins of interest can be fused: one with the amino-terminus of ubiquitin (Nub) and the other with the carboxyl-terminus of ubiquitin (Cub). If the two proteins interact with one another, the two fragments of ubiquitin will fold into a functional molecule [16]. The native yeast ubiquitin has an isoleucine residue at position 13 (Ile 13), providing the Nub fragment referred to as NubI with a very high affinity for Cub and the ability to spontaneously refold. The replacement of Ile 13 with a glycine residue creates NubG. This variant has a significantly reduced affinity for Cub and requires that NubG and Cub be in very close proximity before the two fragments can refold into a functional ubiquitin that can be recognized by ubiquitin peptidases [18]. Ubiquitin Ile 13 forms part of the hydrophobic core of the folded ubiquitin protein. The hydrophobic nature of this amino acid residue is important for the conformational stability of ubiquitin. Based on the crystal structure of ubiquitin, Ile13 is in a position to make hydrophobic interactions with amino acid Phe 3 and Val 5 [19]. A mutation of Ile 13 to glycine (Gly 13), creating NubG, reduces the potential for hydrophobic interactions at the amino-terminus of ubiquitin and reduces conformational stability of the protein molecule. The reduced conformational stability is reflected in a reduced ability to spontaneously refold, thus requiring the amino and carboxyl fragments of ubiquitin to be in very close proximity to allow refolding of Nub and Cub fragments and the reconstitution of Ubp cleavage [18].
A strategy utilizing a split-ubiquitin was directly applied to the analysis of membrane proteins by generating a reporter system that could detect when the two fragments of ubiquitin came into close contact and folded into a functional ubiquitin molecule [20]. This system, referred to as the membrane yeast two-hybrid (MYTH), makes use of a fusion protein composed of the Cub fragment fused to a DNA-binding protein domain from the E. coli LexA protein and a transcriptional activation domain from the Herpes simplex virus VP16 including a nuclear localization signal. This fusion protein Cub-LexA-VP16 is abbreviated to CLV. When the CLV fragment is fused to one protein (a bait protein), and the Nub fragment is fused to another (a prey protein), the fusions remain intact unless the bait and prey proteins bind to one another. If the two proteins bind, this brings CLV and NubG into close proximity, allowing the Nub and Cub fragments to fold and be recognized by cellular ubiquitin peptidases (Ubp). The Ubp can subsequently cleave the LexA-VP16 fragment from Cub of CLV, releasing LexA-VP16 to migrate into the nucleus (Figure 1). The detection mechanism for this event makes use of reporter genes under the regulation of upstream LexA operator sites (LexAop) so that when a LexA-VP16 fusion is released and enters the nucleus, it can bind the LexA operators, allowing the fused VP16 to trigger activation of the reporter genes (Figure 1). Common reporter genes used include HIS3, ADE2, and LacZ [20,21]. This genetic approach to testing for interactions between membrane proteins benefits from investigating the interactions in vivo, with the integral membrane proteins remaining in their native conformation and membrane environment. The approach has found wide application with systematic screens to characterize large interactomes among S. cerevisiae membrane proteins in the endoplasmic reticulum [22]. The strategy has also been applied to discover and characterize protein interactions and interactomes among mammalian and plant cell proteins [23–25].
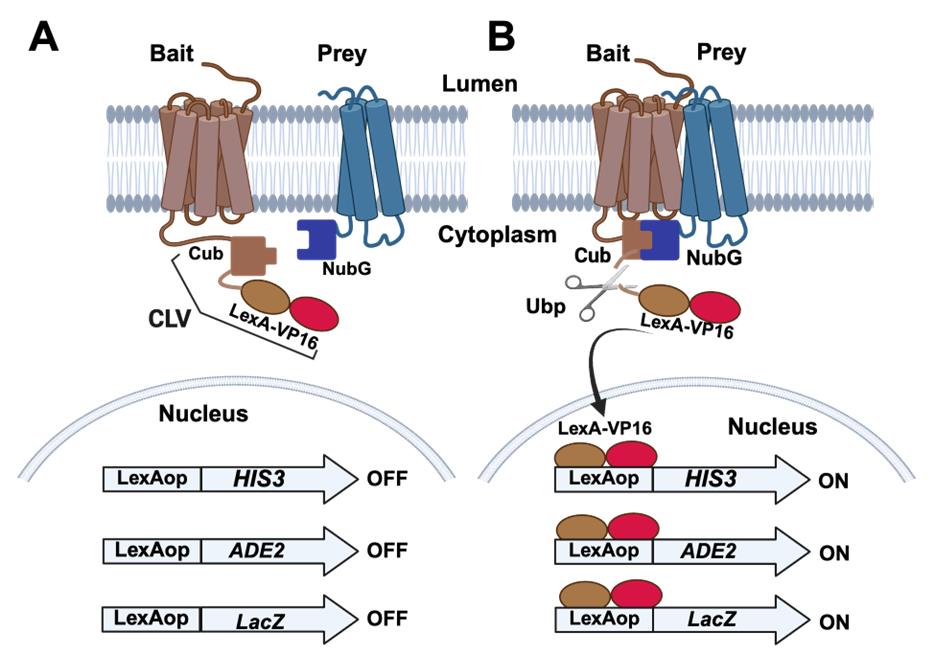
Figure 1. Split-ubiquitin membrane yeast two-hybrid (MYTH) systems. (A) The bait protein of interest is modified by the addition of a sequence coding for the carboxyl-terminus of ubiquitin (Cub) fused to the DNA binding protein LexA and transcriptional activation domain of VP16. This fusion is labeled as CLV in the figure. The prey protein is modified by the addition of a sequence coding for the amino-terminus of ubiquitin (NubG). The tester S. cerevisiae strain is also engineered by the addition of reporter genes under the regulation of LexA operator sites (LexAop) that can be bound by LexA. Commonly employed reporter genes include HIS3 and ADE2 that confer growth on medium lacking histidine and adenine. An additional reporter gene (LacZ) confers blue color development in the presence of X-Gal. In the absence of an interaction between the bait and prey proteins, the reporter genes are not activated, and yeast colonies will remain white in the presence of X-Gal and will not form in the absence of histidine and adenine. (B) In the case that the bait and prey proteins interact with one another, the Cub and NubG fragments will fold into a functional ubiquitin moiety and will be recognized for cleavage by ubiquitin peptidases (Ubp). This cleavage releases the LexA-VP16 fragment of the CLV fusion to migrate into the nucleus and activate the reporter genes, leading to blue colonies in the presence of X-Gal and growth on medium lacking histidine and adenine.
A variation of the MYTH assay that can be applied to investigations of S. cerevisiae membrane proteins is the integrated membrane yeast two-hybrid assay (iMYTH). In this approach, the endogenous gene encoding an integral membrane protein can be "tagged" with the CLV fusion to create a "bait" protein that can be used to identify interacting prey proteins [26].
Why use iMYTH?
The plasmid-borne split-ubiquitin approach has spawned a collection of plasmids that allow for the expression of amino and carboxyl-terminal fusion of CLV and Nub to bait and prey proteins [20]. These approaches are the only reasonable way to perform library screens where thousands of bait and prey proteins will be tested or when proteins from heterologous organisms are to be tested in S. cerevisiae. As a limitation, protein fusions will be overexpressed in the tester strain. When testing interactions between membrane proteins native to S. cerevisiae, if the CLV-tagged bait and NubG-tagged prey are placed under the regulation of their native promoters in episomal plasmids, both an untagged chromosomal gene and a tagged episomal gene will be expressed in the tester strain. This increases the expression of the bait and prey proteins and creates a situation where the tagged bait must compete with the untagged endogenous protein for binding partners. Additionally, overexpression can also induce mislocalization with the potential to induce false-positive interactions. Some integral membrane proteins are subject to regulation, which retains homeostasis over protein abundance. For example, the abundance of the essential ∆9 desaturase in S. cerevisiae, Ole1, is subject to regulation by the endoplasmic reticulum-associated degradation (ERAD) system; although Ole1 activity is essential, excess Ole1 is rapidly degraded [27]. When a plasmid-borne OLE1-CLV fusion is tested as a bait, this results in elevated auto-activation of the split-ubiquitin system, because ERAD-mediated degradation of the excess OLE1-CLV leads to release of the LexA-VP16 fusion and creates high background signal [28].
The iMYTH protocol is well-suited for testing interactions among protein species that naturally reside in the endoplasmic reticulum, peroxisome, or plasma membranes. The procedure can be effectively used for testing individual protein–protein interactions or for library screening with multiple bait proteins. One limitation of the iMYTH test for protein–protein interaction is that it cannot be employed if the CLV and/or NubG tags disrupt the structure or function of candidate bait and prey proteins. A related issue is that the topology of the bait and prey proteins must allow for both the CLV and NubG tags to be exposed on the cytosolic side of the membrane. Otherwise, they will not be accessible to the ubiquitin peptidases. When testing heterologous proteins not native to yeast in the iMYTH system, if the heterologous proteins require post-translational modifications for them to interact, those modifications may not occur in yeast, creating a limitation on the use of the assay. Similarly, heterologous proteins that interact with partners within the context of multiprotein complexes may not bind to specific partners in the absence of the entire complex. Additionally, heterologous proteins that display instability in S. cerevisiae may yield high background signals. Cases where the iMYTH assay is unsuitable for testing protein–protein interactions may be candidates for other procedures, including co-immunoprecipitation or microscopy-based co-localization studies. These alternative approaches have the advantage of being able to be performed on the cells where the proteins of interest naturally reside.
With the advent of PCR-mediated gene tagging [29], it has become possible to introduce fusions of the Cub-LexA-VP16 bait and NubG prey fusions into the chromosomal copies of the bait and prey genes. A primary advantage of employing an integrated bait or bait and prey approach is that the tagged proteins are retained under the regulation of their native promoters, and only one species of the protein is produced in the cells, rather than one tagged and one untagged version as would be the case if plasmid-borne copies of bait and/or prey were added to the cells. Thus, the tagged bait protein will be the only version participating in any complex formation in the cells. Further, this will aid in retaining stoichiometry within protein complexes and reduce the potential for false-positive signals that can be triggered by overexpression.
Materials and reagents
Biological materials
1. Escherichia coli DH5a F´/endA1 hsdR17 (rK– mK+) glnV44 thi-1 recA1 gyrA (NalR) relA1 Δ(lacIZYA-argF)U169 deoR (ϕ80dlacΔ(lacZ)M15) (E. coli Genetic Resource Center, CGSC:14231)
2. Saccharomyces cerevisiae strain NMY51 MATa, his3Δ200, trp1-901, leu2- 3,112, LYS2::4x(lexAop)-HIS3, ura3::8x(lexAop)-LacZ, ade2::8x(lexAop)-ADE2, GAL4 (LifeSciences Market, Hong Kong, catalog number: S0094)
Reagents
1. PageRulerTM prestained protein ladder (Thermo Fisher Scientific, catalog number: 26617)
2. SuperSignal West Pico Plus chemiluminescent substrate (Thermo Fisher Scientific, catalog number: 34577)
3. Antibody solutions
a. Primary: anti-HA HA.11 16B12 (1:10,000, mouse monoclonal antibody) (Covance, catalog number: 101R-500), anti-LexA (1:5,000, rabbit polyclonal) (EMD Millipore, catalog number: 06-719), anti-MYC, 9E10 (1:10,000, mouse monoclonal antibody) (Millipore Sigma, catalog number: M5546)
b. Secondary: anti-mouse HRP (1:5,000, goat anti-mouse IgG-HRP) (Bio-Rad, catalog number: 170-6516), anti-rabbit HRP (1:5,000, goat anti-rabbit IgG-HRP) (Bio-Rad, catalog number: 1706515)
4. Glycerol (Fisher Scientific, catalog number: 10795711)
5. Peptone (Fisher Scientific, catalog number: 211677)
6. Tryptone (BioShop Canada, catalog number: TRP402.5)
7. Glucose (Fisher Scientific, catalog number: 10141520)
8. Yeast extract (Fisher Scientific, catalog number: BP14222)
9. Lithium acetate dihydrate (Sigma-Aldrich, catalog number: L4158)
10. De-ionized water
11. Acetic acid (Fisher Scientific, catalog number: BP2401-500)
12. Salmon sperm DNA (ssDNA) (MilliporeSigma, catalog number: D1626)
13. Polyethylene glycol 3350 (BioShop Canada, catalog number: 335.1)
14. YNB without ammonium sulphate, without amino acids (BioShop Canada, catalog number: YNB404.1)
15. Potassium dihydrogen orthophosphate (Fisher Scientific, catalog number: 10783611)
16. Sodium phosphate dibasic (Na2HPO4) (Fisher Scientific, catalog number: BP332-500)
17. Sodium phosphate monobasic (NaH2PO4) (Fisher Scientific, catalog number: BP329-500)
18. Potassium acetate (KAc) (Fisher Scientific, catalog number: P181212)
19. Sodium acetate (NaOAc) (Fisher Scientific, catalog number: BP333-500)
20. Sodium carbonate (Na2CO3) (Fisher Scientific, catalog number: S263-500)
21. Potassium chloride (KCl) (Fisher Scientific, catalog number: BP366-1)
22. Dimethylsulfoxide (DMSO) (MilliporeSigma, catalog number: D8418)
23. Ethylenedinitrilotetraacetic acid (EDTA) (MilliporeSigma, catalog number: E6758)
24. Magnesium sulfate (MgSO4) (Fisher Scientific, catalog number: M65-500)
25. Trichloroacetic acid (TCA) (MilliporeSigma, catalog number: T9159)
26. Chloroform (Fisher Scientific, catalog number: C298-1)
27. Ethanol, 95%
28. 10 mM dNTP solution (Truin Science, catalog number: RTS5010)
29. Taq DNA polymerase (New England Biolabs, catalog number: M0267L)
30. Geneticin (G418) (Thermo Fisher Scientific, catalog number: 11811031)
31. Tris buffered phenol (Thermo Fisher Scientific, catalog number: 15513059)
32. RNase A (Fisher Scientific, catalog number: BP25391)
33. Ampicillin (Fisher Scientific, catalog number: BP1760-25)
34. Kanamycin sulfate (Thermo Fisher Scientific, catalog number: J17924.06)
35. Nourseothricin sulfate (MJS Biolynx, catalog number: JBAB10225G)
36. 5-bromo-4-chloro-3-indolyl-β-D-galactoside (X-Gal) (Fisher Scientific, catalog number: 15520034)
37. o-nitrophenyl-b-D-galactopyranoside (ONPG) (Thermo Fisher Scientific, catalog number: PI34055)
38. 0.5 mm acid-washed beads (Biospec products, catalog number: 11079105)
39. Agar (Fisher Scientific, catalog number: BP14232)
40. Agarose (Fisher Scientific, catalog number: BP1356500)
41. Adenine sulphate (MilliporeSigma, catalog number: A2545)
42. Uracil (Acros organics, catalog number: 157301000)
43. L-leucine (Fisher Scientific, catalog number: BP385-100)
44. L-tryptophan (MilliporeSigma, catalog number: T0254)
45. L-histidine (MilliporeSigma, catalog number: H8125)
46. L-methionine (Acros organics, catalog number: 166161000)
47. L-alanine (Fisher Scientific, catalog number: BP369-100)
48. L-arginine (Fisher Scientific, catalog number: BP370-100)
49. L-aspartic acid (Fisher Scientific, catalog number: BP374-100)
50. L-asparagine (Fisher Scientific, catalog number: BP373-100)
51. L-cysteine (MP Biomedicals, catalog number: 101444)
52. L-glutamic acid (MilliporeSigma, catalog number: 49449-100)
53. L-glutamine (MilliporeSigma, catalog number: 63126)
54. L-glycine (Fisher Scientific, catalog number: BP381-100)
55. L-isoleucine (Fisher Scientific, catalog number: BP384-100)
56. L-lysine (Fisher Scientific, catalog number: BP386-100)
57. L-phenylalanine (Fisher Scientific, catalog number: BP391-100)
58. L-proline (Fisher Scientific, catalog number: BP392-100)
59. L-serine (Fisher Scientific, catalog number: BP393-100)
60. L-threonine (Fisher Scientific, catalog number: BP394-100)
61. L-tyrosine (Fisher Scientific, catalog number: BP396-100)
62. L-valine (Fisher Scientific, catalog number: BP397-100)
63. 3-amino-1,2,4-trazole (3AT) (Millipore Sigma, catalog number: A8056)
64. Sodium dodecyl sulfate (SDS) (Bio-Rad, catalog number: 1610302)
65. DL-dithiothreitol (DTT) (Fisher Scientific, catalog number: BP172-5)
66. 30% Acrylamide 29:1 (Bio-Rad, catalog number: 1610156)
67. Bromophenol blue (Bio-Rad, catalog number: 161-0404)
68. Ammonium persulfate (Fisher Scientific, catalog number: 10020020)
69. TEMED (MilliporeSigma, catalog number: T9281)
70. Ammonium sulphate (Fisher Scientific, catalog number: BP212-212)
71. Tris base (Fisher Scientific, catalog number: BP152-1)
72. Glycine (Fisher Scientific, catalog number: 10070150)
73. Methanol (Fisher Scientific, catalog number: A412-4)
74. Sodium chloride (NaCl) (Fisher Scientific, catalog number: BP358-1)
75. Hydrochloric acid (HCl) (Fisher Scientific, catalog number: 351280-212)
76. Tween® 20 (Fisher Scientific, catalog number: BP151-500)
77. Gibson Assembly master mix (New England Biolabs, catalog number: E2621S)
78. Milk powder (Compliments, Canada)
79. Acetone (Fisher Scientific, catalog number: A18-1)
80. Triton X-100 (Fisher Scientific, catalog number: BP151-100)
Plasmid vectors
| Plasmid | Features | Marker | Source or reference |
|---|---|---|---|
| pUG-CLVt | Cub-LexA-VP16-KanR template | KanR | [28] |
| pADSL-Nx | High copy NubG prey plasmid C-term fusion | TRP1 | [42, 43] |
| pADSL-xN | High copy NubG prey plasmid N-term fusion | TRP1 | [42, 43] |
| pALG5-NubG | (negative control) prey plasmid | TRP1 | [42, 43] |
| pALG5-NubI | (positive control) prey plasmid | TRP1 | [42, 43] |
| pOST1-NubG | (negative control) prey plasmid | TRP1 | [42, 43] |
| pOST1-NubI | (positive control) prey plasmid | TRP1 | [42, 43] |
| pFUR4-NubG | (negative control) prey plasmid | TRP1 | [42, 43] |
| pFUR4-NubI | (positive control) prey plasmid | TRP1 | [42, 43] |
| pNAT-xN | Prey-NubG-NatR template | NatR | This work |
| pNAT-xNI | Prey-NubI-NatR template | NatR | This work |
| pNAT ADH-Nx | NatR-PADH1-NubG-prey template | NatR | This work |
Oligonucleotides
Oligonucleotides for iMYTH bait amplification
| Name | Sequence features 5′–3′ |
| F1 | (60 gene-specific nt)-G GCC ACT AGT ATG GAA CAA AAA C |
| R1 | (60 gene-specific nt)-TAC GCT GCA GGT CGA CAA CC |
| Integrated bait verification | |
| KanRscf | CCT CGA CAT CAT CTG CCC hybridize with KanR |
| ibvF | A 20-nucleotide primer corresponding to a sequence approximately 150–200 bp upstream of the stop codon of the gene of interest |
Open reading frame amplification for plasmid-borne prey
| Amino-terminal NubG fusions: | |
| Name | Sequence features 5′–3′ |
| NxF | GGT GGT CCA TAC CCA TAC GAT GTT CCA GAT TAC GCT GGA TCC-(gene-specific nt) |
| NxR | CTC GAG GTC GAC GGT ATC GAT AAG CTT GAT ATC GAA TTC T-(gene-specific nt) |
| Carboxyl-terminal NubG fusions: | |
| xNF | CAA TCA ACT CCA AGC TGG CCG CTC TAG AAC TAG TGG ATC C-(gene-specific nt) |
| xNR | AAC ATC GTA TGG GTA CAT ATC GAT AAG CTT GAT ATC GAA TTC-(gene-specific nt) |
Oligonucleotides for prey open reading frame amplification for integration
| Carboxyl-terminal NubG fusion | |
| Name | Sequence features 5′–3′ |
| NatxNF | (60 prey gene-specific nt)- TAC CCA TAC GAT GTT CCA GAT TAC |
| NatxNR | (60 prey gene-specific nt)- CGA CTC ACT ATA GGG AGA CC |
| Carboxyl-terminal NubG confirmation oligonucleotides: | |
| ipvCF | A 20-nucleotide primer corresponding to a sequence approximately 150–200 bp upstream of the final codon of the bait gene of interest |
| CYCt | CTT CCT TTT CGG TTA GAG CGG hybridize with CYCt. |
| Amino-terminal NubG fusion | |
| NatNxf | (60 prey gene-specific nt)-AAG CTT CGT ACG CTG CAG G |
| NatNxr | (60 gene-specific nt)-TTG ATA CCA CTG CTT GGA TCC |
| Amino-terminal NubG confirmation oligonucleotides: | |
| ADHnv | CTC GTC ATT GTT CTC GTT CCC hybridize with ADH1 promoter. |
| ipvNR | A 20-nucleotide primer corresponding to a sequence approximately 150–200 bp downstream of the start codon of the bait gene of interest |
Solutions
1. PCR reaction buffer (see Recipes)
2. 1 M Tris-HCl pH 8.0 (see Recipes)
3. 0.5 M EDTA (see Recipes)
4. 1 M LiAc (see Recipes)
5. 3 M sodium acetate pH 5.2 (see Recipes)
6. TE buffer (see Recipes)
7. TAE buffer (1 L 50× stock) (see Recipes)
8. Yeast lysis buffer (see Recipes)
9. 2× Sample buffer (see Recipes)
10. 12% Polyacrylamide separating gel (see Recipes)
11. 4% Polyacrylamide separating gel (see Recipes)
12. SDS running buffer (see Recipes)
13. TBST (see Recipes)
14. Blocking solution (see Recipes)
15. Semi-dry transfer buffer (see Recipes)
16. LiAc-TE (see Recipes)
17. 50% PEG (see Recipes)
18. 2 mg/mL salmon sperm DNA (see Recipes)
19. LiAc-PEG (see Recipes)
20. Z-buffer (see Recipes)
21. LB (see Recipes)
22. YEPD (see Recipes)
23. Synthetic dropout (SD) medium (see Recipes)
24. SD dropout mixture (see Recipes)
25. X-Gal (see Recipes)
26. Sodium phosphate solution (see Recipes)
27. X-Gal plates (see Recipes)
Recipes
1. PCR reaction buffer
| Reagent | Final concentration | Quantity or Volume |
|---|---|---|
| 1 M Tris-HCl pH 8.8 | 20 mM | 20 μL |
| 1 M (NH4)2SO4 | 10 mM | 10 μL |
| 1 M KCl | 10 mM | 10 μL |
| 10% Triton X-100 | 0.1% | 10 μL |
| 1 M MgSO4 | 2 mM | 2 μL |
| H2O | n/a | 948 μL |
| Total | n/a | 1 mL |
2. 1 M Tris-HCl pH 8.0
| Reagent | Final concentration | Quantity or Volume |
|---|---|---|
| Tris base | 1 M | 121.1 g |
| H2O | n/a | to 1 L |
| Total | n/a | 1 L |
Dissolve the Tris base in 800 mL of water. Adjust the pH to 8.0 with concentrated HCl and make up the final volume to 1 L with H2O.
3. 0.5 M EDTA
| Reagent | Final concentration | Quantity or Volume |
|---|---|---|
| Na·EDTA·2H2O | 0.5 M | 181.6 g |
| H2O | n/a | to 1 mL |
| Total | n/a | 1 L |
Add the EDTA to about 800 mL of water and stir. Adjust pH to 8.0 with NaOH. The EDTA will not go into solution until the pH is near 8.0.
4. 1 M LiAc
| Reagent | Final concentration | Quantity or Volume |
|---|---|---|
| CH3COOLi·2H2O | 1 M | 10.2 g |
| H2O | n/a | to 100 mL |
| Total | n/a | 100 mL |
5. 3 M sodium acetate pH 5.2
| Reagent | Final concentration | Quantity or Volume |
|---|---|---|
| Sodium acetate·3H2O | 3 M | 408.1 g |
| H2O | n/a | to 1 L |
| Total | n/a | 1 L |
Add the sodium acetate to about 800 mL of water and stir. Adjust pH to 5.2 with glacial acetic acid.
6. TE buffer
| Reagent | Final concentration | Quantity or Volume |
|---|---|---|
| 1 M Tris-HCl pH 8.0 | 10 mM | 1 mL |
| 0.5 M EDTA pH 8.0 | 1 mM | 200 μL |
| H2O | n/a | to 100 mL |
| Total | n/a | 100 mL |
7. TAE buffer (1 L 50× stock)
| Reagent | Final concentration | Quantity or Volume |
|---|---|---|
| Tris base | 2 M | 242 g |
| Glacial acetic acid | 1 M | 57 mL |
| 0.5 M EDTA pH 8.0 | 50 mM | 100 mL |
| H2O | n/a | to 1 L |
| Total | n/a | 1 L |
8. Yeast lysis buffer
| Reagent | Final concentration | Quantity or Volume |
|---|---|---|
| 1 M Tris-HCl pH 7.5 | 50 mM | 0.5 mL |
| 0.5 M EDTA pH 8.0 | 20 mM | 0.4 mL |
| 10% SDS | 1% SDS | 1 mL |
| H2O | n/a | 8.1 mL |
| Total | n/a | 10 mL |
9. 2× Sample buffer
| Reagent | Final concentration | Quantity or Volume |
|---|---|---|
| 1 M Tris-HCl pH 6.8 | 125 mM | 1.25 mL |
| 10% SDS | 4% SDS | 4 mL |
| Glycerol | 20% | 2 mL |
| Bromophenol blue | 0.01% | 0.001 g |
| H2O | n/a | 2.75 mL |
| Total | n/a | 10 mL |
10. 12% Polyacrylamide separating gel
| Reagent | Final concentration | Quantity or Volume |
|---|---|---|
| ddH2O | n/a | 3.33 mL |
| 1.5 M Tris-HCl pH 8.8 | 375 mM | 2.5 mL |
| 30% acrylamide solution 29:1 | 12% | 4 mL |
| 10% SDS | 0.1% | 0.1 mL |
| Total | n/a | 10 mL |
11. 4% Polyacrylamide separating gel
| Reagent | Final concentration | Quantity or Volume |
|---|---|---|
| ddH2O | n/a | 2.6 mL |
| 1 M Tris-HCl pH 6.8 | 126 mM | 0.63 mL |
| 30% acrylamide solution 29:1 | 4% | 0.67 mL |
| 10% SDS | 0.1% | 0.05 mL |
| Total | n/a | 5 mL |
12. SDS running buffer
| Reagent | Final concentration | Quantity or Volume |
|---|---|---|
| Glycine | 14.4 g/L | 14.4 g |
| Tris-base | 3.02 g/L | 3.02 g |
| SDS | 1 g/L | 1 g |
| H2O | n/a | to 1 L |
| Total | n/a | 1 L |
13. TBST
| Reagent | Final concentration | Quantity or Volume |
|---|---|---|
| Tris-base | 3 g/L | 3 g |
| NaCl | 8.0 g/L | 8 g |
| KCl | 0.2 g/L | 0.2 g |
| Tween-20 | 0.2% | 2 mL |
| H2O | n/a | to 1 L |
| Total | n/a | 1 L |
14. Blocking solution
| Reagent | Final concentration | Quantity or Volume |
|---|---|---|
| Skim milk powder | 5% | 5 g |
| TBST | n/a | 100 mL |
| Total | n/a | 100 mL |
15. Semi-dry transfer buffer
| Reagent | Final concentration | Quantity or Volume |
|---|---|---|
| Glycine | 39 mM | 1.9 g |
| Tris base | 48 mM | 2.5 g |
| 10% SDS | 0.037% | 3.7 mL |
| Methanol | 20% | 200 mL |
| H2O | n/a | 796.3 mL |
| Total | n/a | 1 L |
16. LiAc-TE
| Reagent | Final concentration | Quantity or Volume |
|---|---|---|
| 1 M LiAc | 100 mM | 5 mL |
| TE buffer | n/a | 45 mL |
| Total | n/a | 50 mL |
17. 50% PEG
| Reagent | Final concentration | Quantity or Volume |
|---|---|---|
| PEG 3350 | 50% | 50 g |
| H2O | n/a | to 100 mL |
| Total | n/a | 100 mL |
Add 50 g of PEG 3350 to about 30 mL of ddH2O. Gently warm the solution on a heated stir plate and stir until it is dissolved. Pour into a 100 mL measuring cylinder, bring the volume to 100 mL, and mix thoroughly. Transfer the solution to a glass storage bottle, and autoclave at 121 °C for 15 min. After autoclaving, add sterile water if needed to return the volume to 100 mL.
18. 2 mg/mL salmon sperm DNA
| Reagent | Final concentration | Quantity or Volume |
|---|---|---|
| Salmon sperm DNA | 50% | 200 mg |
| TE buffer | n/a | 100 mL |
| Total | n/a | 100 mL |
Prepare stocks by dissolving 200 mg of salmon sperm DNA in 100 mL of sterile TE by gently stirring using a stir bar and magnetic stir plate. This should take from a few hours to overnight. The dissolution can be accelerated using a wide-bore 25 mL pipette to pipette the mixture up and down until chunks of DNA are no longer visible. The DNA can be dispensed into aliquots of 1.0 mL in 1.5 mL microcentrifuge tubes and 5 mL samples in 15 mL sterile screw-capped plastic centrifuge tubes and stored at -20 °C. Immediately before use, denature the carrier DNA in a boiling water bath for 5 min and chill on ice.
19. LiAc-PEG
| Reagent | Final concentration | Quantity or Volume |
|---|---|---|
| 50% PEG 3350 | 40% | 8 mL |
| 1 M LiAc | 100 mM | 1 mL |
| 2 mg/mL salmon sperm DNA | 0.3 mg/mL | 1.5 mL |
| 1 M Tris-HCl pH 8.0 | 10 mM | 0.1 mL |
| 0.5 M EDTA | 1 mM | 20 μL |
| Total | n/a | 10 mL |
20. Z-buffer
| Reagent | Final concentration | Quantity or Volume |
|---|---|---|
| Na2HPO4 | 60 mM | 16.1 g |
| NaH2PO4 | 40 mM | 5.5 g |
| KCl | 10 mM | 0.75 g |
| MgSO4 | 1 mM | 0.246 g |
| H2O | n/a | to 1 L |
| Total | n/a | 1 L |
21. LB
| Reagent | Final concentration | Quantity or Volume |
|---|---|---|
| BactoTM tryptone | 10 g/L | 10 g |
| Yeast extract | 5 g/L | 5 g |
| NaCl | 5 g/L | 5 g |
| Agar | 20 g/L | 20 g |
| H2O | n/a | to 1 L |
| Total | n/a | 1 L |
Autoclave at 121 °C for 30 min. Pour plates to prepare solid medium.
22. YEPD
| Reagent | Final concentration | Quantity or Volume |
|---|---|---|
| BactoTM peptone | 20 g/L | 20 g |
| Yeast extract | 10 g/L | 10 g |
| Glucose | 20 g/L | 20 g |
| Adenine sulfate | 40 mg/L | 40 mg |
| H2O | n/a | to 1 L |
| Total | n/a | 1 L |
Autoclave at 121 °C for 30 min.
23. Synthetic dropout (SD) medium
| Reagent | Final concentration | Quantity or Volume |
|---|---|---|
| Yeast nitrogen base | 1.6 g/L | 1.6 g |
| (NH4)2SO4 | 5 g/L | 5 g |
| Glucose | 20 g/L | 20 g |
| Amino acid dropout mixture | 2 g/L | 2 g |
| Agar | 20 g/L | 20 g |
| H2O | n/a | to 1 L |
| Total | n/a | 1 L |
Autoclave at 121 °C for 30 min. Pour plates to prepare solid medium. Note that the nomenclature for this form of medium indicates which nutrients are deficient. For example, medium lacking tryptophan and histidine would be indicated as SD -trp -his.
24. SD dropout mixture
| Reagent | Final concentration | Quantity or Volume |
|---|---|---|
| Adenine sulfate | 2.2% | 1 g |
| Leucine | 8.9% | 4 g |
| Uracil | 4.4% | 2 g |
| Alanine | 4.4% | 2 g |
| Arginine | 4.4% | 2 g |
| Aspartate | 4.4% | 2 g |
| Asparagine | 4.4% | 2 g |
| Cysteine | 4.4% | 2 g |
| Glutamate | 4.4% | 2 g |
| Glutamine | 4.4% | 2 g |
| Glycine | 4.4% | 2 g |
| Histidine | 4.4% | 2 g |
| Isoleucine | 4.4% | 2 g |
| Lysine | 4.4% | 2 g |
| Methionine | 4.4% | 2 g |
| Phenylalanine | 4.4% | 2 g |
| Proline | 4.4% | 2 g |
| Serine | 4.4% | 2 g |
| Threonine | 4.4% | 2 g |
| Tryptophan | 4.4% | 2 g |
| Tyrosine | 4.4% | 2 g |
| Valine | 4.4% | 2 g |
| Total | 45 g |
A specific dropout medium is prepared by excluding particular nutrients. For example, -trp -leu dropout is prepared as above, but without the addition of tryptophan and leucine.
25. X-Gal
| Reagent | Final concentration | Quantity or Volume |
|---|---|---|
| X-Gal | 100 mg/mL | 0.1 g |
| Dimethylformamide | n/a | 1 mL |
| Total | n/a | 1 mL |
26. Sodium phosphate solution
| Reagent | Final concentration | Quantity or Volume |
|---|---|---|
| Na2HPO4 | 70 g/L | 70 g |
| NaH2PO4 | 30 g/L | 30 g |
| H2O | n/a | up to 1 L |
| Total | n/a | 1 L |
27. X-Gal plates
| Reagent | Final concentration | Quantity or Volume |
|---|---|---|
| Yeast nitrogen base | 1.6 g/L | 1.6 g |
| (NH4)2SO4 | 5 g/L | 5 g |
| Glucose | 20 g/L | 20 g |
| Amino acid dropout mixture | 2 g/L | 2 g |
| Agar | 20 g/L | 20 g |
| Sodium phosphate solution | 10% | 100 mL |
| 100 mg/mL X-Gal solution | 0.08 mg/mL | 0.8 mL |
| H2O | n/a | to 1 L |
| Total | n/a | 1 L |
Mix all components except for sodium phosphate and X-Gal. Autoclave at 121 °C for 30 min, cool to 50 °C, and then add the sodium phosphate and X-Gal. Mix briefly and then pour plates to prepare the solid medium. Store in the dark.
Laboratory supplies
1. Sterile toothpicks
2. Blue screw cap tubes, 50 mL (FroggaBio, catalog number: TB50-25)
3. Blue screw cap tubes, 15 mL (FroggaBio, catalog number: TB15-25)
4. Screw cap tubes, 2 mL (Sarstedt, catalog number: 72.693.005)
5. PCR tubes, 0.2 mL, domed cap (Axygen, catalog number: PCR-02D-C)
6. 1.5 mL microfuge tube (Fisher Scientific, catalog number: 05408129)
7. 25 mm Syringe filter 0.2 μm PES membrane (Fisher Scientific, catalog number: 13-1001-06)
8. Chromatography paper (Fisher Scientific, catalog number: 05-714-4)
9. Petri dishes, 100 mm (Fisher Scientific, catalog number: FB0875712)
10. Culture tubes 16 × 150 mm (MilliporeSigma, catalog number: CLS982016X)
11. Disposable cuvette (Fisher Scientific, catalog number: 14955127)
12. DNA Miniprep kit (Qiagen, catalog number: 27106)
13. 25-gauge needles (Fisher Scientific, catalog number: 1482649)
14. Immobilon-FL PVDF transfer membranes (Millipore, catalog number: IPFL00010)
Equipment
1. Spectrophotometer Ultraspec 3000 (Pharmacia-LKB, catalog number: 80-2106-25 DX)
2. Incubators (VWR, model: 1545, catalog number: 35823-204)
3. Water bath incubator (Thermo Fisher, catalog number: TSGP2S)
4. Microcentrifuge 5425R (Eppendorf Canada Ltd, catalog number: 5406000445)
5. Simpliamp thermal cycler (Thermo Fisher Scientific, catalog number: A24811)
6. Mini-protean vertical electrophoresis cell (Bio-Rad Laboratories, catalog number: 1658001FC)
7. Semi-dry transfer apparatus (Tyler Instruments, catalog number: TSD15-24)
8. Vortex (Fisher Scientific, catalog number: 12-812)
9. Imaging system, Gel-Doc XR (Bio-Rad Laboratories, catalog number: 170-8195)
10. Horizontal gel electrophoresis apparatus (Bio-Rad Laboratories, catalog number: 1704466)
11. Li-COR odyssey XF Western blot imaging system (LICORbio)
Procedure
A. Construction of the MYC-Cub-LexA-VP16 tagged bait
A critical step in generating an iMYTH screening process is the fusion of the Cub-LexA-VP16 coding sequence onto the 5′ or 3′ end of the chromosomal gene encoding the bait protein. The CLV fusion is available in the episomal plasmids pTMBV4 and pAMBV4 [30]. The fusion has also been introduced into the vector pUG6 [28] (Figure 2A). The pUG6 vector harbors a kanr gene from the E. coli transposon Tn903. When expressed in S. cerevisiae, the kanr gene (KanMX) confers dominant resistance to G418 [31]. The heterologous nature of this drug resistance cassette reduces the degree of mislocalization that occurs when using native auxotrophic markers for selection. The Cub-LexA-VP16 in pUG-CLVt was modified by the addition of a 5′ MYC epitope to simplify detection of the bait fusion. This vector can act as a template for the production of a fragment that can be directed to integrate at the 3′ end of the coding sequence of a bait gene of interest. Oligonucleotides with 3′ homology to the vector and long 5' overhangs with homology to a target gene can be used for PCR with the pUG-CLVt plasmid template to amplify the MYC-CLV fusion and the G418 resistance marker, yielding a PCR fragment with 5' homology to the 3′ end of the bait gene coding sequence and 3' homology to the DNA sequence downstream of the bait gene coding sequence. This procedure is detailed in Longtine et al. [29]. The 5′ oligonucleotide with homology to the bait gene coding sequence needs to be designed with homology at the 5' end that will remove the stop codon from the bait gene and create a fusion in-frame with the MYC-Cub-LexA-VP16 sequence. While 30 bp overhangs with homology to the target sequence are sufficient to achieve correctly targeted integrations, the frequency of correct integrations is improved by longer regions of homology, and we routinely use 60 bp of homology. Standard PCR amplification conditions will vary with the oligonucleotide design.
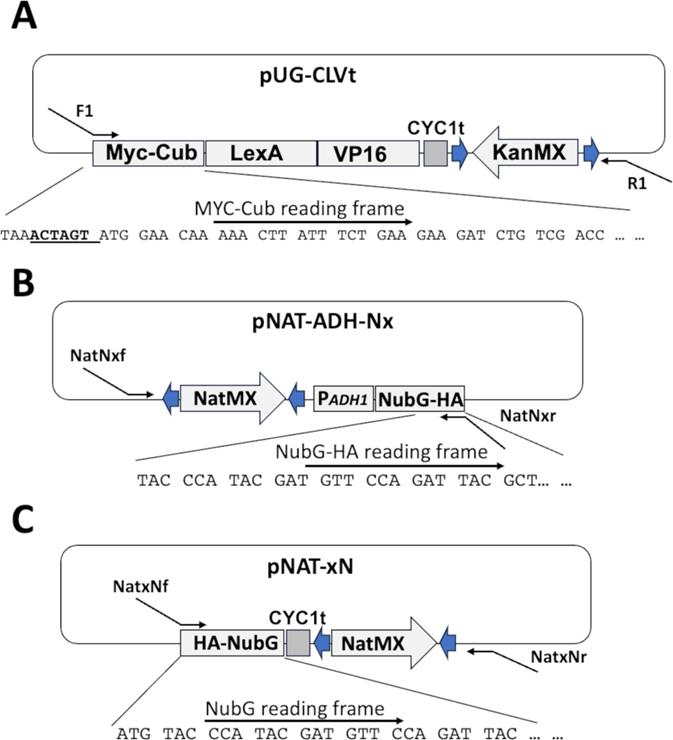
Figure 2. Vectors for generating integrated bait and prey for iMYTH screening. (A) pUG-CLVt encodes a MYC-tagged Cub-LexA-VP16 coding sequence and a G418 resistance gene (KanMX). The KanMX cassette is flanked by loxP sequences (blue arrows). The MYC-Cub-LexA-VP16-KanMX DNA fragment can be amplified from the plasmid template by PCR with oligonucleotides F1/R1. These oligonucleotides can be designed such that the 5′ end of F1 has homology to the 3' end of the bait gene coding sequence, and R1 has 5′ homology to the 3′ untranslated region of the bait gene. Transformation of the PCR product into yeast allows the MYC-Cub-LexA-VP16 cassette to recombine into the chromosomal bait gene with G418 for selection. (B) pNAT-ADH-Nx encodes an ADH1 promoter-driven NubG and nourseothricin sulfate resistance gene (NatMX). The cassette can be amplified by oligonucleotides NatNxf/NatNxr. The resulting PCR fragment can integrate the NubG at the amino terminus of a prey gene using nourseothricin sulfate for selection. (C) The vector pNAT-xN encodes the NubG and NatMX sequences that can be amplified with oligonucleotides NatxNf/NatxNr. The resulting PCR product can be used to integrate NubG at the carboxyl-terminus of a prey gene using nourseothricin sulfate for selection. A NubI version of pNAT-xN (not shown) is available for use as positive control.
A1. Amplify MYC-Cub-LexA-VP16 fragment from plasmid pUG-CLVt
1. Prepare pUG-CLVt plasmid DNA for amplification of the MYC-Cub-LexA-VP16 fusion and G418 resistance marker (Figure 2A).
2. Perform PCR in 50 μL reactions with the pUG-CLVt as the template and oligonucleotides F1/R1.
3. PCR conditions will vary with primer design.
4. Pool 2 or more 50 μL PCR reactions (ideally 1–5 μg of DNA).
5. Add 10 μL of 10 mg/mL salmon sperm DNA to the pooled PCR reactions.
6. Add 1/10th volume of 3 M sodium acetate pH 5.2.
7. Precipitate the DNA by adding 2 volumes of cold 95% ethanol.
8. Store at -20 °C for 20–60 min.
9. Collect DNA by centrifugation at 14,000× g for 15 min.
10. Aspirate the ethanol.
11. Resuspend the DNA pellet in 500 μL of cold 70% ethanol.
12. Mix by vortexing for 10–15 s.
13. Collect the DNA by centrifugation at 14,000× g for 10 min.
14. Aspirate the ethanol.
15. Allow the samples to air dry.
16. Resuspend in 20 μL of TE buffer.
17. Use this fragment to transform the NMY51 S. cerevisiae strain to be used for screening (see Section A2).
A2. S. cerevisiae transformation
1. Culture the S. cerevisiae strain NMY51 in YEPD medium overnight.
2. Following overnight growth, dilute the culture to an OD600 ⁓0.5 in a volume of 50 mL of YEPD.
3. Incubate the culture at 30 °C with agitation at 200 rpm until an OD600 ⁓1–1.5 is achieved.
4. Collect the culture in a 50 mL conical tube by centrifugation (5,000× g for 3–5 min).
5. Wash the cell pellet once in 50 mL of sterile water.
6. Collect the cells by centrifugation (5,000× g for 3 min).
7. Resuspend the cells in 1 mL of 100 mM LiAc.
8. Incubate at 30 °C with gentle agitation (200 rpm) for 15–30 min.
9. Take 100 μL of the cells to a 1.5 mL microfuge tube as a NO-DNA control.
10. Take 100 μL of cells to a 1.5 mL microfuge tube for transformation.
11. Add 1–5 μg of the PCR product to the transformation tube.
12. Add sterile water (40 μL or less) to the control tube.
13. To each tube, add 25 μL of 2 mg/mL boiled salmon sperm DNA.
14. Mix the DNA and cells by pipetting.
15. To each tube, add 240 μL of 50% PEG.
16. Add 36 μL of 1 M LiAC.
17. Mix by pipetting.
18. Incubate at 30 °C for 30 min to 2 h.
19. Heat-shock the samples by placing the tubes at 42 °C for 10 min.
20. Collect the cells by centrifugation (30 s at 14,000× g in a microcentrifuge).
21. Remove the LiAc-PEG solution.
22. Add 500 μL of sterile water to wash the cells.
23. Collect the cells by centrifugation (14,000× g for 30 s in a microcentrifuge).
24. Resuspend the cell pellet in 500 μL of YEPD medium and transfer to a 15 mL screw-cap tube.
25. Incubate the cells at 30 °C without shaking for 4 h to overnight.
26. Plate the cells in YEPD agar plates supplemented with 200 μg/mL G418.
Note: When using dominant selectable drug resistance markers such as G418, the cells should be allowed to recover and express the drug resistance prior to plating on selective medium. This is easily accomplished by initially plating the cells onto nonselective medium like YEPD plates, allowing overnight growth, and then replica-plating to medium that contains the selective drug. Alternatively, following the transformation, the cells may be inoculated into 3 mL of nonselective medium such as YEPD and allowed to incubate overnight before being plated on selective medium.
27. Incubate the plates at 30 °C or the appropriate temperature for 2–3 days until colonies appear.
B. PCR screening for confirmation of the bait strain
1. Pick several yeast colonies and make small patches on fresh YEPD plates supplemented with 200 μg/mL G418 plates to ensure the stability of the selectable marker.
Note: Taking colonies from the original selection plate and transferring them to a fresh plate supplemented with G418 allows the elimination of transiently transformed colonies that appear on the initial selection plate. When patched to a new plate, these colonies will fail to grow.
2. Grow patches of candidate yeast strains on selective medium.
3. Prepare 1.5 mL microfuge tubes by adding 200 μL of lysis buffer.
4. Use a toothpick to scrape up some yeast cells from the plate and resuspend in lysis buffer.
Note: For the preparation of DNA, yeast patches scraped from plates should be less than 4 days old. DNA quality declines as cells on the plate die from starvation over time.
5. Add about 0.2 mL of glass beads (0.5 mm). These should just reach the meniscus of the buffer.
6. Vortex vigorously 4 times for 1–2 min, placing on ice for 1 min in between bursts.
Note: The best lysis is achieved by performing some of the vortexing with the tube held upside down, as this allows greater motion of the beads and superior grinding of the cells and avoids the cells clumping at the narrow end of the tubes.
7. Following grinding, recover the cells. Prepare and label a fresh microfuge tube for each sample. Tip each tube with buffer and beads upside down and tap, so that the beads, buffer, and cells drop to the cap of the tube.
8. Puncture the bottom of the tubes with a 25-gauge needle and place the sample tube into a fresh microfuge tube.
9. Puncture the top of the sample tube.
10. Place the tubes into a 50 mL conical tube with no cap.
11. Centrifuge in the tabletop centrifuge at 1,000× g for 2 min.
12. The extract will flow into a fresh tube, leaving the beads in the original sample tube.
13. Add one volume of buffered phenol/chloroform (1:1) and mix by vortexing.
14. Spin in a microfuge at full speed for 5 min and then remove the upper aqueous phase to a fresh tube.
15. Discard the lower phenol phase, avoiding the interface material.
16. Extract the aqueous phase again with phenol/chloroform, taking and saving the upper aqueous phase to a fresh tube.
Caution: Phenol is a very powerful oxidizing agent that denatures protein. Phenol is used to “deproteinize” DNA samples for purification. Phenol can cause serious chemical burns. When using phenol, safety glasses and gloves are mandatory, and a lab coat is recommended. Chloroform increases the density of the phenol and allows better separation of the aqueous and organic phases. The aqueous DNA-containing phase will typically float on the organic phenol:chloroform layer.
Note: An alternative to grinding and separating the beads from the cells is to vortex with beads and then add phenol directly to the mixture. Vortex to mix well, and then use a pipette to transfer the phenol/buffer/extract mixture into a fresh tube. Then centrifuge and extract the aqueous DNA-containing phase.
17. Extract the aqueous phase from step B16 with chloroform, again saving the upper phase to a fresh tube.
18. Add two volumes of ethanol to precipitate the chromosomal DNA.
19. Centrifuge at 14,000× g for 10 min in a microfuge tube to pellet the DNA.
20. Wash with 1 mL of 70% ethanol and air dry.
21. Resuspend the DNA in 50 μL of TE buffer and add 1 μL of 10 mg/mL DNase-free RNase A.
Note: Prepare a stock of 10 mg/mL RNase A in 10 mM sodium acetate pH 5.2 and boil for 10–15 min. When cooled, neutralize by adding 0.1 volumes of 1.0 M Tris-HCl pH 8.0.
22. Incubate at 37 °C for 10 min and store at 4 °C or proceed to DNA analysis.
Note: Do not freeze the purified DNA preparation. The efficiency of PCR using the DNA declines significantly with freeze/thawing. We assume that this is due to the shearing of the DNA template.
23. 1–2 μL is usually enough for analysis by PCR.
24. Using the chromosomal DNA as the template, perform PCR using a 5′ verification oligonucleotide specific for the target gene and a 3′ oligonucleotide specific for the bait fusion fragment KanFscr.
25. PCR conditions are dependent upon the oligonucleotides used to perform the test.
C. Confirming bait protein expression by western blotting
C1. Extraction of total yeast protein with trichloroacetic acid (TCA)
Total cellular protein can be prepared from S. cerevisiae using a TCA extraction protocol as described elsewhere [32]. This procedure rapidly denatures and inactivates proteases and phosphatases and allows recovery of both soluble and insoluble proteins. A variety of protein extraction methods have been described that can be used to recover proteins from S. cerevisiae. These include simply boiling the cells in SDS sample buffer [33], bead-beating in non-denaturing buffers with protease inhibitors [34], boiling in NaOH and 2-mercaptoethanol [35], and preparation of spheroplasts followed by lysis [36]. All of these methods have been employed with success under different conditions. Our procedure describes protein extraction from yeast in 10% trichloroacetic acid. We favor this approach, since in our experience, the trichloroacetic acid prevents any protein degradation, allowing the detection of low-abundance and highly unstable proteins [37].
1. Prepare a 10 mL culture of the candidate S. cerevisiae bait strain overnight at 30 °C.
2. On the following day, dilute the culture in 15 mL of appropriate media to an OD600 reading of approximately 0.2–0.3.
3. Incubate at 30 °C until the culture reaches an OD600 reading of approximately 0.5.
4. Collect the cell pellet by centrifugation (3,000× g for 3–5 min) and resuspend in 500 μL of 20% TCA solution.
5. Transfer the cell suspension to a microfuge tube.
6. Centrifuge at 14,000× g in a microfuge for 3 min. Discard the supernatant.
7. Resuspended the cell pellet in 200 μL of 20% TCA solution.
8. Add 0.5 mm glass beads until the top of the beads meets the meniscus of the cell suspension.
Note: Glass beads should be at or near the meniscus of the solution to allow maximal cell breakage during vortexing. Too many beads and the cells will not move around enough to be broken. Too few beads and there will be too much space for the cells to move, and they will not be broken.
9. Vortex at max speed 3 times for 4 min with a 1 min incubation on ice in between each vortexing.
Note: Vortexing the sample with glass beads heats the sample. Intermittent incubation on ice avoids warming, which can lead to protein degradation.
10. Add 400 μL of 5% TCA solution, mix, and transfer the extract to a new tube.
Note: Add 5% TCA to the bead/extract mixture. Then, use a 1 mL pipettor to mix and remove as much liquid as possible. There is no problem if some glass beads come along; they will not interfere with further processing.
11. Centrifuge the extract at 14,000× g for 10 min in a microcentrifuge to pellet the protein.
12. Discard the supernatant.
13. Resuspend the pellet in 500 μL of ice-cold acetone to remove residual TCA.
14. Centrifuge the suspension at 14,000× g for 10 min.
15. Discard the supernatant.
16. Air-dry the pellets on the bench to remove residual acetone.
17. Resuspend the protein pellet in 200 μL of 2× sample buffer, adding DTT to a final concentration of 100 mM prior to addition.
18. Incubate protein samples at 65 °C for 5 min.
19. Centrifuge at 14,000× g for 10 min in a microcentrifuge. Collect the supernatant and store at -20 °C.
C2. Protein separation by SDS-polyacrylamide gel electrophoresis and western blotting
1. Prepare a 12% SDS polyacrylamide gel mini gel.
Note: While a 12% polyacrylamide gel is suitable for the separation and confirmation of expression of most proteins, the conditions may be altered as dictated by the molecular weight of the tagged protein.
2. Electrophorese 10–50 μg of protein from the candidate strain. An untagged control strain should be included.
Note: In addition to the candidate samples for bait confirmation, it is important to include a protein sample prepared from the screening strain that has not been transformed with the bait to ensure that a signal specific to the bait protein can be identified. Additionally, it is helpful to include a prestained molecular weight marker in one or more lanes as a means to confirm the bait protein size and monitor the progression of the electrophoresis.
3. SDS-PAGE is generally carried out at 100–150 V but may vary depending on the samples used.
4. Following electrophoresis, disassemble the gel plates.
5. Remove the stacking gel and recover the separating gel.
6. Prepare three pieces of Whatman chromatography paper cut to the same dimensions as the separating gel.
7. Soak the Whatman chromatography paper in semi-dry transfer buffer.
8. Lay the gel on the Whatman chromatography.
9. Prepare a piece of polyvinylidene fluoride (PVDF) membrane cut to the same dimensions as the separating gel.
10. Soak the PVDF membrane in methanol for 2–3 s.
11. Transfer the PVDF membrane to semi-dry transfer buffer and soak for 2–3 s.
12. Lay the PVDF membrane on top of the gel.
13. Prepare three pieces of Whatman chromatography paper cut to the same dimensions as the separating gel.
14. Soak the Whatman chromatography paper in semi-dry transfer buffer.
15. Lay the Whatman chromatography paper on top of the PVDF membrane.
16. Use a test tube to gently roll over the top of the Whatman chromatography paper–gel sandwich to remove any bubbles.
17. Secure the top of the semi-dry transfer apparatus and carry the transfer at 200 mA for 45 min.
Note: Transfer conditions may need to be optimized for some bait proteins. Very hydrophobic membrane proteins may require longer times to transfer effectively.
18. Following the transfer, recover the membrane.
19. Confirm effective transfer by noting whether all the prestained marker has transferred into the membrane.
20. Incubate the membrane with blocking solution (see Recipe 14) for 1 h prior to the addition of the primary antibody, either anti-MYC or anti-LexA.
21. Incubate with primary antibody at a concentration recommended by the manufacturer for a minimum of 4 h and a maximum of overnight at 4 °C.
22. Remove the primary antibody solution and rinse the membrane three times for 10 min each in TBST at room temperature.
23. Incubate the washed membrane in blocking solution with an HRP-conjugated secondary antibody with specificity for the primary antibody employed (1:5,000 dilution, or as recommended by the manufacturer) for 2 h at room temperature.
24. Following the incubation, rinse the membrane three times for 10 min each with TBST.
25. Perform chemiluminescent detection as directed by the reagent manufacturer.
26. The bait protein should be readily detectable, but abundance will vary with the protein of interest.
D. Testing the bait strain for activation and auto-activation
Positive and negative control “prey” proteins should be tested to confirm that the bait is functional to interact with partners but does not interact with nonspecific proteins (Figure 3).
1. Transform the bait strain with 100–200 ng of a positive (NubI) and a negative (NubG) control plasmid.
2. Plate to SD -trp agar plates.
3. When colonies appear, select several and use sterile toothpicks to transfer some cells into 3 mL of SD -trp selective liquid medium.
4. Culture the cells overnight at 30 °C with agitation (150–200 rpm).
5. Following overnight growth, take a 10 μL sample of each culture and dilute into 990 μL of water in a 1.5 mL microcentrifuge tube.
6. Transfer the 1 mL sample to a 1 mL cuvette and use a spectrophotometer to determine the optical density of the culture at 600 nm wavelength (OD600) using a 1 mL water blank.
7. Dilute each culture to OD600 ~ 0.1; this is equivalent to ~ 1 × 10⁶ cells/mL.
8. Prepare four 1:10 serial dilutions of each culture into SD -trp medium.
9. Spot 5 μL of each dilution onto SD -trp -his -ade agar selective plates. Incubate the plates at 30 °C for 2–3 days.
Note: Confirm the growth of the cells harboring the NubI-positive control. If these fail to grow on the selective plates, it is an indication that the bait fusion is misfolded, mislocalized, unstable, or has some other limitations in expression and cannot yield valid results. Possible solutions include the expression of the bait under control of a stronger promoter, or the CLV tag can be appended to the other end of the protein to test whether this will produce an effective bait.
If cells harboring the ALG5-NubG negative control plasmid grow, it is an indication that the bait alone is autoactivating and leading to “leaky” expression of the reporter genes. The test can be repeated using SD -trp -his -ade plates that have been supplemented with 3-amino-1, 2, 4-triazole (3AT).
Note: 3AT is a competitive inhibitor of the His3 protein encoded by the HIS3 reporter gene and is useful for titrating out background growth resulting from basal expression of the HIS3 gene. Typical concentrations of 3AT tested include 5 mM, 10 mM, 20 mM, and 50 mM. If background cell growth can be eliminated by the addition of 50 mM 3AT or less, continue with screening.
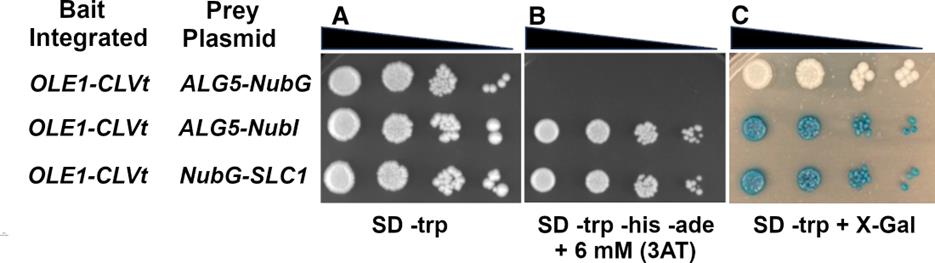
Figure 3. SD agar plate assays to assess bait protein expression and interaction specificity. Tester strain NMY51 harboring an integrated bait OLE1 tagged with the MYC-CLVt gene cassette transformed with the nonspecific prey: ALG5-NubG as a negative control, the high-affinity NubI interaction module ALG5-NubI as a positive control for interaction, and a plasmid expressing NubG-Slc1, which displays physical interaction with Ole1 [28]. Serial dilutions of each culture were prepared and spotted onto (A) plates lacking tryptophan (SD -trp) to select for the bait plasmids. (B) Plates lacking tryptophan, histidine, and adenine and supplemented with 3AT (SD -trp -his -ade + 3AT) to select for bait-prey interaction. (C) Plates lacking tryptophan and supplemented with X-Gal (SD -trp + X-Gal) to detect activation of the lacZ reporter gene.
E. Preparation of plasmid-borne Prey-NubG fusions
1. Prepare prey plasmids by generating fusions of the prey protein coding sequence with NubG. The pADSL-Nx and pADSL-xN vectors and other similar plasmids are available from several sources. PCR-amplify the target open reading frame using oligonucleotides to generate NubG fusion.
Note: If the topology of the prey protein has been confirmed, primers should be designed to add the NubG coding sequence to the end of the protein displayed in the cytoplasm. If unknown, the best choice is to tag both ends and test. Ensure that the bait protein coding sequence is in-frame with the NubG fusion and that, in the case of the prey-NubG fusion, the stop codon has been removed from the prey coding sequence.
2. Purify the PCR product using a commercial PCR purification kit; if nonspecific products are detected, perform gel purification.
3. Digest the pADSL-xN and pADSL-Nx vectors with restriction enzymes BamHI and EcoRI.
4. Gel-purify the cut vector. Assemble the vector and insert via Gibson isothermal assembly as directed by the manufacturer's instructions [38].
Note: Prey vector plasmids can also be assembled by homologous recombination following transformation of S. cerevisiae [39]. While this does save a step by assembling the vector and introducing it into yeast at the same time, it has the limitation of not allowing confirmation of the bait sequence without plasmid recovery into E. coli and amplification.
5. Transform E. coli DH5a or other laboratory strain.
6. Isolate multiple candidate colonies and prepare plasmid DNA using a commercial plasmid DNA Preparation kit. Confirm the correct insertion and integrity of the bait coding sequence by restriction enzyme digest and DNA sequencing.
Note: If possible, confirm the function of the tagged protein for confidence in the validity of the assay. Determine if the tagged prey plasmid can complement a deletion of the endogenous gene. In the case of Dga1, although both termini are predicted to be cytoplasmic, fusion of the carboxyl-terminus to NubG resulted in a loss of function and disruption of interaction with partner proteins. In contrast, fusion of NubG to the amino-terminus of Dga1 yielded a functional, correctly localized protein capable of interacting with partner proteins [28].
F. Generation of integrated prey
The NubG fusion required for prey protein generation can also be integrated into the endogenous target gene. Although more time-consuming, this approach avoids overproduction of the bait, which can lead to false-positive interactions.
F1. Integration of NubG at the carboxyl-terminus of the prey protein
1. Template pNAT-xN (Figure 2C).
2. Use oligonucleotides NatxNf/NatxNr.
3. Perform PCR in 50 μL reactions to amplify the NubG-NatMX fragment.
4. Purify the fragment as described in steps A1.6–17.
5. Transform the appropriate bait strain with 1–5 μg of PCR fragment DNA as described in section A2.
6. Select the candidate integrated prey strains on YEPD agar supplemented with 100 μg/mL nourseothricin sulfate.
7. Confirm the integration as described in section B using oligonucleotides CYCt and a prey gene-specific 5′ oligonucleotide.
8. The prey protein can be detected by western blot using anti-HA antibodies as described in section C.
F2. Integration of NubG at the amino-terminus of the prey protein
1. Template pNAT-ADH-Nx (Figure 2B).
2. Use oligonucleotides NatNxf/NatNxr.
3. Perform PCR in 50 μL reactions to amplify the NatMX-ADH promoter-NubG fragment.
4. Purify the fragment as described in steps A1.6–17.
5. Transform the appropriate bait strain with 1–5 μg of DNA as described in section A2.
6. Select the candidate integrated prey strains on YEPD agar supplemented with 100 μg/mL nourseothricin sulfate.
7. Confirm the integration as described in section B using oligonucleotides ADHnv and a prey-specific oligonucleotide as described.
8. The prey protein can be detected by western blot using anti-HA antibodies as described in section C. If necessary, the nourseothricin sulfate resistance cassette can be excised from the tester strain.
Note: The nourseothricin sulfate resistance cassette in the integration vector is flanked by loxP sites and can be excised if necessary through expression of the Cre recombinase as described [31]. A variety of plasmids with a GAL1-regulated Cre gene are available from Euroscarf (http://www.euroscarf.de/search.php?name=Order) for this purpose.
G. Testing for interactions between integrated bait and plasmid-borne prey
Prepare the tester strain with integrated bait and proceed with the yeast transformation protocol as described in section A2.
1. Transform the bait strain with each of the candidate bait plasmids in addition to the positive (NubI) and negative (NubG) controls (for example, pAlg5-NubI and pAlg5-NubG).
2. Isolate colonies from SD -trp plates. Use sterile toothpicks to transfer colonies to fresh SD -trp agar plates.
Note: At least three candidate colonies harboring any specific bait and prey pair should be tested for interactions to control for variation among the transformants.
3. Following overnight growth on the SD -trp plates, inoculate 3 mL of SD -trp liquid medium with cells from each patch and incubate at 30 °C overnight with shaking.
4. In the morning, take a 10 μL sample of each culture and dilute with 990 μL of water in a 1.5 mL microcentrifuge tube.
5. Transfer the 1 mL sample to a 1 mL cuvette and use a spectrophotometer to determine the optical density of the culture at 600 nm wavelength (OD600) using a 1 mL water blank.
6. Dilute each culture to OD600 ~ 0.1; this is equivalent to ~ 1 × 10⁶ cells/mL.
7. Prepare four 1:10 serial dilutions of each culture into SD -trp medium.
8. Pipette 5 μL of each dilution onto SD -trp -his -ade agar selective plates.
9. Incubate the plates at 30 °C for 2–3 days.
10. Pipette 5 μL of each dilution onto SD -trp + X-Gal plates.
11. Incubate at 30 °C for 2–3 days.
H. Testing for interactions between integrated bait and integrated prey
Culture the strain with integrated bait and prey at 30 °C with shaking (150–200 rpm). Following overnight growth, take a 10 μL sample of each culture and dilute into 990 μL of water in a 1.5 mL microcentrifuge tube.
1. Transfer the 1 mL sample to a 1 mL cuvette and use a spectrophotometer to determine the optical density of the culture at 600 nm wavelength (OD600) using a 1 mL water blank.
2. Dilute each culture to OD600 ~ 0.1 in sterile ddH2O; this is equivalent to ~ 1 × 10⁶ cells/mL.
3. Prepare four 1:10 serial dilutions of each culture into sterile ddH2O.
4. Pipette 5 μL of each dilution onto SD -his -ade agar selective plates.
5. Incubate the plates at 30 °C for 2–3 days.
6. Pipette 5 μL of each dilution onto SD + X-Gal plates.
7. Incubate at 30 °C for 2–3 days.
J. Screening a library for interactions with the integrated bait
1. Inoculate the bait strain from a single colony into 50 mL of YEPD medium in a 250 mL Erlenmeyer flask.
2. Incubate at 30 °C with shaking at ~200 rpm overnight.
3. Following overnight growth, dilute 10 μL of the culture into 990 μL of fresh YEPD.
4. Determine the culture density (OD600).
5. Dilute the culture into 200 mL of fresh prewarmed YEPD to achieve an OD600 of 0.2.
6. Incubate at 30 °C with shaking until an OD600 ~0.8 is achieved.
7. Collect the culture into 4 × 50 mL sterile screw capped tubes.
8. Centrifuge the samples at 3,000× g for 5 min.
9. Pour off the medium and resuspend each cell pellet in 25 mL of sterile water.
10. Collect the cells by centrifugation at 3,000× g for 5 min.
11. Resuspend the cell pellets in 1 mL of LiAc-TE solution.
12. Incubate the cells at 30 °C for 15 min
13. Transfer the cells in each 50 mL tube into 1.5 mL microcentrifuge tubes.
14. In a sterile 15 mL tube, mix 600 μL of competent cells with 2.7 mL of the LiAc-PEG mix.
15. Incubate at 30 °C with gentle shaking for 45–60 min.
16. Add 160 μL of DMSO to each tube and mix by inversion.
17. Heat-shock the samples by incubation in a 42 °C water bath for 20 min, mixing by inversion at 5-min intervals.
18. Collect the cells by centrifugation at 3,000× g for 5 min.
19. Remove the supernatant.
20. Resuspend each cell pellet in 3 mL of YEPD.
21. Incubate at 30 °C for 60 min to allow recovery.
22. Harvest the cells by centrifugation at 3,000× g for 5 min.
23. Resuspend the cells in 4.8 mL of TBS.
24. Recover 10 μL of the suspension and prepare dilutions of 1:100, 1:1,000, and 1:10,000.
25. Plate 100 μL of each dilution onto 100 mm SD -trp plates to determine the transformation efficiency.
26. Plate 300 μL aliquots of the undiluted suspension onto 150 mm SD -trp -his -ade agar plates supplemented with 3AT as needed to select for reporter gene activation.
27. Candidate colonies that appear on the selective plates can be transferred to fresh SD -trp -his -ade + 3AT plates and to SD -trp + X-Gal plates.
K. Recover and identify interacting prey
1. Grow a 10 mL culture of the candidate yeast colony to saturation in SD -trp medium.
2. Harvest the culture by centrifugation at 3,000× g for 5 min.
3. Decant supernatant and resuspend cells in residual liquid.
4. Transfer cells to a 1.5 mL screw-cap microcentrifuge tube.
5. Spin for 2 min at 14,000× g in a microcentrifuge tube. Discard supernatant.
6. Resuspend in 200 μL of lysis buffer. Add 200 μL of phenol:chloroform (50:50).
Caution: Phenol is a very powerful oxidizing agent that denatures protein. Phenol is used to “deproteinize” DNA samples for purification. Phenol can cause serious chemical burns. When using phenol, safety glasses and gloves are mandatory, and a lab coat is recommended. Chloroform increases the density of the phenol and allows better separation of the aqueous and organic phases. The aqueous DNA-containing phase will typically float on the organic phenol:chloroform layer.
7. Add 0.5 mm acid-washed glass beads until they reach the meniscus of the liquid. Vortex vigorously for 5–10 min.
8. Transfer the extract to a fresh tube.
9. Add 100 μL of TE buffer (pH 8.0) to the beads and mix by vortexing for 1 min.
10. Remove the TE and add to the initial extracted fraction.
11. Centrifuge the sample in a microfuge at 14,000× g for 8 min. Transfer the aqueous layer to a fresh tube.
Note: When extracting an aqueous phase from phenol:chloroform, do not be greedy. It is better to leave some of the aqueous phase behind than to contaminate your DNA sample with phenol. Chloroform is used to extract any residual phenol from the sample. The aqueous DNA-containing phase will float on the chloroform layer.
12. Add an equal volume of chloroform. Mix by inversion.
13. Centrifuge at 14,000× g for 2 min.
14. Transfer the aqueous (upper) layer to a fresh tube.
15. Add 50 μL of 3 M sodium acetate pH 5.2.
16. Add 1 mL of 95% ethanol.
17. Mix well and store at -20 °C for 30 min.
18. Precipitate the nucleic acid by centrifugation at 14,000× g for 15 min in a microfuge.
19. Remove the ethanol and wash the pellet with 500 μL of 70% ethanol.
20. Centrifuge at 14,000× g for 10 min in a microfuge.
21. Resuspend the nucleic acid pellet in 100 μL of solution I with RNase from a commercial Plasmid Miniprep kit.
22. Add 200 μL of solution II and mix by inversion.
23. Add 300 μL of Solution III and mix by inversion.
24. Incubate on ice for 2–5 min.
25. Centrifuge at 14,000× g in a microcentrifuge for 10 min.
26. Transfer the lysate to a plasmid miniprep spin column.
27. Centrifuge at 14,000× g for 30–60 s.
28. Discard the flowthrough.
29. Wash the spin column by adding wash buffer and centrifuging at 14,000× g for 30–60 s.
30. Discard the flowthrough and centrifuge at 13,000× g for an additional 1 min to remove residual wash buffer.
31. Place the spin column in a clean 1.5 mL microcentrifuge tube. To elute DNA, add 50 μL of water to the center of each column and centrifuge at 14,000× g for 1 min.
Note. Plasmid recovery from the columns can sometimes be improved by warming the elution buffer to 50–55 °C before adding it to the column.
32. Use the eluted fraction to transform E. coli and plate it to the appropriate selective medium, e.g., LB + ampicillin.
33. Purified plasmids can be subjected to DNA sequence analysis to identify the prey gene.
34. Prey plasmids should be retested by transformation of the bait strain to confirm bait dependence of the reporter gene activation.
L. Confirmation of prey with nonspecific bait
1. Culture the tester strain NMY51 in YEPD medium overnight at 30 °C with shaking at 150–200 rpm.
2. Prepare the culture for transformation as described (see section A2).
3. Co-transform the tester strain with 100 μg each of the candidate prey-NubG fusion encoding plasmid and a nonspecific bait such as the Alg5-Cub-LexA-VP16 fusion TMBV4-Alg5 or another unrelated bait.
4. Plate transformations to SD -trp -leu agar plates. Use sterile toothpicks to transfer colonies to fresh SD -trp -leu agar plates.
Note: At least three candidate colonies harboring any specific bait and prey pair should be tested for interaction to control for variation among the transformants.
5. Following overnight growth on the SD -trp -leu plates, inoculate 3 mL of SD -trp -leu liquid medium with cells from each patch and incubate at 30 °C overnight with shaking at 200 rpm.
6. Following overnight growth, dilute the culture into fresh SD -trp -leu medium to achieve an OD600 ~ 0.1 = 1 × 10⁶ cells/mL.
7. Prepare four 10-fold dilutions of the cultures into SD -trp -leu liquid medium.
8. Pipette 5 μL of each dilution onto SD -trp -leu -his -ade agar plates.
9. Pipette 5 μL of each dilution onto SD -trp -leu + X-Gal agar plates.
10. Incubate the plates at 30 °C for 2–3 days.
M. Beta-galactosidase assay
A quantitative assay to measure the activity of the enzyme beta-galactosidase can be performed. The iMYTH procedure employs the beta-galactosidase enzyme encoded by the E. coli lacZ gene as a reporter of the interaction between the bait and prey proteins. The interaction of bait and prey leads to the cleavage of the CLV fusion to the bait protein and the migration of LexA-VP16 to the nucleus, where the LexA binding domain can bind the LexA operator sequence regulating the lacZ reporter gene. The VP16 transcriptional activator subsequently activates transcription of lacZ, leading to expression of beta-galactosidase activity in the yeast cells. The amount of beta-galactosidase expressed reflects the transcriptional activity of the lacZ gene. The principle of the assay is based on the ability of beta-galactosidase to cleave lactose or similar substrates. One such substrate is ONPG (o-nitrophenyl-β-d-galactopyranoside); when cleaved by beta-galactosidase, ONPG yields the yellow-colored product o-nitrophenol. The o-nitrophenol can be detected and measured spectrophotometrically. When the factors of cell mass and time are accounted for, a quantitative measure of beta-galactosidase activity can be obtained. The ONPG assay is based on a procedure originally developed for E. coli [40] and modified for application to S. cerevisiae [41].
This protocol can be used to quantitatively determine LacZ reporter gene activity in yeast cells employed for the iMYTH assay.
1. Pick triplicate colonies of strains carrying the bait and prey to be investigated into 3 mL of SD medium to select for prey plasmids and bait if the bait is plasmid-borne.
2. Triplicate colonies of strains carrying a negative control NubG fusion and positive control NubI fusion should be included.
3. Culture the strains overnight at 30 °C with shaking at 150–200 rpm.
4. Following overnight incubation, determine the OD600 of each culture.
5. Collect 1 mL of culture into new, labeled tubes, and centrifuge at 10,000× g for 3 min to collect. If OD600 > 3, take 500 μL of cells.
6. Pour off the medium, being careful not to disturb the cell pellet. Resuspend the pellet in 500 μL of Z-buffer.
7. Add 50 μL of 0.1% SDS and 50 μL of chloroform. Vortex for 15 s to permeabilize the cells.
8. Add 100 μL of 4 mg/mL ONPG.
9. Incubate samples at 37 °C until color develops.
10. Remove from the water bath and add 500 μL of Na2CO3 to quench the reaction.
11. Centrifuge the reactions at 14,000× g for 5 min.
12. Take the upper 900 μL to a cuvette and record OD420.
N. Data analysis
1. Use the following formula to determine beta-galactosidase activity (Miller units):
((1,000) × (OD420))/((Length of time incubated at 37 °C in min) × (Volume of cells in mL) × (OD600))
2. Take the average and standard deviation of your replicates.
3. Assess statistical significance of differences between samples using a two-tailed t-test, assuming equal variance.
4. Normalize averages and standard deviation to the positive control (Alg5-NubI).
Validation of protocol
The iMYTH protocol employing plasmid-based screening and integrated baits has been extensively reproduced [26,28]. The integrated prey and bait protocol described here replicates the results from integrated bait and plasmid-based prey combinations [28] (Figure 4). The integrated bait and prey combinations display somewhat lower values for beta-galactosidase activity than what is obtained from the plasmid-borne bait and prey (Table 1). It is notable that the integrated bait and prey combinations display lower values for standard deviation in beta-galactosidase activity among biological replicates relative to signal from plasmid-based prey (Table 1). We assume that the reduced signal variation derives from reduced variation in copy number and potentially reduced variation in prey gene expression.
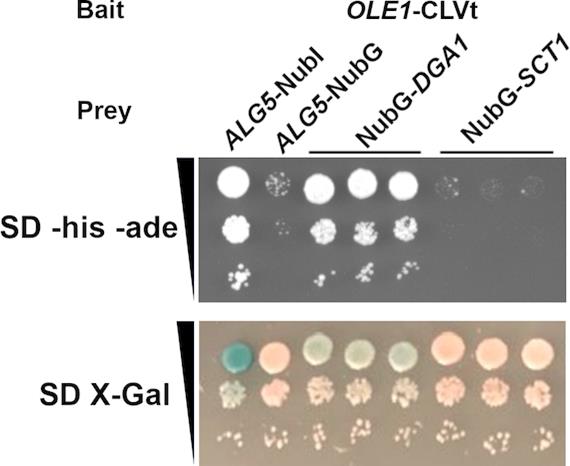
Figure 4. iMYTH assay performed with integrated bait and prey. Tester strain NMY51 harboring an integrated bait OLE1 tagged with the MYC-CLVt gene cassette. The baits are the high-affinity NubI interaction module integrated at the carboxyl-terminus of ALG5 as the positive control for interaction, and the NubG integrated at the carboxyl-terminus of ALG5 as a negative control. The PADH1-NubG cassette was integrated at the amino-terminus of DGA1 to test the interaction of Ole1-CLV and NubG-Dga1. The NubG cassette was integrated at the carboxyl-terminus of SCT1 to test its interaction with Ole1. The upper panel displays cells spotted in 10-fold serial dilutions onto plates lacking histidine and adenine and supplemented with 3AT (SD -his -ade + 3AT) to select for bait–prey interaction. The lower panel displays the same strains spotted onto SD agar plates supplemented with X-Gal (SD X-Gal) to detect activation of the lacZ reporter gene.
Table 1. Beta-galactosidase activity expressed by strains harboring integrated bait and prey combinations
| Integrated bait and prey | Plasmid-borne bait and prey | ||||
| Bait | Prey | ß-gal (Miller U) | BaitA | PreyB | ß-gal (Miller U) |
| Ole1-CLV | Alg5-NubI | 705.6 ± 105.5 | Ole1 | Alg5-NubI | 1814 ± 514.2 |
| Ole1-CLV | Alg5-NubG | 28.63 ± 4.9 | Ole1 | Alg5-NubG | 32.6 ± 10.6 |
| Ole1-CLV | NubG-Dga1 | 494.2 ± 72.3 | Ole1 | NubG-Dga1 | 612.8 ± 233.1 |
| Ole1-CLV | Sct1-NubG | 36.8 ± 8.9 | Ole1 | Sct1-NubG | 45.4 ± 14.5 |
AThe bait gene OLE1 was expressed as a fusion with Cub-LexA-VP16 from the plasmid TMBV4 [30].
BThe Alg5-NubI and Alg5-NubG control plasmids were obtained from the Stagljar lab [42].
Prey plasmids expressing NubG-Dga1 and Sct1-NubG are based on the multicopy vectors pADSL-Nx and pADSL-xN, respectively. The vectors were obtained from the Stagljar lab [42]. The data provided are mean values from biological triplicates ± standard deviation.
Acknowledgments
Contributions: Conceptualization, B.L.G.; Investigation, B.L.G.; K.O.; Writing—Original Draft, D.T.S.; Writing—Review & Editing, D.T.S.; Funding acquisition, D.T.S.; Supervision, D.T.S. This work was supported by funding from the Discovery Grant RGPIN-2021-02898 from the Natural Sciences and Engineering Research Council of Canada to D.T.S. The procedure was described and tested in Greenwood et al., Journal of Biological Chemistry (2023), DOI: 10.1016/j.jbc.2023.104882. The protocol is derived in part from previous work published by Paumi et al. [26]. Figure 1 was created in BioRender. Stuart, D. (2025) https://BioRender.com/vcy9o34.
Competing interests
The authors declare no conflicts of interest.
References
- Braun, P. and Gingras, A. (2012). History of protein–protein interactions: From egg‐white to complex networks. Proteomics. 12(10): 1478–1498. https://doi.org/10.1002/pmic.201100563
- Laval, F., Coppin, G., Twizere, J. C. and Vidal, M. (2023). Homo cerevisiae—Leveraging Yeast for Investigating Protein–Protein Interactions and Their Role in Human Disease. Int J Mol Sci. 24(11): 9179. https://doi.org/10.3390/ijms24119179
- Wang, S., Wu, R., Lu, J., Jiang, Y., Huang, T. and Cai, Y. (2022). Protein‐protein interaction networks as miners of biological discovery. Proteomics. 22: e202100190. https://doi.org/10.1002/pmic.202100190
- Guo, J., Guo, S., Lu, S., Gong, J., Wang, L., Ding, L., Chen, Q. and Liu, W. (2023). The development of proximity labeling technology and its applications in mammals, plants, and microorganisms. Cell Commun Signal. 21(1): 269. https://doi.org/10.1186/s12964-023-01310-1
- Stynen, B., Tournu, H., Tavernier, J. and Van Dijck, P. (2012). Diversity in Genetic In VivoMethods for Protein-Protein Interaction Studies: from the Yeast Two-Hybrid System to the Mammalian Split-Luciferase System. Microbiol Mol Biol Rev. 76(2): 331–382. https://doi.org/10.1128/mmbr.05021-11
- Ooi, S. L., Pan, X., Peyser, B. D., Ye, P., Meluh, P. B., Yuan, D. S., Irizarry, R. A., Bader, J. S., Spencer, F. A., Boeke, J. D., et al. (2006). Global synthetic-lethality analysis and yeast functional profiling. Trends Genet. 22(1): 56–63. https://doi.org/10.1016/j.tig.2005.11.003
- Fields, S. and Song, O. k. (1989). A novel genetic system to detect protein–protein interactions. Nature. 340(6230): 245–246. https://doi.org/10.1038/340245a0
- Krogh, A., Larsson, B., von Heijne, G. and Sonnhammer, E. L. (2001). Predicting transmembrane protein topology with a hidden markov model: application to complete genomes11Edited by F. Cohen. J Mol Biol. 305(3): 567–580. https://doi.org/10.1006/jmbi.2000.4315
- Overington, J. P., Al-Lazikani, B. and Hopkins, A. L. (2006). How many drug targets are there?. Nat Rev Drug Discovery. 5(12): 993–996. https://doi.org/10.1038/nrd2199
- Levental, I. and Lyman, E. (2022). Regulation of membrane protein structure and function by their lipid nano-environment. Nat Rev Mol Cell Biol. 24(2): 107–122. https://doi.org/10.1038/s41580-022-00524-4
- Hooker, B. S., Bigelow, D. J. and Lin, C. T. (2007). Methods for mapping of interaction networks involving membrane proteins. Biochem Biophys Res Commun. 363(3): 457–461. https://doi.org/10.1016/j.bbrc.2007.09.031
- Lou, Y. and Shanklin, J. (2010). Evidence That the Yeast Desaturase Ole1p Exists as a Dimer in Vivo. J Biol Chem. 285(25): 19384–19390. https://doi.org/10.1074/jbc.m110.125377
- Zafra, F. and Piniella, D. (2022). Proximity labeling methods for proteomic analysis of membrane proteins. J Proteomics. 264: 104620. https://doi.org/10.1016/j.jprot.2022.104620
- Duart, G., Grau, B., Mingarro, I. and Martinez-Gil, L. (2021). Methodological approaches for the analysis of transmembrane domain interactions: A systematic review. Biochimica et Biophysica Acta (BBA) - Biomembranes 1863(12): 183712. https://doi.org/10.1016/j.bbamem.2021.183712
- Abouelkheir, M., Roy, T., Krzyscik, M. A., Özdemir, E. and Hristova, K. (2024). Investigations of membrane protein interactions in cells using fluorescence microscopy. Curr Opin Struct Biol. 86: 102816. https://doi.org/10.1016/j.sbi.2024.102816
- Dünnwald, M., Varshavsky, A. and Johnsson, N. (1999). Detection of Transient In Vivo Interactions between Substrate and Transporter during Protein Translocation into the Endoplasmic Reticulum. Mol Biol Cell. 10(2): 329–344. https://doi.org/10.1091/mbc.10.2.329
- Hochstrasser, M. (1992). Ubiquitin and intracellular protein degradation. Curr Opin Cell Biol. 4(6): 1024–1031. https://doi.org/10.1016/0955-0674(92)90135-y
- Johnsson, N. and Varshavsky, A. (1994). Split ubiquitin as a sensor of protein interactions in vivo. Proc Natl Acad Sci USA. 91(22): 10340–10344. https://doi.org/10.1073/pnas.91.22.10340
- Vijay-kumar, S., Bugg, C. E. and Cook, W. J. (1987). Structure of ubiquitin refined at 1.8 Å resolution. J Mol Biol. 194(3): 531–544. https://doi.org/10.1016/0022-2836(87)90679-6
- Stagljar, I., Korostensky, C., Johnsson, N. and te Heesen, S. (1998). A genetic system based on split-ubiquitin for the analysis of interactions between membrane proteins in vivo. Proc Natl Acad Sci USA. 95(9): 5187–5192. https://doi.org/10.1073/pnas.95.9.5187
- Obrdlik, P., El-Bakkoury, M., Hamacher, T., Cappellaro, C., Vilarino, C., Fleischer, C., Ellerbrok, H., Kamuzinzi, R., Ledent, V., Blaudez, D., et al. (2004). K + channel interactions detected by a genetic system optimized for systematic studies of membrane protein interactions. Proc Natl Acad Sci USA. 101(33): 12242–12247. https://doi.org/10.1073/pnas.0404467101
- Miller, J. P., Lo, R. S., Ben-Hur, A., Desmarais, C., Stagljar, I., Noble, W. S. and Fields, S. (2005). Large-scale identification of yeast integral membrane protein interactions. Proc Natl Acad Sci USA. 102(34): 12123–12128. https://doi.org/10.1073/pnas.0505482102
- Gisler, S. M., Kittanakom, S., Fuster, D., Wong, V., Bertic, M., Radanovic, T., Hall, R. A., Murer, H., Biber, J., Markovich, D., et al. (2008). Monitoring Protein-Protein Interactions between the Mammalian Integral Membrane Transporters and PDZ-interacting Partners Using a Modified Split-ubiquitin Membrane Yeast Two-hybrid System. Mol Cell Proteomics. 7(7): 1362–1377. https://doi.org/10.1074/mcp.m800079-mcp200
- Jansen, G., Määttänen, P., Denisov, A. Y., Scarffe, L., Schade, B., Balghi, H., Dejgaard, K., Chen, L. Y., Muller, W. J., Gehring, K., et al. (2012). An Interaction Map of Endoplasmic Reticulum Chaperones and Foldases. Mol Cell Proteomics. 11(9): 710–723. https://doi.org/10.1074/mcp.m111.016550
- Lalonde, S. (2010). A membrane protein / signaling protein interaction network for Arabidopsis version AMPv2. Front Physiol. 1: e00024. https://doi.org/10.3389/fphys.2010.00024
- Paumi, C. M., Menendez, J., Arnoldo, A., Engels, K., Iyer, K. R., Thaminy, S., Georgiev, O., Barral, Y., Michaelis, S., Stagljar, I., et al. (2007). Mapping Protein-Protein Interactions for the Yeast ABC Transporter Ycf1p by Integrated Split-Ubiquitin Membrane Yeast Two-Hybrid Analysis. Mol Cell. 26(1): 15–25. https://doi.org/10.1016/j.molcel.2007.03.011
- Braun, S. (2002). Role of the ubiquitin-selective CDC48UFD1/NPL4 chaperone (segregase) in ERAD of OLE1 and other substrates. EMBO J. 21(4): 615–621. https://doi.org/10.1093/emboj/21.4.615
- Greenwood, B. L., Luo, Z., Ahmed, T., Huang, D. and Stuart, D. T. (2023). Saccharomyces cerevisiae Δ9-desaturase Ole1 forms a supercomplex with Slc1 and Dga1. J Biol Chem. 299(7): 104882. https://doi.org/10.1016/j.jbc.2023.104882
- Longtine, M. S., Mckenzie III, A., Demarini, D. J., Shah, N. G., Wach, A., Brachat, A., Philippsen, P. and Pringle, J. R. (1998). Additional modules for versatile and economical PCR-based gene deletion and modification in Saccharomyces cerevisiae. Yeast 14(10): 953–961. https://doi.org/10.1002/(sici)1097-0061(199807)14:10<953::aid-yea293>3.0.co;2-u
- Snider, J., Kittanakom, S., Curak, J. and Stagljar, I. (2010). Split-Ubiquitin Based Membrane Yeast Two-Hybrid (MYTH) System: A Powerful Tool For Identifying Protein-Protein Interactions. J Visualized Exp. 36: e3791/1698. https://doi.org/10.3791/1698
- Guldener, U. (1996). A new efficient gene disruption cassette for repeated use in budding yeast. Nucleic Acids Res. 24(13): 2519–2524. https://doi.org/10.1093/nar/24.13.2519
- Foiani, M., Marini, F., Gamba, D., Lucchini, G. and Plevani, P. (1994). The B Subunit of the DNA Polymerase α-Primase Complex in Saccharomyces cerevisiae Executes an Essential Function at the Initial Stage of DNA Replication. Mol Cell Biol. 14(2): 923–933. https://doi.org/10.1128/mcb.14.2.923-933.1994
- Horvath, A. and Riezman, H. (1994). Rapid protein extraction from Saccharomyces cerevisiae. Yeast 10(10): 1305–1310. https://doi.org/10.1002/yea.320101007
- Conzelmann, A., Riezman, H., Desponds, C. and Bron, C. (1988). A major 125-kd membrane glycoprotein of Saccharomyces cerevisiae is attached to the lipid bilayer through an inositol-containing phospholipid.. EMBO J. 7(7): 2233–2240. https://doi.org/10.1002/j.1460-2075.1988.tb03063.x
- Kushnirov, V. V. (2000). Rapid and reliable protein extraction from yeast. Yeast 16(9): 857–860. https://doi.org/10.1002/1097-0061(20000630)16:9<857::aid-yea561>3.0.co;2-b
- Brettrager, E. J., Frederick, A. J. and van Waardenburg, R. C. (2024). Zymolyase Treatment of Saccharomyces cerevisiae Affects Cellular Proteins and Degrades Tyrosyl-DNA Phosphodiesterase I. DNA Cell Biol. 43(7): 353–361. https://doi.org/10.1089/dna.2024.0062
- Raithatha, S. A., Vaza, S., Islam, M. T., Greenwood, B. and Stuart, D. T. (2021). Ume6 Acts as a Stable Platform To Coordinate Repression and Activation of Early Meiosis-Specific Genes in Saccharomyces cerevisiae. Mol Cell Biol. 41(7): e00378–20. https://doi.org/10.1128/mcb.00378-20
- Gibson, D. G., Young, L., Chuang, R. Y., Venter, J. C., Hutchison, C. A. and Smith, H. O. (2009). Enzymatic assembly of DNA molecules up to several hundred kilobases. Nat Methods. 6(5): 343–345. https://doi.org/10.1038/nmeth.1318
- Wendland, J. (2003). PCR-based methods facilitate targeted gene manipulations and cloning procedures. Curr Genet. 44(3): 115–123. https://doi.org/10.1007/s00294-003-0436-x
- Platt, T., Müller-Hill, B. and Miller, J. H. (1972). Assay of ß-galactosidase. Miller, J. H. (Ed.) Experiments in Molecular Genetics. Cold Spring Harbor Laboratory Press, 352–355.
- Guarente, L. (1983). [10] Yeast promoters and lacZ fusions designed to study expression of cloned genes in yeast. Meth Enzymol. : 181–191. https://doi.org/10.1016/0076-6879(83)01013-7
- Stagljar lab: http://local.biochemistry.utoronto.ca/stagljar/
MIND (Membrane-based Interactome Data base):
https://associomics.dpb.carnegiescience.edu/Associomics/Home.html
Article Information
Publication history
Received: May 2, 2025
Accepted: Jul 9, 2025
Available online: Jul 27, 2025
Published: Aug 20, 2025
Copyright
© 2025 The Author(s); This is an open access article under the CC BY-NC license (https://creativecommons.org/licenses/by-nc/4.0/).
How to cite
Readers should cite both the Bio-protocol article and the original research article where this protocol was used:
- Greenwood, B. L., David, K. O. A. and Stuart, D. T. (2025). Integrated Membrane Yeast Two-Hybrid System for the Analysis of Membrane Protein Complexes. Bio-protocol 15(16): e5418. DOI: 10.21769/BioProtoc.5418.
- Greenwood, B. L., Luo, Z., Ahmed, T., Huang, D. and Stuart, D. T. (2023). Saccharomyces cerevisiae Δ9-desaturase Ole1 forms a supercomplex with Slc1 and Dga1. J Biol Chem. 299(7): 104882. https://doi.org/10.1016/j.jbc.2023.104882
Category
Microbiology > Microbial proteomics > Membrane proteins
Cell Biology > Cell metabolism > Lipid
Systems Biology > Interactome > Protein-protein interaction
Do you have any questions about this protocol?
Post your question to gather feedback from the community. We will also invite the authors of this article to respond.