- Protocols

- Articles and Issues
- For Authors
- About
- Become a Reviewer

Accurate Identification of Cell Cycle Stages in RPE1 Cells Using the ImmunoCellCycle-ID Method
Published: Vol 15, Iss 15, Aug 5, 2025 DOI: 10.21769/BioProtoc.5407 Views: 1918
Reviewed by: Nikhil MittalXi FengAnonymous reviewer(s)
Original research article
The authors used this protocol in:
Nov 2024
Advertisement


Protocol Collections
Comprehensive collections of detailed, peer-reviewed protocols focusing on specific topics


Related protocols
Abstract
Accurate identification of cell cycle stages is essential for investigating fundamental biological processes such as proliferation, differentiation, and tumorigenesis. While flow cytometry remains a widely used technique for such analyses, it is limited by its lack of single-cell resolution and its requirement for large sample sizes due to its population-based approach. These limitations underscore the need for alternative or complementary methods that offer single-cell precision with compatibility for small-scale applications. We present ImmunoCellCycle-ID, an immunofluorescence-based method that leverages the spatial distribution of endogenous markers, such as DNA, proliferating cell nuclear antigen (PCNA), centromere protein F (CENP-F), and centromere protein C (CENP-C), to reliably distinguish G1, early S, late S, early G2, late G2, and all mitotic sub-stages. This technique does not rely on precise signal quantification and utilizes standard immunofluorescence protocols alongside conventional laboratory microscopes, ensuring broad accessibility. Importantly, ImmunoCellCycle-ID detects endogenous proteins without the need for genetic modification, making it readily applicable to a wide range of human cell lines. Beyond its utility for single-cell resolution, the method can be scaled for population-level analyses, similar to flow cytometry. With its precision, versatility, and ease of implementation, ImmunoCellCycle-ID offers a powerful tool for high-resolution cell cycle profiling across diverse experimental platforms.
Key features
• Enables high-precision identification of cell cycle stages at single-cell resolution.
• Broadly applicable to diverse human cell lines without genetic modification.
• Fully compatible with standard fluorescence microscopy; no specialized equipment needed.
• Requires only minimal image analysis and no complex quantification.
Keywords: Cell cycle
Background
Understanding the temporal regulation of cell cycle progression provides critical insight into cellular proliferation, differentiation, and the mechanisms driving pathological states, such as carcinogenesis [1–3]. Traditional flow cytometry has long been the standard for analyzing cell cycle distribution by quantifying DNA content [4,5]. While widely adopted, this method has key limitations. It relies on population-based measurements, necessitates large sample sizes, and poses technical challenges for achieving single-cell cell cycle stage identification and resolving sub-stages within the cell cycle.
Several earlier methods have aimed to improve upon conventional cell cycle analysis. One widely used approach is the FUCCI (fluorescent ubiquitination-based cell cycle indicator) system, which enables live-cell cell cycle identification by utilizing fluorescently tagged Cdt1 and Geminin [6–8]. The commonly used FUCCI system distinguishes G1 from S/G2/M phases. However, it requires transgenic expression and live-cell imaging, limiting its accessibility and broad applicability. Alternatively, EdU- or BrdU-based labeling assays with flow cytometry or microscopy provide improved detection of the S phase by identifying incorporated nucleotide analogs into replicating DNA [5]. However, these approaches require careful optimization of incorporation timing and duration and may introduce cytotoxic effects.
To overcome these limitations, the ImmunoCellCycle-ID method was developed (Figure 1) [1]. This method leverages immunofluorescence-based techniques using four endogenous markers, DNA, proliferating cell nuclear antigen (PCNA), centromere protein F (CENP-F), and centromere protein C (CENP-C), to enable high-resolution cell cycle identification at the single-cell level. Remarkably, it allows identification of G1, early S, late S, early G2, late G2, and sub-stages of M phase.
PCNA, a key factor in DNA replication, displays distinct nuclear localization patterns across the cell cycle [1,9]. In the G1 phase, PCNA is uniformly distributed within the nucleus. In the early S phase, it forms distinct small puncta, which then grow into larger aggregates during the late S phase, return to a uniform distribution in the G2 phase, and become markedly reduced during mitosis (Figure 2) [1]. CENP-F, a kinetochore-associated protein, localizes to kinetochores from prophase through anaphase [1,10–13]. Interestingly, it begins accumulating in the nucleus from the S phase and progressively increases in the G2 phase, despite the underlying mechanism remaining unclear [1,13]. Therefore, co-staining with PCNA and CENP-F enables reliable identification of the G1, early S, late S, and G2 phases without requiring quantification. Specifically, G1 nuclei are CENP-F negative with weak, uniform PCNA; G2 nuclei are CENP-F positive with similarly uniform PCNA (Figure 2). The presence of PCNA nuclear puncta (early/late S phase) always coincides with CENP-F positivity, eliminating contamination from the G1 phase. CENP-C localizes to centromeric chromatin throughout the cell cycle [1,14,15] and serves as a marker for distinguishing between early and late G2 phases (Figure 2). In the early G2 phase, kinetochores remain closely paired within diffraction-limited distances, whereas in the late G2 phase, they separate into distinct paired foci (Figure 2) [1]. This morphological change allows accurate distinction between these two stages without quantification. Mitotic sub-stages can be readily identified based on characteristic DNA morphologies (Figure 2).
Overall, ImmunoCellCycle-ID offers a high-precision, user-friendly, and cost-effective alternative to traditional cell cycle analysis methods. It is flexible and compatible with co-labeling of additional cellular markers, enabling dynamic studies of target proteins throughout the cell cycle. Furthermore, with alternative markers, this method can be extended to include G0 phase identification [1,16,17]. In this protocol, we focus on identifying the G1, early S, late S, early G2, late G2, and M phases in asynchronous RPE1 cells using the standard ImmunoCellCycle-ID method. The RPE1 cell line was selected due to its non-transformed, normal epithelial origin, stable diploid karyotype, and wild-type p53 status, making it a widely used control model in cell cycle research. In our original manuscript [1], we demonstrated that the ImmunoCellCycle-ID method is not only effective in RPE1 cells but also robustly applicable to a variety of cell lines, including HCT116 (colon cancer), CAL-51 (triple-negative breast cancer), T47D (luminal A breast cancer), HeLa (cervical cancer), and U2OS (osteosarcoma), without the need for modifications to the staining protocol. A representative example of standard ImmunoCellCycle-ID images in asynchronous CAL-51 cells is shown in Figure 3.
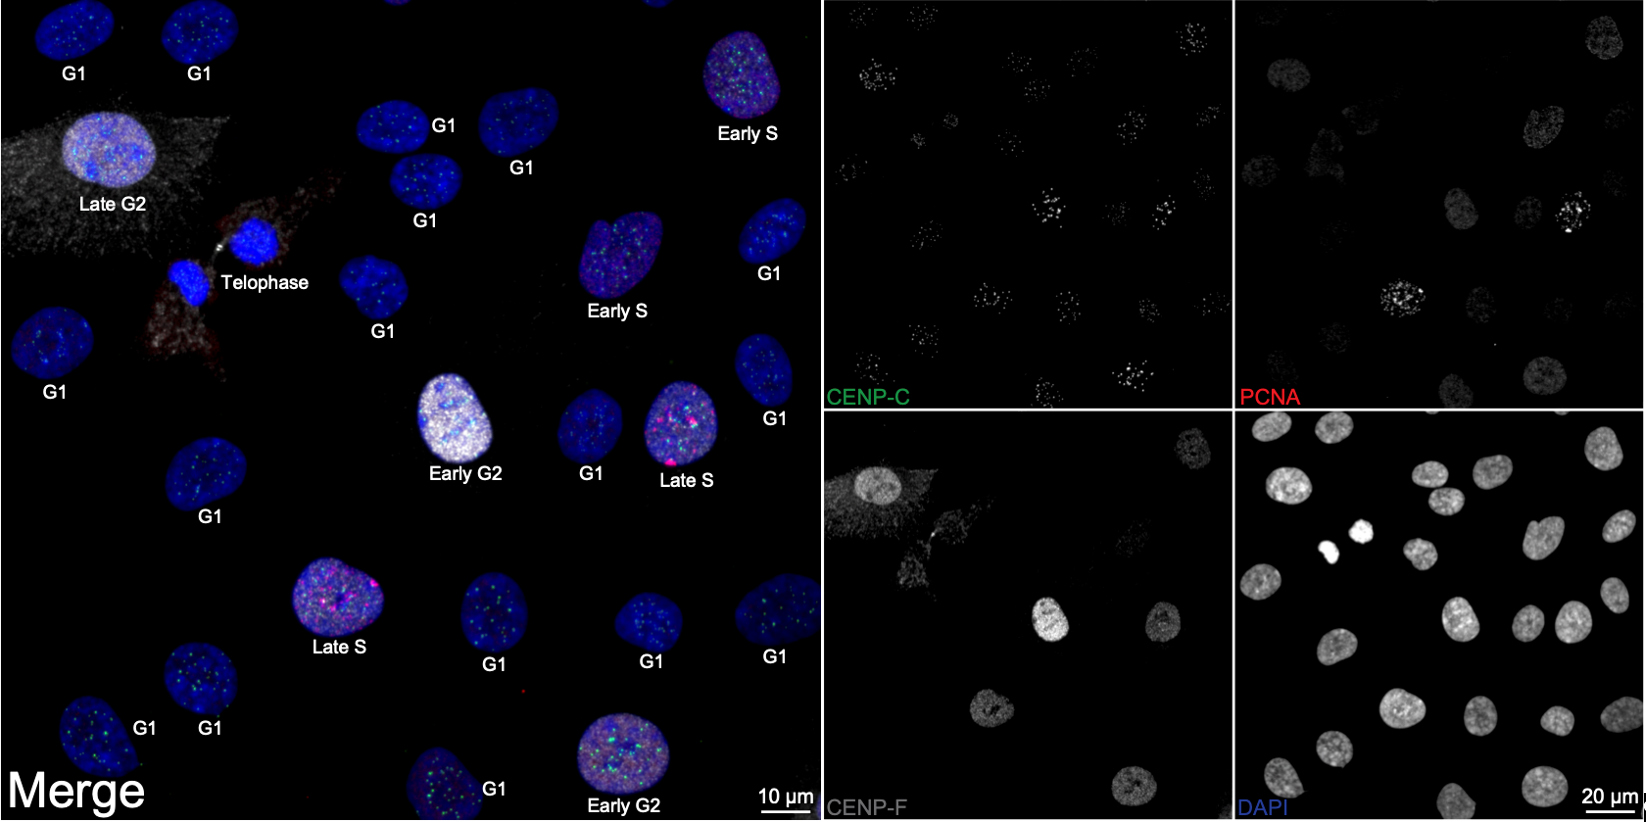
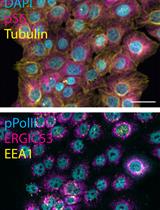
Figure 1. Cell cycle distribution in asynchronous RPE1 cells. Representative ImmunoCellCycle-ID images of asynchronous RPE1 cells, with corresponding identification of their cell cycle stages. All images were visualized using maximum z-projection.
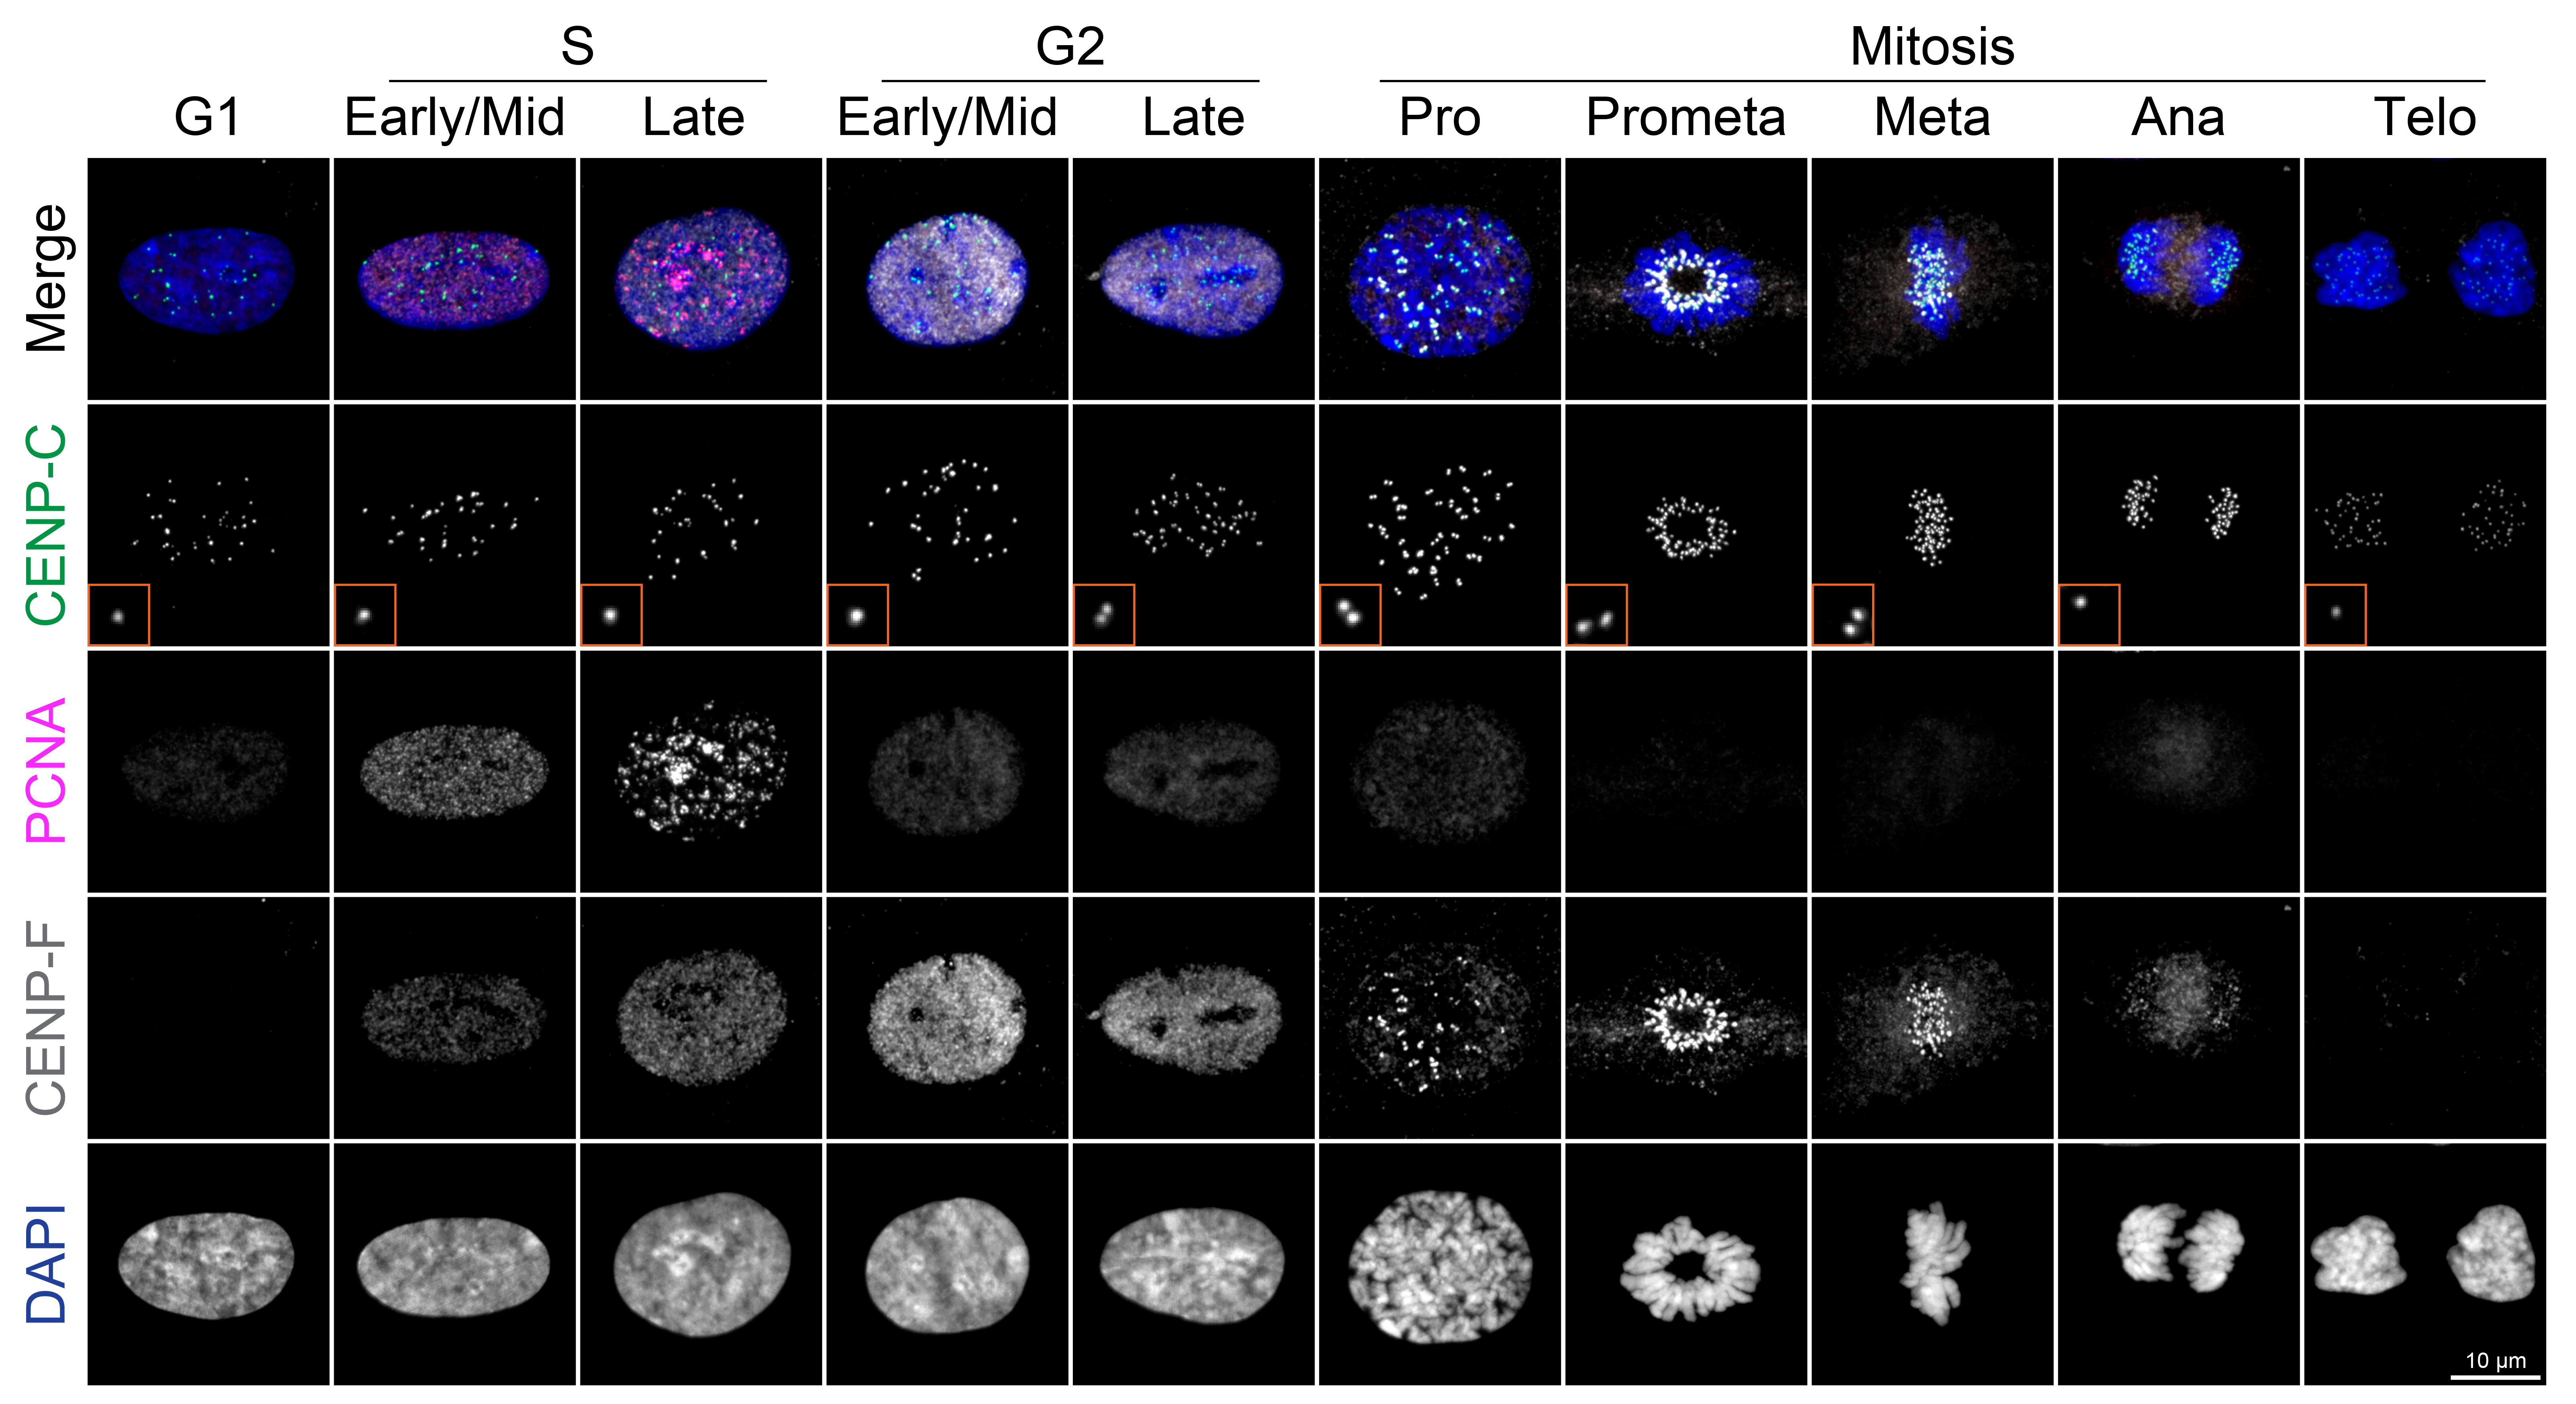
Figure 2. Representative ImmunoCellCycle-ID images for each cell cycle stage. Representative immunofluorescence images showing labeling of CENP-C, PCNA, CENP-F, and DAPI across all stages of the cell cycle. All images were adjusted to the same contrast settings across all cell cycle stages and visualized using maximum z-projection.
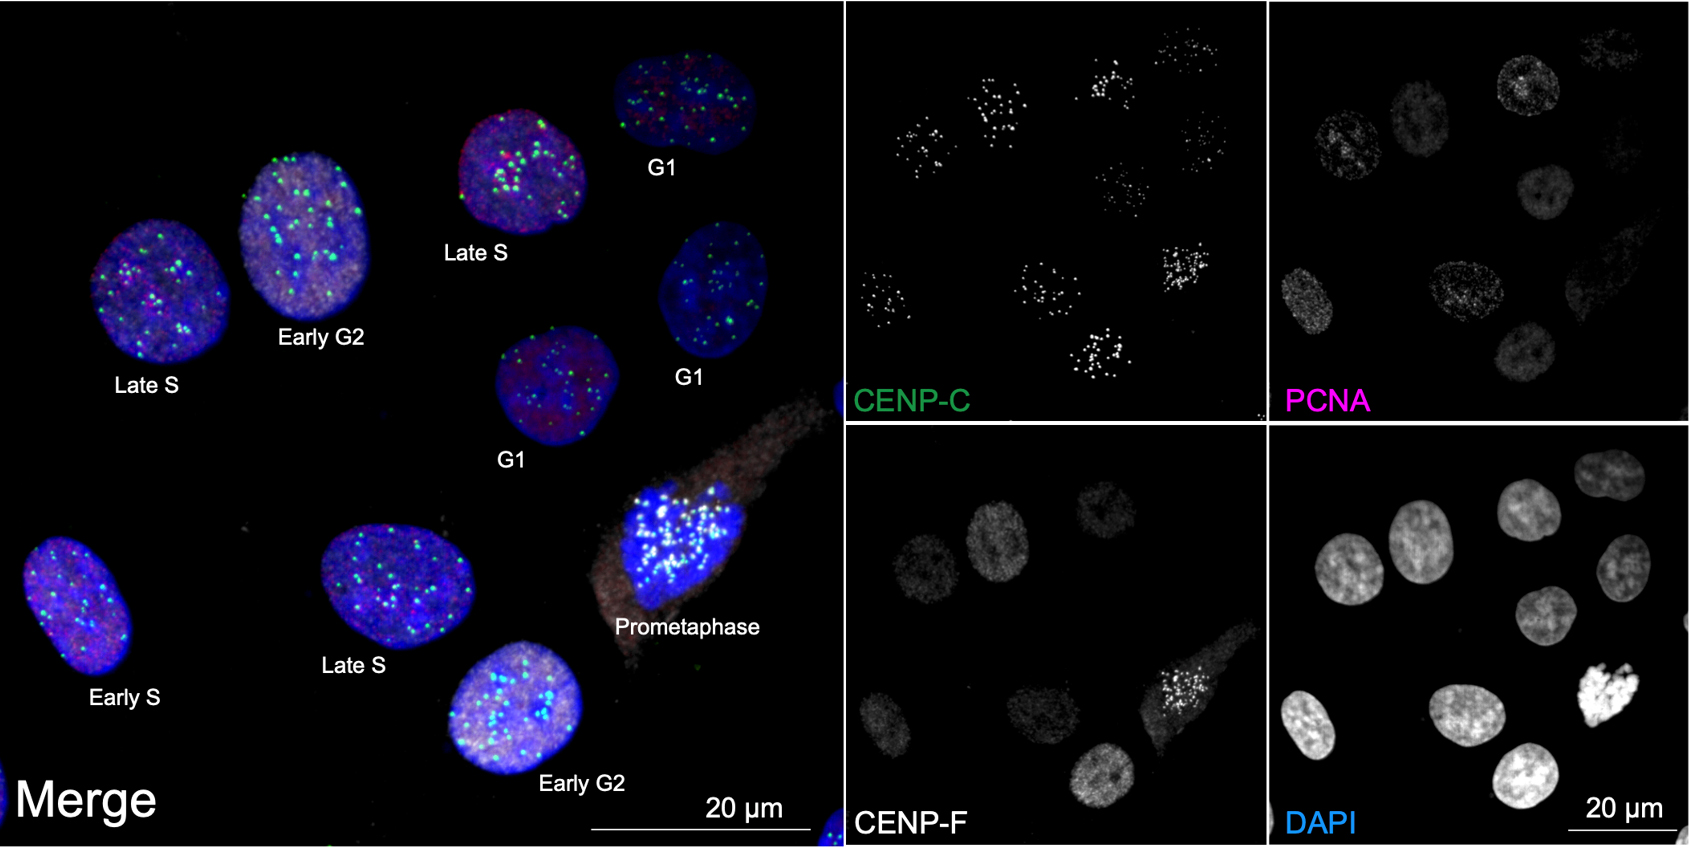
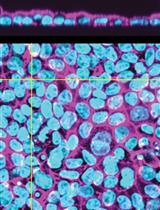
Figure 3. Cell cycle distribution in asynchronous CAL-51 cells. Representative ImmunoCellCycle-ID images of asynchronous CAL-51 cells, with corresponding identification of their cell cycle stages. All images were visualized using maximum z-projection.
Materials and reagents
Most plastics, coverslips, chemicals, and consumables do not need to be from the manufacturers listed and can be substituted with equivalent items you already have or can easily obtain. We recommend using #1.5 thick coverslips, preferably high-precision #1.5H coverslips, in any desired size and shape. The methods are robust and reproducible as long as the final concentrations and fixation/staining steps are followed accurately. Please ensure that the plasticware is appropriate for the coverslip size and adjust the volumes of solutions and reagents accordingly.
Biological materials
1. hTERT-immortalized retinal pigment epithelial RPE1 cell line (ATCC, RRID CVCL_4388, catalog number: CRL-4000)
2. Primary antibodies
a. Mouse PCNA (Santa Cruz, catalog number: sc-56, use with 1:1,000 dilution)
b. Rabbit CENP-F (Novus, catalog number: B-500-101, use with 1:2,000 dilution)
c. Guinea Pig CENP-C (MBL, catalog number: PD-030, use with 1:1,000 dilution)
d. DAPI (Sigma, catalog number: D9542, use with 3 µg/mL)
Note: Antibodies targeting CCAN proteins are generally effective; however, the use of anti-centromere antibody (ACA) is not recommended, as it primarily recognizes CENP-B, which localizes to the inner centromere. This can obscure the visualization of sister kinetochore separation (paired kinetochores), particularly during late G2 phase.
3. Secondary antibodies
a. Donkey anti-mouse Rhodamine Red X (Jackson ImmunoResearch, catalog number: 715-296-150, use with 1:600 dilution)
b. Donkey anti-rabbit Alexa 647 (Jackson ImmunoResearch, catalog number: 711-606-152, use with 1:600 dilution)
c. Donkey anti-guinea pig Alexa 488 (Jackson ImmunoResearch, catalog number: 706-546-148, use with 1:600 dilution)
Note: Any secondary antibodies with dye conjugations compatible with your imaging system can be used; however, it is crucial to select those that exhibit minimal cross-reactivity with the species in which the primary antibodies were raised.
Reagents
1. Dulbecco’s modified Eagle medium (DMEM) with high glucose, L-glutamine, phenol red (Gibco, catalog number: 11965092)
2. Fetal bovine serum (FBS) (Fisher, catalog number: SH3091003)
3. Penicillin-streptomycin (Thermo, catalog number: 10378016)
4. Dulbecco’s phosphate-buffered saline (DPBS), pH 7.0–7.3 (Gibco, catalog number: 14190144) (see General note 1)
5. Methanol, absolute (100%) (Fisher, catalog number: A412P-4)
6. Bovine serum albumin (BSA), fraction V (Sigma, catalog number: A5611)
7. Phosphate-buffered saline (PBS), pH 7.2–7.6 (Sigma, catalog number: P5493) (see General note 1)
8. Homemade mounting medium (90% glycerol) (Sigma, catalog number: G5516), 20 mM Tris pH 8.0 (Sigma, catalog number: 252859), 0.5% N-propyl gallate (Sigma, catalog number: P3130)
Note: Any commercially available mounting medium can be used; however, those containing DAPI are not recommended due to the potential for increased background fluorescence. Caution is also advised when using hard-setting mounting media, as they may induce shrinkage of cellular structures [18]. If such media are used, imaging should be performed immediately after mounting.
Solutions
1. Blocking solution (see Recipes)
Recipes
1. Blocking solution
0.1% BSA in PBS, prepared fresh
Laboratory supplies
1. Tissue culture plates (CytoOne, catalog number: CC7682-3340)
2. Coverslips with thickness of #1.5H (Marienfeld, catalog number: 0117520)
3. Pipette tips, sterile: 10 µL (TipOne, catalog number: 1111-3000), 200 µL (Olympus, catalog number: 24-172), 1,250 µL (TipOne, catalog number: 1112-1020)
4. Microcentrifuge tubes (DiagnoCine, catalog number: LD-MTC1500)
5. Humidity chamber (see General note 2)
Equipment
1. Tissue culture incubator (e.g., PHCbi, catalog number: MCO-170AICUVL)
2. Fluorescence microscope [confocal preferred, e.g., Nikon Ti2 microscope stand equipped with a Yokogawa CSU-W1 SoRa spinning disk confocal system with Uniformizer, a four-laser excitation system (405, 488, 561, and 640 nm), and a Hamamatsu Flash V2 camera]
3. 60× oil immersion objective, NA 1.40 (Nikon) (see General note 3)
Software and datasets
1. NIS-Elements (ver. 5.21, Nikon)
Note: Image analysis can be performed using any suitable software, including Image J.
Procedure
A. Cell culture and preparation
1. Plate non-transformed epithelial RPE1 cells on coverslips in DMEM supplemented with 10% FBS and 1% penicillin-streptomycin.
2. Incubate cells at 37 °C in a humidified incubator with 5% CO2 for at least one day.
3. Once cells reach approximately 80% confluency (logarithmic growth phase), proceed to fixation (see General note 4).
B. Fixation and immunostaining
1. Chill methanol at -20 °C for at least 20 min prior to use.
2. Fix cells with pre-chilled 100% methanol for 15 min at -20 °C. Ensure that coverslips are completely submerged in methanol (see General note 5).
3. Wash cells three times with PBS using enough solution to fully cover the coverslips (see General note 6).
4. Incubate cells in blocking solution at room temperature for 5 min.
5. Dilute primary antibodies in PBS using the concentrations listed in the Materials and Reagents section.
6. Incubate the primary antibody solution for 1.5 h at room temperature in the humidity chamber (see General Note 7).
7. Wash cells three times with PBS.
8. Dilute secondary antibodies in PBS using the concentrations listed in the Materials and Reagents section.
9. Incubate with secondary antibodies for 1 h at room temperature in the humidity chamber.
10. Wash cells three times with PBS.
11. Counterstain DNA with DAPI (3 μg/mL) for 15 min at room temperature.
12. Wash cells three times with PBS.
13. Mount coverslips using homemade mounting medium.
C. Imaging and data collection
1. Turn on the spinning disk confocal system and place the slide glass with mounted, stained coverslips on the stage.
2. Use live mode with 405 nm excitation to adjust the focus. Then, optimize the laser power and camera exposure time for all wavelengths (405, 488, 561, and 640 nm) to prevent signal saturation. Determine the upper and lower z-axis limits of the cells, set the z-step size to 200–300 nm, and acquire images.
3. Move to the next desired imaging locations, adjust the focus and z-axis limits as needed, and acquire images.
D. Image and data analysis for cell cycle staging
1. Analyze using raw images using NIS-Elements software (see General Note 8).
2. Identify cell cycle stages based on the following marker patterns (see Figure 2):
G1 phase: The nucleus displays uniform PCNA signals but lacks CENP-F signals.
Early S phase: The nucleus exhibits weak, uniform CENP-F signals and distinct, small punctate PCNA foci.
Late S phase: The nucleus shows weak, uniform CENP-F signals and coarse punctate PCNA foci.
Early G2 phase: The nucleus presents strong, uniform CENP-F signals and weak, uniform PCNA signals, similar in intensity to those seen in G1 phase. CENP-C signals become approximately twice as bright as in G1.
Late G2 phase: Marker patterns are similar to early G2, but CENP-C signals now appear as distinct paired foci.
Mitotic phases:
Prophase: DNA begins to condense, and CENP-F appears as foci at kinetochores (uniform nuclear signals are absent).
Prometaphase: The nuclear envelope breaks down (NEBD), and condensed mitotic chromatin (chromosomes) begins aligning at the cell equator.
Metaphase: All chromosomes are fully aligned at the metaphase plate.
Anaphase: Sister chromatids segregate toward opposite poles.
Telophase: Chromatin decondenses, and nuclear structures begin to reform.
Validation of protocol
This protocol or parts of it has been used and validated in the following research article:
Chen et al. [1]. ImmunoCellCycle-ID – a high-precision immunofluorescence-based method for cell cycle identification. J Cell Sci.
General notes and troubleshooting
General notes
1. DPBS is typically used for live tissue culture, while PBS is commonly used after cell fixation; however, DPBS can also be used post-fixation as a substitute for PBS.
2. Any enclosed chamber or incubator box capable of maintaining humidity can be used. A simple homemade version, such as a lidded container (e.g., a lunch box) with a small amount of water or water-soaked filter paper at the bottom, is sufficient.
3. A standard laboratory widefield or confocal microscope is suitable for imaging. For targets such as CENP-C and PCNA, high numerical aperture (NA) objectives (oil, silicon, or water immersion) are recommended to achieve optimal resolution and signal quality. In contrast, CENP-F can be reliably detected using lower-NA objectives.
4. Coverslips with any cell density are compatible with the ImmunoCellCycle-ID method and can be adjusted based on the researcher's needs. However, if a representative cell cycle distribution is desired, particularly one reflecting the logarithmic growth phase, cells should be prepared under conditions that achieve approximately 50%–90% confluency (avoid both over-confluency and excessively low cell density).
5. For methanol fixation, maintaining cold temperatures is essential to preserve cellular architecture. Additionally, care should be taken to prevent cell dehydration during washing steps.
6. It is important to perform gentle washing steps to prevent dissociation of mitotic cells.
7. For methanol fixation, it is important to avoid incubating primary and secondary antibodies at 37 °C, as this can cause serious structural distortions.
8. Analysis can be performed using either 3D stack images or maximum intensity z-projected images.
Acknowledgements
We would like to thank Mr. Yu-Chia Chen for his contribution to the development of the original ImmunoCellCycle-ID method. We also thank Yoshitaka Sekizawa, Yokogawa Electric Corporation, and Nikon USA for providing critical equipment and technical support. Part of this work was supported by the Wisconsin Partnership Program, Research Forward initiative from the University of Wisconsin-Madison, Office of the Vice Chancellor for Research with funding from the Wisconsin Alumni Research Foundation, Big Data Challenge from the Wisconsin Alumni Research Foundation, start-up funding from University of Wisconsin-Madison SMPH, UW Carbone Cancer Center, and McArdle Laboratory for Cancer Research, and NIH grant R35GM147525 and U54 AI170660 (to A.S.). The original research paper in which this protocol was developed and validated is Chen et al., Journal of Cell Science, 2024 [1].
Competing interests
The authors declare no conflicts of interest within this work.
References
- Chen, Y. L., Chen, Y. C. and Suzuki, A. (2024). ImmunoCellCycle-ID – a high-precision immunofluorescence-based method for cell cycle identification. J Cell Sci. 137(22): e263414. https://doi.org/10.1242/jcs.263414
- Harper, J. V. and Brooks, G. (2005). The Mammalian Cell Cycle. In: Humphrey, T., Brooks, G. (eds) Cell Cycle Control. Methods in Molecular BiologyTM, vol 296. Humana Press. https://doi.org/10.1385/1-59259-857-9:113
- Antonin, W. and Neumann, H. (2016). Chromosome condensation and decondensation during mitosis. Curr Opin Cell Biol. 40: 15–22. https://doi.org/10.1016/j.ceb.2016.01.013
- Rieger, A. M. (2022). Flow Cytometry and Cell Cycle Analysis: An Overview. Methods Mol Biol. : 47–57. https://doi.org/10.1007/978-1-0716-2736-5_4
- Bialic, M., Al Ahmad Nachar, B., Koźlak, M., Coulon, V. and Schwob, E. (2022). Measuring S-Phase Duration from Asynchronous Cells Using Dual EdU-BrdU Pulse-Chase Labeling Flow Cytometry. Genes (Basel). 13(3): 408. https://doi.org/10.3390/genes13030408
- Zielke, N. and Edgar, B. A. (2015). FUCCI sensors: powerful new tools for analysis of cell proliferation. WIREs Dev Biol. 4(5): 469–487. https://doi.org/10.1002/wdev.189
- Grant, G. D., Kedziora, K. M., Limas, J. C., Cook, J. G. and Purvis, J. E. (2018). Accurate delineation of cell cycle phase transitions in living cells with PIP-FUCCI. Cell Cycle. 17: 2496–2516. https://doi.org/10.1080/15384101.2018.1547001
- Sakaue-Sawano, A., Kurokawa, H., Morimura, T., Hanyu, A., Hama, H., Osawa, H., Kashiwagi, S., Fukami, K., Miyata, T., Miyoshi, H., et al. (2008). Visualizing Spatiotemporal Dynamics of Multicellular Cell-Cycle Progression. Cell. 132(3): 487–498. https://doi.org/10.1016/j.cell.2007.12.033
- Schönenberger, F., Deutzmann, A., Ferrando-May, E. and Merhof, D. (2015). Discrimination of cell cycle phases in PCNA-immunolabeled cells. BMC Bioinf. 16(1): 180. https://doi.org/10.1186/s12859-015-0618-9
- Hussein, D. and Taylor, S. S. (2002). Farnesylation of Cenp-F is required for G2/M progression and degradation after mitosis. J Cell Sci. 115(17): 3403–3414. https://doi.org/10.1242/jcs.115.17.3403
- Liao, H., Winkfein, R. J., Mack, G., Rattner, J. B. and Yen, T. J. (1995). CENP-F is a protein of the nuclear matrix that assembles onto kinetochores at late G2 and is rapidly degraded after mitosis.. J Cell Biol. 130(3): 507–518. https://doi.org/10.1083/jcb.130.3.507
- Loftus, K. M., Cui, H., Coutavas, E., King, D. S., Ceravolo, A., Pereiras, D. and Solmaz, S. R. (2017). Mechanism for G2 phase-specific nuclear export of the kinetochore protein CENP-F. Cell Cycle. 16(15): 1414–1429. https://doi.org/10.1080/15384101.2017.1338218
- Chen, Y. C., Kilic, E., Wang, E., Rossman, W. and Suzuki, A. (2024). CENcyclopedia: Dynamic Landscape of Kinetochore Architecture Throughout the Cell Cycle. bioRxiv. e627000. https://doi.org/10.1101/2024.12.05.627000
- Musacchio, A. and Desai, A. (2017). A Molecular View of Kinetochore Assembly and Function. Biology (Basel). 6(1): 5. https://doi.org/10.3390/biology6010005
- Klare, K., Weir, J. R., Basilico, F., Zimniak, T., Massimiliano, L., Ludwigs, N., Herzog, F. and Musacchio, A. (2015). CENP-C is a blueprint for constitutive centromere–associated network assembly within human kinetochores. J Cell Biol. 210(1): 11–22. https://doi.org/10.1083/jcb.201412028
- Kasahara, K. and Inagaki, M. (2021). Primary ciliary signaling: links with the cell cycle. Trends Cell Biol. 31(12): 954–964. https://doi.org/10.1016/j.tcb.2021.07.009
- Chen, Y. L., Reddy, S. and Suzuki, A. (2025). Reversible and effective cell cycle synchronization method for studying stage-specific processes. Life Sci Alliance. 8(5): e202403000. https://doi.org/10.26508/lsa.202403000
- Loi, J., Qu, X. and Suzuki, A. (2023). Semi-automated 3D fluorescence speckle analyzer (3D-Speckler) for microscope calibration and nanoscale measurement. J Cell Biol. 222(4): e202202078. https://doi.org/10.1083/jcb.202202078
Article Information
Publication history
Received: Apr 29, 2025
Accepted: Jul 1, 2025
Available online: Jul 22, 2025
Published: Aug 5, 2025
Copyright
© 2025 The Author(s); This is an open access article under the CC BY-NC license (https://creativecommons.org/licenses/by-nc/4.0/).
How to cite
Reddy, S., Chen, Y. and Suzuki, A. (2025). Accurate Identification of Cell Cycle Stages in RPE1 Cells Using the ImmunoCellCycle-ID Method. Bio-protocol 15(15): e5407. DOI: 10.21769/BioProtoc.5407.
Category
Cell Biology > Cell viability > Cell proliferation > Cell cycle
Cell Biology > Cell imaging > Fixed-cell imaging
Cell Biology > Single cell analysis
Do you have any questions about this protocol?
Post your question to gather feedback from the community. We will also invite the authors of this article to respond.