- Protocols

- Articles and Issues
- For Authors
- About
- Become a Reviewer

A Step-By-Step Protocol for Correlative Light and Electron Microscopy Imaging of Proteinaceous Deposits in Cultured Cells and Human Brain Tissues
Published: Vol 15, Iss 15, Aug 5, 2025 DOI: 10.21769/BioProtoc.5402 Views: 2542
Reviewed by: David PaulAnonymous reviewer(s)
Original research article
The authors used this protocol in:

Mar 2025
Advertisement


Protocol Collections
Comprehensive collections of detailed, peer-reviewed protocols focusing on specific topics


Abstract
An improved correlative light and electron microscopy (CLEM) method has recently been introduced and successfully employed to identify and analyze protein inclusions in cultured cells as well as pathological proteinaceous deposits in postmortem human brain tissues from individuals with diverse neurodegenerative diseases. This method significantly enhances antigen preservation and target registration by replacing conventional dehydration and embedding reagents. It achieves an optimal balance of sensitivity, accuracy, efficiency, and cost-effectiveness compared to other current CLEM approaches. However, due to space constraints, only a brief overview of this method was provided in the initial publication. To ensure reproducibility and facilitate widespread adoption, the author now presents a detailed, step-by-step protocol of this optimized CLEM technique. By enhancing usability and accessibility, this protocol aims to promote broader application of CLEM in neurodegenerative disease research.
Key features
• This protocol incorporates optimized sample processing and innovative fiducial marking techniques that enhance antigen preservation and improve target registration, respectively.
• By utilizing serial ultrathin sections for CLEM, this protocol significantly increases correlation accuracy.
• A novel “sandwich method” is introduced, which enables simultaneous detection of multiple proteinopathies through immunofluorescence staining or precise localization of pathological targets using immunogold labeling.
• Overall, this protocol offers an effective balance of sensitivity, accuracy, efficiency, and cost-effectiveness compared to existing CLEM methodologies.
Keywords: Correlative light and electron microscopyGraphical overview
Background
Although protein deposits are a common feature of many neurodegenerative diseases, their distribution and primary components can vary significantly between different disease types [1,2]. Moreover, the size, quantity, and spreading patterns of these deposits in the human brain are often closely associated with disease severity [3–5]. Despite this, the underlying causes of these diseases remain largely unclear. For accurate diagnosis, prevention, and therapeutic development, it is crucial to understand the mechanisms driving the formation and progression of protein deposits in the human brain [6–8]. Achieving this depends heavily on our ability to identify neuropathological protein deposits, characterize their ultrastructural features, and determine their associated components [2,9–12]. In this context, correlative light and electron microscopy (CLEM), a technique that combines the strengths of light microscopy and electron microscopy to provide complementary information across a broad resolution range (~250 to ~0.1 nm) [13–15], has proven to be a powerful tool. By enabling the examination of the same target at both microstructural and ultrastructural levels, CLEM greatly enhances the accuracy of interpreting structural and molecular features [11,12,16–19]. However, current CLEM methods are often technically demanding and logistically complex, limiting their routine use in standard research laboratories [20]. To overcome these challenges, the author has developed a simplified, time-efficient CLEM protocol, which has been successfully applied to the identification and analysis of proteinaceous inclusions in both cell model and postmortem human brain tissue [20]. The step-by-step protocol for this optimized CLEM technique is presented below. With its superior antigen preservation and target registration compared to existing methods, this protocol is expected to broaden access to CLEM and facilitate advancements in research on neurodegenerative diseases and related fields.
Materials and reagents
Biological materials
1. Cultured cells: A cell model derived from the H4 neuroglioma line (H4/αS-HoTag3) was used. This model generates α-synuclein (αS) inclusions through stable expression of recombinant αS fused to HoTag3 at the C-terminus, making it ideal for demonstration of CLEM application in cell samples to reveal ultrastructural details of protein aggregates [20]. This cell model is available from the author’s laboratory upon request.
2. Human brain tissues: Post-mortem brain tissues from patients with confirmed neurodegenerative diseases were obtained from the Brain Bank for Neurodegenerative Disorders at Mayo Clinic Florida, with consent and institutional approval.
Reagents
1. Dimethyl sulfoxide (DMSO) (Fisher BioReagents, catalog number: BP231-1)
2. LR white (medium grade) (Electron Microscopy Sciences, catalog number: 14381)
3. Sodium meta-periodate (Thermo Fisher, catalog number: 20504)
4. VECTASHIELD® antifade mounting medium with DAPI (Vector Laboratories, catalog number: H-1200-10)
5. Toluidine blue O (VWR, catalog number: IC15264925)
6. Sodium borate 10-hydrate (Na2B4O7·10H2O) (The Science Company, catalog number: NC-1686)
7. Normal goat serum (Thermo Fisher, catalog number: 10000C)
8. Rabbit polyclonal antibody against α-synuclein (Mayo Clinic, catalog number: NACP98)
9. Goat anti-rabbit IgG (H+L) secondary antibody, Alexa FluorTM 488 (Thermo Fisher, catalog number: A-11034)
10. Gold-conjugated goat anti-rabbit IgG (H+L) secondary antibodies (12 nm) (Jackson Immuno Research, catalog number: 111-205-144)
11. Sodium cacodylate buffer, 0.4 M, pH 7.2 (Electron Microscopy Sciences, catalog number: 11655)
12. Glutaraldehyde, 10% in H2O (Electron Microscopy Sciences, catalog number: 16120)
13. Paraformaldehyde 16% aqueous solution, EM grade (Electron Microscopy Sciences, catalog number: 15710)
14. 2% osmium tetroxide aqueous solution (OsO4) (Electron Microscopy Sciences, catalog number: 19192)
15. TBS with TweenTM (TBST) (Thermo Scientific Chemicals, catalog number: J77500.K2)
16. 4% uranyl acetate solution (Electron Microscopy Sciences, catalog number: 22400-4)
17. Lead citrate, 3% solution (Electron Microscopy Sciences, catalog number: 22410-01)
18. Gelatin solution 0.1% (Lifeline Cell Technology, catalog number: 102970-804)
19. Sudan Black B Stain kit (ENG Scientific, catalog number: 4460)
Caution: Sodium cacodylate, glutaraldehyde, osmium tetroxide, uranyl acetate, lead citrate, and LR white are toxic chemicals. Always follow standard safety practices to handle and discard these substances.
Solutions
1. 1% toluidine blue in 1% borate (see Recipes)
2. Fixation solution (see Recipes)
3. 1% OsO4 (see Recipes)
4. 2% uranyl acetate solution (see Recipes)
Recipes
1. 1% toluidine blue in 1% borate
Dissolve 1 g of Na2B4O7·10H2O in approximately 80 mL of distilled water in a beaker. Add 1 g of toluidine blue O into the borate solution while stirring. Stir the solution until completely dissolved. Filter the solution through a paper filter (Whatman, 1001-918) if particulates remain. Adjust the pH to make sure it is around 9–10, which is suitable for staining. Add distilled water to bring the final volume to 100 mL. Store at room temperature. Label with date and concentration.
2. Fixation solution
Add 0.25 mL of 10% glutaraldehyde, 12.5 mL of 16% paraformaldehyde, and 12.5 mL of 0.4 M sodium cacodylate buffer into 24.5 mL of ultrapure water in a 50 mL high-clarity conical centrifuge tube. Adjust the final volume to 50 mL and mix thoroughly. Store at 4 °C. Avoid light or cover with aluminum foil.
| Reagent | Final concentration | Quantity (for 50 mL) |
|---|---|---|
| 10% glutaraldehyde | 0.05% | 0.25 mL |
| 16% paraformaldehyde | 4% | 12.5 mL |
| 0.4 M sodium cacodylate buffer | 0.1 M | 12.5 mL |
3. 1% OsO4
Add 5 mL of 2% OsO4 into 5 mL of ultrapure water and mix completely. Always prepare freshly.
4. 2% uranyl acetate solution
Add 5 mL of 4% uranyl acetate solution into 5 mL of ultrapure water and mix completely. Store at room temperature. Avoid light or cover with aluminum foil.
Laboratory supplies
1. General lab consumables: Gloves, pipettes, mask, paper towel, microcentrifuge tubes, plastic beakers, parafilm
2. Filter paper (Whatman, catalog numbers: 1002-090 and 1001-918)
3. Plastic Petri dish, 100 mm × 25 mm (Sigma, catalog number: Z358762)
4. BEEM® capsules (Polysciences, catalog number: 00224-500, size 00)
5. Lab microscope slides (Fisher Scientific, catalog number: 12-550-107)
6. 50 mL high-clarity conical centrifuge tubes (Corning, catalog number: 352070)
7. Dry ice
8. Formvar support film single hole 1,500 μm Cu grids (Electron Microscopy Sciences, catalog number: FFGA1500-Cu-50)
9. Formvar support film single hole 1,500 μm nickel grids (Electron Microscopy Sciences, catalog number: FFGA1500-Ni-50)
10. Coverslip forceps (Dumont, catalog number: 11251-33, #5/45)
11. Single edge blade (Uline, catalog number: H-595B)
12. Perfect handle & loop set (Electron Microscopy Sciences, catalog number: 70944)
13. Diamond knife ultra 45 °C, 2 mm (DIATOME, catalog number: DU4520)
14. 100-capacity grid storage box (Electron Microscopy Sciences)
Software and datasets
1. PhotoPad Image Editor (NCH Software)
2. Adobe Photoshop (Adobe)
Equipment
1. Benchtop centrifuge (Fisher Scientific, catalog number: 13-100-678, model: accuSpin 21R)
2. Vacuum oven (Fisher Scientific, catalog number: 13-262-50, Isotemp Model 281A Vacuum Oven)
3. Ultramicrotome (Leica Microsystems, model: Leica UC7)
4. Light microscope (Olympus, model: BX50)
5. Confocal laser-scanning microscope (ZEISS Microscopy, model: LSM 880)
6. Electron microscope (JEOL, model: JEM-1400 FLASH)
7. PELCO® UVC2 Cryo Chamber (Ted Pella, catalog number: 6202)
8. Rotator (Benchmark Roto-Mini Rotator, model: R2020)
Procedure
A. Sample process: fixation, dehydration, infiltration, embedding
1. Soak cell pellets (that were obtained in a standard 1.5 mL reaction tube by centrifugation) in fixation solution for 1 h at room temperature or overnight at 4 °C for fixation. Tissues from formalin-fixed postmortem human brain do not require additional fixation but should be cut with a blade into small pieces no larger than approximately 1 mm3, estimated visually.
2. Wash samples three times with 0.1 M sodium cacodylate buffer. Post-fix in 1% osmium tetroxide for 60–90 min. During solution replacement, old solutions should be aspirated slowly and carefully, and new solutions should be added gently to prevent accidental suction or displacement of the sample from the tube. A minimum volume of 1 mL should be used for all steps carried out in 1.5 mL tubes.
3. Wash samples three times with distilled water to completely remove excess OsO4. Stain with 1% uranyl acetate for 30 min.
4. Dehydrate samples sequentially with 30%, 50%, and 75% DMSO (diluted from anhydrous DMSO with ultrapure water) for 10–15 min each. Follow with two incubations in 90% DMSO, each for 10–15 min.
5. Infiltrate the samples with LR white resin for 1 h, repeating the process three times. To enhance infiltration efficiency, place the tubes containing the samples on a rotator to ensure continuous interaction between the samples and the resin.
6. Embed the samples in fresh LR white resin using embedding tubes and polymerize the resin in a vacuum oven at 50 °C. Polymerization should proceed for 24–48 h.
B. Section process: trimming, sectioning, and loading
1. For brain tissue, screening of blocks is necessary, as not all contain pathological features. Cut 500–1,000 nm semi-thin sections with the Leica UC7 ultramicrotome and stain with 1% toluidine blue in 1% borate. Identify blocks with structures of interest under a light microscope. For example, Lewy bodies in this protocol appear as large, spherical inclusions occupying substantial cytoplasmic space by displacing neuromelanin, as shown in Figure 1A. This step is not required for cell culture samples.
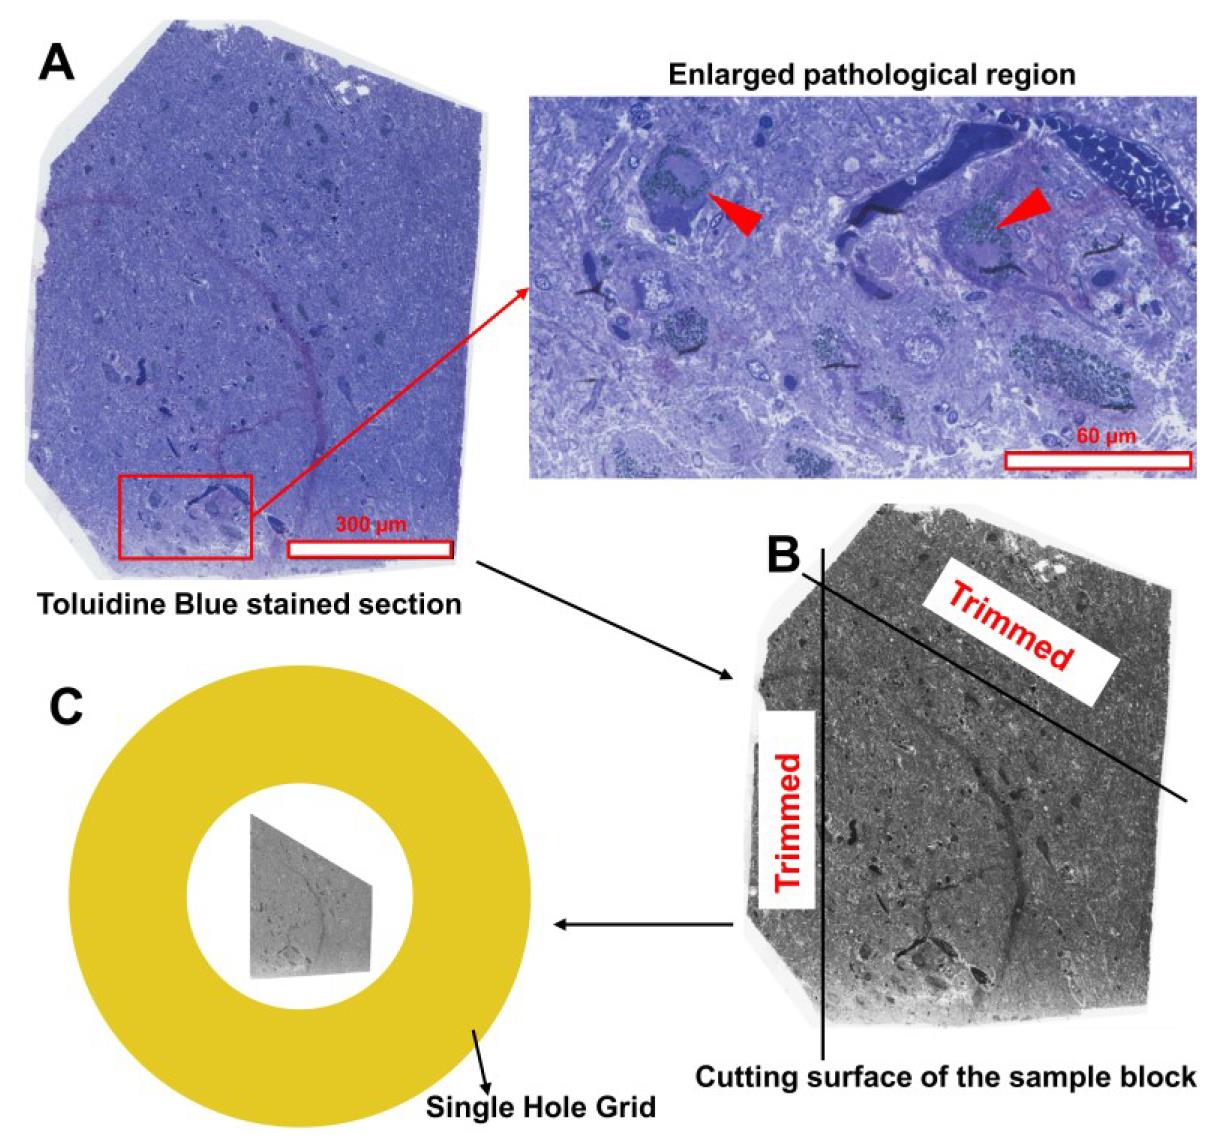
Figure 1. Trimming the cutting surface of the sample block from human brain tissue. (A) Identify the region of interest (ROI) on the toluidine blue–stained semi-thin section. In this protocol, the ROI contains Lewy bodies, highlighted by a red frame in the left image and enlarged in the right image. Two Lewy bodies are indicated by red arrowheads. Scale bars are included in both images. (B) Using the toluidine blue–stained section as a reference, mark a trapezoid around the ROI with a needle or sharp-tipped tweezers. Then, trim the block’s cutting surface with a blade to remove excess tissue. (C) Ensure that the section cut from the trimmed block is smaller than the filmed single hole of the EM grid.
2. For brain tissues, mark a trapezoid around the target area (e.g., Lewy body pathology shown in Figure 1A) using a needle or sharp-point tweezers and trim the cutting surface with a blade accordingly (Figure 1B). For cell culture blocks, trim directly into a trapezoid.
Note: Ensure that the entire section is smaller than the filmed single hole (1.5 mm in diameter) of the grid (Figure 1C). While a trapezoidal shape is recommended, other shapes may also be used as long as the section edges differ sufficiently in length and angles to remain distinguishable.
3. Using a Leica UC7 ultramicrotome, cut two or three continuous sections of varying thickness:
a. For a simple CLEM method of LM/EM: 120 nm/70 nm as shown in Figure 2A.
b. For the sandwich method of LM/EM/LM: 120 nm/70 nm/120 nm as shown in Figure 2B.
c. For the sandwich method of LM/EM/IEM: 120 nm/70 nm/90 nm as shown in Figure 2C.
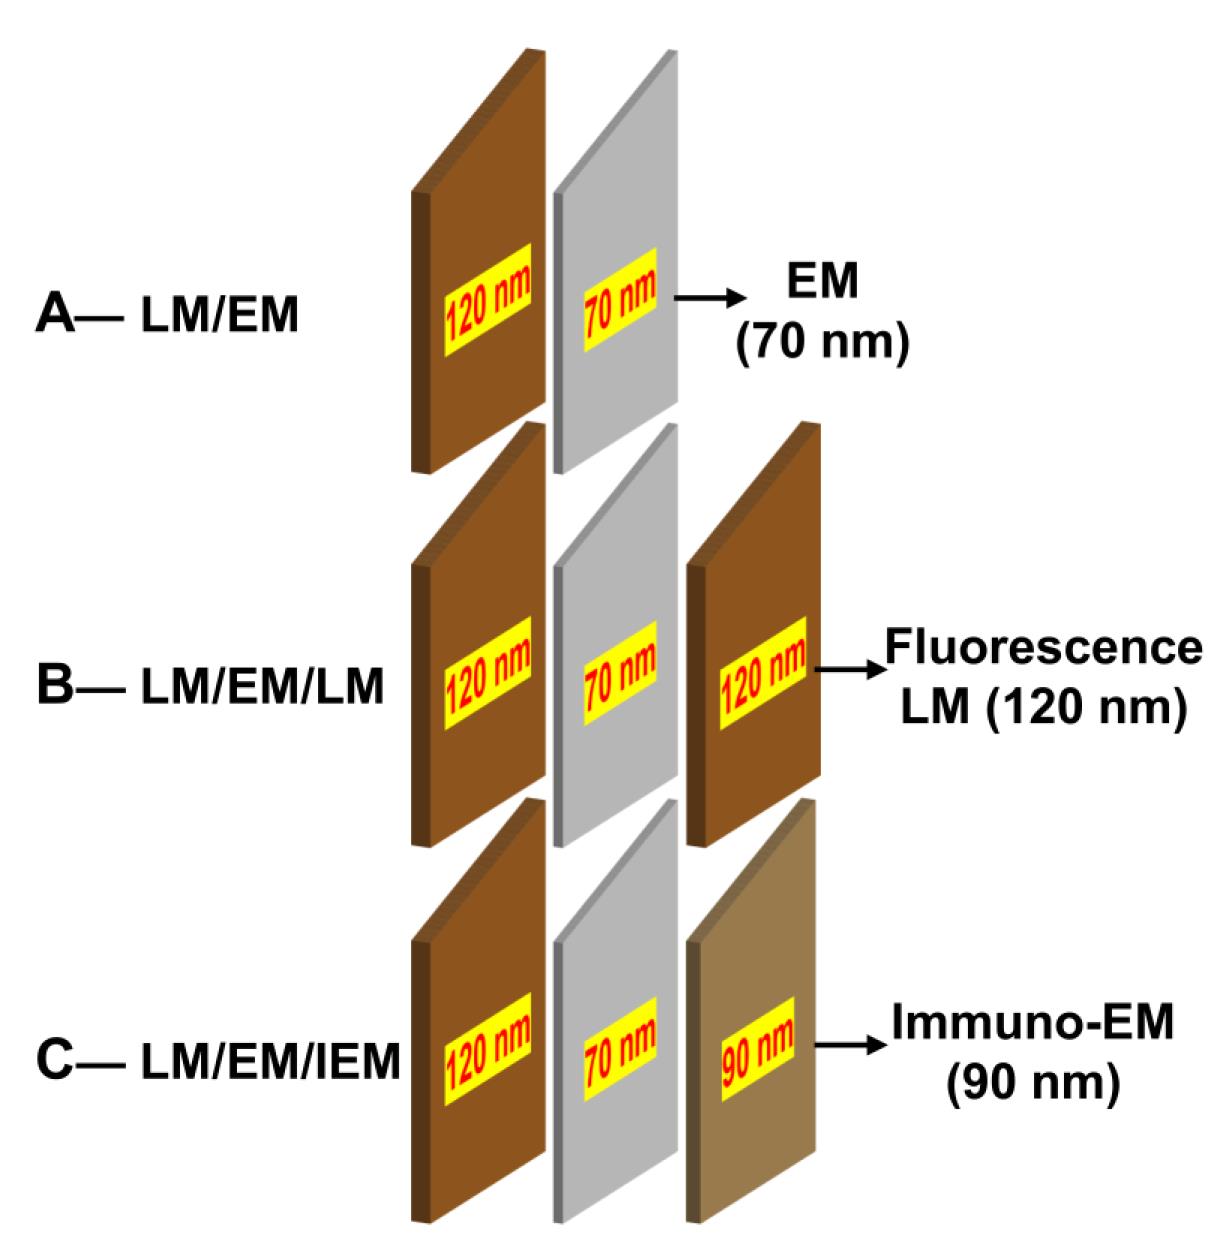
Figure 2. Demonstration of two or three consecutive sections of varying thickness for different correlative light and electron microscopy (CLEM) modes. (A) Simple CLEM mode (LM/EM): two consecutive sections are collected at 120 and 70 nm thickness. (B) Sandwich CLEM mode (LM/EM/LM): three consecutive sections are collected at 120, 70, and 120 nm. (C) Sandwich CLEM mode (LM/EM/IEM): three consecutive sections are collected at 120, 70, and 90 nm. Note that the color of the section on the water surface reflects its thickness. Sections with thicknesses of 70, 90, and 120 nm typically appear silver, light brown, and deep brown, respectively.
4. For 120 nm sections, place a drop of gelatin solution onto a slide, then transfer the section onto the gelatin solution drop using a perfect loop. Incubate the slide at 70 °C to fully flatten the section to minimize the formation of folds. Once dry, circle the section on the reverse side with a diamond scriber to aid localization during immunostaining.
5. For 70 and 90 nm sections, use coverslip forceps to grip the grid without damaging the film. Use a formvar-coated copper grid for 70 nm and a nickel grid for 90 nm sections.
Note: The coverslip forceps securely hold the grid while allowing flexible adjustment of the film surface angle relative to the water surface in the boat, making it easier to position the film for section pickup compared to other types of forceps (see Figure 3 ).
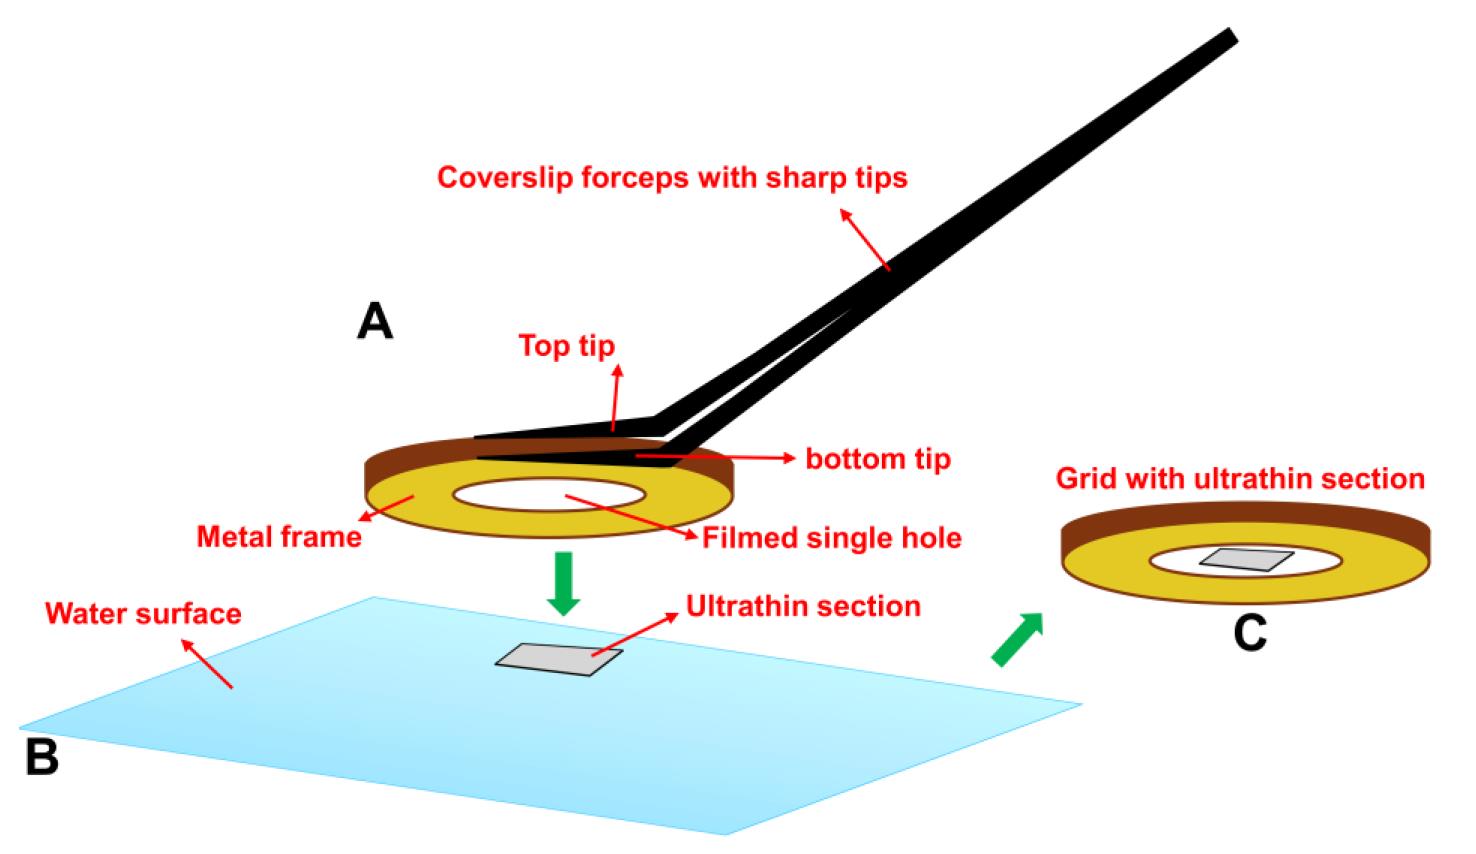
Figure 3. Loading an ultrathin section onto a filmed single-hole grid using coverslip forceps. (A) The coverslip forceps grip the grid securely at the top and bottom, while allowing flexible adjustment of the grid’s film angle relative to the water surface. (B) This adjustable angle facilitates parallel alignment between the film and the floating ultrathin section, improving the likelihood of successful transfer to the grid. (C) Grid with successful loading of an ultrathin section in the filmed center hole.
C. Staining process: immunofluorescence staining, immunolabeling, and UA/lead staining
C1. Immunofluorescence staining
1. Outline the section using a hydrophobic pen (guided by the scriber mark). Add 150–200 μL of 10% sodium meta-periodate to remove OsO4 from 120 nm sections and incubate in a dark chamber for 1 h at room temperature. Wash three times each with water and then 1× TBST.
2. Block with 100–200 μL of 100% goat serum for 30 min. Remove blocking serum, then incubate the whole section with primary antibody (NACP98, 1:300 diluted in 50% goat serum) overnight at 4 °C. Wash with 1× TBST three times (5 min each), then briefly rinse in water to remove detergent-derived bubbles.
3. Incubate with secondary antibodies (1:500 diluted in 50% goat serum) for 1 h. Wash as above.
4. Add 200 μL of Sudan Black B to cover the entire section. Incubate for 15 min to quench autofluorescence, then rinse briefly with water to remove unstained dye.
5. Mount with VECTASHIELD® antifade mounting medium with DAPI.
6. Use DAPI-stained nuclei for focal adjustment. Capture whole-section images using the tile scan mode on a Zeiss LSM 880 confocal microscope with a 40× lens. Optimize laser intensity/exposure to minimize photobleaching while maintaining sufficient resolution for subsequent EM correlation. A speed of 5 or 6 is recommended. Export as TIFF, including all channels and the merged image.
Note: A single tile scan focused on the central area typically provides sufficient fluorescence signals across the entire section. Multi-focus or Z-stacking is generally unnecessary for 120 nm-thick sections due to their limited depth.
C2. Immunogold labeling
1. Prepare a 100-mm Petri dish and coat the inside bottom with parafilm.
2. Add a drop (50–100 μL) of 5% sodium meta-periodate onto the parafilm. Place the nickel grid on top of the drop with the section side facing the solution. Incubate for 30–60 min in a dark chamber for epitope retrieval.
3. Transfer the grid to a drop of ultrapure water for 5 min. Repeat this wash step three times to completely remove residual sodium meta-periodate. Then, place the grid onto a drop of 1× TBS to equilibrate the pH.
4. Add a drop of 100% goat serum onto the parafilm and place the grid on top of the serum for 30 min to block nonspecific binding.
5. Dilute the primary antibody in 50% goat serum (NACP98, 1:20 dilution). Place the grid on top of the antibody drop (25–30 μL per drop). Add a piece of fully moistened paper towel into the Petri dish to maintain humidity, cover with the lid, and incubate overnight at 4 °C.
6. The next day, prepare a clean 24-well cell culture plate with three wells filled with TBST and two wells with ultrapure water. Add a drop of secondary antibody conjugated with gold particles, diluted in 50% goat serum (1:25 dilution), onto a fresh area of parafilm in the Petri dish.
7. Using a pair of forceps, firmly grip the metal edge of the grid and sequentially wash it by dipping it 10 times in each of the TBST wells, followed by the water wells.
8. Blot excess water from the grid with filter paper (Whatman, 1002-090) and place it on top of the secondary antibody solution. Incubate for 1 h.
9. Prepare a clean 24-well cell culture plate with three wells filled with TBST and two wells with ultrapure water. Repeat the washing procedure described in step C2.7. The grid is now ready for uranyl acetate (UA) and lead citrate staining (see section C3).
C3. UA/lead staining (for both copper and nickel grids)
1. Prepare a 100-mm Petri dish and coat the inside bottom with parafilm.
2. Fill six wells of a clean 24-well cell culture plate with pre-boiled and then cooled ultrapure Milli-Q water.
3. On the parafilm, add a 20 μL drop of 2% UA prepared in ultrapure Milli-Q water.
4. Carefully transfer the copper or nickel grid (with a 70-nm or 90-nm ultrathin section) onto the UA drop, with the section side facing the solution. Stain for 5–10 min. Simultaneously, place a drop of ultrapure water next to the UA drop to prepare for immediate washing.
5. After UA staining, firmly grip the metal edge of the grid with forceps and wash it by sequentially dipping it 10 times in each of the first three wells of ultrapure water. Then, rest the grid briefly on a drop of preloaded ultrapure water on the parafilm.
6. Add a 10 μL drop of lead citrate staining solution onto the parafilm.
7. Blot excess water from the grid with filter paper (Whatman, 1002-090), then transfer the grid onto the lead citrate drop and stain for 5–10 min.
8. After staining, blot off the excess lead solution with filter paper (Whatman, 1002-090). Then, wash the grid by sequentially dipping it 10 times in each of the remaining three wells of ultrapure water.
9. Blot off excess water with filter paper (Whatman, 1002-090). Store the grid in a pre-labeled grid box. Once air-dried (normally needs 20–30 min), the grid is ready for electron microscopy (EM) examination.
D. Image processing
D1. Navigation of EM section using the whole-section image of fluorescent LM
1. Load the stained 70-nm or 90-nm ultrathin section into the electron microscope (EM).
2. Capture an overview image of the entire section at low magnification (10× to 1,000×) by switching the MAG function to LOW MAG on the control panel. If the section is too large to be covered in a single image, multiple shots may be needed. This whole-section image is crucial for accurately aligning the fluorescent LM image with the EM section.
3. Open the fluorescent LM image of the whole section on a laptop using Photoshop. Use the Free Transform tool to rotate the image so that the orientations of the two trapezoids (EM and fluorescent LM) align correctly.
4. Choose a corner or edge of the EM section and use fluorescence-positive targets and nuclei (serving as fiducial markers) from the fluorescent LM image to navigate. This approach enables accurate registration of targets between the EM section and the fluorescent LM image by identifying the nucleus of target-containing cells or, if extracellular, the nucleus in proximate cells. Each nucleus has a unique shape and size, making it easy to distinguish individual cells at the same location. Examine the ultrastructure of each target and select those of potential interest. Capture overview images of those targets, referred to as primary EM images, and label the corresponding regions in the fluorescent LM image.
5. Continue examining the entire section until primary images for all targets with potential interest are acquired under the EM and the corresponding labels are applied to the fluorescent LM image.
Note: See detailed demonstration in Figures 4 and 5. It is worth noting that the navigation for the EM section is much easier in a cell sample than a human brain sample. This is because there is a sufficient number of DAPI-stained nuclei in the fluorescent LM image from cell samples to be used as the fiducial marker (Figure 4) in comparison to the fluorescent LM image from human brain tissue, in which not every section contains sufficient nuclei for reference (Figure 5). Therefore, additional time and care may be needed for samples from human brain tissue. Moreover, it may be necessary to perform a second EM imaging session at a higher magnification to capture finer ultrastructural details for the identified targets of interest revealed by the CLEM analysis (Figures 6 and 7). Therefore, it is advisable to keep the grid in the sample holder until the second EM imaging session is complete. This will avoid realignment of the sections due to a change in orientation after unloading the sample.
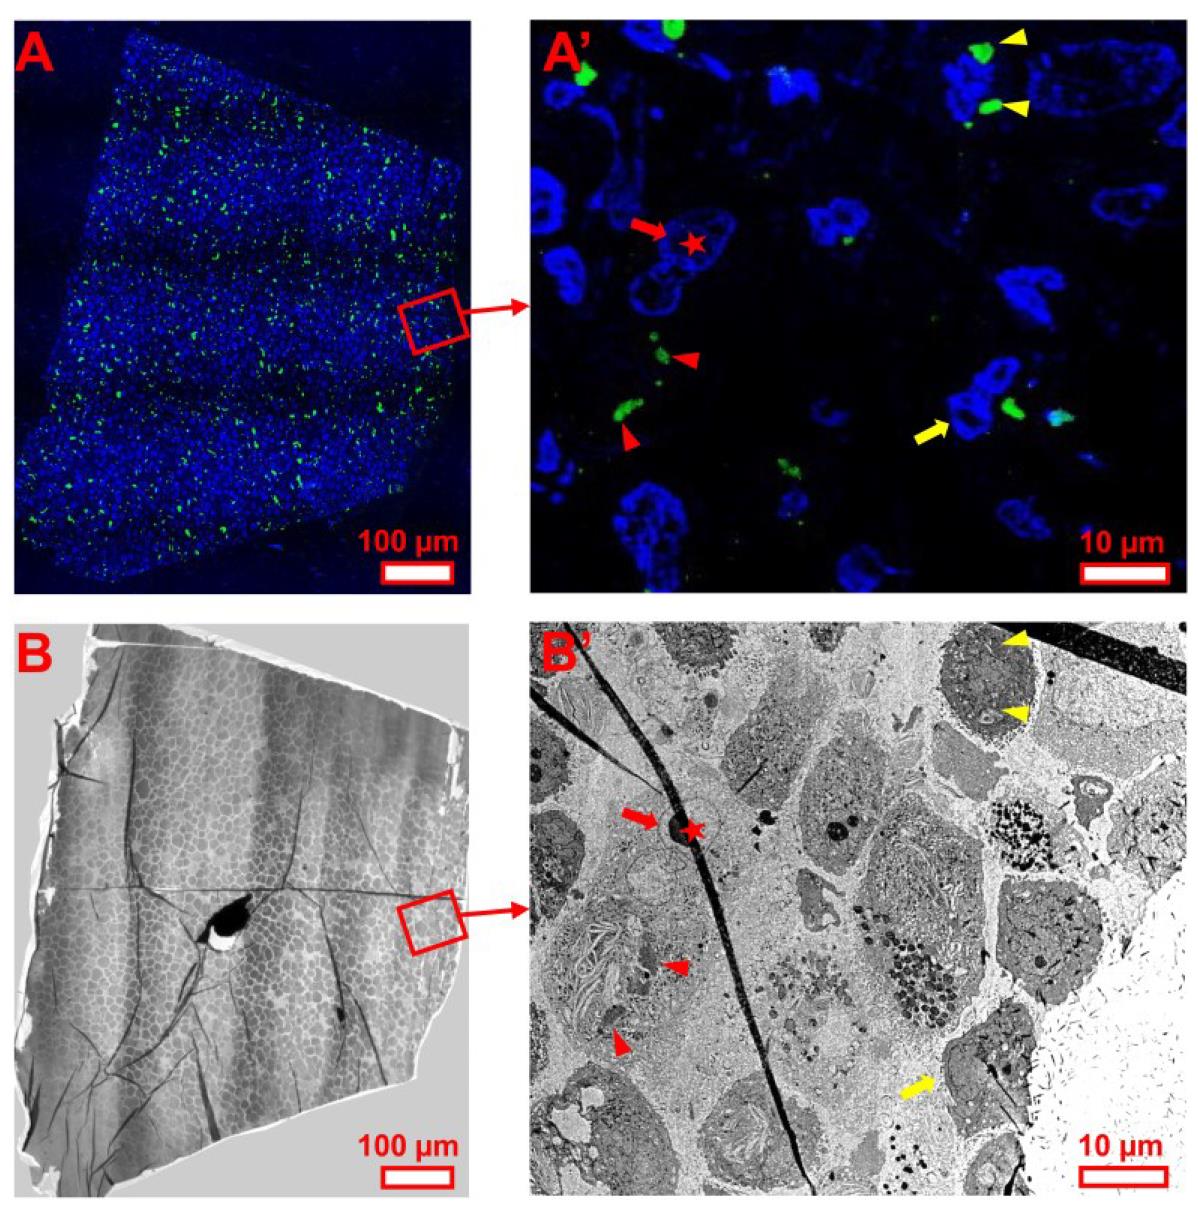
Figure 4. EM section navigation using whole-section fluorescent LM images for cultured cell samples. Rotate the whole-section fluorescent LM image (A) to align with the section under EM (B). Select a reference point, such as a corner or edge (e.g., red frame), and use fluorescence-positive targets and nuclei as fiducial markers. (A′) A higher-magnification view shows fluorescently labeled nuclei (blue) and α-synuclein inclusions (green) at the section edge. (B′) Corresponding EM view of the region in (A′). Same-colored arrows indicate the same nucleus across LM and EM images. Same-colored arrowheads indicate the same inclusions. Scale bars are included.
Note: Although red asterisks mark the same nucleus, the nucleus in the EM image appears deformed due to section folding, visible as a black line. Avoid such artifacts in CLEM to maintain accuracy.
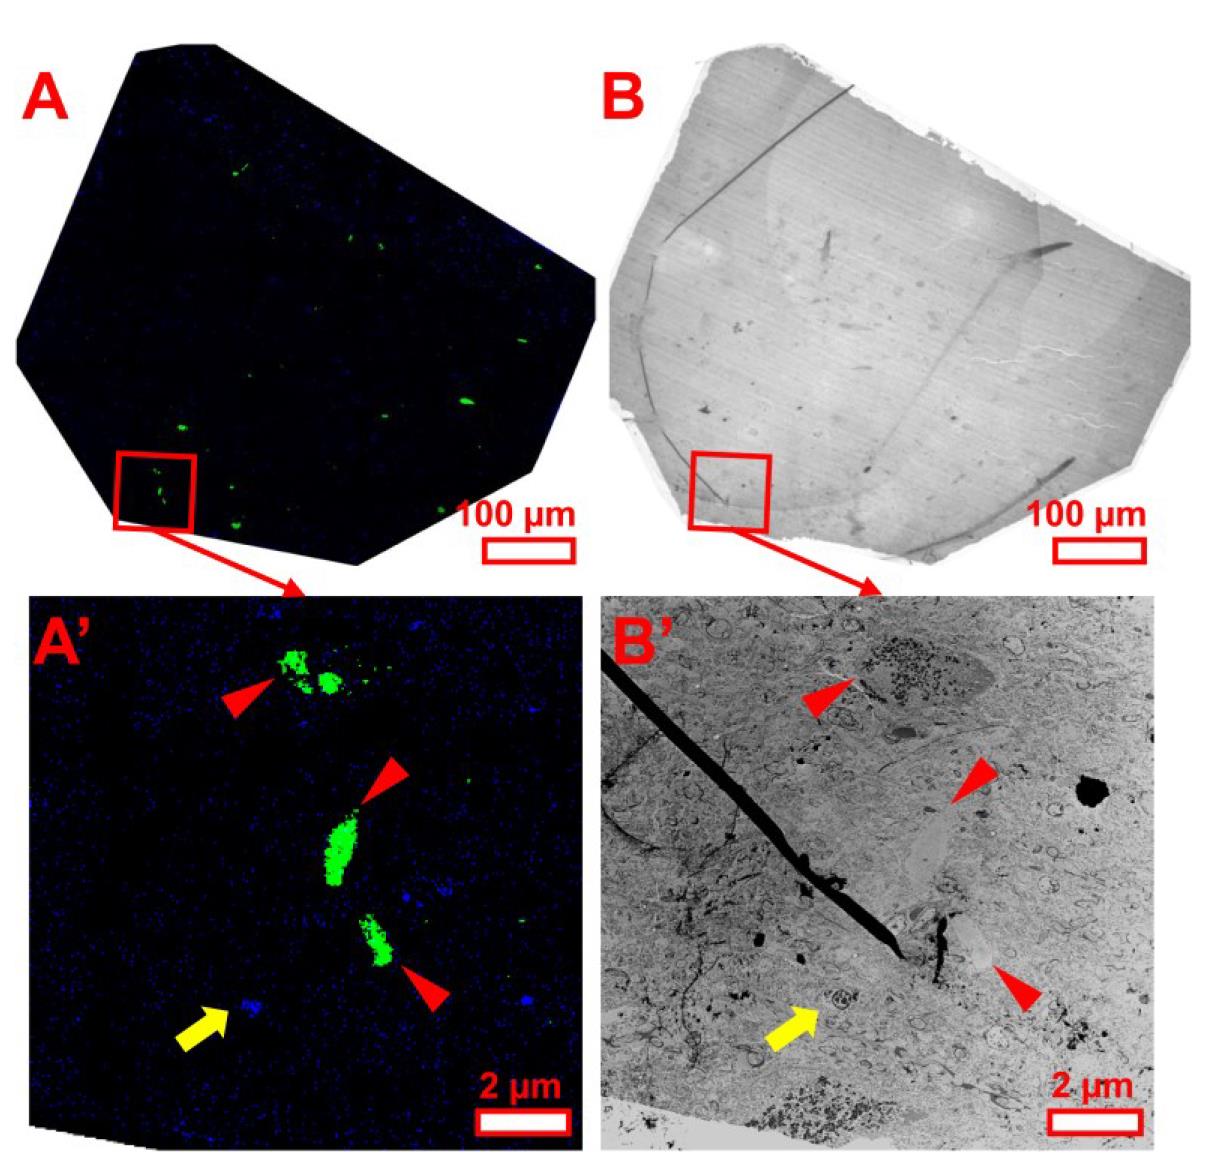
Figure 5. EM section navigation using fluorescent LM images for human brain tissue samples. Rotate the fluorescent LM image (A) to match the orientation of the section under EM (B). Select a reference edge (e.g., red frame) and align based on fluorescence-positive structures and nuclei. (A′) A higher-magnification view shows fluorescently labeled nuclei (blue) and Lewy pathology (green) in a section corner. (B′) Corresponding EM view of the region in (A′). Same-colored arrows and arrowheads denote corresponding nuclei and inclusions in both images. Scale bars are included.
Note: Human brain sections often contain fewer nuclei for alignment. Additional time and care may be needed.
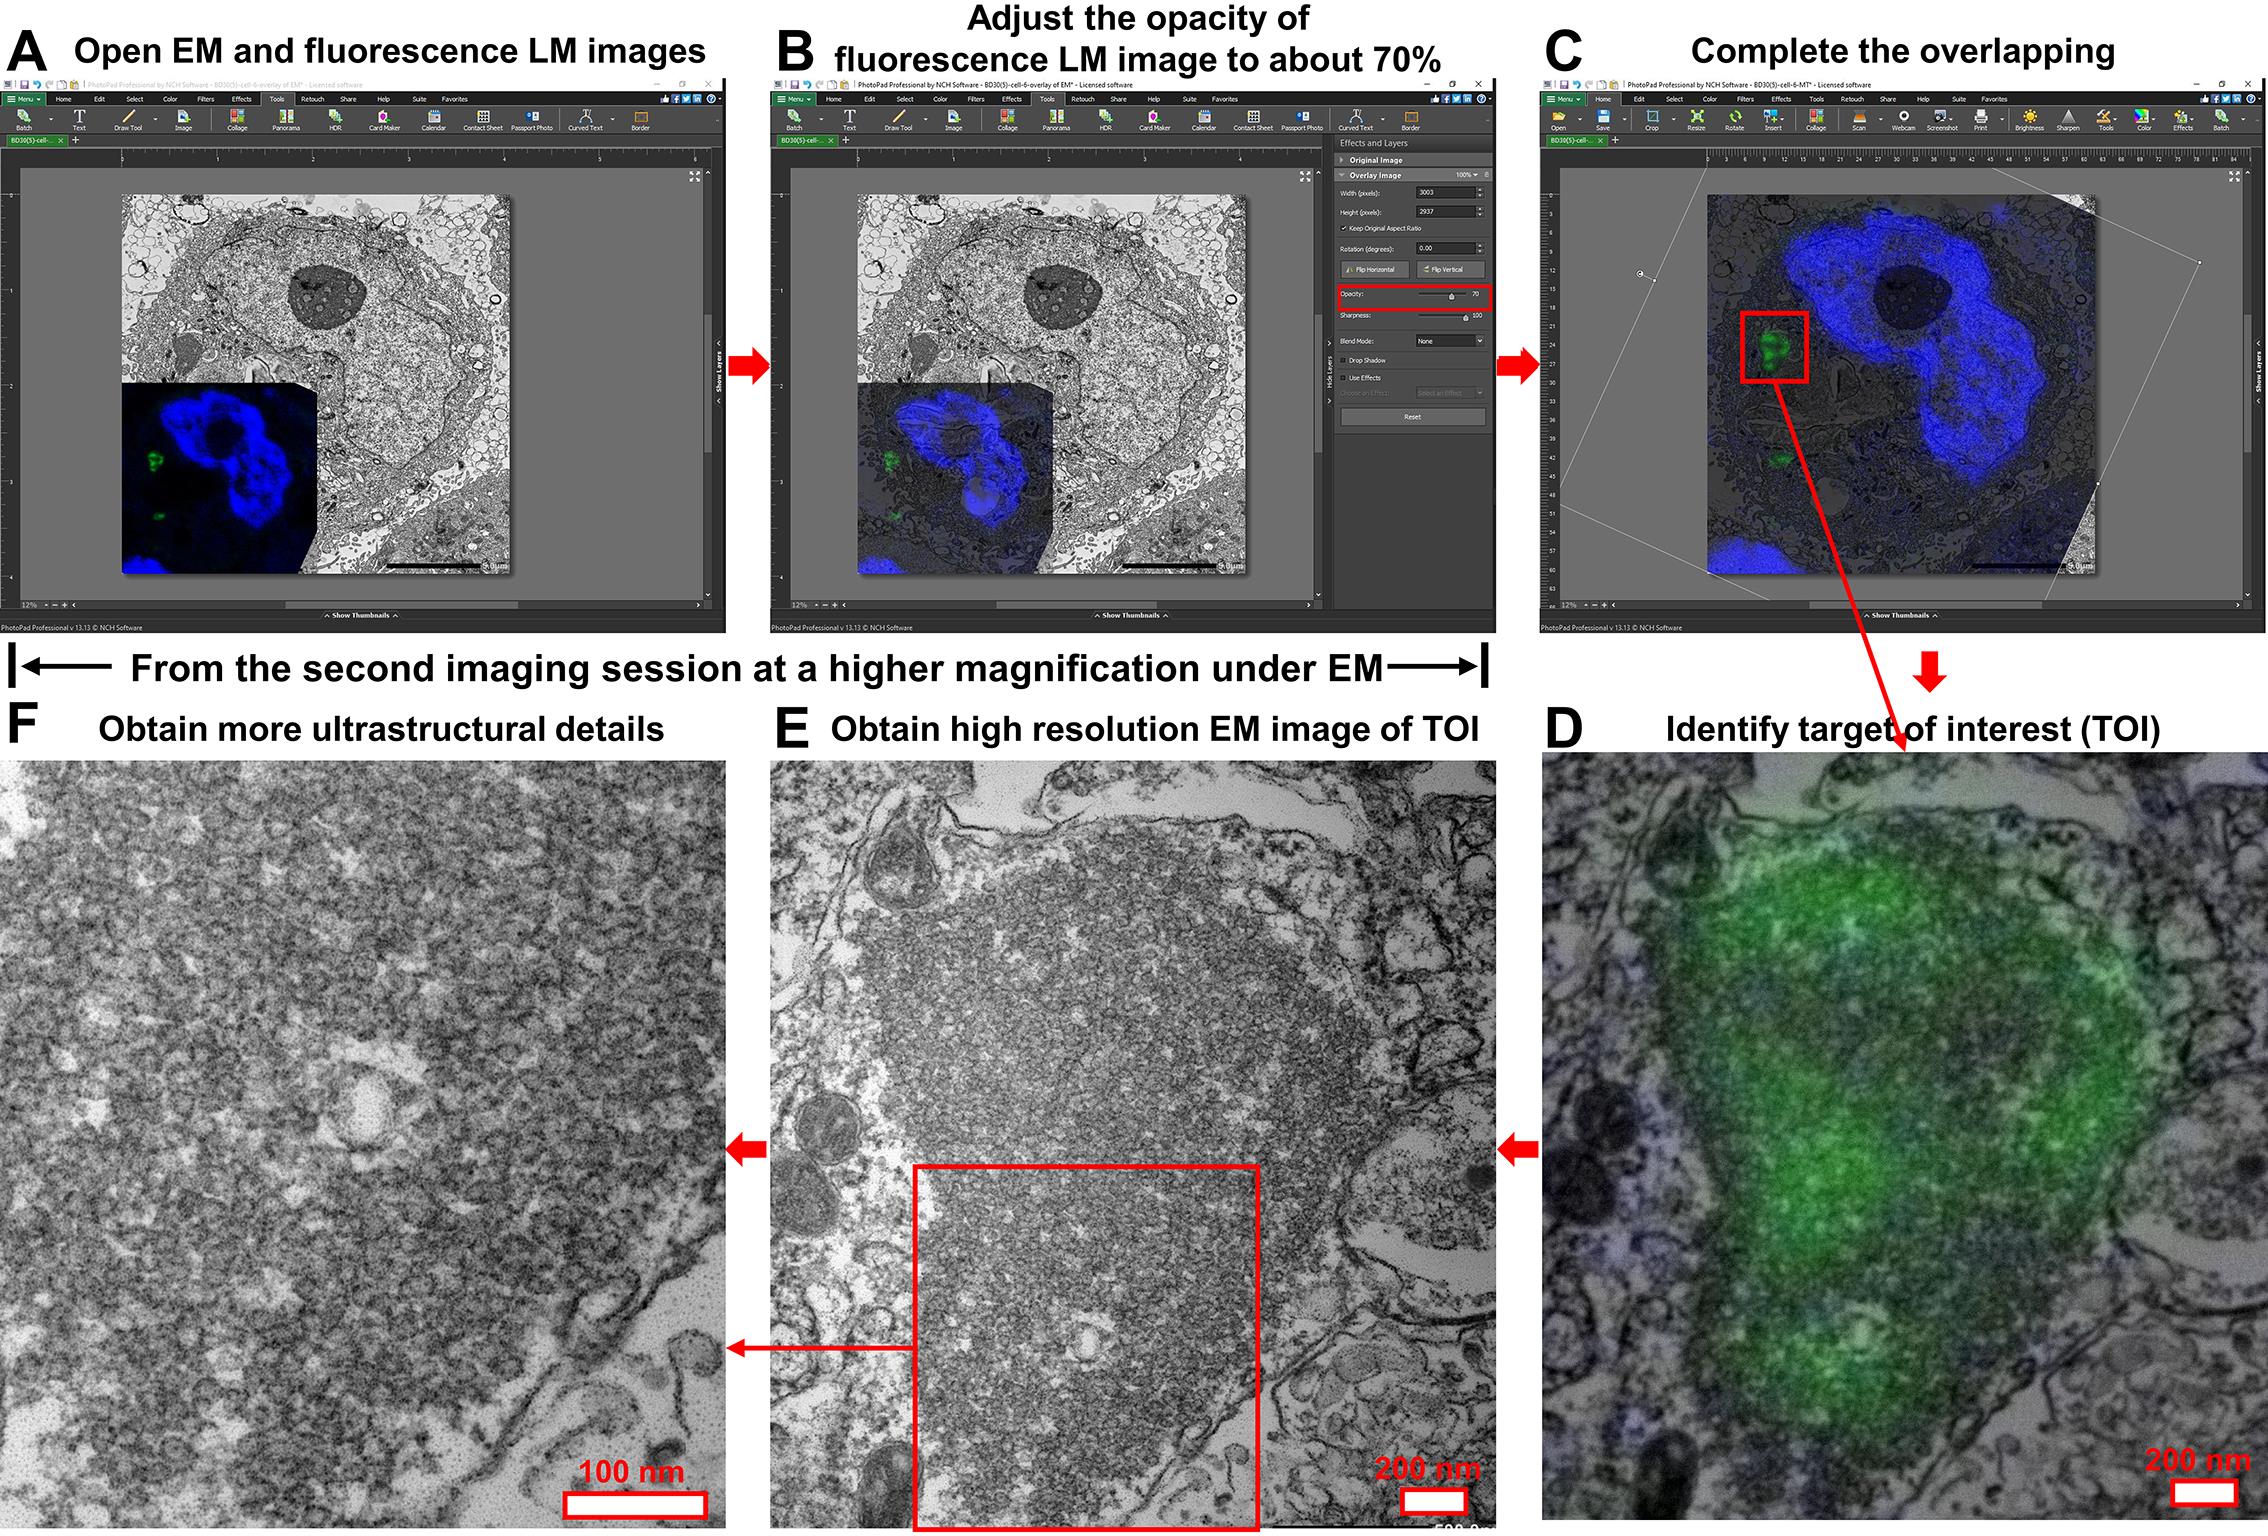
Figure 6. Step-by-step CLEM application for cultured cell samples. (A) Open both the primary EM image and the high-magnification fluorescent LM image of the target area in PhotoPad Image Editor. (B) Set the opacity of the fluorescent LM image to ~70% to keep the underlying EM structures visible. (C) Rotate and resize the fluorescent LM image so that nuclei and target structures align with those in the EM image. (D) Crop individual targets of interest and export merged images for reference during the second EM imaging session. (E, F) Conduct a second EM imaging session to acquire higher-resolution images of selected targets. Scale bars are included in each panel.
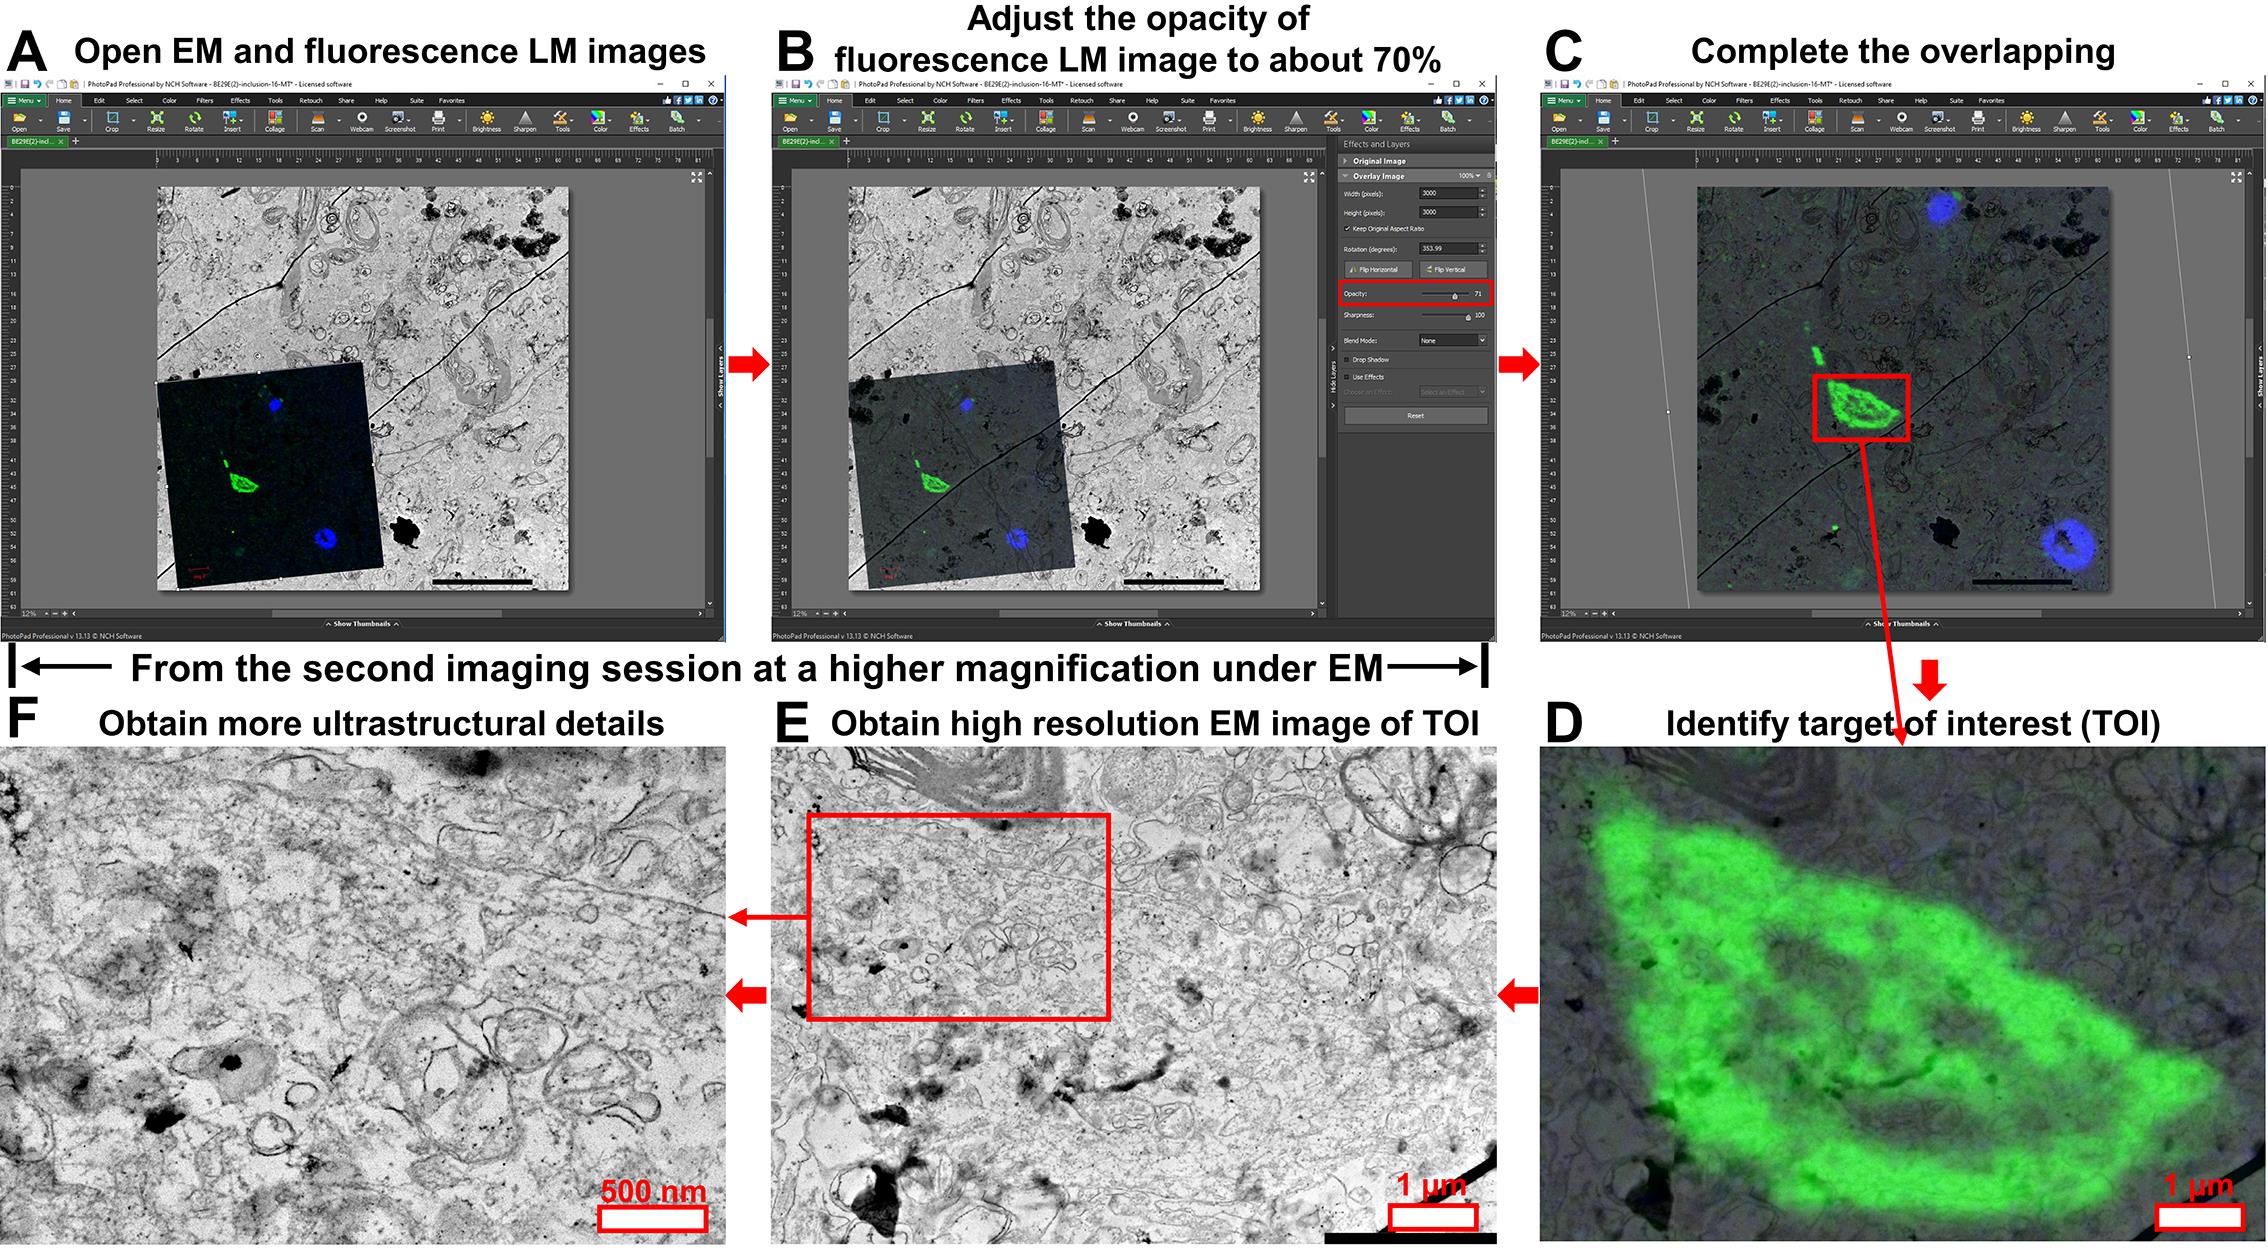
Figure 7. Step-by-step CLEM application for human brain samples. (A) Open both the primary EM image and the high-magnification fluorescent LM image of the target area in PhotoPad Image Editor. (B) Set the opacity of the fluorescent LM image to ~70% to keep the underlying EM structures visible. (C) Rotate and resize the fluorescent LM image so that nuclei and target structures align with those in the EM image. (D) Crop individual targets of interest and export merged images for reference during the second EM imaging session. (E, F) Conduct a second EM imaging session to acquire higher-resolution images of selected targets. Scale bars are included in each panel.
D2. Second fluorescent LM acquisition to improve image quality
1. Using the labeled fluorescent LM image, locate each individual target by using the DAPI-stained nuclei as fiducial markers under a confocal microscope.
2. Adjust the laser intensity and exposure time to optimize the DAPI signal and the fluorescence signal for each labeled target. Focus on the specific target to achieve a fluorescence LM image with a better quality under the 40× lens. This step maximizes target signal collection and minimizes potential signal loss from tile scans caused by slight focus deviations.
3. Export the fluorescent LM image as a TIFF file. These images are now ready to be overlaid with the corresponding EM image.
D3. Correlative light and electron microscopy (CLEM)
In this protocol, we use a commercial software, PhotoPad Image Editor, to correlate images from EM and LM. The main steps are demonstrated in Figures 6 and 7.
1. Open the primary EM image of the target with potential interest in PhotoPad Image Editor.
2. Click Image+ to add the corresponding high-magnification fluorescent LM image as a top layer on the EM image (Figures 6A and 7A).
3. Adjust the opacity of the fluorescent LM image to approximately 70% or to an optimal level based on contrast and signal strength. This allows both the fluorescent signals and the underlying ultrastructural features in the EM image to remain visible (Figures 6B and 7B).
4. Use the mouse to rotate the fluorescent LM image, then adjust its size by dragging its edges until the nucleus and specific target structures are perfectly matched between the two images. Matching the nuclei is usually straightforward, while matching the target of interest may require more attention to detail. For protein deposits, this step is typically easier, as these structures usually present distinctive shapes in the EM image (Figures 6C and 7C).
5. Once the images are perfectly overlapped, save the CLEM project. Export the fluorescent LM image in its correlated orientation and the merged EM-LM image. Once the targets of interest are identified, crop each individual target and export the merged image for the subsequent second EM imaging session (Figures 6D and 7D).
6. Using the cropped overview image as a reference, conduct a second EM imaging session on the same EM section to acquire higher-resolution images of selected targets (Figures 6E, 6F, 7E, and 7F). Final resolution should be determined based on whether the ultrastructural detail is adequate for analysis.
Note: In the LM/EM/LM sandwich method, the same EM section placed in the center is used to correlate with two flanking fluorescent LM sections. The two correlated datasets can then be merged to produce a final CLEM image, allowing targets of interest from both LM sections to be projected onto the central EM section. In the LM/EM/IEM sandwich method, the central EM section is correlated with one outer fluorescent LM section and one immuno-EM (IEM) section. This approach enables the projection of targets of interest onto the same EM section, visualized both as fluorescence signals and as gold particles. The latter provides precise localization at the ultrastructural level [20].
Validation of protocol
This protocol or parts of it has been used and validated in the following research article(s):
• Jiang et al. [20]. Correlative light and electron microscopy imaging of proteinaceous deposits in cell cultures and brain tissues. Acta Neuropathol Commun (Figures 3, 4A, 5A, 6A, 7, and 8A).
• The current article (Figures 4, 5, 6, 7, and cover image).
General notes and troubleshooting
General notes
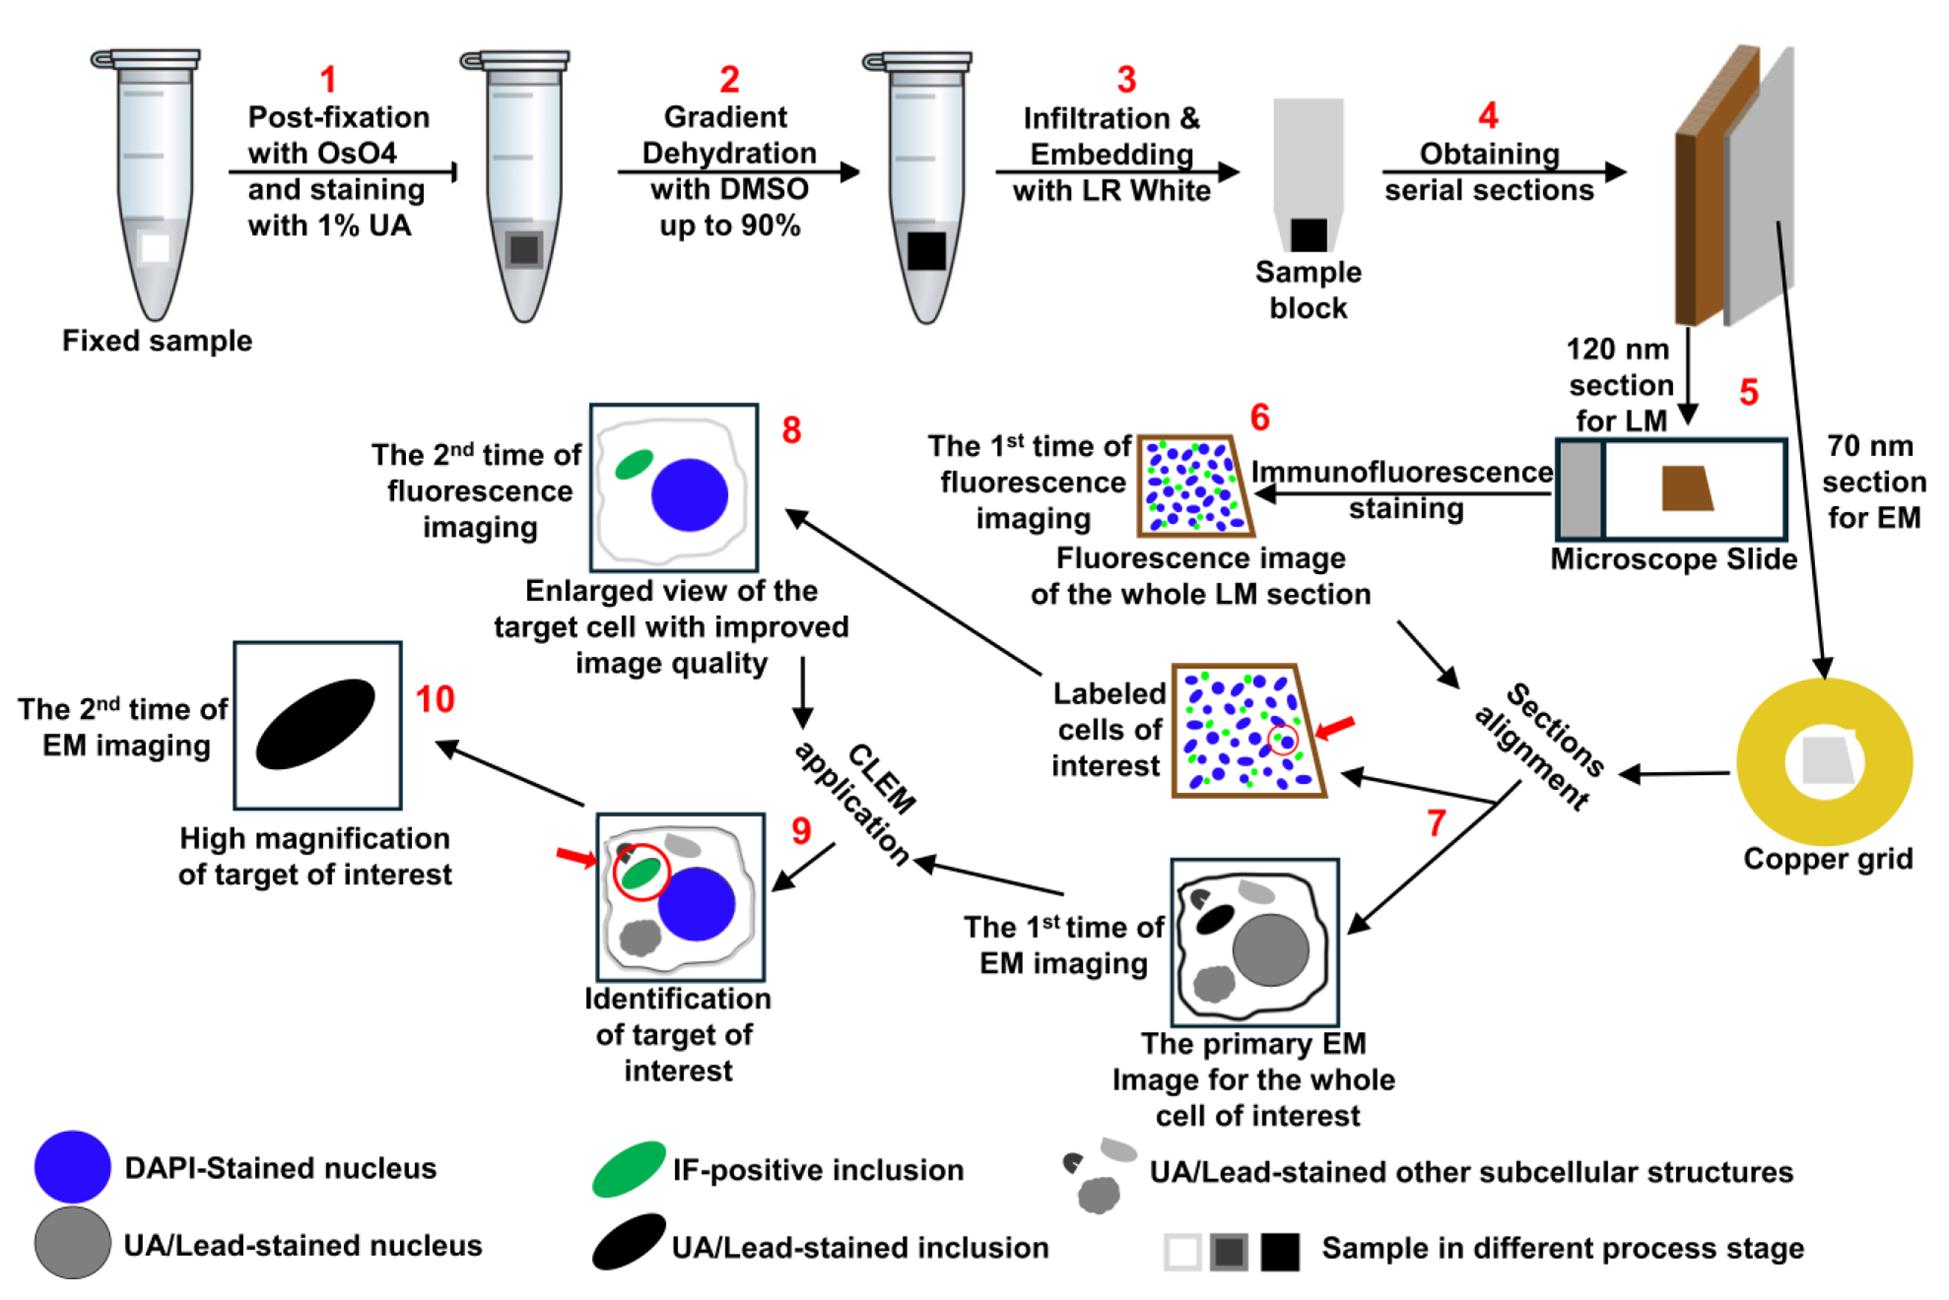
1. The graphic overview presents a clear flowchart that helps readers understand how the fluorescence LM and EM sections are separately processed for image acquisition, why two rounds of imaging are necessary for both fluorescence LM and EM, and how targets of interest are tracked and correlated between the two imaging modalities.
2. Serial sections of varying thickness are required for CLEM, which demands extra care and patience during sectioning. It is recommended to pause the ultramicrotome immediately after the diamond knife passes the edge of the sample. Then, adjust the section thickness before proceeding with the next ultrathin cut. This allows the ultramicrotome sufficient time to stabilize and adapt to the new thickness setting, thereby improving the success rate of the subsequent sectioning.
3. Although replacing traditional dehydration and embedding reagents significantly improves antigen preservation, epitope availability remains limited in ultrathin sections. Therefore, we strongly recommend using polyclonal antibodies for immunostaining, as they typically yield stronger signals by recognizing multiple epitopes. Below is a list of validated polyclonal primary antibodies and their optimal dilutions for 120 nm sections:
• In-house name: NACP98, rabbit against α-synuclein, Mayo Clinic, 1:300.
• Catalog #: CPCA-SNCA, chicken against α-synuclein, EnCor Biotechnology, 1:300.
• Catalog #: Ab75714, chicken against Tau, Abcam, 1:300.
• Catalog #: Ab1791, rabbit against Histone H3, Abcam, 1:300.
• Catalog #: AS08329, chicken against human Aβ (1-42), Alexotech, 1:300.
• Catalog #: 71-5800, rabbit against human Aβ full length, Thermo Fisher, polyclonal, 1:300.
Troubleshooting
Problem 1: Osmicated tissues may cause jelly-like resin formation during infiltration, making sample handling for embedding difficult.
Solution: Transfer the sample with the jelly-like resin onto a piece of Parafilm. Carefully trim away the excess resin with a blade to minimize interference, then transfer the sample into fresh LR white resin for embedding. This approach should not compromise subsequent polymerization or the ultrastructural integrity of the sample.
Problem 2: In postmortem brain tissue, nuclei may be poorly visualized due to DNA degradation.
Solution: If DAPI staining fails, immunostaining for histones can be used as an alternative nuclear marker. This issue is typically not encountered in cultured cells.
Problem 3: Difficulty in transferring sectioned samples onto grid film surfaces.
Solution: Use coverslip forceps to adjust the angle of the film surface, ensuring it is parallel to the ultrathin section for improved contact and transfer success. Additionally, limiting the section size to no more than 0.75 mm (half the film's diameter) can further improve loading efficiency. If a major part of the section accidentally attaches to the metal edge of the grid instead of the filmed center hole, it is recommended to discard this grid to recut new serial sections, since separating the attached section from the grid for recovery is very difficult.
Problem 4: Rapid loss of fluorescence signals during laser scanning for ultrathin sections.
Solution: Although the procedures and materials used for immunofluorescence staining in ultrathin and paraffin-embedded sections are largely similar, the significantly lower epitope content in ultrathin sections makes their fluorescence signals more prone to photobleaching. To minimize signal loss during the first round of image acquisition (tile scan), we recommend optimizing laser settings by using a lower laser intensity combined with a longer exposure time. This approach helps capture the entire section while reducing photobleaching. For the second round of image acquisition, where no further imaging is required, a higher laser intensity can be used to maximize the signal from the region of interest. Additionally, we strongly recommend imaging the section as soon as possible after staining to avoid signal degradation that may occur during prolonged storage.
Acknowledgments
This study was supported in part by the National Institute of Health (grants U54 NS110435, U01 NS100620, U19 AG069701, P01 AG003949), the Mangurian Foundation Lewy Body Dementia Program at Mayo Clinic, and the Mayo Foundation for Medical Education and Research. The original research paper in which the protocol was described and validated is Jiang et al. [20].
Competing interests
There are no conflicts of interest or competing interests.
Ethical considerations
All brain samples were obtained from the Mayo Clinic Brain Bank, which operates under the approval of the Mayo Clinic Institutional Review Board.
References
- Koo, E. H., Lansbury, P. T. and Kelly, J. W. (1999). Amyloid diseases: Abnormal protein aggregation in neurodegeneration. Proc Natl Acad Sci USA. 96(18): 9989–9990. https://doi.org/10.1073/pnas.96.18.9989
- Sweeney, P., Park, H., Baumann, M., Dunlop, J., Frydman, J., Kopito, R., McCampbell, A., Leblanc, G., Venkateswaran, A., Nurmi, A., et al. (2017). Protein misfolding in neurodegenerative diseases: implications and strategies. Transl Neurodegener. 6(1): 6. https://doi.org/10.1186/s40035-017-0077-5
- Braak, H. and Braak, E. (1995). Staging of alzheimer's disease-related neurofibrillary changes. Neurobiol Aging. 16(3): 271–278. https://doi.org/10.1016/0197-4580(95)00021-6
- Braak, H., Ghebremedhin, E., Rüb, U., Bratzke, H. and Del Tredici, K. (2004). Stages in the development of Parkinson’s disease-related pathology. Cell Tissue Res. 318(1): 121–134. https://doi.org/10.1007/s00441-004-0956-9
- Brettschneider, J., Del Tredici, K., Toledo, J. B., Robinson, J. L., Irwin, D. J., Grossman, M., Suh, E., Van Deerlin, V. M., Wood, E. M., Baek, Y., et al. (2013). Stages of pTDP-43 pathology in amyotrophic lateral sclerosis. Ann Neurol. 74(1): 20–38. https://doi.org/10.1002/ana.23937
- Tsoi, P. S., Quan, M. D., Ferreon, J. C. and Ferreon, A. C. M. (2023). Aggregation of Disordered Proteins Associated with Neurodegeneration. Int J Mol Sci. 24(4): 3380. https://doi.org/10.3390/ijms24043380
- Wu, J., Wu, J., Chen, T., Cai, J. and Ren, R. (2024). Protein aggregation and its affecting mechanisms in neurodegenerative diseases. Neurochem Int. 180: 105880. https://doi.org/10.1016/j.neuint.2024.105880
- Koszła, O. and Sołek, P. (2024). Misfolding and aggregation in neurodegenerative diseases: protein quality control machinery as potential therapeutic clearance pathways. Cell Commun Signaling. 22(1): 421. https://doi.org/10.1186/s12964-024-01791-8
- Shastry, B. S. (2003). Neurodegenerative disorders of protein aggregation. Neurochem Int. 43(1): 1–7. https://doi.org/10.1016/s0197-0186(02)00196-1
- Kumar, V., Sami, N., Kashav, T., Islam, A., Ahmad, F. and Hassan, M. I. (2016). Protein aggregation and neurodegenerative diseases: From theory to therapy. Eur J Med Chem. 124: 1105–1120. https://doi.org/10.1016/j.ejmech.2016.07.054
- Shahmoradian, S. H., Lewis, A. J., Genoud, C., Hench, J., Moors, T. E., Navarro, P. P., Castaño-Díez, D., Schweighauser, G., Graff-Meyer, A., Goldie, K. N., et al. (2019). Lewy pathology in Parkinson’s disease consists of crowded organelles and lipid membranes. Nat Neurosci. 22(7): 1099–1109. https://doi.org/10.1038/s41593-019-0423-2
- Han, X., Li, P. H., Wang, S., Blakely, T., Aggarwal, S., Gopalani, B., Sanchez, M., Schalek, R., Meirovitch, Y., Lin, Z., et al. (2023). Mapping Alzheimer’s Molecular Pathologies in Large-Scale Connectomics Data: A Publicly Accessible Correlative Microscopy Resource. bioRxiv: e563674. https://doi.org/10.1101/2023.10.24.563674
- Wieland, J. G., Naskar, N., Rück, A. and Walther, P. (2022). Fluorescence lifetime imaging and electron microscopy: a correlative approach. Histochem Cell Biol. 157(6): 697–702. https://doi.org/10.1007/s00418-022-02094-0
- Galbraith, C. G. and Galbraith, J. A. (2011). Super-resolution microscopy at a glance. J Cell Sci. 124(10): 1607–1611. https://doi.org/10.1242/jcs.080085
- Kisielowski, C., Freitag, B., Bischoff, M., van Lin, H., Lazar, S., Knippels, G., Tiemeijer, P., van der Stam, M., von Harrach, S., Stekelenburg, M., et al. (2008). Detection of Single Atoms and Buried Defects in Three Dimensions by Aberration-Corrected Electron Microscope with 0.5-Å Information Limit. Microsc Microanal. 14(5): 469–477. https://doi.org/10.1017/s1431927608080902
- Loussert Fonta, C. and Humbel, B. M. (2015). Correlative microscopy. Arch Biochem Biophys. 581: 98–110. https://doi.org/10.1016/j.abb.2015.05.017
- de Boer, P., Hoogenboom, J. P. and Giepmans, B. N. G. (2015). Correlated light and electron microscopy: ultrastructure lights up! Nat Methods. 12(6): 503–513. https://doi.org/10.1038/nmeth.3400
- Iwasaki, H., Ichinose, S., Tajika, Y. and Murakami, T. (2022). Recent technological advances in correlative light and electron microscopy for the comprehensive analysis of neural circuits. Front Neuroanat. 16: e1061078. https://doi.org/10.3389/fnana.2022.1061078
- Shafiei, N., Stӓhli, D., Burger, D., Di Fabrizio, M., van den Heuvel, L., Daraspe, J., Böing, C., Shahmoradian, S. H., van de Berg, W. D. J., Genoud, C., et al. (2025). Correlative light and electron microscopy for human brain and other biological models. Nat Protoc.: e1038/s41596–025–01153–9. https://doi.org/10.1038/s41596-025-01153-9
- Jiang, P. and Dickson, D. W. (2025). Correlative light and electron microscopy imaging of proteinaceous deposits in cell cultures and brain tissues. Acta Neuropathol Commun. 13(1): 53. https://doi.org/10.1186/s40478-025-01969-2
Article Information
Publication history
Received: May 8, 2025
Accepted: Jun 24, 2025
Available online: Jul 15, 2025
Published: Aug 5, 2025
Copyright
© 2025 The Author(s); This is an open access article under the CC BY-NC license (https://creativecommons.org/licenses/by-nc/4.0/).
How to cite
Jiang, P. and Dickson, D. W. (2025). A Step-By-Step Protocol for Correlative Light and Electron Microscopy Imaging of Proteinaceous Deposits in Cultured Cells and Human Brain Tissues. Bio-protocol 15(15): e5402. DOI: 10.21769/BioProtoc.5402.
Category
Neuroscience > Nervous system disorders > Neurodegeneration
Neuroscience > Neuroanatomy and circuitry > Brain nerve
Cell Biology > Cell imaging > Electron microscopy
Do you have any questions about this protocol?
Post your question to gather feedback from the community. We will also invite the authors of this article to respond.