- Protocols

- Articles and Issues
- For Authors
- About
- Become a Reviewer

Fluorescence Polarization-Based High-Throughput Screening Assay for Inhibitors Targeting Cathepsin L
(*contributed equally to this work) Published: Vol 15, Iss 14, Jul 20, 2025 DOI: 10.21769/BioProtoc.5400 Views: 2292
Reviewed by: Neha NandwaniAnonymous reviewer(s)
Original research article
The authors used this protocol in:

Apr 2024

Protocol Collections
Comprehensive collections of detailed, peer-reviewed protocols focusing on specific topics


Related protocols

Abstract
Cathepsin L (CTSL), a lysosomal cysteine protease belonging to the papain-like protease family, is primarily involved in intracellular protein degradation, antigen processing, and extracellular matrix remodeling. It plays critical roles in pathological conditions, including cancer metastasis, neurodegenerative disorders, and viral infection, due to dysregulated activity or overexpression. Thus, inhibitors targeting CTSL are under investigation for therapeutic applications. Current approaches for identifying CTSL inhibitors predominantly rely on fluorescence-labeled substrates, fluorescence resonance energy transfer (FRET), and cell-based screening assays. Here, we applied the principle of fluorescence polarization (FP) to the detection of substrate cleavage activity by CTSL through changes in millipolarization unit (mp) values and established a cost-effective, quantitative, reagent- and time-saving inhibitor high-throughput screening (HTS) assay. We also provide detailed steps for the expression and purification of highly active CTSL from eukaryotic cells, which lays a solid foundation for the FP-based assay. A key advantage of this assay lies in its reduced susceptibility to fluorescence interference, as the fluorescein isothiocyanate (FITC) fluorophore exhibits high quantum efficiency with an emission peak at 535 nm—a wavelength range distinct from most naturally occurring fluorescent molecules. The assay’s adaptability to reaction time, temperature, and dimethyl sulfoxide (DMSO) concentration minimizes false-positive or false-negative results caused by minor experimental inconsistencies, streamlining the screening process. Furthermore, the protocol requires fewer operational steps, reduced incubation time, and lower quantities of CTSL and substrates compared to conventional methods. This rapid, cost-effective, and scalable approach aligns well with the demands of HTS platforms.
Key features
• Detailed procedures for eukaryotic expression, purification, and identification of active recombinant CTSL and determination of its biological activity.
• Full description for application of fluorescence polarization (FP)-based high-throughput screening (HTS) assay targeting CTSL.
• Elaboration for the application of the FP-based assay in CTSL activity evaluation or drug discovery.
• Protocol is readily adaptable to other proteases with a similar catalytic mechanism.
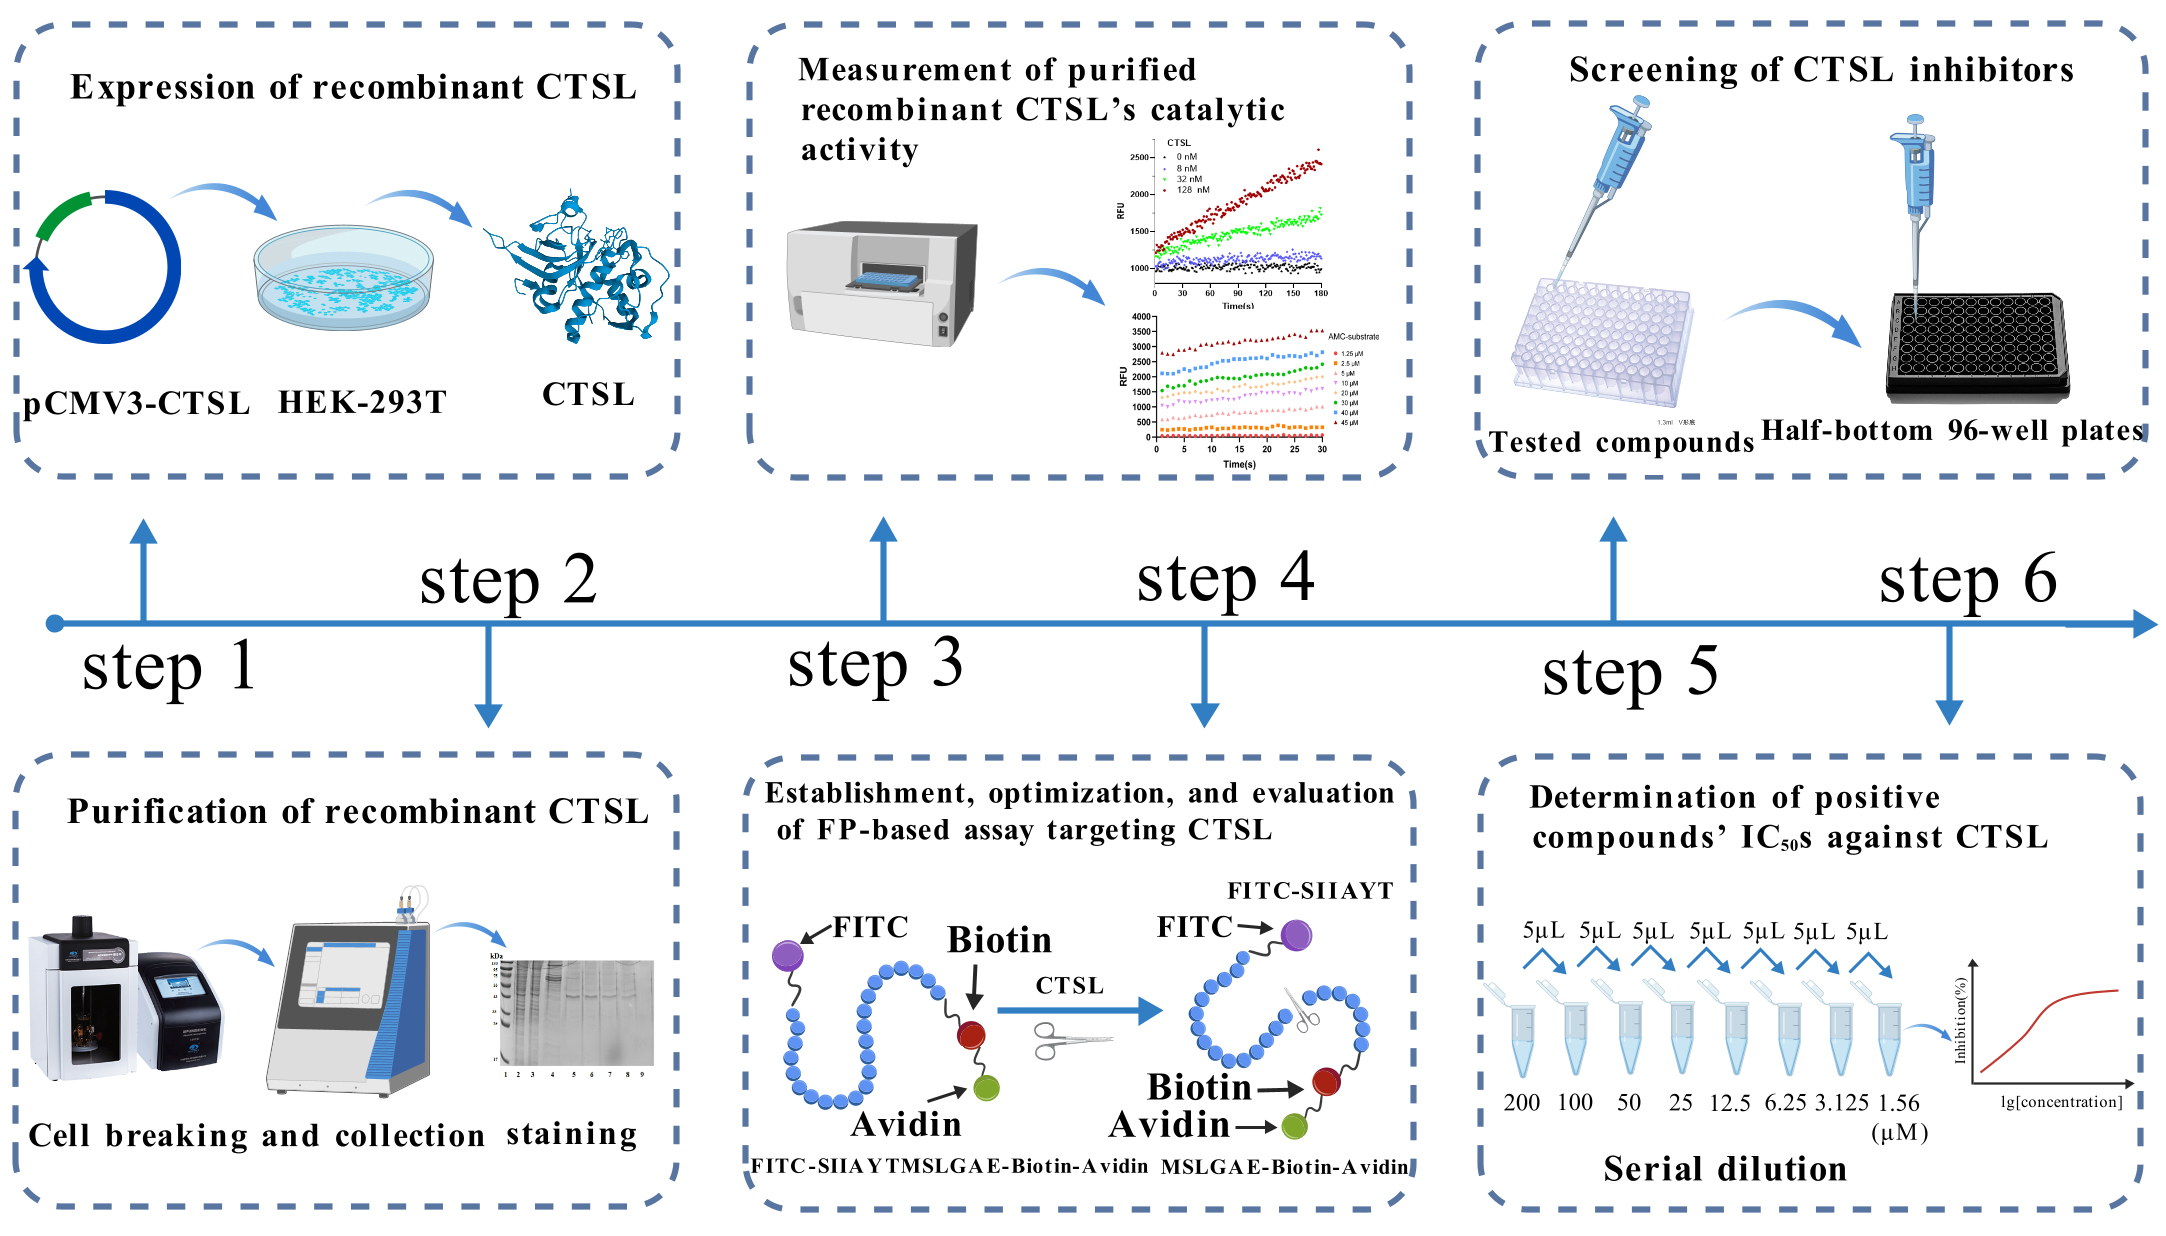
Keywords: Cathepsin LGraphical overview
Background
Being an endosomal cysteine protease, cathepsin L (CTSL) serves as a critical mediator of viral entry by proteolytically activating fusion proteins essential for host cell membrane penetration. This mechanism has been implicated in diverse viral families, including caliciviruses, Ebola virus, reovirus, coronaviruses, and hepatitis E virus [1]. Given that viral entry constitutes the initial step of infection and replication, CTSL inhibition represents a promising therapeutic strategy to disrupt viral lifecycles. Beyond virology, CTSL exhibits significant oncogenic potential through its capacity to remodel the extracellular matrix (ECM). By degrading structural ECM components and basement membranes, CTSL facilitates tumor cell migration, angiogenesis, and metastasis [2]. Notably, its overexpression in esophageal squamous cell carcinoma (ESCC) correlates with tumor-associated macrophage activity, linking protease function to immune and inflammatory pathways [3]. These multifaceted roles in disease pathogenesis underscore the urgent need for targeted CTSL inhibitors.
Current CTSL inhibitor screening predominantly employs fluorescence-based assays (e.g., FRET, fluorescence correlation spectroscopy) and cell-based models, yet each method presents inherent constraints. FRET assays require precise spectral compatibility between donor-acceptor pairs to minimize crosstalk, necessitating extensive optimization of fluorophore combinations [4]. Fluorescence correlation spectroscopy suffers from photobleaching artifacts and limited throughput [5], while cell-based approaches are time-intensive. These challenges highlight the demand for robust, high-efficiency screening alternatives.
First conceptualized in 1926, fluorescence polarization (FP) technology exploits rotational dynamics of fluorescent molecules under polarized excitation [6]. Crucially, FP eliminates separation steps by performing homogeneous solution-phase measurements, offering advantages in speed, sensitivity, and operational simplicity [7]. When a fluorophore-labeled ligand remains unbound, rapid Brownian motion (nanosecond-scale rotation) induces significant emission depolarization, yielding low millipolarization (mP) values. Ligand binding to macromolecular targets (e.g., avidin) restricts rotational freedom, preserving polarization and generating elevated mP signals. Key merits of FP include high sensitivity, miniaturization compatibility, minimal sample volumes, operational efficiency, and low interference. These attributes position FP as a versatile tool for high-throughput drug discovery pipelines.
Based on this principle, we established a high-throughput screening (HTS) model for CTSL inhibitors. Our assay utilizes a bifunctional substrate (SIIAYTMSLGAE) with FITC conjugation at the C-terminus and biotin at the N-terminus. In uninhibited conditions, CTSL cleaves the substrate into two fragments: FITC-SIIAYT (low molecular weight, rapid rotation, low mP) and MSLGAE-Biotin. Conversely, CTSL inhibition preserves substrate integrity, and avidin-mediated biotin capture further amplifies mass differences for enhanced detection by generating a high-mass FITC-SIIAYTMSLGAE-Biotin complex with restricted rotation, producing elevated mP signals proportional to inhibitor potency (Figure 1) [8]. This FP-based system enables rapid, separation-free quantification of inhibitory activity through mP value modulation. To establish this HTS model, we first expressed CTSL in a eukaryotic system and purified the recombinant protein. The enzymatic activity of purified CTSL was then assessed using the fluorogenic substrate Z-Phe-Arg-AMC, as previously described [9]. CTSL specifically cleaves the amide bond between arginine (Arg) and 7-amino-4-methylcoumarin (AMC) in Z-Phe-Arg-AMC, releasing free AMC, which exhibits strong fluorescence emission at 440 nm upon excitation at 365 nm, while the intact substrate (Z-Phe-Arg-AMC) is non-fluorescent. The rate of AMC release is directly proportional to CTSL enzymatic activity, allowing for real-time kinetic measurements.
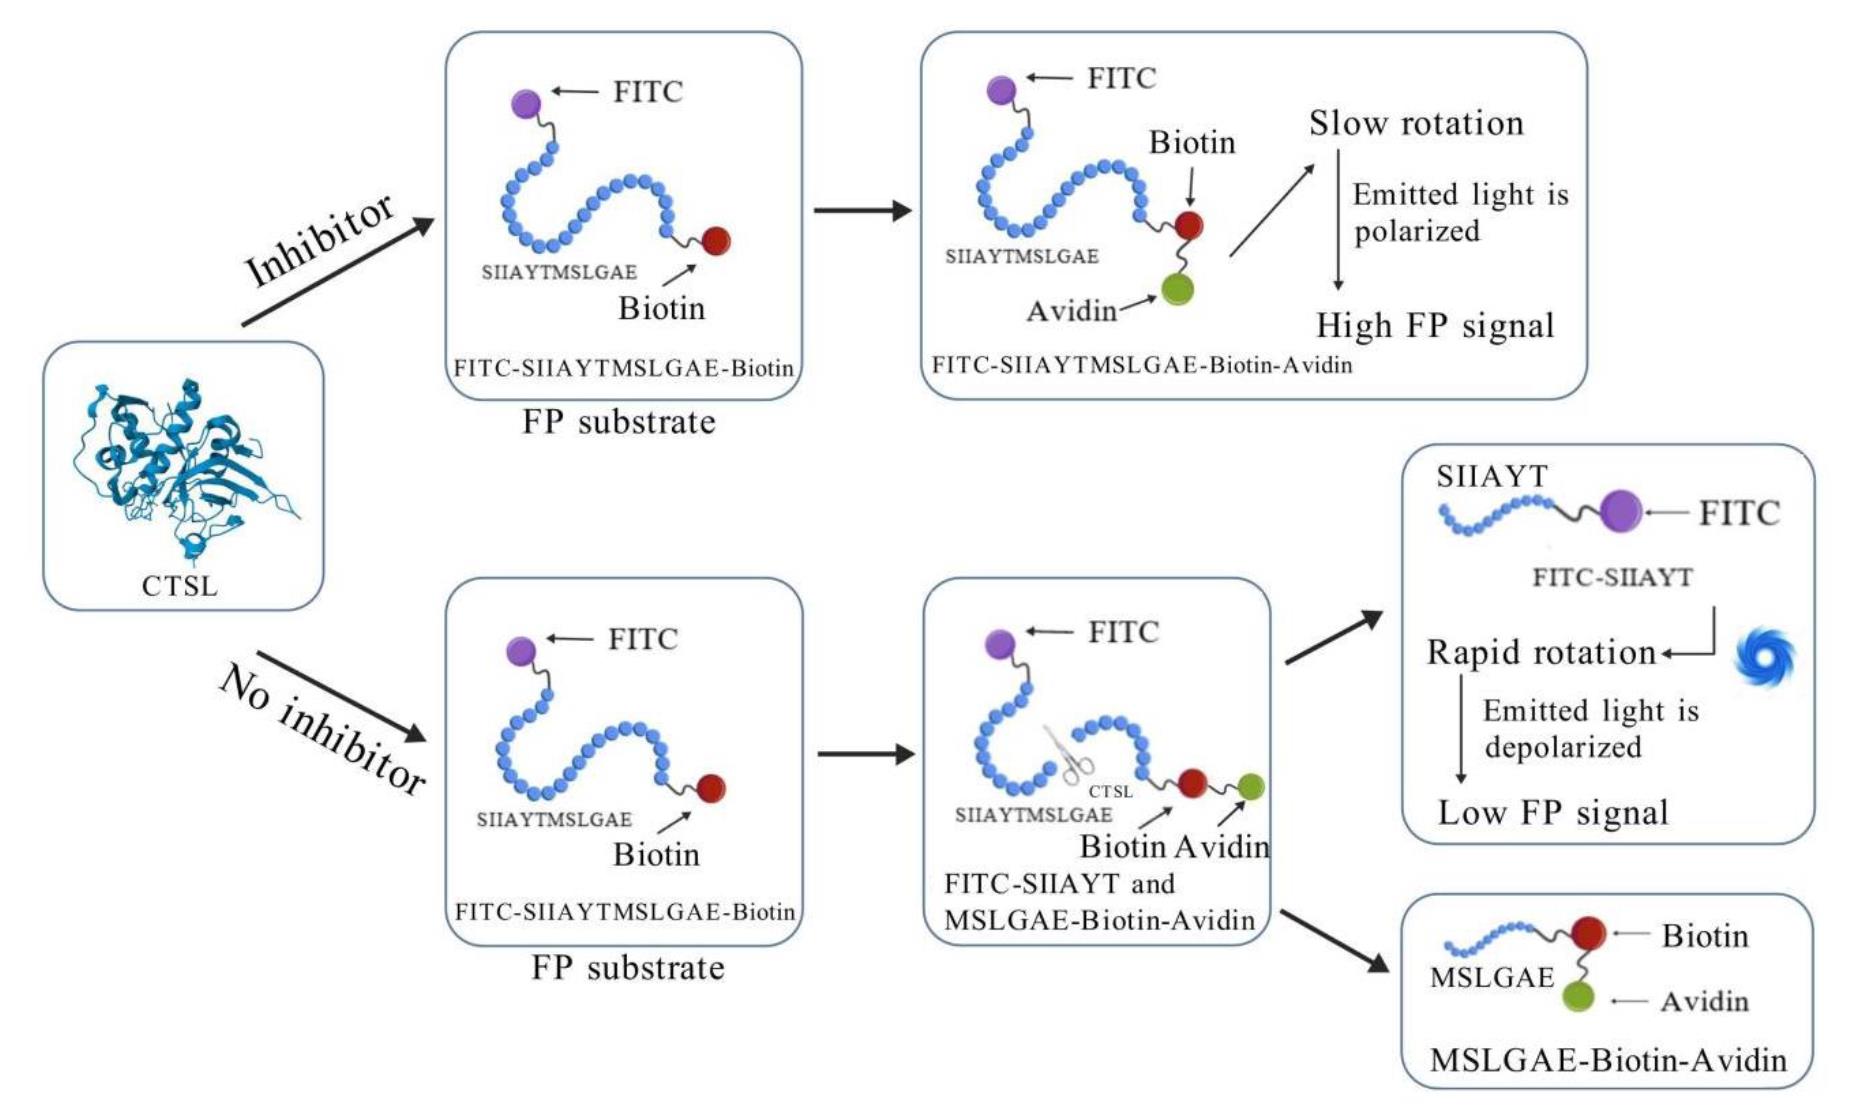
Figure 1. Schematic illustration of fluorescence polarization (FP)-based high-throughput screening (HTS) assay for inhibitors targeting cathepsin L (CTSL). In the FP-based HTS assay, a high-molecular-weight complex is formed through the binding of FITC-SIIAYTMSLGAE-Biotin substrate to avidin, which exhibits slow rotational diffusion, resulting in elevated millipolarization (mP) values. Active CTSL enzymatically cleaves the FP substrate into two fragments: FITC-SIIAYT and MSLGAE-Biotin. The FITC-labeled peptide fragment FITC-SIIAYT, due to its low molecular weight, undergoes rapid rotational motion and displays isotropic emission, thereby generating a reduced FP signal. Consequently, inhibition of CTSL enzymatic activity by bioactive compounds preserves the integrity of the avidin-bound substrate, leading to retention of high mP values. This inverse correlation between protease activity and mP signal provides a robust quantitative readout for identifying and validating CTSL inhibitors in HTS campaigns.
Materials and reagents
Biological materials
1. Escherichia coli (E. coli) DH5α competent cells (TransGen Biotech, catalog number: CD201-01)
2. HEK-293T cells (Sunncell Biotech, catalog number: SNL-015)
Reagents
1. DNA marker (TransGen Biotech, catalog number: BM401-01)
2. Plasmid Extraction kit (TransGen Biotech, catalog number: EM101-02)
3. Protein marker (Meilun Biotech, catalog number: MA0352-1)
4. SARS-CoV-2 S protein (Sino Biological, catalog number: 40591-V08H)
5. CTSL DNA fragment (NCBI reference sequence: NM_001912.4, synthesized by GenScript Biotech)
6. FP substrate: FITC-SIIAYTMSLGAE-Biotin (synthesized by GenScript Biotech)
7. CTSL protein (Sino Biological, catalog number: 10486-H08H)
8. DMEM (Cytiva Company, catalog number: SH30021.01)
9. DMSO (Thermo Fisher Scientific, catalog number: D12345)
10. Kpn I (Biolabs, catalog number: R3142V)
11. Xba I (Biolabs, catalog number: R0145V)
12. FBS (Gibco, catalog number: A5670701)
13. Avidin (Thermo Fisher Scientific, catalog number: 434401)
14. Z-Phe-Tyr-CHO (MedChem Express, catalog number: HY-128140)
15. FreeStyleTM 293 expression medium (Gibco, catalog number: 12338026)
16. Imidazole (VETEC, catalog number: V900153-500G)
17. Yeast extraction (OXODI, catalog number: LP0021T)
18. Agar powder (OXODI, catalog number: 22700041)
19. HisTrapTM chromatography column (Cytiva Company, catalog number: 17524802)
20. Bicinchoninic Acid (BCA) Protein Quantitative kit (Thermo Fisher Scientific, catalog number: 23227)
21. CTSL polyclonal antibody (Thermo Fisher Scientific, catalog number: PA5-119012)
22. Horseradish peroxidase (HRP) labeled goat anti-rabbit IgG (ZSGB Biotech, catalog number: PI-1000)
23. Carbobenzoxy-phenylalanyl-arginyl-7-amino4-methylcoumarin (Z-Phe-Arg-AMC) (Sigma, catalog number: C9521)
24. Kanamycin (Sigma, catalog number: E004000)
25. 7-Amino-4-methylcoumarin (AMC) (Sigma, catalog number: 257370)
26. LipofectamineTM 2000 (Thermo Fisher Scientific, catalog number: 11668019)
27. pCMV3-C-His-NCV (Sino Biological, catalog number: CV015)
28. Tris (Sigma, catalog number: S4762)
29. BSA (Biosharp, catalog number: BL2182A)
30. DTT (Sigma, catalog number: V900830)
31. EDTA tetrasodium salt (Aladdin, catalog number: T161517)
32. 100× penicillin-streptomycin solution (Biosharp, catalog number: BL505A)
33. HRP-conjugated anti-rabbit IgG (GenStar Biosolutions, catalog number: AS00039)
34. Anti-CTSL polyclonal antibody (Solarbio, catalog number: P07711)
35. NaCl (Biosharp, catalog number: BS112-1kg)
36. Tryptone (OXOID, catalog number: LP0042B)
37. Coomassie Brilliant Blue R-250 (Lab Blue, catalog number: G1042)
38. Methanol (Sigma, catalog number: 322415)
39. Glacial acetic acid (Sigma, catalog number:1005706)
40. Supersensitive ECL chemiluminescence solution (Abbkine Scientific, catalog number: BMU102)
41. EDTANa2 (Solarbio, catalog number: E8030-100)
42. Sodium phosphate (J&K Scientific, catalog number: 997519)
43. Opti-MEM (Thermo Fisher Scientific, catalog number: 11058021)
44. Non-fat dry milk (Bio Froxx, catalog number: 1172GR500)
45. Na2HPO4 (SAITONG, catalog number: S10034-500G)
46. KH2PO4 (MACKLIN, catalog number: P815662)
47. KCl (MACKLIN, catalog number: P816348)
48. Tris-HCl (Solarbio, catalog number: T8230)
49. Tween® 20 (MACKLIN, catalog number: T6335-500ml)
50. HEPES (MACKLIN, catalog number: H917470)
51. Brij® 35 (polyepoxyethylene lauryl ether) (Sangon Biotech, catalog number: A610217-0250)
Solutions
1. Phosphate-buffered saline (PBS) (see Recipes)
2. FP assay buffer (see Recipes)
3. Protein loading buffer (see Recipes)
4. Protein elution buffer (see Recipes)
5. Fluorescence-labeled substrate model buffer (see Recipes)
6. LB liquid medium (see Recipes)
7. LB solid medium (see Recipes)
8. Kanamycin stock solution (see Recipes)
9. HEPES (see Recipes)
10. AMC stock solution (see Recipes)
11. Coomassie Brilliant Blue R-250 staining solution (see Recipes)
12. Destaining solution (see Recipes)
13. Tris-Buffered Saline with Tween 20 (TBST) (see Recipes)
Recipes
1. Phosphate-buffered saline (PBS)
| Reagent | Final concentration | Quantity or Volume |
|---|---|---|
| Na2HPO4 | 10.14 mM | 1.44 g |
| NaCl | 136.75 mM | 8 g |
| KH2PO4 | 1.76 mM | 0.24 g |
| KCl | 2.68 mM | 0.2 g |
| dH2O | n/a | Up to 1,000 mL |
| Total | n/a | 1,000 mL |
Note: Adjust pH to 7.4 with an electronic pH meter using 1 N HCl or 1 N NaOH. Filter through a 0.22 μm membrane or autoclave (121 °C, 15–20 min) for cell culture use. Store at room temperature (RT) (short-term) or 4 °C (long-term). Check for precipitation before use.
2. FP assay buffer (pH 6.0)
| Reagent | Final concentration | Quantity or Volume |
|---|---|---|
| Tris | 10 mM | 1.21 g |
| NaCl | 50 mM | 2.92 g |
| EDTA tetrasodium salt | 1 mM | 0.45 g |
| DTT | 1 mM | 3.08 g |
| ddH2O | n/a | Up to 1,000 mL |
| Total | n/a | 1,000 mL |
Note: Adjust pH to 6.0 with an electronic pH meter using 1 N HCl or 1 N NaOH.
3. Protein loading buffer
| Reagent | Final concentration | Quantity or Volume |
|---|---|---|
| NaCl | 500 mM | 14.61 g |
| Imidazole | 20 mM | 0.6808 g |
| PBS | 50 mM | Up to 500 mL |
| Total | n/a | 500 mL |
4. Protein elution buffer
| Reagent | Final concentration | Quantity or Volume |
|---|---|---|
| NaCl | 500 mM | 14.61 g |
| Imidazole | 400 mM | 13.616 g |
| PBS | 50 mM | Up to 500 mL |
| Total | n/a | 500 mL |
5. Fluorescence-labeled substrate model buffer (pH 5.5)
| Reagent | Final concentration | Quantity or Volume |
|---|---|---|
| DTT | 6 mM | 9.24 g |
| Brij® 35 (polyepoxyethylene lauryl ether) | 0.05% | 0.5 g |
| EDTANa2 | 0.05% | 0.5 g |
| Sodium phosphate solution | 100 mM | Up to 1,000 mL |
| Total | n/a | 1,000 mL |
6. LB liquid medium
| Reagent | Final concentration | Quantity or Volume |
|---|---|---|
| NaCl | 1.0% | 5 g |
| Tryptone | 1.0% | 5 g |
| Yeast extraction | 0.5% | 2.5 g |
| Deionized water | n/a | Up to 500 mL |
| Total | n/a | 500 mL |
Note: Autoclave at 121 °C for 15 min.
7. LB solid medium
| Reagent | Final concentration | Quantity or Volume |
|---|---|---|
| NaCl | 1.0% | 5 g |
| Tryptone | 1.0% | 5 g |
| Yeast extraction | 0.5% | 2.5 g |
| Agar | 1.5% | 7.5 g |
| Deionized water | n/a | Up to 500 mL |
| Total | n/a | 500 mL |
Note: Autoclave at 121 °C for 15 min. Cool medium to ~55 °C. After adding kanamycin with a final concentration of 100 μg/mL, pour 15–20 mL/plate into sterile Petri dishes under aseptic conditions. Let plates solidify at RT for 30 min. Store inverted at 4 °C for about 1 week.
8. Kanamycin stock solution (100 mg/mL)
| Reagent | Final concentration | Quantity or Volume |
|---|---|---|
| Kanamycin powder | 100 mg/mL | 100 mg |
| Deionized water | n/a | Up to 1 mL |
| Total | n/a | 1 mL |
Note: Sterilize by filtration through a 0.22 μm membrane filter and store at -20 °C for future use.
9. HEPES (pH 7.0)
| Reagent | Final concentration | Quantity or Volume |
|---|---|---|
| HEPES | 10 mM | 2.38 g |
| NaCl | 50 mM | 2.92 g |
| EDTA | 1 mM | 0.29 g |
| DTT | 1 mM | 0.15 g |
| Total | n/a | 1 mL |
10. AMC stock solution (10 mM)
| Reagent | Final concentration | Quantity or Volume |
|---|---|---|
| AMC | 10 mM | 1.75 g |
| DMSO | n/a | 1 mL |
| Total | n/a | 1 mL |
Note: Aliquot and store at -20 °C, protecting from light. Dilute with HEPES to the required concentration before use.
11. Coomassie Brilliant Blue R-250 staining solution
| Reagent | Final concentration | Quantity or Volume |
|---|---|---|
| Coomassie Brilliant Blue R-250 | 0.1% w/v | 0.25 g |
| Methanol (or ethanol) | n/a | 90 mL |
| dH2O | n/a | 90 mL |
| Glacial acetic acid | n/a | 20 mL |
| Total | n/a | 200 mL |
Note: Dissolve 0.25 g (0.1% w/v) Coomassie Brilliant Blue R-250 in a mixture of 90 mL methanol (or ethanol) and 90 mL dH2O. Then, add 20 mL of glacial acetic acid.
12. Destaining solution
| Reagent | Final concentration | Quantity or Volume |
|---|---|---|
| Methanol (or ethanol) | 40% | 400 mL |
| Glacial acetic acid | 10% | 100 mL |
| dH2O | 50% | 500 mL |
| Total | n/a | 1,000 mL |
13. TBST (pH 7.4)
| Reagent | Final concentration | Quantity or Volume |
|---|---|---|
| Tris-HCl | 20 mM | 3.15 g |
| NaCl | 150 mM | 8.77 g |
| Tween® 20 | 0.1% | 1 mL |
| Deionized water | n/a | Up to 1,000 mL |
| Total | n/a | 1,000 mL |
Note: Adjust pH to 6.0 with an electronic pH meter using 1 N HCl or 1 N NaOH. Stable at RT for weeks (if sterile). For long-term use, store at 4 °C.
Laboratory supplies
1. Black walled half-bottom plate (Corning, catalog number: 3694)
2. 1.5 mL microcentrifuge tubes (Thermo Fisher Scientific, catalog number: 05-408-129)
3. Pipette tips (1,000, 200, and 10 μL) (Thermo Fisher Scientific, catalog numbers: 02-707-401, 02-708-416, 02-707-437)
4. 200 mL shaking flask for Expi293F (Thermo Fisher Scientific, catalog number: PBV12-5)
5. Micropipettes (Thermo Fisher Scientific, catalog number: F167380)
6. 10 cm culture dish (LABSELECT, catalog number: 12311)
7. 0.22 μm membrane filter (Biosharp, catalog number: BS-PES-22)
8. Cell scraper (LABSELECT, catalog number: 1900)
9. Ultrafiltration tube,10 kDa MWCO (Millipore, catalog number: UFC9010)
Equipment
1. Centrifuge (Hettich, catalog number: Mikro 12-24)
2. Ultrasonic crusher (Scientz Biotechnology, catalog number: SCIENTZ-II D)
3. Water bath (Julabo, catalog number: TW12)
4. Visible UV detector (Shimadzu, catalog number: SPD-20A)
5. In-line degasser (Shimadzu, catalog number: DGU-20A)
6. Surface plasmon resonator (Reichert, catalog number: 2SPR)
7. Ultra-low temperature freezer (SANYO, catalog number: MDF-U3286S)
8. Ultra-clean workbench (JiangSu SuJing, catalog number: BCM-1000A)
9. Water purifier (Millipore, catalog number: Milli-Q)
10. High-content imaging systems (PerkinElmer, catalog number: Operetta CLS)
11. Protein electrophoresis tank (Bio-Rad, catalog number: 1658002)
12. Microscope (Olympus, catalog number: CKX41SF)
13. Incubator (Shanghai Jiecheng, catalog number: HI-80V)
14. Electronic balance (Mettler Toledo, catalog number: AL104)
15. Electronic pH meter (Sartorius, catalog number: PB-10)
16. Microplate reader (PerkinElmer, catalog number: Enspire 2104 Multilabel Reader)
17. Tabletop centrifuge (Eppendorf, catalog number: 5405000441)
18.ChemiDocTM MP imaging system (Bio-Rad, catalog number: 12003154)
19. Variable mode imager (Tanon, catalog number: Tanon 5200)
20. PH meter (Shanghai Yidian Scientific Instrument Co., Ltd, catalog number: PHS-2F)
21. ÄKTA chromatography system (GE, catalog number: AKTA Explorer 100)
22. Microscope (Olympus, catalog number: DP74)
Software and datasets
1. GraphPad Prism 9.0 (GraphPad Software, San Diego, USA)
2. CellSens Standard (Olympus, Tokyo, Japan)
Procedure
Part I: Preparation of recombinant CTSL
A. Expression of CTSL
1. Construction of the recombinant expression plasmid pCMV3-CTSL: Ligate the synthetic codon-optimized DNA fragment encoding CTSL into a pCMV3-C-His-NCV vector with Kpn I and Xba I restriction sites to obtain the recombinant expression plasmid pCMV3-CTSL (Figure 2).
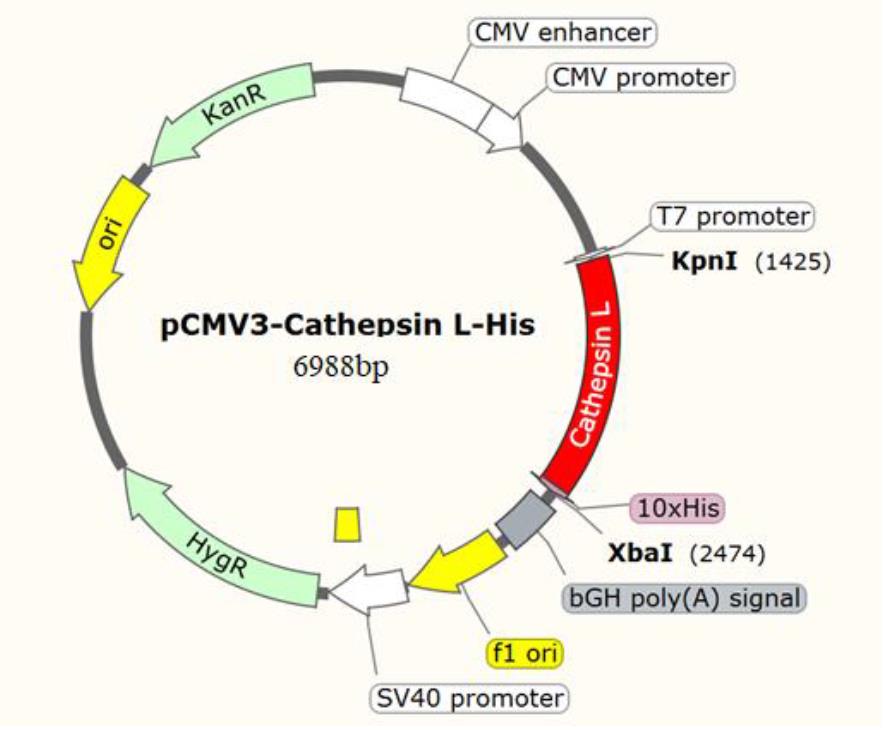
Figure 2. Construction of the recombinant expression plasmid pCMV3-CTSL. The DNA fragment encoding cathepsin L (CTSL) was cloned into the pCMV3-C-His-NCV expression vector using the Kpn I and Xba I restriction sites, enabling directional insertion of the gene into the multiple cloning region of the C-terminal His-tagged vector.
2. Transformation of pCMV3-CTSL into E. coli DH5α competent cells.
a. Thaw the E. coli DH5α competent cells stored at -80 °C on ice.
b. Add 100 ng of pCMV3-CTSL to 100 μL of competent cells.
c. Mix well and incubate in an ice bath for 30 min.
Notes:
1. Avoid repeated freeze-thaw cycles; use aliquots stored at -80 °C only once.
2. Mix cells and plasmid gently (e.g., by pipetting slowly) to avoid shearing the cells.
3. Keep cells on ice at all times during thawing and handling. Rapid temperature changes reduce transformation efficiency.
d. Heat shock in a water bath at 42 °C for 90 s.
e. Ice bath for 2 min.
f. Add 900 μL of LB liquid medium and incubate at 37 °C and 180 rpm for 45 min.
g. Coat 100 μL of the bacterial solution onto an LB solid plate containing 100 μg/mL kanamycin and incubate overnight at 37 °C (12–16 h).
Notes:
1. Incubate plates upside down to prevent condensation from dripping onto colonies.
2. Use freshly prepared antibiotic plates, as old antibiotics are easy to degrade and lead to satellite colonies.
h. Select a single colony and subsequently inoculate into 5 mL of LB medium containing 50 μg/mL kanamycin overnight at 37 °C and 180 rpm.
Note: Pick an isolated single colony to ensure clonal populations.
i. Extract plasmid using the Endotoxin Free Plasmid DNA Isolation kit.
Notes:
1. The protocol is available at https://www.yalibiotech.com/wp-content/uploads/2023/07/2025060608332733.pdf.
2. Use the endotoxin-free Plasmid DNA Isolation kit only if the plasmid is intended for mammalian cell transfection.
3. Expression of CTSL in HEK-293T cells.
a. Incubate HEK-293T cells (6–8 × 10⁴ cells/cm2) with DMEM medium containing 10% FBS and 100 U/mL Pen/strep in a 10 cm culture dish at 37 °C and 5% CO2 to reach 60%–80% confluence overnight (Figure 3).

Figure 3. Representative phase-contrast microscopy image of HEK-293T cells at 60%–80% confluence with a 4× objective lens. Scale bar, 50 μm.
Note: Maintain 60%–80% confluence to optimize transfection efficiency. Overconfluent cells (>90%) show reduced transfection success.
b. After mixing Lipofectamine 2000 (45 μL) with plasmids (pCMV3-CTSL and pCMV3-C-His-NCV, 15 μg each) at a ratio of 3:1 (μL:μg) in Opti-MEM, transfect the mixture into HEK-293T cells.
Notes:
1. Use serum-free Opti-MEM for mixing, as serum inhibits lipid–nucleic acid complex formation.
2. Mix Lipofectamine 2000 with plasmids gently, avoiding vortexing or pipetting vigorously to prevent complex disruption.
3. Allow 15–20 min for lipid–DNA complex formation before adding to cells.
c. The day after transfection, change DMEM to FreeStyleTM 293 expression medium to induce protein expression for 72 h.
d. Scrape the cells with the cell scraper from the dish and centrifuge at 1,000× g for 20 min at 4 °C.
Notes:
1. Avoid over-scraping: excessive force can rupture cells or shear genomic DNA, increasing lysate viscosity.
2. Scrape the cells quickly on ice to minimize protease activity.
e. Dissolve the cell pellet in 10 mL of PBS.
f. Sonicate the above solution in an ultrasonic crusher with settings of 3 s pulse followed by 2 s pause in a beaker with ice per cycle, for a total duration of 30 min.
g. Centrifuge the dissolved cell pellet at 13,000× g for 20 min and collect the supernatant.
h. Filter the supernatant with a 0.22 μm membrane filter.
4. SDS-PAGE analysis of the expression profile for the recombinant plasmid in HEK-293T cells.
a. Mix whole-cell lysate of HEK-293T, whole-cell lysate of HEK-293T transfected with empty vector (pCMV3-C-His-NCV), cell culture supernatant of HEK-293T cells transfected with recombinant plasmid CTSL-pCMV3, and cell pellets of HEK-293T cells transfected with recombinant plasmid CTSL-pCMV3 with 4× loading buffer (e.g., 3:1 ratio).
b. Heat at 95–100 °C for 5–10 min to denature proteins.
c. Centrifuge briefly (at 10,000× g for 1 min) to collect supernatant.
d. Load 10 μL of sample per well onto a polyacrylamide gel.
e. Initiate electrophoresis at a constant voltage of 80 V for approximately 20–30 min, allowing the bromophenol blue tracking dye to migrate to the interface between the stacking gel and separating gel.
f. Then, increase the voltage to 120 V and maintain for approximately 60 min until the bromophenol blue dye front approaches approximately 0.5–1 cm from the bottom of the gel, while ensuring it does not run off the gel matrix.
g. Cover the gel completely with the staining solution. Place the container on an orbital shaker or rocker for gentle agitation.
Note: Ensure the gel is submerged.
h. Stain the gel for 30 min to 1 h at RT.
Note: Longer staining times can increase sensitivity but may require longer destaining.
i. Change the staining solution to destaining solution. Place the container back on an orbital shaker or rocker for gentle agitation.
Note: Change the destaining solution periodically (every 15–30 min initially) when it becomes saturated with blue dye. Replace with fresh destaining solution.
j. Continue destaining until the protein bands appear sharp and dark blue against a clear background.
Note: The destaining process can take anywhere from 30 min to several hours, depending on gel thickness and staining intensity. Overnight destaining with gentle agitation is often convenient and effective.
k. Photograph with the ChemiDocTM MP imaging system (Figure 4).
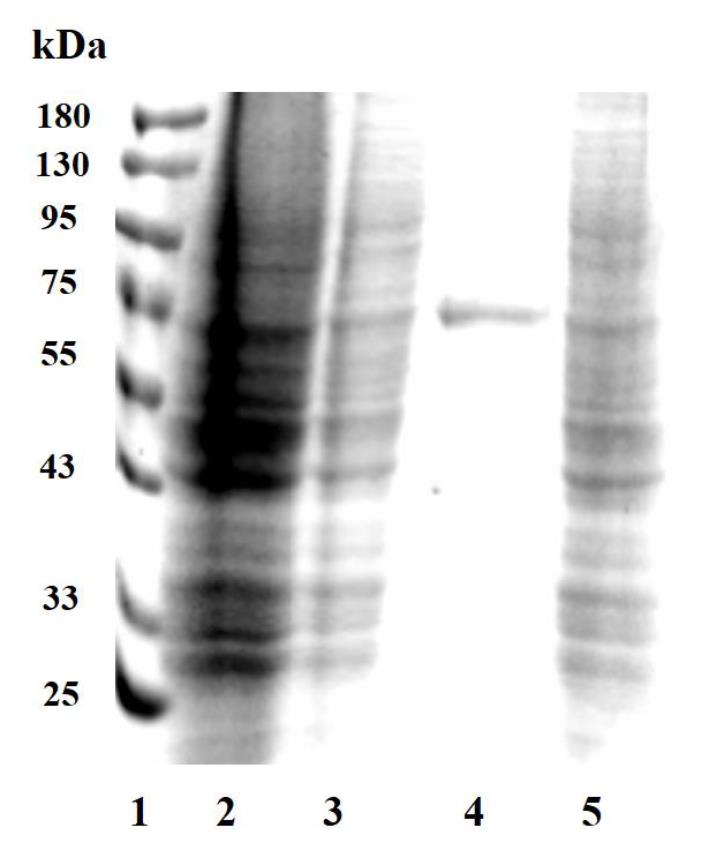
Figure 4. SDS-PAGE detection of cathepsin L (CTSL) expression in HEK-293T cells. Lane 1: protein marker; lane 2: HEK-293T cells without transfection; lane 3: HEK-293T cells transfected with vacant vector pCMV3-C-His-NCV; lane 4: cell culture supernatant of HEK-293T cells transfected with recombinant plasmid CTSL-pCMV3; lane 5: cell pellets of HEK-293T cells transfected with recombinant plasmid CTSL-pCMV3.
B. Purification of recombinant CTSL
1. Install the pre-packed columns into the ÄKTATM machine.
a. Align flow direction and secure connections.
b. Prime gently to avoid bubbles and pressure spikes.
Notes:
1. Avoid air bubbles when installing columns.
2. Avoid dry running; never let the column dry out.
2. Rinse the ÄKTATM system and purification column with 5–10 column volumes of distilled water at a flow rate of 1 mL/min.
3. Rinse the equilibration column with 5–10 column volumes of loading buffer at a flow rate of 1 mL/min.
4. Let the filtered protein sample pass through the purification column at a flow rate of 1 mL/min.
5. Collect the flowthrough.
6. Wash the column with 5% or 10% elution buffer for approximately 5–10 column volumes until the curve stabilizes and collect the flowthrough.
7. Wash the column with 20% elution buffer for 15–20 column volumes and collect the flowthrough.
8. Elute to baseline with elution buffer.
9. Wash the ÄKTATM system and purification column with 10–15 column volumes of deionized (DI) water.
10. Inject 10–15 column volumes of 20% ethanol into the ÄKTATM system and purification column.
11. Analyze each component collected by SDS-PAGE.
a. Mix whole-cell lysate of HEK-293T transfected with recombinant plasmid CTSL-pCMV3, column flowthrough, 20 mM imidazole elution fraction, 100 mM imidazole elution fraction, and 400 mM imidazole elution fraction with 4× loading buffer (e.g., 3:1 ratio).
b. Heat at 95–100 °C for 5–10 min to denature proteins.
c. Centrifuge briefly (10,000× g, 1 min) and collect the supernatant.
d. Load 10 μL of sample per well onto a polyacrylamide gel.
e. Initiate electrophoresis at a constant voltage of 80 V for approximately 20–30 min, allowing the bromophenol blue tracking dye to migrate to the interface between the stacking gel and separating gel.
f. Then, increase the voltage to 120 V and maintain for approximately 60 min until the bromophenol blue dye front approaches approximately 0.5–1 cm from the bottom of the gel, while ensuring it does not run off the gel matrix.
g. Cover the gel completely with the staining solution. Place the container on an orbital shaker or rocker for gentle agitation.
Note: Ensure the gel is submerged.
h. Stain the gel for 30 min to 1 h at RT.
Note: Longer staining times can increase sensitivity but may require longer destaining.
i. Change the staining solution to destaining solution. Place the container back on an orbital shaker or rocker for gentle agitation.
Note: Change the destaining solution periodically (every 15–30 min initially) when it becomes saturated with blue dye. Replace with fresh destaining solution.
j. Continue destaining until the protein bands appear sharp and dark blue against a clear background.
Note: The destaining process can take anywhere from 30 min to several hours, depending on gel thickness and staining intensity. Overnight destaining with gentle agitation is often convenient and effective.
k. Photograph with the ChemiDocTM MP imaging system (Figure 5A).
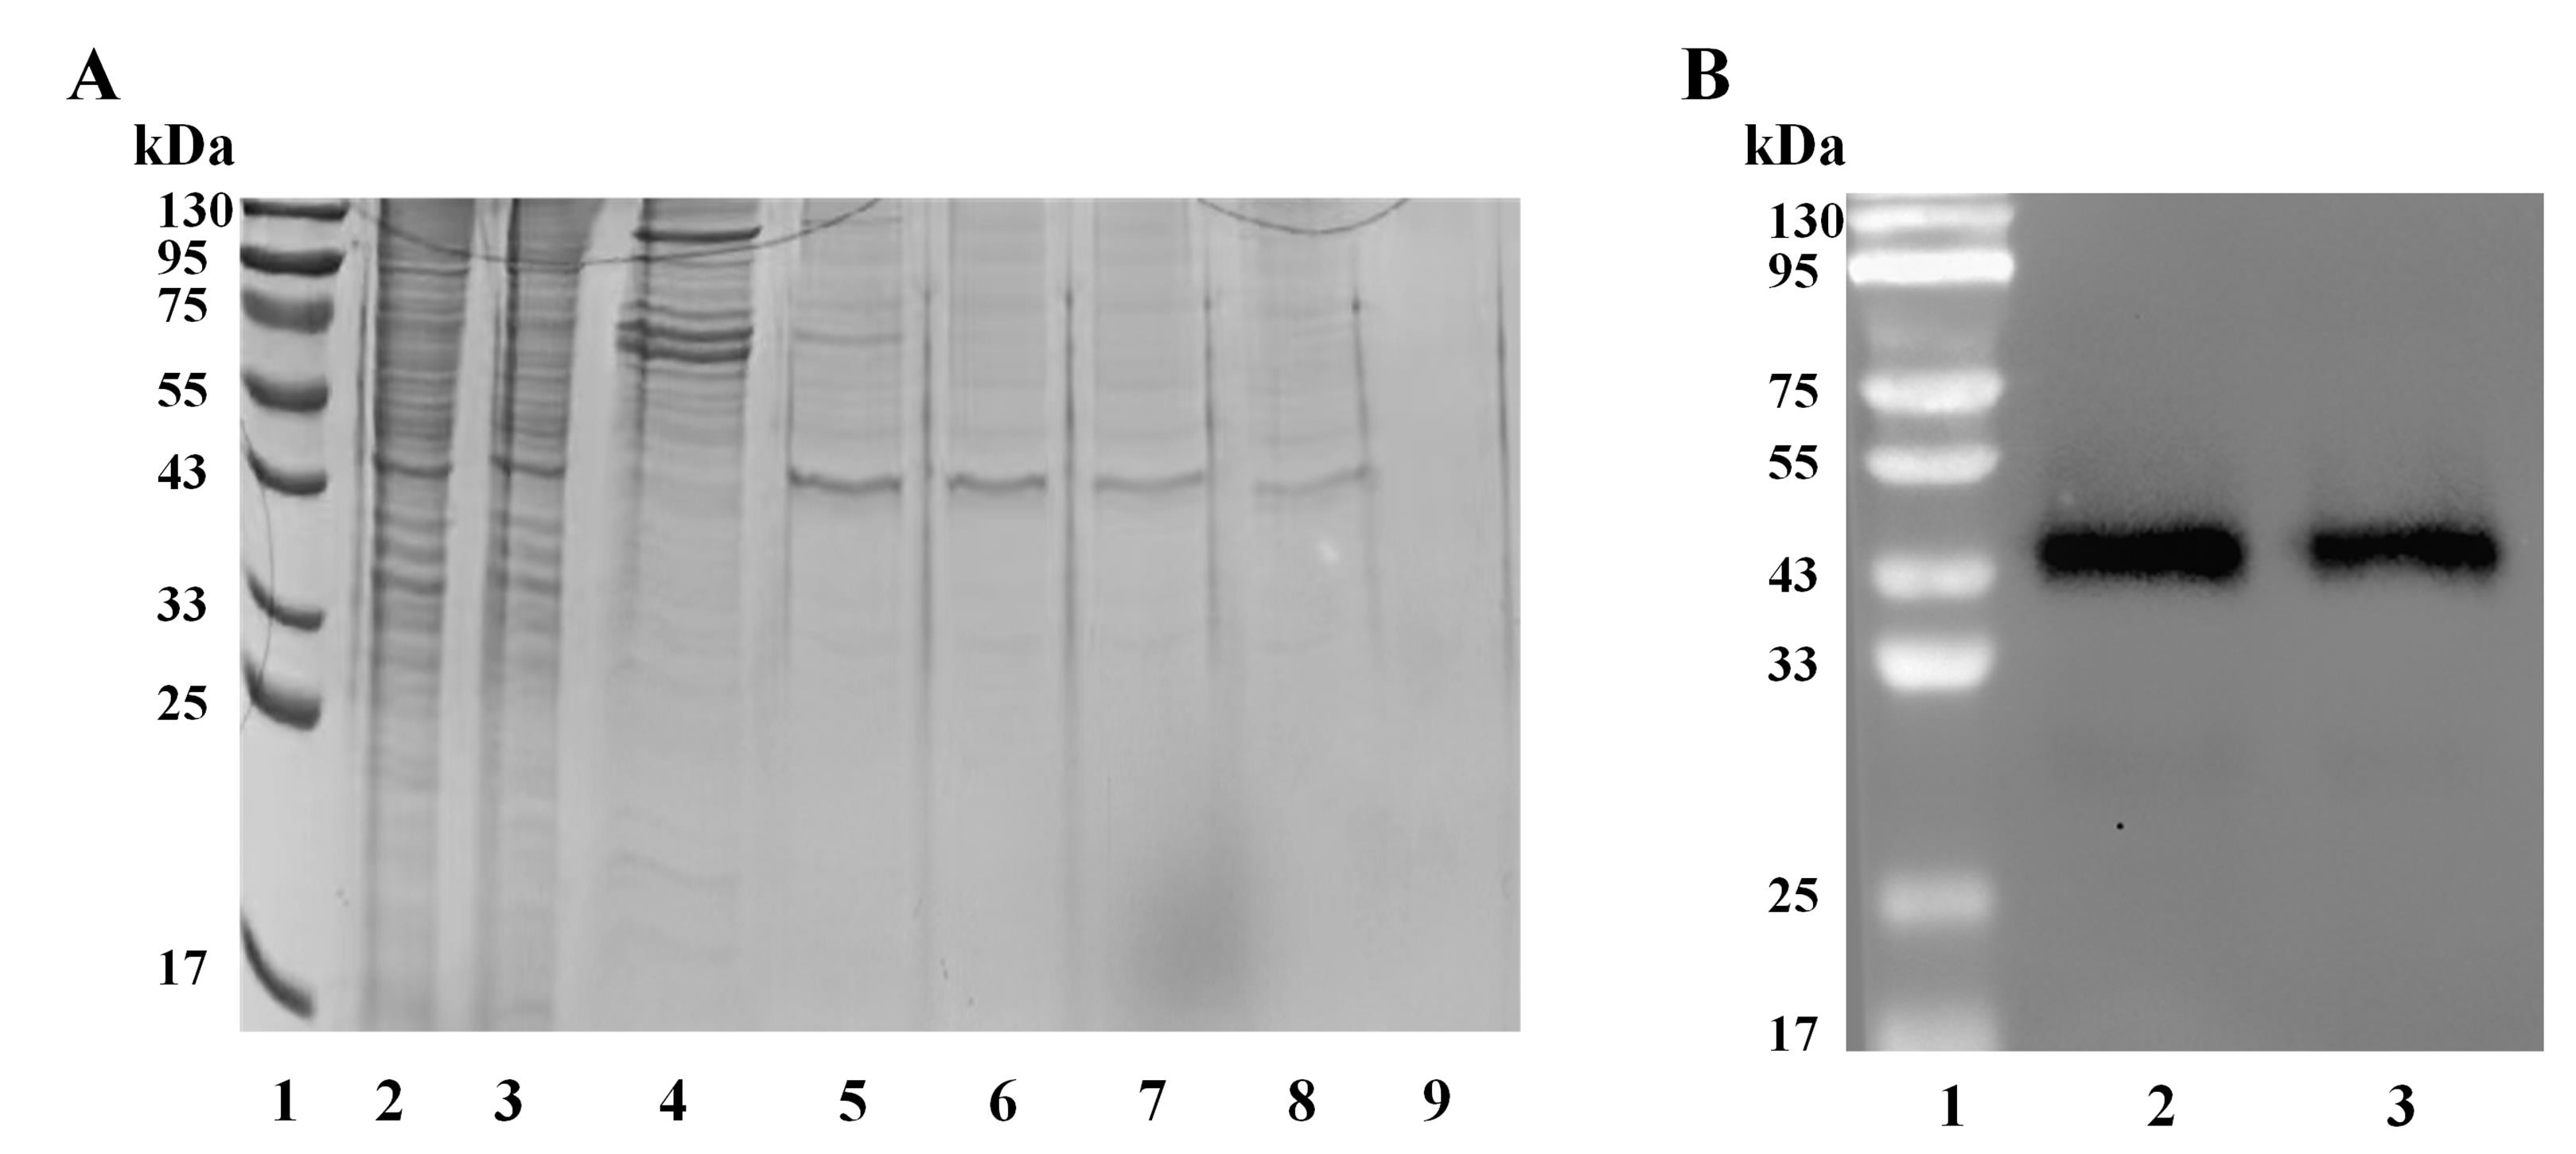
Figure 5. Analysis of purified cathepsin L (CTSL) protein. (A) SDS-PAGE analysis of the purified CTSL protein. Lane 1: protein marker; lane 2: total protein expression; lane 3: column flowthrough; lane 4: 20 mM imidazole elution fraction; lane 5–8: 100 mM imidazole elution fraction; lane 9: 400 mM imidazole elution fraction. (B) Western blotting by anti-CTSL protein antibody. Lane 1: protein marker; lane 2: total protein expression; lane 3: 100 mM imidazole elution fraction.
12. Confirmation of 100 mM imidazole elution fraction by western blotting.
a. Mix whole-cell lysate of HEK-293T transfected with recombinant plasmid CTSL-pCMV3 and 100 mM imidazole elution fraction with 4× loading buffer (e.g., 3:1 ratio).
b. Heat at 95–100 °C for 5–10 min to denature proteins.
c. Centrifuge briefly (10,000× g, 1 min) and collect supernatant.
d. Load 10 μL of sample per well onto a polyacrylamide gel.
e. Initiate electrophoresis at a constant voltage of 80 V for approximately 20–30 min, allowing the bromophenol blue tracking dye to migrate to the interface between the stacking gel and separating gel.
f. Then, increase the voltage to 120 V and maintain for about 60 min until the bromophenol blue dye front approaches approximately 0.5–1 cm from the bottom of the gel, while ensuring it does not run off the gel matrix.
g. Assemble a sandwich: negative electrode sponge > filter paper > gel > nitrocellulose or PVDF membrane > filter paper > positive electrode sponge. Ensure no bubbles. Apply an electrical current to transfer the protein out of the gel and immobilize it onto the membrane.
h. Incubate the membrane in blocking solution (5% non-fat dry milk or BSA in TBST) for 1 h at RT.
i. Incubate the membrane with the primary antibody for 1 h at RT or overnight at 4 °C (overnight incubation often results in better specificity/signal).
j. Wash the membrane several times with TBST to remove unbound primary antibody.
k. Incubate the membrane with the secondary antibody solution (with gentle agitation) for 1 h at RT.
l. Wash the membrane thoroughly several times with TBST to remove unbound secondary antibody.
m. Incubate the membrane with the Supersensitive ECL chemiluminescence solution for 1–5 min at RT.
Note: Ensure the membrane was completely covered by the Supersensitive ECL chemiluminescence solution.
n. Place the membrane in a detection system and image with a variable mode imager (Figure 5B).
13. Concentrate the purified CTSL with ultrafiltration tubes.
a. Sample loading: Add the protein solution to the sample reservoir above the membrane.
b. Spin at 14,000 rpm for 15 min several times.
Notes:
1. Select an ultrafiltration tube with the appropriate molecular weight cut-off (MWCO) (e.g., 3 kDa, 10 kDa, 30 kDa, 100 kDa) based on the target molecule size.
2. Stop periodically to check the retentate (concentrated sample) volume. Avoid overconcentrating to dryness.
3. During the purification process, the temperature should be maintained at 4 °C to ensure the integrity of the protein.
4. Ensure all buffers (loading, equilibration, elution) are filtered with a 0.22 μm membrane filter and vacuum degassed to prevent column clogging. Place the buffer in a flask and apply vacuum with a Büchner funnel or vacuum pump for 15–30 min.
5. The newly purified protein is aliquoted and stored at -80 °C.
Part II: Assessment of the enzymatic activity of purified CTSL
Enzyme activity of purified CTSL is routinely determined by cleavage of the fluorescent substrate Z-Phe-Arg-AMC [9]. Enzyme activity is calculated as:
One unit (U) is typically defined as 1 pmol of AMC released per min at 37 °C.
A. Determination of purified CTSL concentration by BCA assay
1. Dilute the standard BSA (from the kit) with ultrapure water to generate 10 concentration gradients: 2,000, 1,000, 500, 250, 125, 62.5, 31.25, 15.625, 7.8125, and 0 μg/mL.
2. Prepare the BCA working solution by mixing reagent A and reagent B at a volume ratio of 50:1. Vortex thoroughly to ensure homogeneity.
3. Add 10 μL of the prepared BSA standards and 10 μL of CTSL into designated wells of a 96-well plate, with three replicate wells per sample.
Note: When preparing the mixture of 10 μL BSA standards and 10 μL of CTSL, gently vortex or pipette up and down to ensure homogenous mixing of BSA standards and CTSL. Also, avoid introducing bubbles, as they can interfere with absorbance readings.
4. Add 190 μL of BCA working solution to each well. Mix thoroughly and incubate at 37 °C for 30 min.
5. Measure the absorbance at 562 nm using a microplate reader.
B. Analysis of recombinant CTSL enzymatic kinetics
Note: As a specific irreversible/competitive inhibitor of cathepsin L, Z-Phe-Tyr-CHO was used to validate our FP assay system and determine its Z' factor [10].
1. Standard curve of AMC (Figure 6A):
a. Prepare a 10 μM AMC working solution by diluting the AMC stock with fluorescence-labeled substrate model buffer.
b. Add 50 μL/well of AMC at different concentrations (0, 31.25, 62.5, 125, 250, and 500 pmol) to the 96-well plate.
c. Set the microplate reader (excitation 365 nm, emission 440 nm) to automatic gain mode to detect relative fluorescence units (RFU).
d. Generate the standard linear curve for AMC based on the total AMC concentration (x-axis, in pmol) in each well and ΔRFU values (ΔRFU = RFUAMC - RFU0) (y-axis). RFUAMC denotes the fluorescence signal values of AMC with different addition amounts; RFU0 represents the fluorescence signal value of HEPES solution.
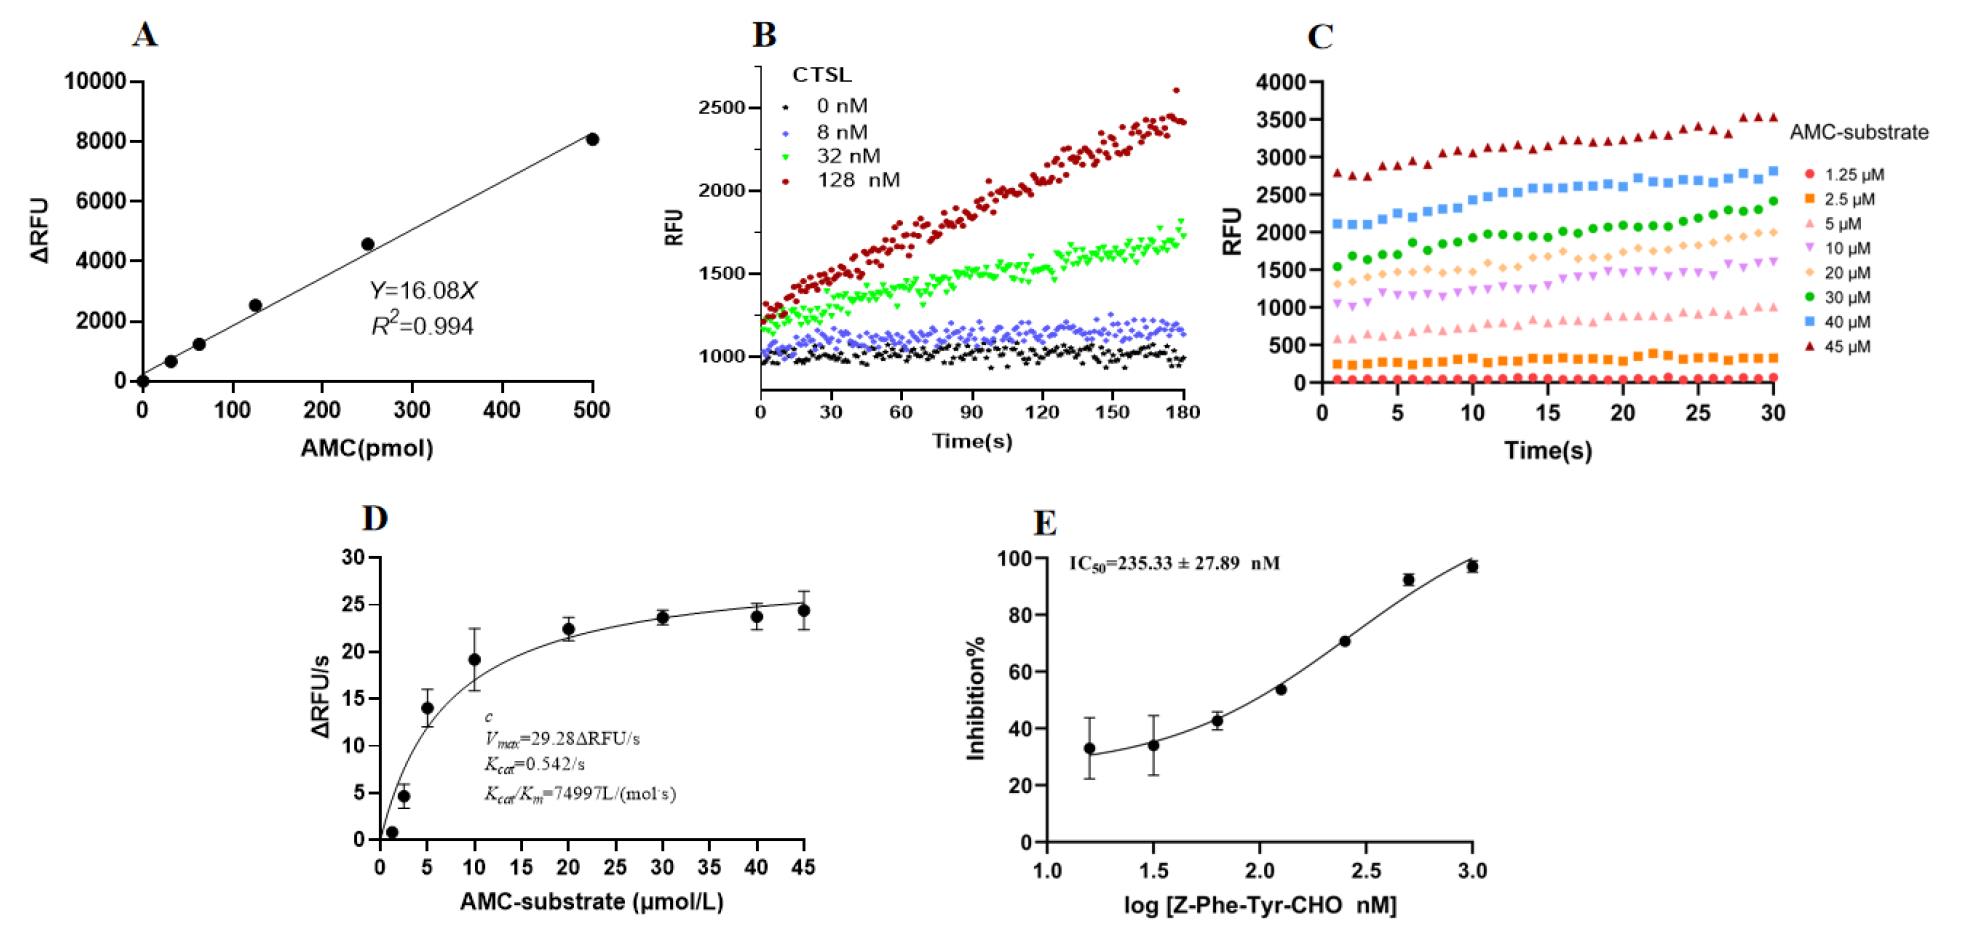
Figure 6. Proteolytic activity of purified cathepsin L (CTSL). (A) Standard curve of fluorescent signal vs. 7-amino-4-methylcoumarin (AMC) concentration measured at an excitation wavelength of 365 nm and an emission wavelength of 440 nm. (B) Time course of RFU for 10 μM AMC substrate treated with purified CTSL (0, 8, 32, 128 nM). (C) Time-dependent RFU changes following the addition of AMC substrate at varying concentrations (1.25, 2.5, 5, 10, 20, 30, 40, 45 μM). (D) Michaelis–Menten graphical analysis of purified CTSL. Data were plotted and analyzed by GraphPad Prism 9.0 using nonlinear regression. Three independent experiments were performed. (E) Inhibitory activity of Z-Phe-Tyr-CHO toward purified CTSL in the FRET assay. The RFU value was measured to calculate the IC50 value of Z-Phe-Tyr-CHO. Data represent mean ± SEM of three independent experiments.
2. Mix 50 μL/well of Z-Phe-Arg-AMC (10 μM) with 50 μL/well of purified CTSL (0, 8, 32, and 128 nM) in a 96-well plate.
3. Read the fluorescence signal liberated by hydrolysis every second for 30 s.
4. Draw a curve based on the time-course changes of RFU for AMC substrate (10 μM) and various concentrations of purified CTSL (Figure 6B).
5. Calculate the specific activity of purified CTSL (U/mg); 128 nM was set as the final working concentration accordingly.
U denotes the enzyme activity unit, which is defined as the amount of enzyme required to catalyze the conversion of 1 pmol of substrate per minute at 37 °C; mg is the total mass of protein in the sample, typically determined by the following formula:
Total protein amount = Final concentration of protein in the reaction system × Volume of protein in the reaction system × Molecular weight of protein
ΔFluorescence/min is derived from linear fitting of the time-dependent RFU curve for 128 nM CTSL with 10 μM substrate.
Note: One unit of enzyme activity was defined as the amount that catalyzed the release of 1 pmol of AMC label/min at 37 °C.
6. Incubate 50 μL/well of purified CTSL (128 nM) with 50 μL/well of various concentrations of Z-Phe-Arg-AMC (1.25, 2.5, 5, 10, 20, 30, 40, and 45 μM).
7. Read the fluorescence signal liberated by hydrolysis every second for 30 s.
8. Plot the data as a scatter plot in GraphPad Prism 9.0, with time on the x-axis and RFU on the y-axis (Figure 6C).
9. Perform linear regression to determine the slope (ΔRFU/s) for each substrate concentration.
10. Input the substrate concentrations and their corresponding slopes into GraphPad Prism 9.0. Fit the data using nonlinear regression, selecting the enzyme kinetics model "Velocity as a function of substrate" and the Michaelis–Menten equation. This analysis will yield the kinetic parameters Vmax and Km (Figure 6D).
11. Calculate kcat using the following formula:
kcat = Vmax/Total enzyme amount
where total enzyme amount = [CTSL] × VCTSL
[CTSL] = concentration of CTSL in the reaction mixture; VCTSL = volume of CTSL solution added.
12. Incubate purified CTSL (128 nM) with increasing amounts of Z-Phe-Tyr-CHO (1.95, 3.91, 7.81, 15.63, 31.25, 62.5, 125, 250, 500, and 1,000 nM) for 30 min at 25 °C.
13. After the addition of Z-Phe-Arg-AMC (10 μM), incubate for 5 min at 25 °C.
14. Record the fluorescence signal of the microplate reader. Determine the IC50 value using GraphPad 9.0 software through curve fitting.
15. Each experiment was repeated three times. A control experiment was set as a mixture of purified CTSL and buffer without Z-Phe-Arg-AMC (Figure 6E).
Part III: Workflow for FP-based CTSL inhibitor screening
A. Preparation of reagents
1. Prepare the tested compounds by dissolving in DMSO to a stock concentration of 10 mg/mL. Prior to use, dilute the stock solution with FP assay buffer to achieve the desired working concentration.
Note: Ensure that the final concentration of DMSO in the assay does not exceed 5% (v/v).
2. Preparation of the FP substrate reaction solution: Dissolve 1 mg of FP substrate in DMSO to prepare a stock solution with a storage concentration of 2 mM. Aliquot and store at -20 °C protected from light. Prior to use, dilute the stock solution with FP buffer to a final working concentration of 80 nM. Store all diluted solutions protected from light until use.
Note: Avoid repeated freeze-thaw cycles for stock aliquots.
3. Preparation of avidin reaction solution: Prepare avidin by diluting with FP buffer to a storage concentration of 40 μM. Aliquot into tubes (50 μL per tube) and store at -20 °C until use.
B. Evaluation of FP-based assay by Z-Phe-Tyr-CHO
1. Mix 29 μL of CTSL (350 nM) with 1 μL of Z-Phe-Tyr-CHO (15.63, 31.25, 62.5, 125, 250, 500, and 1,000 nM) and incubate at RT for 35 min diluted with fluorescence-labeled substrate model buffer.
2. Add 20 μL of FP substrate (80 nM) and incubate at RT for 20 min.
3. Add 10 μL/well of avidin (320 nM) and incubate at RT for 5 min.
4. Measure the mP value with a microplate reader using an excitation wavelength of 485 nm and an emission wavelength of 535 nm. Plot the inhibition curve of Z-Phe-Tyr-CHO using GraphPad Prism 9.0.
Note: Wells without Z-Phe-Tyr-CHO were the negative control, and wells without CTSL the positive control. Experiments were performed in triplicate independently.
5. Calculate the IC50 value of Z-Phe-Tyr-CHO through curve fitting using GraphPad 9.0 (Figure 7).
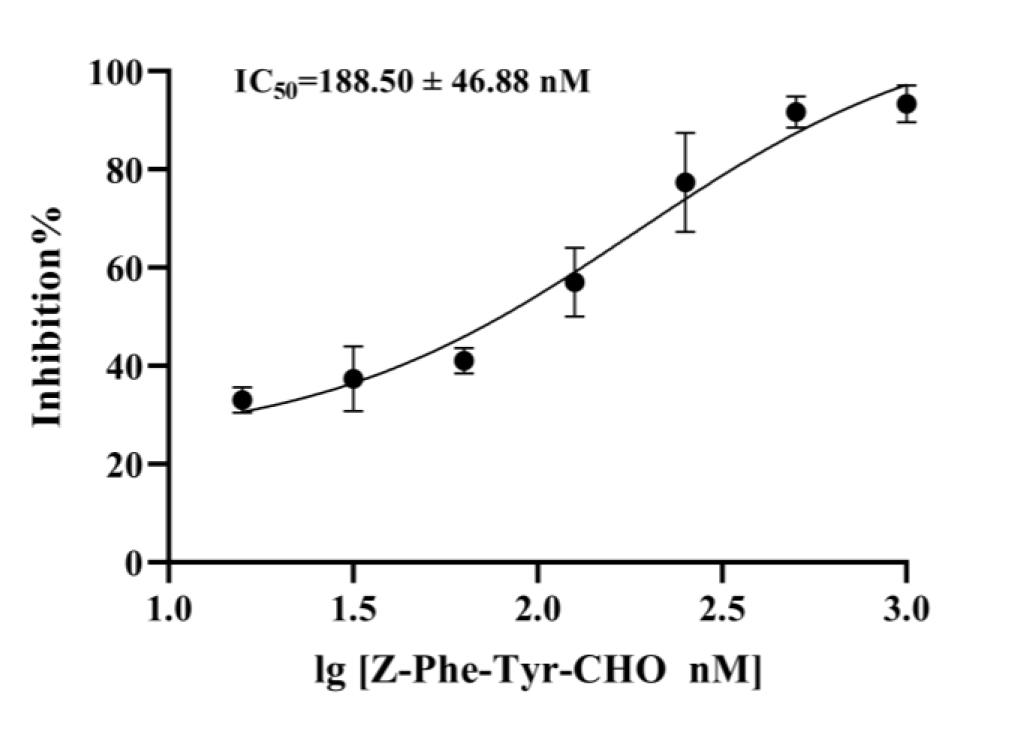
Figure 7. Inhibitory activity of Z-Phe-Tyr-CHO toward purified cathepsin L (CTSL) in fluorescence polarization (FP)-based assay. A total of 30 μL of 350 nM recombinant CTSL was pre-incubated with increasing concentrations of Z-Phe-Tyr-CHO (15.63–1000 nM) for 35 min at RT. Subsequently, 20 μL of 80 nM FP substrate was added and incubated for 20 min at RT. Reactions were terminated by adding 10 μL/well of avidin (320 nM), followed by a 5 min incubation. The inhibition curve was generated using GraphPad Prism 9.0 (nonlinear regression analysis). Negative controls (no inhibitor) and positive controls (no CTSL) were included. Data represent mean ± SEM of three independent experiments.
C. Determination of Z' factor (Z')
Z' is a statistical parameter used to evaluate the quality and robustness of high-throughput screening (HTS) assays. It assesses the separation between the positive control (signal window) and negative control (noise window), providing a measure of assay reliability and suitability for large-scale screening [11].
Z' = 1: Perfect assay (no overlap between controls).
0.5 < Z' < 1: Excellent assay (ideal for HTS).
0 < Z' ≤ 0.5: Marginal assay (may require optimization).
Z' ≤ 0: Poor assay (unacceptable for screening) [12].
1. Mix 29 μL/well of CTSL (350 nM) with 1 μL/well of either Z-Phe-Tyr-CHO (positive control, 1 μM) or DMSO (negative control), and incubate at RT for 35 min.
2. Add 20 μL of FP substrate (80 nM) and incubate at RT for 20 min.
3. Add 10 μL/well of avidin (320 nM) and incubate at RT for 5 min.
Note: Each plate contains three wells of positive control and three wells of negative control with pure DMSO.
4. Measure the mP value with a microplate reader (Figure 8) and calculate the Z' factor using the following equation:
μN and μP denote the mean values of mP readings for the negative and positive controls, respectively, while SDN and SDP represent the standard deviation values of mP readings for the negative and positive controls, respectively.
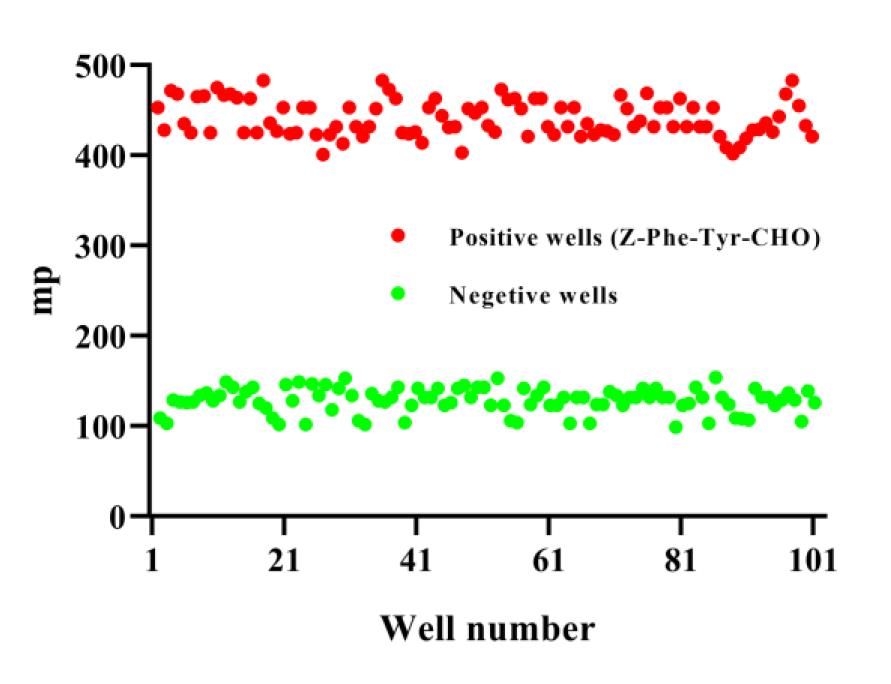
Figure 8. Quality assessment of the fluorescence polarization (FP)-based high-throughput screening (HTS). Assessment of Z' factor for the FP-based HTS. The experiment was performed in triplicate. Scatter plot generated using GraphPad Prism 9.0, depicting the measured parameter (mp) values across individual wells of a 96-well plate. The x-axis represents the well position identifiers; the y-axis represents the corresponding mp values for each well.
D. Primary screening of inhibitors targeting CTSL
1. Mix 29 μL of CTSL (350 nM) with 1 μL of tested compound (final concentration of 20 μg/mL) and incubate at RT for 35 min.
2. Add 20 μL of FP substrate (80 nM) and incubate at RT for 20 min.
3. Add 10 μL of avidin (320 nM) and incubate at RT for 5 min.
4. Measure the mP value with a microplate reader using an excitation wavelength of 485 nm and an emission wavelength of 535 nm and calculate the inhibition rate. The wells without inhibitors are used as negative controls, while the wells without CTSL are used as positive controls. Set three replicates for each concentration. Calculate the inhibition rate of CTSL inhibitors using the following formula:
mPHit, mPN, and mPP represent the mP values of the tested inhibitor, negative control, and positive control, respectively.
Notes:
1. Use fresh aliquots of avidin.
2. Experiments were performed in triplicate independently.
3. Compounds with CTSL inhibition rate greater than 50% at the concentration of 20 μg/mL are considered positives.
E. Determination of the positive compounds’ IC50s toward CTSL
1. Incubate the mixture of CTSL (350 nM, 29 μL/well) plus serial diluted positive compounds (1 μL/well) at concentration gradients of 1.56, 3.125, 6.25, 12.5, 25, 50, 100, and 200 μM.
2. Add 20 μL of FP substrate (80 nM) and incubate at RT for 20 min.
3. Add 10 μL of avidin (320 nM) and incubate at RT for 5 min.
4. Measure the mP values with a microplate reader using an excitation wavelength of 485 nm and an emission wavelength of 535 nm. Calculate the inhibition rates against different concentrations. Then, generate dose-response curves via nonlinear regression in GraphPad Prism 9.0 to calculate IC50 values of the inhibitors toward CTSL, plotting loginhibitor vs. normalized inhibition rates.
Data analysis
1. Plotting of a standard curve of fluorescent signal vs. AMC concentration by GraphPad Prism 9.0
Record fluorescence signal values (in relative fluorescence units, RFU) for each concentration. Plot ΔRFU value (ΔRFU = RFUAMC - RFU0) (y-axis) against AMC concentration (x-axis, in pmol) using GraphPad Prism 9.0. RFUAMC denotes the fluorescence value of AMC at each concentration; RFU0 represents the fluorescence signal value of the buffer.
Curve fitting and validation: Apply linear regression analysis to determine the best-fit line (equation: y = mx, where m = slope). Validate linearity using the coefficient of determination (R2 ≥ 0.98) [11] and ensure the dynamic range covers the expected experimental sample concentrations [13].
2. Assessment of the recombinant CTSL’s catalytic activity by GraphPad Prism 9.0
Monitor substrate conversion in real-time using a microplate reader. Ensure measurements are within the linear reaction phase (initial velocity conditions). Then, calculate enzyme activity (U) and specific activity (U/mg) using the following formula:
ΔFluorescence/min is derived from linear fitting of the time-dependent RFU curve for 128 nM CTSL with 10 μM substrate.
U denotes the enzyme activity unit, which is defined as the amount of enzyme required to catalyze the conversion of 1 pmol of substrate per minute under specified assay conditions. mg is the total mass of protein in the sample, typically determined by the following formula [14]:
Total protein amount = Final concentration of protein in reaction system × Volume of protein in the reaction system × Molecular weight of protein
3. Determination of the positive compounds’ IC50 toward CTSL by GraphPad Prism 9.0
The wells without inhibitors are used as negative controls, while the wells without CTSL are used as positive controls. Set three replicates for each concentration. Calculate the inhibition rate of CTSL inhibitors using the following formula:
mPHit, mPN, and mPP represent the mP values of the tested inhibitor, negative control, and positive control, respectively.
Dose-response curves are generated via nonlinear regression in GraphPad Prism 9.0 to calculate the IC50 value of the inhibitor against CTSL, plotting loginhibitor vs. corresponding normalized inhibition rate [15].
4. Determination of FP-based assay’s Z' factor
The Z' factor is a statistical metric used to evaluate the robustness and suitability of HTS assays by quantifying the separation between positive (signal) and negative (noise) control populations. Z-Phe-Tyr-CHO was set as the positive control with DMSO as the negative control. Calculate the Z' factor using the following formula:
μN and μP denote the mean values of mP readings for the negative and positive controls, respectively, while SDN and SDP represent the standard deviation values of mP readings for the negative and positive controls, respectively [11].
Validation of protocol
This protocol, or parts of it, has been used and validated in the following research articles:
• Zhou et al. [16]. Establishment, optimization and validation of a fluorescence polarization-based high-throughput screening assay targeting cathepsin L inhibitors (Figures 2, 4, 5, and 6).
• Zhou et al. [17]. Expression, purification, and biological activity evaluation of cathepsin L in mammalian cells (Figures 7 and 8).
General notes and troubleshooting
1. Avoid bubbles during sample loading. Gently pipette along the well wall or tap the plate post-loading to dislodge bubbles.
2. We strongly recommend the preparation of fresh FP buffer immediately prior to application.
3. Substrate and avidin should be freshly reconstituted to working concentration immediately before use and stored protected from light at -20 °C.
4. During incubation, it is better to cover the plate with a lid or sealing film to prevent evaporation and contamination.
5. In order to minimize background fluorescence and light scattering, make sure to use black-walled, half-bottom 96-well plates for the FP-based assay.
6. Confirm that the 5-min post-avidin incubation is sufficient to stabilize the signal without over-quenching fluorescence.
7. Use identical gain settings of the microplate reader across all plates to ensure comparability.
8. Randomize sample placement to mitigate plate edge effects (e.g., evaporation differences in outer wells).
9. The final yield of purified CTSL was 2 mg/L/culture medium. The purified CTSL obtained from 1 L of culture medium is sufficient for approximately 7,265 individual compound screenings in a high-throughput assay format. Based on a standard 96-well plate design, this quantity equates to roughly 75 full-plate screening assays. Therefore, an adequate number of culture plates should be prepared in accordance with the anticipated scale of the HTS assay.
Acknowledgments
This work was supported by the Chinese Academy of Medical Sciences (CAMS) Innovation Fund for Medical Sciences (CIFMS) (no. 2021-I2M-1-054). This protocol was used in [16].
Competing interests
The authors declare that they have no known competing financial interests or personal relationships that could have appeared to influence the work reported in this paper.
References
- Dou, D., Revol, R., Östbye, H., Wang, H. and Daniels, R. (2018). Influenza A Virus Cell Entry, Replication, Virion Assembly and Movement. Front Immunol. 9: e01581. https://doi.org/10.3389/fimmu.2018.01581
- Sudhan, D. R. and Siemann, D. W. (2015). Cathepsin L targeting in cancer treatment. Pharmacol Ther. 155: 105–116. https://doi.org/10.1016/j.pharmthera.2015.08.007
- Lankelma, J. M., Voorend, D. M., Barwari, T., Koetsveld, J., Van der Spek, A. H., De Porto, A. P., Van Rooijen, G. and Van Noorden, C. J. (2010). Cathepsin L, target in cancer treatment? Life Sci. 86: 225–233. https://doi.org/10.1016/j.lfs.2009.11.016
- Valdez, S., Robertson, M. and Qiang, Z. (2022). Fluorescence Resonance Energy Transfer Measurements in Polymer Science: A Review. Macromol Rapid Commun. 43(24): e202200421. https://doi.org/10.1002/marc.202200421
- Ries, J. and Schwille, P. (2012). Fluorescence correlation spectroscopy. BioEssays: news and reviews in molecular, cellular and developmental biology. 34(5): 361–368. https://doi.org/10.1002/bies.201100111
- Jameson, D. and Croney, J. (2003). Fluorescence Polarization: Past, Present and Future. Comb Chem High Throughput Screen. 6(3): 167–176. https://doi.org/10.2174/138620703106298347
- Hendrickson, O. D., Taranova, N. A., Zherdev, A. V., Dzantiev, B. B. and Eremin, S. A. (2020). Fluorescence Polarization-Based Bioassays: New Horizons. Sensors. 20(24): 7132. https://doi.org/10.3390/s20247132
- Hua, L., Wang, D., Wang, K., Wang, Y., Gu, J., Zhang, Q., You, Q. and Wang, L. (2023). Design of Tracers in Fluorescence Polarization Assay for Extensive Application in Small Molecule Drug Discovery. J Med Chem. 66(16): 10934–10958. https://doi.org/10.1021/acs.jmedchem.3c00881
- Ma, C., Liang, K., Tang, L., He, S., Liu, X., He, M. and Li, Y. (2019. Identification and characteristics of a cathepsin L-like cysteine protease from Clonorchis sinensis. Parasitol Res. 118(3): 829–835. https://doi.org/10.1007/s00436-019-06223-y
- Turk, V., Stoka, V., Vasiljeva, O., Renko, M., Sun, T., Turk, B. and Turk, D. (2012). Cysteine cathepsins: From structure, function and regulation to new frontiers. Biochimica et Biophysica Acta (BBA) - Proteins and Proteomic. 1824(1): 68–88. https://doi.org/10.1016/j.bbapap.2011.10.002
- Zhang, J. H., Chung, T. D. and Oldenburg, K. R. (1999). A Simple Statistical Parameter for Use in Evaluation and Validation of High Throughput Screening Assays. SLAS Discovery. 4(2): 67–73. https://doi.org/10.1177/108705719900400206
- Inglese, J., Auld, D. S., Jadhav, A., Johnson, R. L., Simeonov, A., Yasgar, A., Zheng, W. and Austin, C. P. (2006). Quantitative high-throughput screening: A titration-based approach that efficiently identifies biological activities in large chemical libraries. Proc Natl Acad Sci USA. 103(31): 11473–11478. https://doi.org/10.1073/pnas.0604348103
- Woods, A. K. and Storey, K. B. (2005). Effects of hibernation on multicatalytic proteinase complex in thirteen-lined ground squirrels, Spermophilus tridecemlineatus. Mol Cell Biochem. 271: 205–213. https://doi.org/10.1007/s11010-005-6341-5
- Colowick, S. P. and Kaplan, N. O. (Eds.). (1955–present). Methods in Enzymology. Academic Press. ISBN: 9780121819941.
- Copeland R. A. (2005). Evaluation of enzyme inhibitors in drug discovery. A guide for medicinal chemists and pharmacologists. Methods Biochem Anal. 46: 1–265.
- Zhou, W., You, B., Zhao, X., Si, S., Li, Y. and Zhang, J. (2024). Establishment, optimization and validation of a fluorescence polarization-based high-throughput screening assay targeting cathepsin L inhibitors. SLAS Discovery. 29(3): 100153. https://doi.org/10.1016/j.slasd.2024.100153
- Zhou, W., You, B., Zheng, Y., Si, S., Li, Y. and Zhang, J. (2024). Expression, purification, and biological activity evaluation of cathepsin L in mammalian cells. Biosci, Biotechnol, Biochem. 88(4): 405–411. https://doi.org/10.1093/bbb/zbae005
Article Information
Publication history
Received: Apr 10, 2025
Accepted: Jun 24, 2025
Available online: Jul 11, 2025
Published: Jul 20, 2025
Copyright
© 2025 The Author(s); This is an open access article under the CC BY-NC license (https://creativecommons.org/licenses/by-nc/4.0/).
How to cite
Guo, K., You, B., Zhou, W., Li, Y., Wang, Z., Zhang, J. and Si, S. (2025). Fluorescence Polarization-Based High-Throughput Screening Assay for Inhibitors Targeting Cathepsin L. Bio-protocol 15(14): e5400. DOI: 10.21769/BioProtoc.5400.
Category
Molecular Biology > Protein > Expression
Biochemistry > Protein > Isolation and purification
Biochemistry > Protein > Activity
Do you have any questions about this protocol?
Post your question to gather feedback from the community. We will also invite the authors of this article to respond.