- Protocols

- Articles and Issues
- For Authors
- About
- Become a Reviewer

Quantification of Neural Progenitor Cells From Zika Virus-Infected Zebrafish Embryos
Published: Vol 15, Iss 13, Jul 5, 2025 DOI: 10.21769/BioProtoc.5377 Views: 1918
Reviewed by: Ivonne SehringAnonymous reviewer(s)
Original research article
The authors used this protocol in:

Dec 2024
Advertisement


Protocol Collections
Comprehensive collections of detailed, peer-reviewed protocols focusing on specific topics


Related protocols
Abstract
Zika virus (ZIKV), an arthropod-borne orthoflavivirus, has emerged as a global health concern due to its ability to cause severe fetal neurological disorders, leading to the congenital Zika syndrome (CZS) in neonates. Vertical transmission during pregnancy can alter neural progenitor cell (NPC) proliferation and differentiation and induce apoptosis, leading to microcephaly and other neurodevelopmental abnormalities. While mammalian models have been used to study the impact of ZIKV on NPC behavior, limitations such as high costs, dedicated time, and ethical constraints have fostered the exploration of alternative systems. The zebrafish embryo constitutes an advantageous in vivo model for studying ZIKV neuropathogenesis. Indeed, ZIKV infection phenocopies several features of the CZS while sharing a conserved neuroanatomical layout and offering genetic plasticity and unique accessibility to the infected brain compared to mammals. Here, we describe a protocol for characterizing ZIKV-induced defects of NPCs in this zebrafish model, relying on whole animal flow cytometry.
Key features
• This protocol introduces a novel and straightforward zebrafish-based system for studying ZIKV-induced neuropathogenesis.
• The protocol employs an unbiased methodology for flow cytometry-based quantification of neural progenitor cells from whole embryos.
• This protocol can be transposed to any transgenic reporter zebrafish lines producing specific fluorescent cell populations.
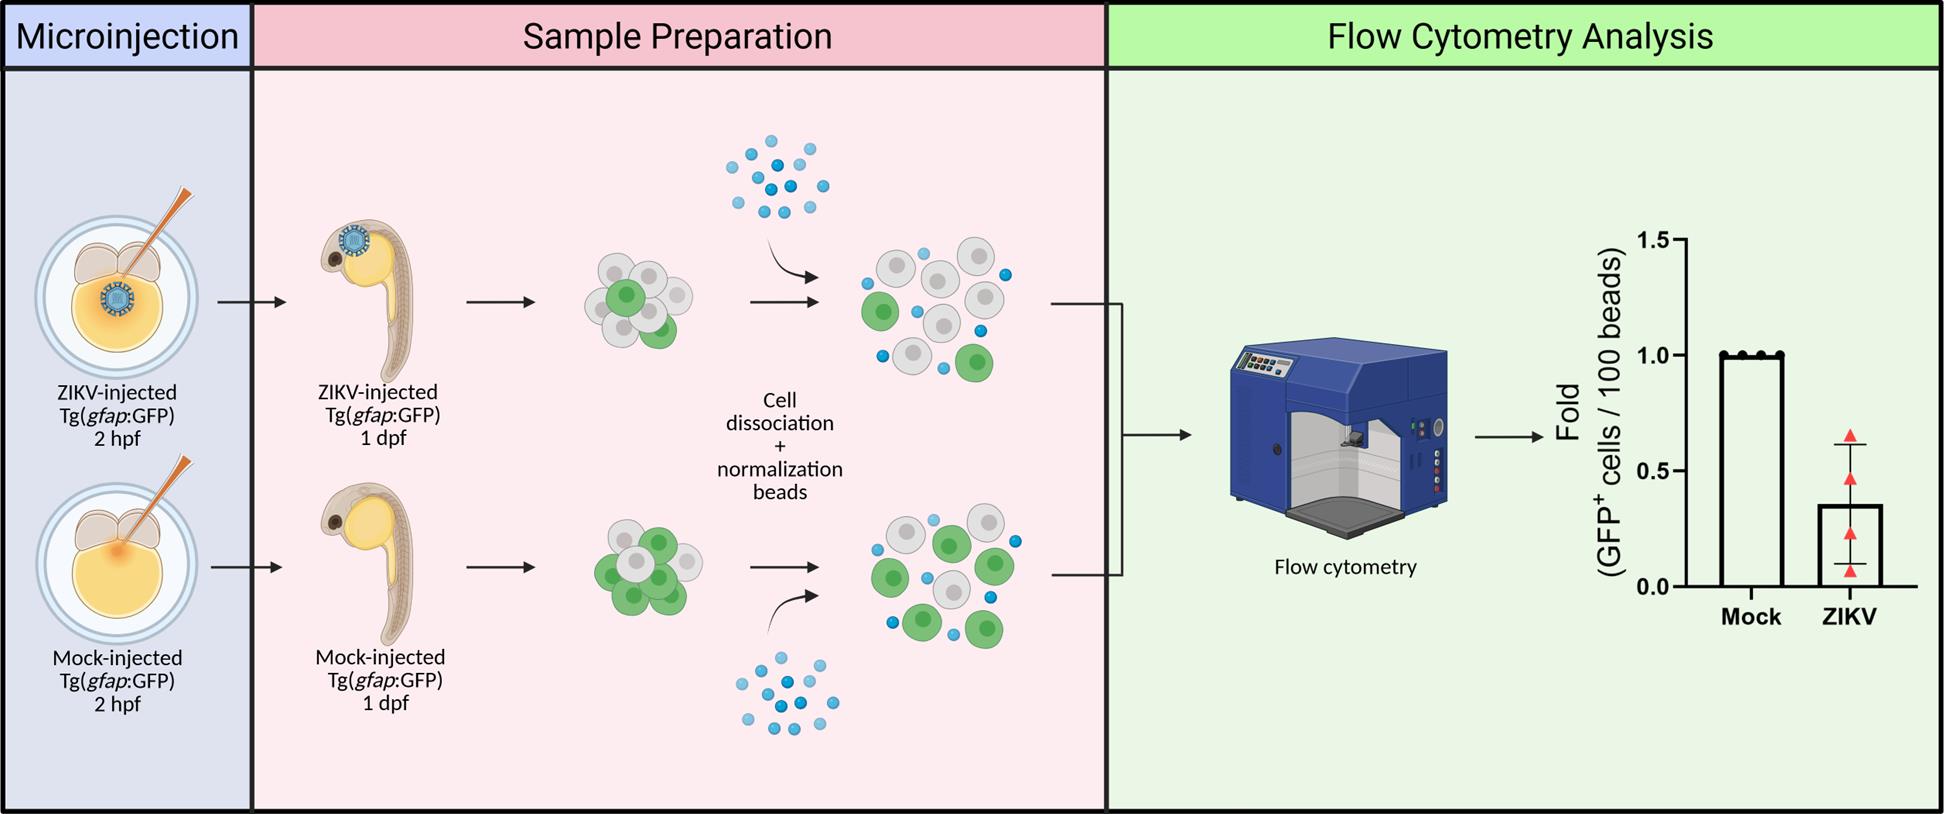
Keywords: ZebrafishGraphical overview
Background
Zika virus (ZIKV) is an arthropod-borne RNA virus belonging to the Orthoflavivirus genus. Public health concerns surrounding ZIKV infection arose during the massive outbreak of 2015–2016 in Brazil [1], since it was linked to severe neurological disorders in neonates—later termed congenital Zika syndrome (CZS)—that included microcephaly and were observed after vertical transmission in infected pregnant women [2,3].
Throughout gestation, ZIKV can cross the placental barrier, reach the developing fetal central nervous system, and target brain cells such as neural progenitor cells (NPCs) [4]. Studies using in vivo mouse models have notably shown that ZIKV infects NPCs, resulting in cell cycle arrest, premature differentiation, and cell death, which alter fetal neurodevelopment and thus likely contribute to microcephaly and more generally to the CZS [5,6].
Deepening into these cellular effects requires robust animal models to investigate NPC behavior. However, mammalian systems often present significant challenges due to major limitations such as costs, dedicated time, ethical considerations, difficulties in retrieving specific cell types within the brain, and limited genetic plasticity, potentially leading to embryonic lethality. On the other hand, the zebrafish has emerged as a powerful and cost-effective, easy-to-image, rapidly developing model for phenocopying and studying human neuropathological and viral diseases [7,8].
The larval zebrafish is ideally suited to examine brain neurodevelopment as it shares a basic neuroanatomical layout with that of mammals [9]. Zebrafish transgenic lines have demonstrated their utility in imaging, isolating, and characterizing specific neural populations, such as NPCs [Tg(gfap:GFP) and Tg(nestin:GFP)], neural crest cells [Tg(sox10:EGFP)], oligodendrocytes [Tg(olig2:EGFP) and Tg(mbp: EGFP)], post-mitotic neurons [Tg(elavl3:EGFP], and others [10]. By exploiting these advantages, our team has recently reported a novel zebrafish-based in vivo model of ZIKV neuropathogenesis [11]. In this system, zebrafish larvae injected with viral infectious particles exhibit developmental defects. ZIKV infection of NPCs in midbrain and forebrain cryosections correlates with a decrease in head size (i.e., microcephaly) and NPC abundance, as well as induction of apoptosis in the brain and NPC mislocalization, thus phenocopying the disease in humans and mice. NPC-focused analyses of immunolabeled brain cryosections were complemented by a fluorescence activated cell sorting (FACS)-based approach using Tg(gfap:GFP) and Tg(nestin:GFP) NPC reporter fish lines, which allows the quantification of the abundance of NPCs as well as their isolation from whole embryos for subsequent analysis such as bulk or single-cell mRNA sequencing [11]. Here, we provide a detailed description of the procedures for this unbiased NPC quantification in ZIKV-infected and control Tg(gfap:GFP) zebrafish embryos at one day post-fertilization.
Materials and reagents
Biological materials
1. Zebrafish (Danio rerio) lines: Tg(gfap:GFP) [12], expressing GFP under the gfap promoter; and parental wildtype TL
Note: Although this protocol utilizes only the Tg(gfap: GFP) line, it can also be applied, resulting in similar findings, with Tg(nestin: GFP) transgenic embryos, which express GFP under the nestin promoter and also exhibit fluorescent NPCs.
2. Zika virus (ZIKV) strain H/PF/2013 (European Virus Archive Global, catalog number: 001v-EVA1545) (stocks produced and titered in VeroE6 cells according to the procedure described in our previous Bio-protocol article by Freppel et al. [13]).
Reagents
1. Dulbecco’s modified Eagle medium (DMEM) (Fisher Scientific, catalog number: 11965118)
2. Fetal bovine serum (FBS) performance (Wisent, catalog number: 098150)
3. Penicillin-streptomycin (Life Technologies, catalog number: 15140-122)
4. MEM non-essential amino acids solution (100×) (Life Technologies, catalog number: 11140-050)
5. Milli-Q water
6. Phosphate-buffered saline (PBS) (Fisher Scientific, catalog number: AAJ67653AP, stored at 4 °C)
7. Mineral oil (MilliporeSigma, catalog number: M8410)
8. CaCl2 (MilliporeSigma, catalog number: C4901)
9. MgCl2 (MilliporeSigma, catalog number: 208337)
10. NaCl (Fischer Scientific, catalog number: S271-3)
11. KCl (Fischer Scientific, catalog number: BP366-500)
12. NaHCO3 (MilliporeSigma, catalog number: S5761)
13. NaOH (Fischer Scientific, catalog number: S318-1)
14. FACSmax cell dissociation solution (AMSBIO, catalog number: T200100, aliquoted and stored at -20 °C)
15. 123count eBeads counting beads (Fisher Scientific, catalog number: 501129030, stored at 4 °C in the dark)
16. Formaldehyde (FA) solution 37% (MilliporeSigma, catalog number: F8775)
Solutions
1. 60× E3 medium (see Recipes)
2. Deyolking buffer (see Recipes)
3. 4% FA/PBS (see Recipes)
4. Complete DMEM (see Recipes)
Recipes
1. 60× E3 medium
Prepare 2 L of E3 stock solution 60× (pH 7.2), autoclave, and store at 4 °C for a maximum period of 6 months. Then, prepare 1× E3 medium by diluting the stock solution in Milli-Q water and store at room temperature.
| Reagent | Final concentration | Quantity or volume |
|---|---|---|
| MgCl2 | 51.36 mM | 9.78 g |
| CaCl2 | 26.13 mM | 5.8 g |
| NaCl | 297.74 mM | 34.8 g |
| KCl | 10.73 mM | 1.6 g |
| Milli-Q water | n/a | Up to 2 L |
| Total | n/a | 2 L |
2. Deyolking buffer
Prepare 100 mL of deyolking buffer and store at 4 °C for a maximum period of 6 months.
| Reagent | Final concentration | Volume |
|---|---|---|
| NaCl 4 M | 55 mM | 1,375 µL |
| KCl 1 M | 1.8 mM | 180 µL |
| NaHCO3 0.5 M | 1.25 mM | 250 µL |
| Milli-Q water | n/a | Up to 100 mL |
| Total | n/a | 100 mL |
3. 4% FA/PBS
Prepare 100 mL of 4% FA/PBS solution, aliquot, and store at -20 °C until use for a maximum period of 2 years.
| Reagent | Final concentration | Volume |
|---|---|---|
| Formaldehyde 37% | 4% | 10.8 mL |
| PBS | n/a | Up to 100 mL |
| Total | n/a | 100 mL |
4. Complete DMEM
Prepare 500 mL of complete DMEM, aliquot, and store at -80 °C for a maximum period of 3 years (although storage time is not expected to alter this solution).
| Reagent | Final concentration | Volume |
|---|---|---|
| DMEM | n/a | 440 mL |
| FBS | 10% | 50 mL |
| Penicillin-streptomycin | 100 U/mL–100 mg/mL (1%) | 5 mL |
| MEM non-essential amino acids | 1% | 5 mL |
| Total | n/a | 500 mL |
Laboratory supplies
1. Plastic transfer pipettes (Fisher Scientific, catalog number: 137117MMD)
2. 2–20 µL pipette (Avantor, catalog number: 613-5260)
3. Pipette tips (Vertex, catalog number: 4117NSF)
4. Borosilicate glass, 1.0 mm × 0.5 mm × 10 cm, with filament (Sutter Instrument, catalog number: BF100-50-10)
5. Microloader tips (Eppendorf, catalog number: 930001007)
6. 0.01 mm microscope stage calibration slide (AmScope, catalog number: MR095)
7. Glass microscopy slides (Ultident, catalog number: 170-8105-W+)
8. 10 cm Petri dishes (Falcon, catalog number: 353003)
9. 6-well plates (Corning, catalog number: 3506)
10. Cell strainers (Falcon, catalog number: C352350)
11. Syringes (BD, catalog number: 309628)
12. Falcon tubes (Falcon, catalog number: 352098)
13. Forceps (Fine Science Tools, catalog number: 11252-00)
14. Flow cytometry tubes (Falcon, catalog number: 352008)
Equipment
1. Breeding tank (Tecniplast, catalog numbers: ZB10BTE, ZB10BTI, ZB10BTD, ZB10BTL)
2. Micropipette puller (Sutter Instrument, model: P-97)
3. Stereomicroscope (Zeiss, model: Stemi 305)
4. Microinjector (Eppendorf, model: FemtoJet 4i)
5. Incubator (Boekel Scientific, model: 131400)
6. Vortex mixer (Fisherbrand, model: Analog Vortex Mixer)
7. Centrifuge (Thermo Scientific, model: Sorvall ST 16R)
8. Flow cytometer (BD, model: LSRFortessa Cell Analyzer, model: 647794L6)
Software and datasets
1. FlowJo version 10.8.1 (BD Life Sciences)
2. GraphPad Prism version 10.0.0 (Dotmatics)
Procedure
A. Capillary needle preparation
Prior to the day of microinjection, prepare the capillary needles used for microinjection.
1. Set the program on the Sutter micropipette puller as follows: pressure = 500; heat = 580; pull = 110; velocity = 85; and time = 100.
2. Open the protection glass of the micropipette puller and load the borosilicate glass with filament (1.0 mm × 0.5 mm × 10 cm) into one of the puller bar branches. Pass it through the box filament to finally bind it at the opposite branch of the puller bar.
3. Lower the protection glass and wait for the borosilicate glass to be heated and cleaved inside the box filament into two needles. Store the needles at room temperature for later microinjection use.
B. Zebrafish mating
Note: Adult zebrafish (Danio rerio) were maintained at 28 °C on a 12/12 light/dark cycle in a recirculating aquatic system at our institutional facility. Males and females were housed in separate tanks.
1. One day prior to microinjection, set up a 1 L breeding tank consisting of an upper and lower chamber for breeding and embryo collection, respectively, along with a separator.
2. Four hours before the end of the light period, fill the tank with the system water and transfer two males and two females to opposite sides of the separator.
a. Transgenic fish Tg(gfap:GFP) and non-transgenic (wild type, wt) are mated among themselves. No crosses are performed between transgenic and wild-type lines.
b. Wt embryos will be required for setting the thresholding parameters later in flow cytometry, specifically for identifying GFP-positive (GFP+) cells.
c. Additional fish pairs can be placed in separate breeding tanks to increase egg yield when needed.
3. In the following morning, shortly after the onset of the light cycle, remove the separator to allow spawning and fertilization. The eggs will move to the lower chamber by gravity, preventing access by adult fish.
4. After approximately 1 h, return the adult fish to the main system and remove the upper chamber.
5. Collect the eggs from the bottom of the lower chamber and transfer them directly to a Petri dish containing 1× E3 solution. Store the dish in an incubator at 28 °C until the 2–4 cell stage is observed under a stereomicroscope (within 2 h post-fertilization).
C. Zebrafish embryo microinjection
Notes:
1. To perform this protocol involving risk group 2-belonging ZIKV, users must have obtained prior approval from their institutional biosafety committee and a proper biosafety certificate according to national guidelines and regulations. In addition, the use of zebrafish embryos must be approved by the local institutional ethics committee. All manipulations of viral particles and infected animals must be performed in a biosafety level 2 environment.
2. In this protocol, we describe our long-standing approach for microinjection, utilizing a microscope slide in a Petri dish (open trough). However, alternative microinjection methods may also be suitable (e.g., using agarose molds).
1. Prepare for microinjection.
a. To adjust the injection volume, add a drop of mineral oil onto the center of the 0.01 mm microscope stage calibration slide using a plastic transfer pipette and place it under the stereomicroscope. The mineral oil stabilizes the injected bolus in a sphere shape, ensuring an accurate measurement.
b. Using microloader tips, load 3 µL of ZIKV suspension [at an infectious titer of ~5 × 10⁷ plaque-forming units (PFU)/mL] or complete DMEM (for infected or mock condition, respectively) to the capillary needle and assemble it in the capillary holder from the microinjector.
c. Calibrate the injection system to dispense a volume of 2 nL. Using forceps, trim the tip of the capillary needle to obtain an angled opening. Carefully release a drop of the liquid into the mineral oil, positioned over the 0.01 mm microscope stage calibration slide. Adjust the injection pressure until the drop achieves a diameter of 0.15 mm.
2. Microinject zebrafish embryos.
a. Position a glass slide inside the lid of a 10 cm Petri dish. Using a plastic transfer pipette, align a row of 20–30 zebrafish embryos at the 2–4 cell stage along the edge of the slide (Figure 1). This stage is typically reached within 2 h post-fertilization. The timing of injection was selected to model infection during early pregnancy, a critical period for neurodevelopment.
Note: To prevent drying, the number of embryos in the row may vary based on the time required to inject them all. Ideally, this process should not take longer than 15 min.
b. Place the Petri dish lid containing the glass slide and embryos in the stereomicroscope. Inject 2 nL of ZIKV suspension (~100 PFU in total injection volume) or DMEM into the yolk, right beneath the 2–4 cell layer (Video 1, Figure 2). Carefully guide the needle to pass through the 2–4 cell layer to ensure accurate delivery. Alternatively, the injection can be performed by inserting the needle on the side of the embryo, between the yolk and the cell layer.
Note: Ideally, viral titers should be at 107 PFU/mL or higher to allow optimal injection concentration. This study makes use of viral stocks produced by amplification in Vero E6 cells during 3–6 days exactly as we have previously described [13]. Collected virus-containing medium was filtered at 0.45 µm, aliquoted, and stored at -80 °C. Virus titers are determined by plaque assays.
c. Once all embryos have been injected, transfer them to a Petri dish containing 1× E3 medium. Incubate the Petri dish at 28 °C.
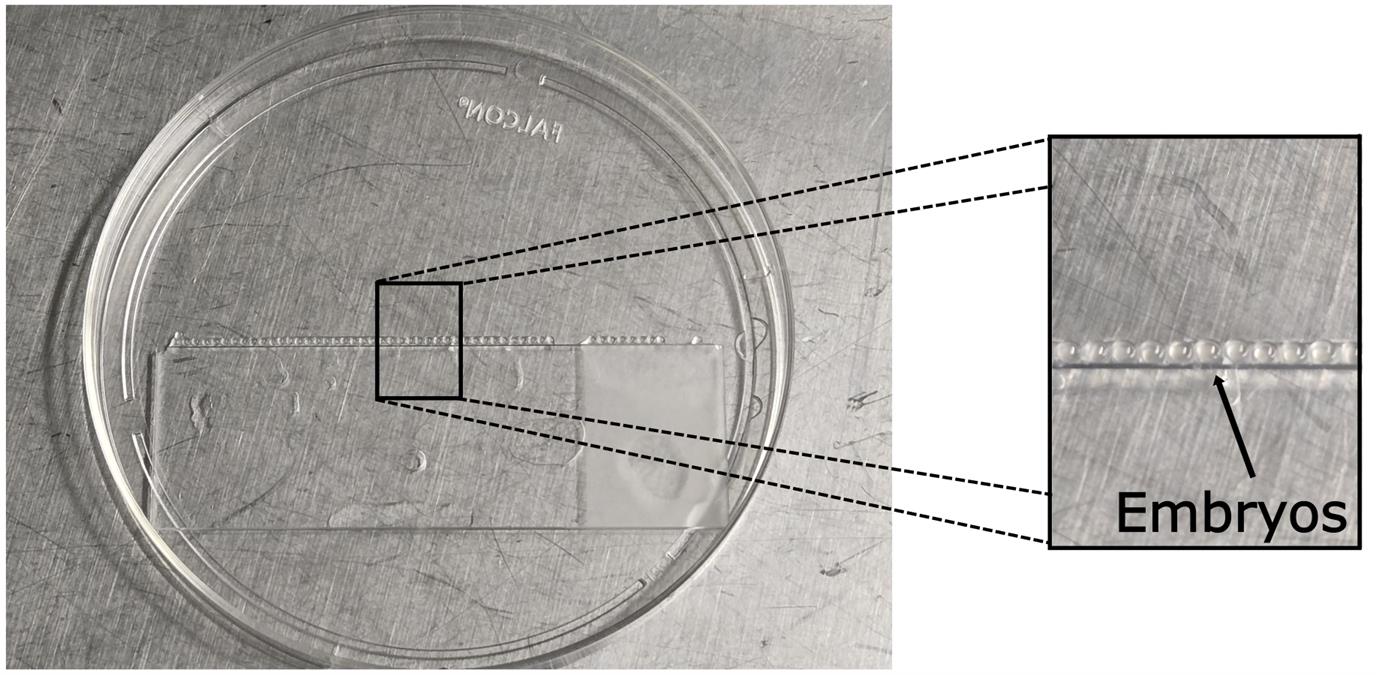
Figure 1. Zebrafish embryos lined up in a Petri dish. Zebrafish embryos are positioned on the edge of a glass slide placed in a Petri dish lid. The arrow indicates the lined embryos on the edge of the glass slide.
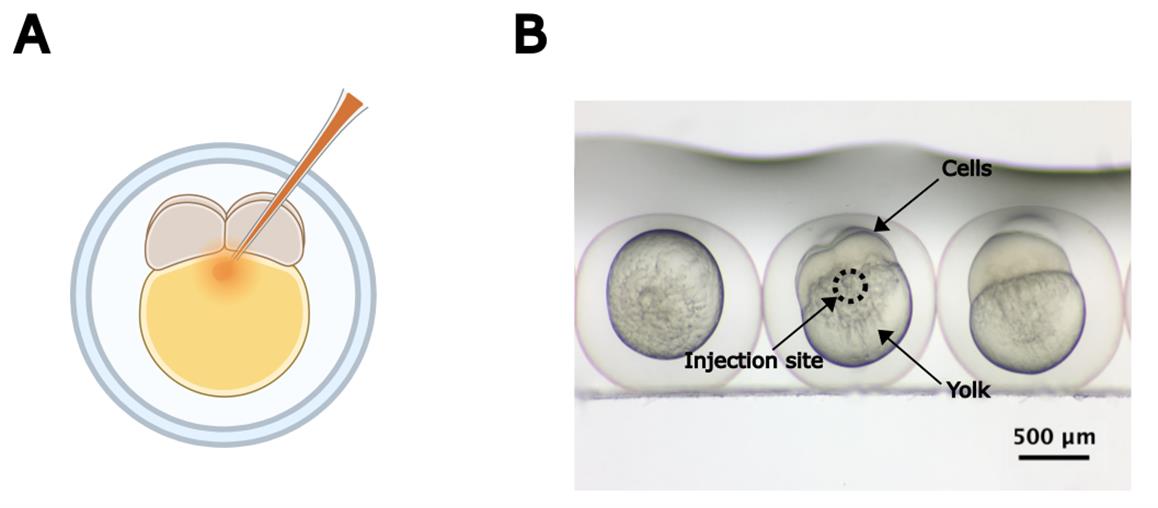
Figure 2. Microinjecting zebrafish embryos. (A) Graphical representation of the optimal microinjection site for fluid dispensing in 1–4-cell-stage zebrafish embryos. Created in BioRender.com. (B) Real image of 4-cell-stage zebrafish embryos. The circle indicates the optimal injection site.

3. Repeat step C2 until the desired number of embryos is injected.
4. Approximately 4 h after injection, remove any dead embryos or unfertilized eggs and replace the 1× E3 medium. Incubate at 28 °C. At this stage, namely the transition from blastula to gastrula, it is expected to observe numerous cells within fertilized zebrafish embryos (Figure S1A), whereas non-developing/unfertilized embryos (Figure S1B) either remain at the single-cell stage or evolve to death (dark-colored egg when observed under the stereomicroscope).
D. Sample preparation
1. At 24 h post-injection, place the Petri dish in the stereomicroscope and remove the dead embryos. In parallel, place the PBS, deyolking solution, and FACSmax solutions on ice.
Note: If necessary, because of Tg(gfap: GFP) heterozygosity, screen the embryos before proceeding using a fluorescent stereomicroscope. Select only the animals that emit green fluorescence (GFP+) (Figure S2) for further analysis and discard the non-fluorescent ones.
2. Classify the observed ZIKV-induced embryo phenotypes for subsequent parallel processing as independent groups. Typically, zebrafish embryo phenotypes are classified into three categories: normal, mild, and severe. Mild defects include reduced head area, shortened tail, and pericardial edema, while severe phenotypes are characterized by an undeveloped tail, severe edema, and/or an aberrant ovoid morphology.
Note: See further explanation in the Data analysis section and in our recently published study [11].
3. Gently remove the chorion of the embryos using two forceps.
4. Deyolk the embryos.
a. Pool 15 embryos per condition per above-mentioned morphological phenotypes and transfer them into 1.5 mL microtubes placed on ice using plastic transfer pipettes. Afterward, remove the excess liquid.
Note: If a different number of embryos should be used, ensure that it remains the same (usually 15–25) across conditions.
b. Rinse with 500 µL of deyolking buffer. Discard the deyolking buffer afterward.
c. Add 800 µL of deyolking buffer + 10 µL of 123count eBeads and gently mix by pipetting up and down until the yolk is dissolved. 123count eBeads are fluorescent microparticles, emitting between 500 and 750 nm. They enable absolute cell quantification in flow cytometry by providing a known reference concentration for ratiometric analysis and thus, normalization.
d. Centrifuge at 500× g for 1 min at 4 °C and discard the supernatant.
5. Dissociate cells.
a. Rinse the embryos with 500 µL of FACSmax solution.
b. Centrifuge at 500× g for 1 min at 4 °C and discard the supernatant.
c. Resuspend the embryos in 1 mL of FACSmax solution; then, transfer them to a 6-well plate.
d. Incubate the plate containing the embryos at 28 °C for approximately 30 min or until cells are fully dissociated. During incubation, gently mix the sample with a transfer pipette every 5 min.
Note: While performing pipette mixing, tilt the 6-well plate and dispense the solution into the area of the well without liquid to ensure optimal cell dissociation.
e. Once cells are dissociated, transfer the content to a new 1.5 mL microtube placed on ice and centrifuge at 1,200× g for 1 min at 4 °C. While centrifuging, add 1 mL of cold PBS to each well of the plate and briefly mix to collect residual cells.
f. After centrifugation, put the 1.5 mL microtubes containing the cell pellet on ice. Discard the supernatant and resuspend the pellet with the 1 mL of cold PBS collected from the respective wells. Centrifuge again at 1,200× g for 1 min at 4 °C. Put the 1.5 mL microtubes on ice and discard the supernatant.
g. Resuspend the cell pellet in 400 µL of 4% FA/PBS and incubate on ice for 10 min.
h. During the fixation process (step D5g), rinse the cell strainer with 4% FA/PBS. For that, place the cell strainer on the lid of a Petri dish and add 500 mL of 4% FA/PBS on top of it.
i. Following the incubation period, position the cell strainer within a 50 mL Falcon tube on ice. Transfer the fixed cell suspension into the Falcon tube by passing it through the cell strainer.
Note: To dissociate clumps and minimize cell loss, gently rub the cell strainer with a flat syringe plunger.
j. Centrifuge at 500× g for 4 min at 4 °C and transfer the entire content to flow cytometry tubes. Keep the samples on ice.
E. NPC counting via flow cytometry
1. Load the sample from the age-matched wildtype (i.e., GFP-negative) embryos into the LSRFortessa injection chamber and start the measurement.
2. Set up the LSRFortessa software workspace to display a plot featuring forward scatter (FSC) and side scatter (SSD). After, add a second plot containing FSC and GFP.
3. Adjust FSC, SSD, and GFP laser voltage. Modify the voltage so that the populations are not off scale while maintaining sufficient resolution for clear discrimination. Typically, events should fall within the 0 and 105 range.
4. Exclude potential debris by gating total events using FSC-A (area) vs. SSC-A (area) scatter plot (Figure 3A).
5. Gate 123count eBeads (Figure 3A).
Note: The beads are denser and smaller than NPCs, resulting in higher SSD and lower FSC values, thereby forming a clearly defined cluster.
6. Exclude potential multiplets on FSC-H (height) vs. FSC-A scatter plot by gating singlets (Figure 3B).
7. To distinguish the neural progenitor cells in the Tg(gfap:GFP) embryos, set the GFP+ threshold by identifying the GFP- population from the wt control (Figure 3C).
8. Once the threshold is settled, load samples from Tg(gfap:GFP) embryos and start the measurement.
9. Export the event counting table for further analysis in GraphPad or other relevant software.
10. Proceed to data analysis.
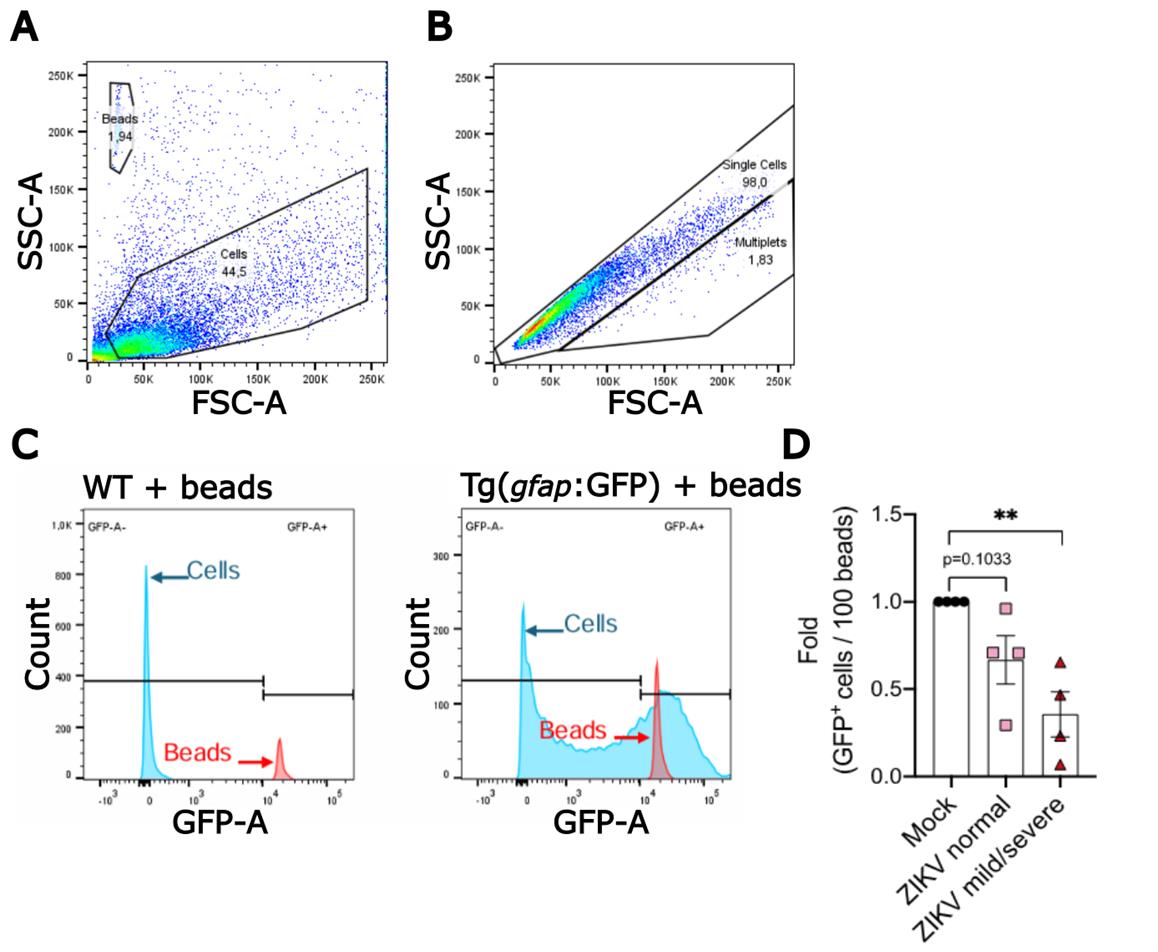
Figure 3. Gating and thresholding strategy for identifying GFP+ cells of Tg(gfap:GFP) zebrafish dissociated cells in flow cytometry. (A) Forward scatter (FSC)-A (area) vs. side scatter (SSC)-A (area) values plotted as a scatter plot to gate 123count eBeads and cells. (B) Scatter plot of FSC-H (height) vs. FSC-A to gate single-cell events to exclude potential multiplets. (C) Histogram of event counts for cell and bead gates vs. GFP-A from wild-type age-matched and Tg(gfap:GFP) zebrafish embryo samples for setting GFP+ threshold. (D) Relative quantification of neural progenitor cells (i.e., GFP+ cells) of mock- and ZIKV-injected embryos. ZIKV-injected embryos were grouped based on the severity of virus-induced morphological phenotypes as previously described [11]. Data points (normalized cell counts from pools of 15 embryos) represent independent infection experiments; bars represent the standard error of the mean. Statistical significance was calculated using one-way ANOVA (**p-value ≤ 0.01).
Data analysis
The gating strategy of flow cytometry data is analyzed with FlowJo software (version 10.8.1). The resulting event counting tables were exported into GraphPad Prism (v. 10.0.0) for further statistical analysis and plotting. GFP+ cells were normalized using the signal of fluorescent 123count eBeads as a reference. Normalization is necessary as it accounts for variations occurring during the dissociation process and filtration through strainers, therefore displaying a more accurate cell count. The applied formula is as follows:
An example of a typical analysis is shown in Figure 3D (retrieved from Sow et al. [11]). The embryos were stratified considering the following phenotypes: (i) normal, with no observed defect; (ii) mild, displaying intermediate defects such as mild pericardial edema and tail malformation, as well as small head; and (iii) severe, showing extreme pericardial edema and body aberration. Data normality and statistical significance were determined with the D’Agostino and Pearson test and one-way ANOVA, respectively. The computed value represents the abundance of NPCs relative to an equivalent quantity of dissociated material derived from the same number of animals. Typically, ZIKV infection results in a depletion of NPCs in embryos at one day post-fertilization/infection, which is marked in animals with mild/severe morphological defects (40%–90% decrease [11]).
Validation of protocol
This protocol or parts of it has been used and validated in the following research article(s):
• Sow et al. [11]. A zebrafish-based in vivo model of Zika virus infection unveils alterations of the glutamatergic neuronal development and NS4A as a key viral determinant of neuropathogenesis. PLOS Pathogens (Figures 4B and S4C).
Based on four independent infection experiments, the NPC depletion phenotype is highly reproducible and statistically significant for animals with severe morphological defects (p-value ≤ 0.01; one-way ANOVA).
General notes and troubleshooting
General notes
1. If additional time is needed to prepare before microinjection (step C2), recently collected embryos can be maintained at room temperature rather than in the incubator to slow down cell division.
2. GFP+ embryos should be screened after 24 h, when fluorescence becomes more intense and easily detectable because of the high abundance of NPCs at this time point.
3. During deyolked embryo incubation in FACSmax, the pipette mixing should follow the instructions as noted in step D5d: tilt the 6-well plate, aspirate the FACSmax solution containing embryos, and gently dispense the contents onto the “dry” upper portion of the well. It is essential to mix gently and steadily, thus avoiding disruption of cell integrity. This approach enhances mechanical dissociation, improving cell separation for optimal analysis while minimizing the occurrence of multiplets and reducing the risk of clogging during cell sorting.
4. During the deyolking and dissociation steps (D4 and D5), ensure that the embryos do not adhere to the pipette tips, as this can significantly alter the results.
Troubleshooting
Problem 1: Difficulty distinguishing debris or dead cells from viable cells.
Possible cause: The cell dissociation step may have been too harsh, affecting cell integrity.
Solution: To minimize these issues, gently pipette during the dissociation step and consider reducing the centrifugation speed to 500–800× g while extending the time to 5–7 min. Additionally, incorporating a fluorescent viability sensor into the protocol (e.g., PI, DAPI, or live-or-dye fixable staining) can help discriminate viable cells from dead cells in FACS analysis.
Problem 2: Embryos are not dissociated efficiently.
Possible cause: Excessive number of embryos relative to the volume of FACSmax used during dissociation.
Solution: Increase the volume of FACSmax according to the number of embryos to maximize dissociation.
Problem 3: Cells are clumped.
Possible cause: Incomplete dissociation or cell/debris aggregates.
Solution: Pass the cell suspension through a cell strainer immediately before flow cytometry to remove clumps and ensure a single-cell suspension.
Supplementary information
The following supporting information can be downloaded here:
1. Figure S1. Zebrafish embryos 5 h post-fertilization
2. Figure S2. GFP+ one day post-fertilization zebrafish embryo
Acknowledgments
We would like to express our gratitude to Charlotte Zaouter for her precious contributions to zebrafish care and maintenance. We are also grateful for Jessy Tremblay’s valuable assistance at the Confocal and Microscopy and Flow Cytometry Facility of the Armand-Frappier Santé Biotechnologie Center. We extend our thanks to European Virus Archive Global (EVAg) and Dr. Xavier de Lamballerie (Emergence des Pathologies Virales, Aix-Marseille University, France) for providing the ZIKV original stock. Our work on zebrafish and ZIKV was supported by the Canada Foundation for Innovation (CFI; #37512, to S.P.; https://www.innovation.ca/), by the Canadian Institutes for Health Research (CIHR; PJT 190064 to L.C.C. and S.P., and PJT 177940 to S.P.; https://cihr-irsc.gc.ca/), by an Acceleration grant from the Centre d'Excellence en Recherche sur les Maladies Orphelines – Fondation Courtois (CERMO-FC; https://www.cermofc.uqam.ca/) to S.P. and L.C.C., and by a Azrieli Future Leader in Canadian Brain Research grant from Brain Canada Foundation (https://braincanada.ca/fr/) through the Canada Brain Research Fund, with the financial support of Health Canada and the Azrieli Foundation awarded to L.C.C. A.A.S. has received PhD fellowships from the Fonds de Recherche du Québec-Nature et Technologies (FRQNT; https://frq.gouv.qc.ca/nature-et-technologies/), the Armand-Frappier Foundation (https://fondationafrappier.ca/), and the CERMO-FC. L.C.C. is receiving a research scholar (Senior) salary support from Fonds de Recherche du Québec-Santé (FRQS; https://frq.gouv.qc.ca/sante/). S.P. holds an FRQS Junior 2 research scholar salary award and the Anna Sforza Djoukhadjian Research Chair. This protocol was used in [11]. Finally, we would like to highlight that figures used in the graphical abstract and Figure 2A were created using BioRender.com (agreement number: MW28CWA0HD).
Competing interests
The authors declare no competing or financial interests.
Ethical considerations
All the experiments were performed in compliance with the guidelines of the Canadian Council Animal Care and under the approval of the institutional ethics committee (“Comité institutionnel de protection des animaux” CIPA; certificate number: #2005-01) and biosafety committee (“Comité de biosécurité”; certificate number: #2016-12) of Institut National de la Recherche Scientifique.
References
- Mittal, R., Nguyen, D., Debs, L. H., Patel, A. P., Liu, G., Jhaveri, V. M., S. Kay, S. I., Mittal, J., Bandstra, E. S., Younis, R. T., et al. (2017). Zika Virus: An Emerging Global Health Threat. Front Cell Infect Microbiol. 7: e00486. https://doi.org/10.3389/fcimb.2017.00486
- Honein, M. A., Dawson, A. L., Petersen, E. E., Jones, A. M., Lee, E. H., Yazdy, M. M., Ahmad, N., Macdonald, J., Evert, N., Bingham, A., et al. (2017). Birth Defects Among Fetuses and Infants of US Women With Evidence of Possible Zika Virus Infection During Pregnancy. JAMA. 317(1): 59–68. https://doi.org/10.1001/jama.2016.19006
- Calvet, G., Aguiar, R. S., Melo, A. S. O., Sampaio, S. A., de Filippis, I., Fabri, A., Araujo, E. S. M., de Sequeira, P. C., de Mendonça, M. C. L., de Oliveira, L., et al. (2016). Detection and sequencing of Zika virus from amniotic fluid of fetuses with microcephaly in Brazil: a case study. Lancet Infect Dis. 16(6): 653–660. https://doi.org/10.1016/s1473-3099(16)00095-5
- Li, H., Saucedo-Cuevas, L., Shresta, S. and Gleeson, J. G. (2016). The Neurobiology of Zika Virus. Neuron. 92(5): 949–958. https://doi.org/10.1016/j.neuron.2016.11.031
- Cugola, F. R., Fernandes, I. R., Russo, F. B., Freitas, B. C., Dias, J. L. M., Guimarães, K. P., Benazzato, C., Almeida, N., Pignatari, G. C., Romero, S., et al. (2016). The Brazilian Zika virus strain causes birth defects in experimental models. Nature. 534(7606): 267–271. https://doi.org/10.1038/nature18296
- Li, C., Xu, D., Ye, Q., Hong, S., Jiang, Y., Liu, X., Zhang, N., Shi, L., Qin, C. F., Xu, Z., et al. (2016). Zika Virus Disrupts Neural Progenitor Development and Leads to Microcephaly in Mice. Cell Stem Cell. 19(1): 120–126. https://doi.org/10.1016/j.stem.2016.04.017
- Wang, J. and Cao, H. (2021). Zebrafish and Medaka: Important Animal Models for Human Neurodegenerative Diseases. Int J Mol Sci. 22(19): 10766. https://doi.org/10.3390/ijms221910766
- Gomes, M. C. and Mostowy, S. (2020). The Case for Modeling Human Infection in Zebrafish. Trends Microbiol. 28(1): 10–18. https://doi.org/10.1016/j.tim.2019.08.005
- Tropepe, V. and Sive, H. L. (2003). Can zebrafish be used as a model to study the neurodevelopmental causes of autism? Genes, Brain Behav. 2(5): 268–281. https://doi.org/10.1034/j.1601-183x.2003.00038.x
- Choe, C. P., Choi, S. Y., Kee, Y., Kim, M. J., Kim, S. H., Lee, Y., Park, H. C. and Ro, H. (2021). Transgenic fluorescent zebrafish lines that have revolutionized biomedical research. Lab Anim Res. 37(1): 26. https://doi.org/10.1186/s42826-021-00103-2
- Sow, A. A., Jamadagni, P., Scaturro, P., Patten, S. A. and Chatel-Chaix, L. (2024). A zebrafish-based in vivo model of Zika virus infection unveils alterations of the glutamatergic neuronal development and NS4A as a key viral determinant of neuropathogenesis. PLoS Pathog. 20(12): e1012756. https://doi.org/10.1371/journal.ppat.1012756
- Bernardos, R. L. and Raymond, P. A. (2006). GFAP transgenic zebrafish. Gene Expression Patterns. 6(8): 1007–1013. https://doi.org/10.1016/j.modgep.2006.04.006
- Freppel, W., Mazeaud, C. and Chatel-Chaix, L. (2018). Production, Titration and Imaging of Zika Virus in Mammalian Cells. Bio Protoc. 8(24): e3115. https://doi.org/10.21769/bioprotoc.3115
Article Information
Publication history
Received: Apr 20, 2025
Accepted: Jun 6, 2025
Available online: Jun 19, 2025
Published: Jul 5, 2025
Copyright
© 2025 The Author(s); This is an open access article under the CC BY-NC license (https://creativecommons.org/licenses/by-nc/4.0/).
How to cite
Gomes, Y. C. P., Sow, A. A., Patten, S. A. and Chatel-Chaix, L. (2025). Quantification of Neural Progenitor Cells From Zika Virus-Infected Zebrafish Embryos. Bio-protocol 15(13): e5377. DOI: 10.21769/BioProtoc.5377.
Category
Neuroscience > Nervous system disorders > Animal model
Cell Biology > Cell-based analysis > Viral infection
Neuroscience > Development > Morphogenesis
Do you have any questions about this protocol?
Post your question to gather feedback from the community. We will also invite the authors of this article to respond.