- Protocols

- Articles and Issues
- For Authors
- About
- Become a Reviewer

APEX2 RNA Proximity Labeling in Mammalian Cell Lines With Low Biotin Permeability
Published: Vol 15, Iss 13, Jul 5, 2025 DOI: 10.21769/BioProtoc.5372 Views: 2428
Reviewed by: Marion HoggAnik TuladharAnonymous reviewer(s)
Original research article
The authors used this protocol in:

Jan 2025
Advertisement


Protocol Collections
Comprehensive collections of detailed, peer-reviewed protocols focusing on specific topics


Related protocols
Abstract
The subcellular localization of RNA plays a critical role in various biological processes, including development and stress response. Proximity labeling eases the detection of localized transcripts and protein enrichment compared to previous techniques that rely on biochemical isolation of subcellular structures. The rapid reaction and small labeling radius of APEX2 make it an attractive alternative to other proximity labeling approaches, such as BioID. However, we found that standard protocols for APEX proximity labeling fail in human induced pluripotent stem cells. Moreover, standard protocols yield heterogeneous labeling of biomolecules across single cells in MCF10A breast epithelial cells. Our results indicate that low biotin permeability in these cell lines is the main cause for failed or inefficient labeling. This protocol outlines improved labeling by combining the rapid hydrogen peroxide-driven APEX2 reaction with the addition of a mild detergent during biotin incubation. This adaptation leads to efficient proximity labeling in hiPSCs and more homogeneous biotinylation across single cells in MCF10As. The adapted protocol extends the use of APEX2 proximity labeling to cell lines with poor biotin permeability.
Key features
• Builds on methods developed by the Ting Lab [1] and the Ingolia Lab [2] for proximity labeling of transcripts using the enzyme APEX2.
• Focuses on cell lines with low biotin permeability, like human induced pluripotent stem cells, by including a mild detergent to increase biotin uptake.
• Includes controls for nonspecific molecular localization and statistical methods for processing of resulting sequencing data.
Keywords: RNA proximity labelingGraphical overview
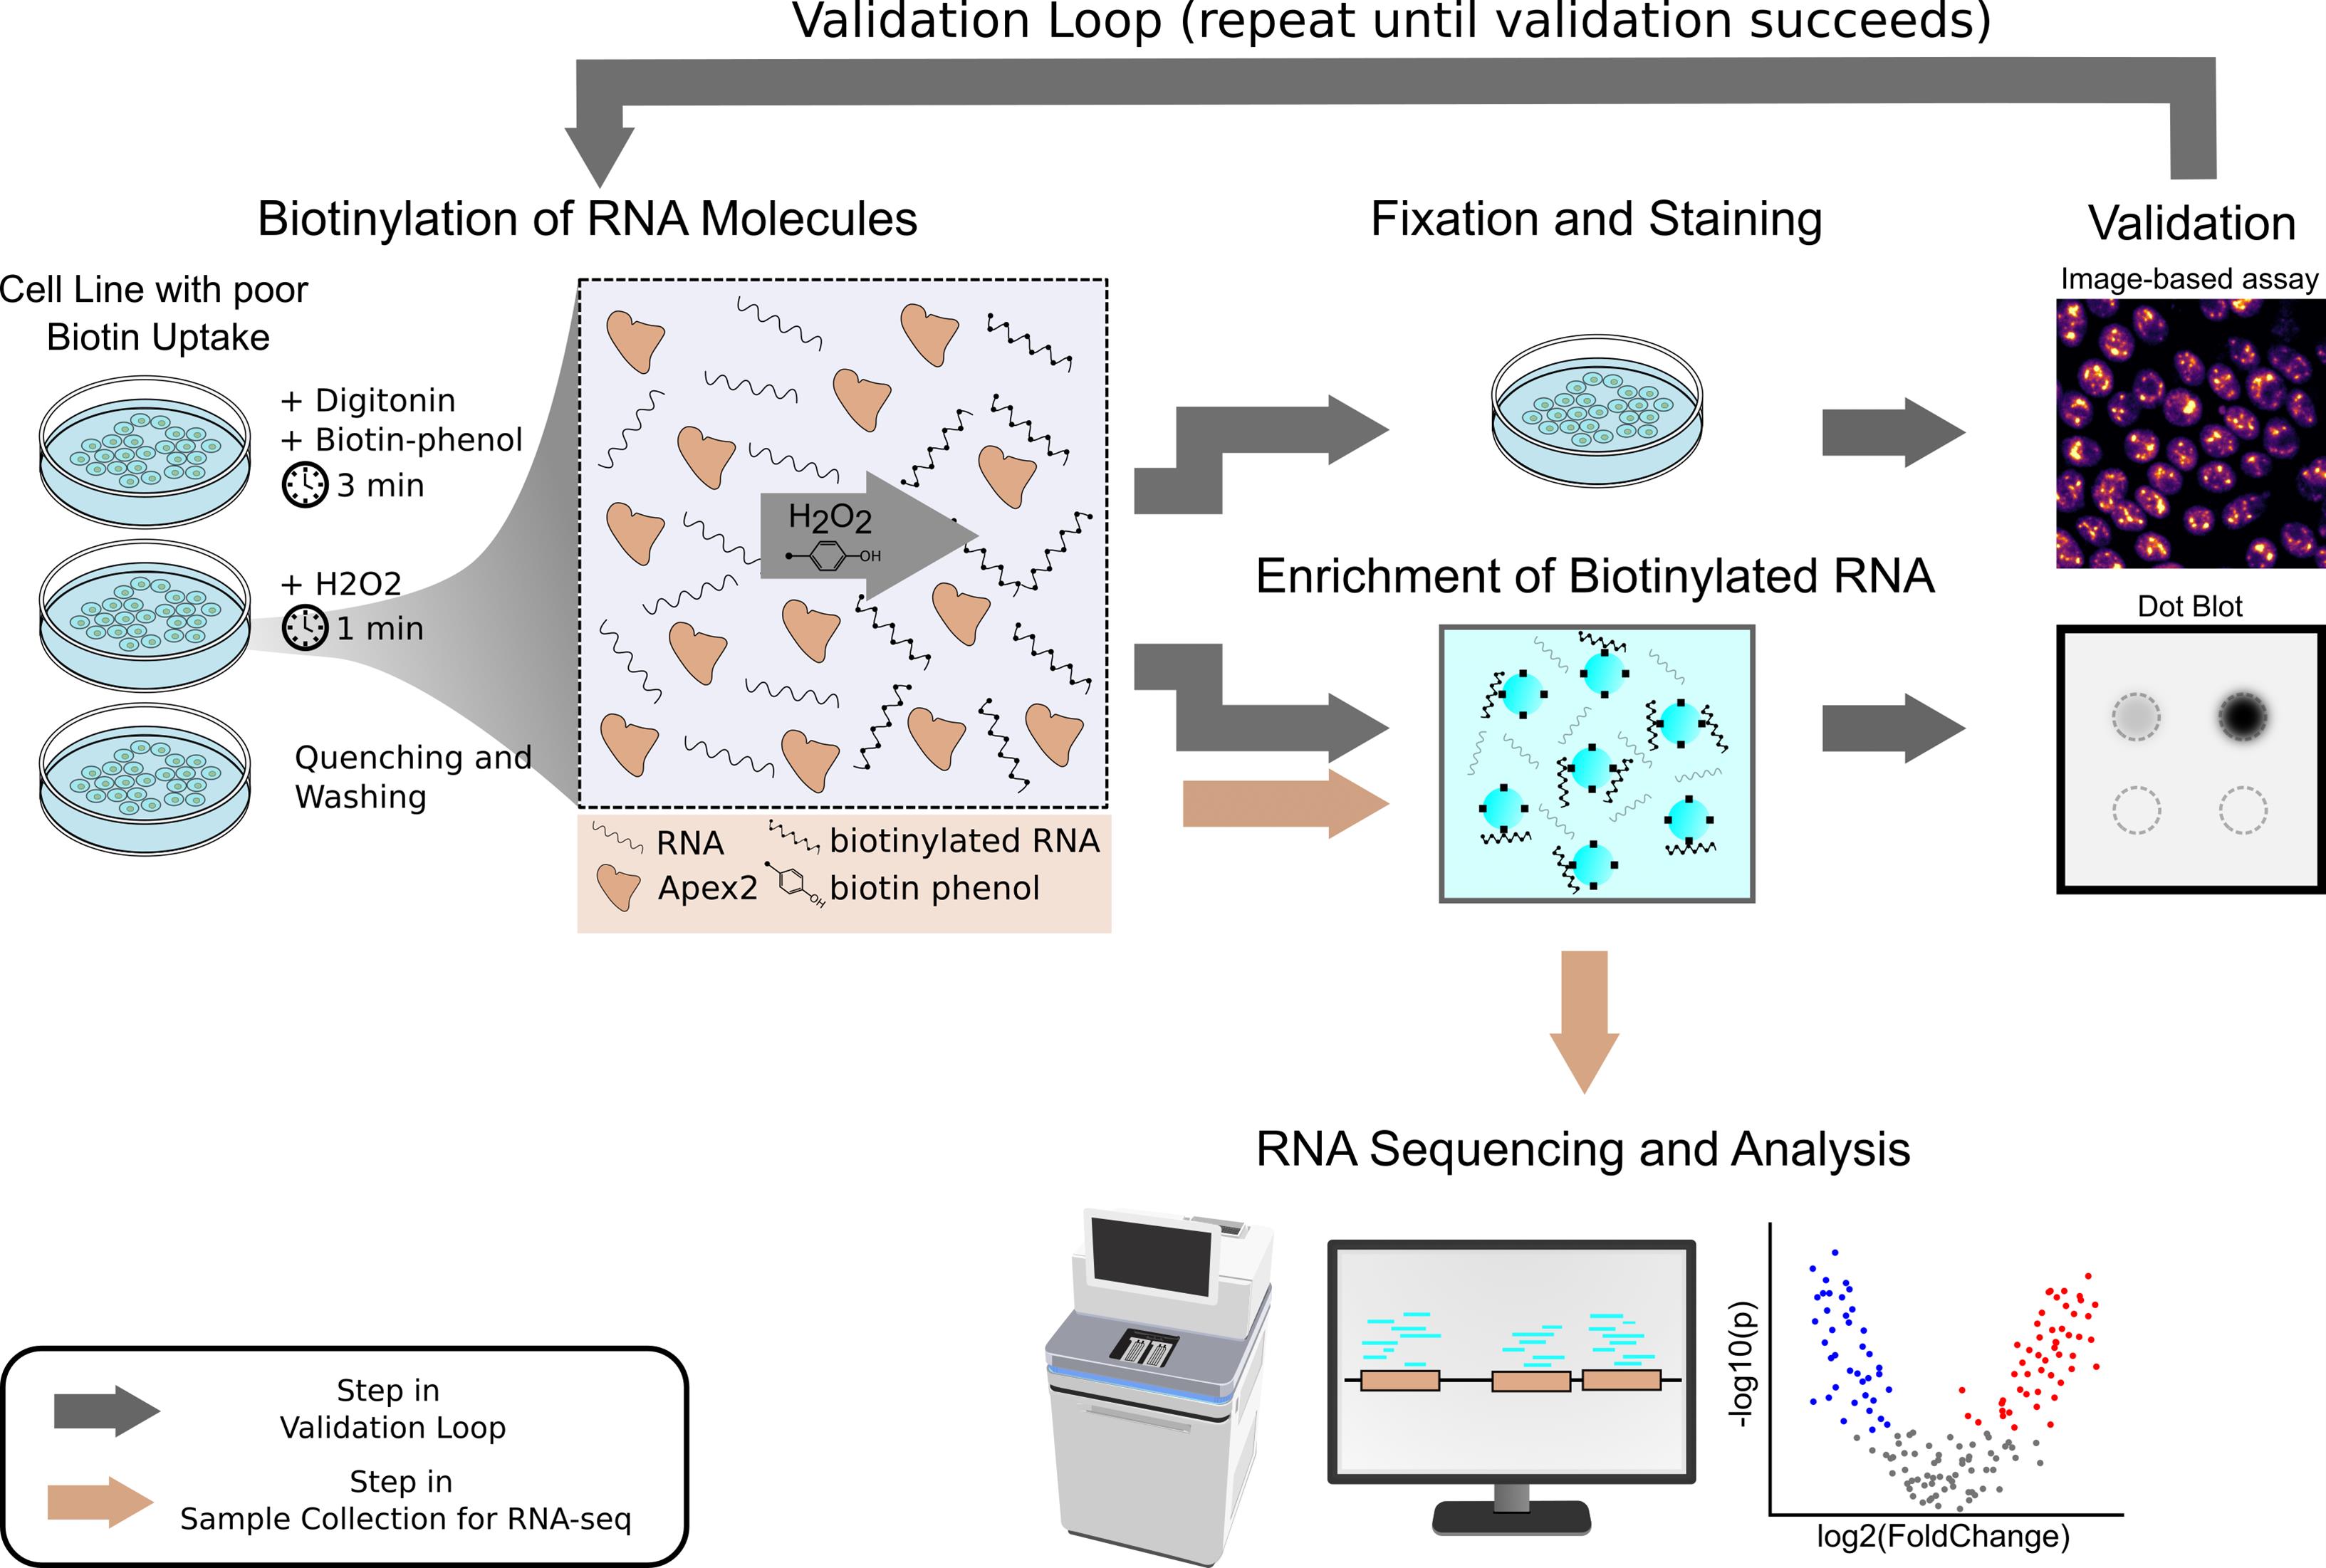
Workflow for proximity labeling of subcellular RNA and enrichment of biotinylated RNA in human induced pluripotent stem cells and other cell lines with low biotin permeability
Background
Within cells, both direct binding between molecules and weaker, more transient molecular interactions regulate cellular activity. Proximity labeling approaches have emerged as a way to capture spatial information within cells and to identify potential interactions among proteins and nucleic acids independent of stable binding. Several methods exist to biotinylate and pull-down biomolecules based on proximity to a bait protein, which differ in the enzyme used for biotinylation and in reaction kinetics [3]. Whether the enzyme is a peroxidase that requires H2O2for activation, like horseradish peroxidase or ascorbate peroxidase 2 (APEX2), or a biotin ligase, as in BioID or TurboID, conjugating the biotinylating enzyme to a bait protein of interest allows pull-down of nearby biomolecules using streptavidin-coated beads following biotinylation. Both proteins and nucleic acids undergo biotinylation, enabling the subsequent identification of biotinylated proteins through mass spectrometry analysis, or DNA or RNA through sequencing. Compared to other methods, APEX2 offers a short and efficient reaction, although dependence on H2O2 restricts in vivo applications.
APEX2 proximity labeling has proven useful in identifying the components of phase-separated compartments and other subcellular organelles, particularly membrane-associated regions [1,2,4,5]. While most APEX2 studies have used cell lines that readily take up exogenous biotin, we found that standard protocols fail to achieve efficient biotinylation in human induced pluripotent stem cells (hiPSCs) and produce heterogeneous labeling in MCF10A breast epithelial cells. Adapting published APEX2 protocols to these two cell lines with poor biotin permeability required optimizing the addition of a mild detergent to allow biotin entry into the cells. Unlike other proximity labeling approaches that require long reaction times and, therefore, long incubation periods with biotin, the temporal resolution of APEX2 is compatible with a quick application of detergent followed by cell harvesting. Here, we present an example application for our adapted APEX2 biotin labeling protocol in hiPSCs endogenously expressing the APEX2-tagged protein SON, a scaffold protein of nuclear speckles, to identify RNAs enriched in this compartment. We use an endogenous tagging strategy in hiPSCs to avoid possible artifacts introduced by overexpression of APEX2 constructs and allow for future differentiation for comparison of RNA localization across cell types. However, this protocol also extends to other mammalian cell lines, including MCF10As, and to proximity labeling using transiently or stably transfected APEX2 constructs. Similar steps prior to RNA extraction could also be adapted for proteomics analysis of biomolecular compartments in these cell lines.
Materials and reagents
Biological materials
1. Cell line expressing a protein of interest tagged with the APEX2 enzyme. For example, WTC-11 hiPSCs carrying an endogenous APEX2-GFP tag (~59 kDa) at the SON locus for nuclear speckle tagging (referred to as APEX2-SON hiPSCs, generated in-house)
2. Control cell line expressing the APEX2 enzyme with nonspecific molecular localization. For example, WTC-11 hiPSCs expressing APEX2-GFP-NLS within a safe-harbor locus for general nuclear tagging (referred to as APEX2-NLS hiPSCs, generated in-house)
Note: To generate the endogenously tagged hiPSC lines, we followed protocols from the Allen Institute for Cell Sciences [6,7]
Reagents
1. (+)-Sodium L-ascorbate (Sigma-Aldrich, catalog number: A7631)
2. 16% paraformaldehyde (Electron Microscopy Sciences, catalog number: 15710)
3. Biotin-phenol (Iris Biotech, catalog number: 41994-02-9)
4. Bovine serum albumin (BSA) (Sigma-Aldrich, catalog number: B4287-5G)
5. Digitonin (Sigma-Aldrich, catalog number: D141)
6. Dithiothreitol (DTT) (Thermo Fisher Scientific, catalog number: D1532)
7. DPBS (Thermo Fisher Scientific, catalog number: 14190250)
8. EDTA (0.5 M), pH 8.0, RNase-free (Thermo Fisher Scientific, catalog number: AM9260)
9. Hydrogen peroxide solution (30%) (Sigma-Aldrich, catalog number: H1009-5ML)
10. InvitrogenTM NaCl (5 M), RNase-free (Thermo Fisher Scientific, catalog number: AM9760G)
11. NaCl (5 M), RNase-free (Thermo Fisher Scientific, catalog number: AM9760G)
12. N-Lauroylsarcosine sodium salt solution (Sigma-Aldrich, catalog number: L7414)
13. Paraformaldehyde 16% aqueous solution EM grade (EMS, catalog number: 15600)
14. Phosphate-buffered saline (10×) pH 7.4, RNase-free (Thermo Fisher Scientific, catalog number: AM9625)
15. RNase A Solution (Sigma-Aldrich, catalog number: 70856-3)
16. RNaseOUTTM recombinant ribonuclease inhibitor (Thermo Fisher Scientific, catalog number: 10777019)
17. Sodium azide (Merck, catalog number: s2002)
18. Sodium hydroxide solution (Sigma-Aldrich, catalog number: 72068)
19. Streptavidin, Alexa FluorTM 647 conjugate (Thermo Fisher Scientific, catalog number: S21374)
20. SUPERase·InTM RNase inhibitor (20 U/μL) (Thermo Fisher Scientific, catalog number: AM2696)
21. TritonTM X-100 Surfact-AmpsTM detergent solution (Thermo Fisher Scientific, catalog number: 85112)
22. Trolox (Sigma-Aldrich, catalog number: 238813)
23. TWEEN® 20 (Sigma-Aldrich, catalog number: P9416)
24. UltraPureTM 1 M Tris-HCI buffer, pH 7.5 (Thermo Fisher Scientific, catalog number: 15567027)
25. UltraPureTM DNase/RNase-free distilled water, 500 mL (Thermo Fisher Scientific, catalog number: 10977015)
Solutions
1. Biotin-phenol stock solution (see Recipes)
2. Digitonin solution (5%) (see Recipes)
3. H2O2 stock solution (see Recipes)
4. Trolox stock solution (see Recipes)
5. Sodium azide stock solution (see Recipes)
6. Sodium ascorbate stock solution (see Recipes)
7. Biotin-phenol labeling solution (see Recipes)
8. Quenching solution (see Recipes)
9. Washing solution (see Recipes)
10. 3× Proteinase buffer (see Recipes)
11. 2× Fixation solution (see Recipes)
12. 2× Permeabilization solution (see Recipes)
13. 2× Blocking solution (see Recipes)
14. Fluorescent streptavidin solution (see Recipes)
15. Binding and washing buffer (see Recipes)
16. Solution A (see Recipes)
17. Solution B (see Recipes)
Recipes
1. Biotin-phenol stock solution
Note: Prepare aliquots and store at -80 °C.
| Reagent | Final concentration | Quantity or volume |
|---|---|---|
| Biotin-phenol | 250 mM | 90.8675 mg |
| DMSO | n/a | 926 μL |
| Total | n/a | 1 mL |
2. Digitonin solution (5%)
Note: The solution has to be heated to 95–98 °C to fully dissolve. The solution can be stored at room temperature but will form precipitates. Prewarm the solution until it is clear before use.
| Reagent | Final concentration | Quantity or volume |
|---|---|---|
| Digitonin | 5% | 100 mg |
| H2O (RNase-free) | n/a | 2 mL |
| Total | n/a | 2 mL |
3. H2O2 stock solution
| Reagent | Final concentration | Quantity or volume |
|---|---|---|
| Hydrogen peroxide solution (30%) | 100 mM | 10 μL |
| H2O (RNase-free) | n/a | 1 mL |
| Total | n/a | 1 mL |
4. Trolox stock solution
Note: Prepare Trolox stock solution freshly before use.
| Reagent | Final concentration | Quantity or volume |
|---|---|---|
| Trolox | 500 mM | 31.3 mg |
| DMSO | n/a | 226 μL |
| Total | n/a | 250 μL |
5. Sodium azide stock solution
Note: Sodium azide stock solution can be stored at room temperature.
| Reagent | Final concentration | Quantity or volume |
|---|---|---|
| Sodium azide | 2% | 200 mg |
| H2O (RNase-free) | n/a | 10 mL |
| Total | n/a | 10 mL |
6. Sodium ascorbate stock solution
Note: Prepare sodium ascorbate stock solution freshly before use.
| Reagent | Final concentration | Quantity or volume |
|---|---|---|
| Sodium ascorbate | 1 M | 100 mg |
| H2O (RNase-free) | n/a | 440 μL |
| Total | n/a | 500 μL |
7. Biotin-phenol labeling solution
Note: Prepare biotin-phenol labeling solution freshly before use. The addition of digitonin might not be necessary for all cell lines. If biotin take-up is efficient, the addition of digitonin can be omitted.
| Reagent | Final concentration | Quantity or volume |
|---|---|---|
| Biotin-phenol stock solution | 0.5 mM | 10 μL |
| Digitonin solution (5%) | 0.005% | 10 μL |
| SUPERase·InTM RNase inhibitor | 1:1000 | 10 μL |
| DPBS (1×) | n/a | 9.97 mL |
| Total | n/a | 10 mL |
8. Quenching solution
| Reagent | Final concentration | Quantity or volume |
|---|---|---|
| Trolox (500 mM stock) | 5 mM | 100 μL |
| Sodium ascorbate stock solution | 10 mM | 100 μL |
| Sodium azide stock solution | 10 mM | 320 μL |
| SUPERase·InTM RNase inhibitor | 1:1,000 | 10 μL |
| DPBS (1×) | n/a | 9.47 mL |
| Total | n/a | 10 mL |
9. Washing solution
| Reagent | Final concentration | Quantity or volume |
|---|---|---|
| Trolox stock solution | 5 mM | 300 μL |
| Sodium ascorbate stock solution | 10 mM | 300 μL |
| SUPERase·InTM RNase inhibitor | 1:1,000 | 30 μL |
| DPBS (1×) | n/a | 29.37 mL |
| Total | n/a | 30 mL |
10. 3× Proteinase buffer
| Reagent | Final concentration | Quantity or volume |
|---|---|---|
| PBS (10×) | 3× | 150 μL |
| N-Lauryl sarcosine sodium solution (20%) | 6% | 150 μL |
| EDTA (0.5 M) | 30 mM | 30 μL |
| DTT (1 M) | 15 mM | 7.5 μL |
| H2O (RNase-free) | n/a | 162.5 μL |
| Total | n/a | 500 μL |
11. 2× Fixation solution
| Reagent | Final concentration | Quantity or volume |
|---|---|---|
| Paraformaldehyde 16% | 8% | 10 mL |
| PBS | n/a | 10 mL |
| Total | n/a | 20 mL |
12. 2× Permeabilization solution
| Reagent | Final concentration | Quantity or volume |
|---|---|---|
| Triton X-100 (10%) | 0.5% | 500 μL |
| PBS | n/a | 9.5 mL |
| Total | n/a | 10 mL |
13. 2× Blocking solution
Note: Dilute 4 g of BSA in ~40 mL of PBS and place on a rotator. Adjust the volume to 50 mL once the BSA is fully dissolved.
| Reagent | Final concentration | Quantity or volume |
|---|---|---|
| BSA | 4% | 4 g |
| PBS | n/a | ~50 mL |
| Total | n/a | 50 mL |
14. Fluorescent streptavidin solution
| Reagent | Final concentration | Quantity or volume |
|---|---|---|
| Streptavidin, Alexa FluorTM 647 Conjugate | 1:1,000 | 1 μL |
| 2× blocking solution | n/a | 1 mL |
| Total | n/a | 1 mL |
15. Binding and washing buffer
Note: Binding and washing buffer can be prepared in advance and stored at room temperature.
| Reagent | Final concentration | Quantity or volume |
|---|---|---|
| Tris-HCl (1 M, pH 7.5) | 5 mM | 250 μL |
| EDTA (0.5 M) | 0.5 mM | 50 μL |
| NaCl (5 M) | 1 M | 10 mL |
| Tween-20 (100%) | 0.1% | 50 μL |
| H2O (RNase-free) | n/a | 39.65 mL |
| Total | n/a | 50 mL |
16. Solution A
Note: Solution A can be prepared in advance and stored at room temperature.
| Reagent | Final concentration | Quantity or volume |
|---|---|---|
| NaOH (10 M) | 5 mM | 25 μL |
| NaCl (5 M) | 50 mM | 0.5 mL |
| H2O (RNase-free) | n/a | 49.475 mL |
| Total | n/a | 50 mL |
17. Solution B
Note: Solution B can be prepared in advance and stored at room temperature.
| Reagent | Final concentration | Quantity or volume |
|---|---|---|
| NaCl (5 M) | 100 mM | 1 mL |
| H2O (RNase-free) | n/a | 49 mL |
| Total | n/a | 50 mL |
Laboratory supplies
1. 96-well imaging plate (Greiner, catalog number: 655096)
2. Chemiluminescent Nucleic Acid Detection Module kit (Thermo Fisher Scientific, catalog number: 89880)
3. DynabeadsTM MyOneTM Streptavidin C1 (Thermo Fisher Scientific, catalog number: 65001)
4. Eppendorf® DNA LoBind tubes (Eppendorf, catalog number: 0030108035)
5. High-sensitivity RNA ScreenTape (Agilent, catalog number: 5067-5579)
6. High-sensitivity RNA ScreenTape ladder (Agilent, catalog number: 5067-5581)
7. High-sensitivity RNA ScreenTape sample buffer (Agilent, catalog number: 5067-5580)
8. Hybond®-N+ hybridization membrane (Sigma-Aldrich, catalog number: GERPN203B)
9. QubitTM RNA High Sensitivity (HS) Assay kit (Thermo Fisher Scientific, catalog number: Q32852)
10. Quick-RNA Miniprep kit (Zymo Research, catalog number: R1054)
11. RNA Clean & Concentrator-5 (Zymo Research, catalog number: R1013)
12. SMARTer® Stranded Total RNA-Seq kit v2 - Pico Input Mammalian (Takara Bio, catalog number: 634411)
Equipment
1. iBrightTM CL750 Imaging System (Thermo Fisher Scientific, catalog number: A44116)
2. FisherbrandTM UV Crosslinker (Fisher Scientific, catalog number: 13-245-222)
3. Spinning disk confocal microscope (e.g., Visitron, model: VisiScope CSU-X1)
4. Optional: washer dispenser (Agilent, catalog number: EL406)
5. QubitTM fluorometer (Thermo Fisher Scientific, catalog number: Q33238)
6. TapeStation 4200 (Agilent, model: G2991BA)
Software and datasets
1. GENCODE gene annotations ≥ v40 [8]
2. R ≥ v.4.4.0 [9]
3. STAR ≥ v2.7.3a [10]
4. Rsubread ≥ v2.10.5 [11]
5. Trimmomatic ≥ v0.39 [12]
6. DESeq2 ≥ v1.36.0 [13]
Procedure
We strongly recommend performing validation experiments to ensure efficient, homogeneous, and subcellular localization-specific biotinylation. Performing the image-based validation assay (sections A and B) will initially help to assess if biotinylation occurs evenly across the cell population and if the biotinylated biomolecules localize as expected within the cell. The dot blot validation assay (sections A, C, and D) captures the efficiency of biotin labeling and enrichment of biotinylated RNA from the sample. We recommend starting with the image-based validation assay and continuing with the dot blot validation assay only once results are satisfactory. Similarly, only start collecting samples for downstream RNA sequencing and analysis once the dot blot validation assay shows efficient enrichment of biotinylated RNA. The figures and data analysis below show the APEX2-SON and APEX2-NLS hiPSC lines as examples [5].
A. Proximity labeling of RNA in cell lines with low biotin permeability
Note: This section explains how to perform the proximity-based biotin labeling assay in a 10 cm cell culture dish. If cells are prepared for image-based assays, seed cells in a 96-well imaging plate and adjust volumes accordingly (100–200 μL per well of each solution).
1. Thaw endogenously tagged cell lines (including control cell line) and keep them in culture for at least 2 passages. Perform the assay when cells are around 70%–80% confluent.
Note: Alternatively, transduce or transfect cells before labeling with localized and control APEX2 constructs. However, this strategy may require additional controls for the effects of overexpression.
2. Prepare fresh Trolox stock solution and sodium ascorbate stock solution on the day of the assay. Thaw an aliquot of biotin-phenol stock solution from -80 °C or prepare it freshly.
3. Prepare fresh biotin-phenol labeling solution, quenching solution, and washing solution before starting the assay.
4. Aspirate cell culture medium and wash cells twice with 10 mL of DPBS.
5. Aspirate DPBS and replace it with 10 mL of biotin-phenol labeling solution.
6. Incubate for 3 min at room temperature.
Note: During the validation phase, we recommend also performing the assay with a standard APEX2 protocol in which cells are incubated in cell culture media with biotin (0.5 mM, as in the biotin-phenol labeling solution) in the absence of detergent for 1 h at 37 °C before initiating the labeling reaction. This can serve as a baseline for the image-based validation assay (see section D) and the dot blot validation assay (see section B).
7. Add 50 μL of 100 mM H2O2 stock solution. Incubate for 1 min at room temperature while slightly agitating the dish.
Notes:
1. This step is time-sensitive due to the cytotoxic effects of H2O2. In some cases, slight modifications in H2O2 concentration or incubation time may improve labeling (see General notes).
2. When preparing samples for validation with dot blot or image-based assays, we recommend also preparing a sample in which the addition of H2O2 is omitted.
8. Aspirate the biotin-phenol labeling solution and wash once with 10 mL of quenching solution.
9. Wash three times with 10 mL of washing solution.
Optional: At this point, cells can be fixed and used for image-based validation of biotin labeling. See section B.
10. Aspirate the washing solution completely and directly add 600 μL of RNA lysis buffer (Quick-RNA Miniprep kit) to the dish.
11. Scrape cells into solution and transfer to a RNase-free microcentrifuge tube. Immediately proceed to section C.
B. Image-based validation of biotin labeling
Note: This section explains how to validate the labeling of biomolecules with biotin after performing section A up to step 9 using an image-based assay in a 96-well plate. It is important to validate the subcellular localization of the biotinylated biomolecules by verifying overlap with APEX2-tagged protein localization. The image-based validation assay further shows whether labeling is homogeneous across single cells. Make sure that the results of image-based validation are satisfactory before moving on with the protocol.
1. After performing section A of the protocol up to step 9 in a 96-well plate suitable for microscopy, immediately fix cells by adding an equal volume of 2× fixation solution to the existing solution (for a final concentration of 1×) and incubate at room temperature for 15 min.
2. Wash cells three times with 100 μL of PBS.
3. Aspirate to 50 μL and add an equal volume of 2× permeabilization solution. Incubate at room temperature for 30 min.
Note: If a washer dispenser or liquid handling robot is not available to aspirate to a specific volume, permeabilization and other solutions (blocking, streptavidin) can be prepared at 1× concentrations and added after full manual aspiration.
4. Wash cells three times with 100 μL of PBS.
5. Aspirate to 50 μL and add an equal amount of 2× blocking solution. Incubate at room temperature for 1 h on a shaker.
6. Wash cells three times with 100 μL of PBS.
Note: If your APEX2-tagged protein does not include a fluorescent tag, we recommend staining for your protein of interest with an antibody (see optional steps below).
a. Optional: Aspirate to 50 μL and add an equal amount of 2× blocking solution containing a primary antibody targeting your protein of interest. Incubate at room temperature for 1 h on a shaker.
b. Wash cells three times with 100 μL of PBS.
c. Include a secondary antibody in the fluorescent streptavidin solution.
7. Aspirate to 50 μL and add an equal amount of fluorescent streptavidin solution. Incubate at room temperature for 1 h on a shaker.
8. Wash cells three times with 100 μL of PBS.
9. Acquire images on a spinning disk confocal microscope. Streptavidin signal should overlap with fluorescently tagged APEX2 or antibody staining against the protein of interest (see Figure 1 ).
Note: If you observe unexpected results in the image-based validation assay, see troubleshooting points 1–3 for potential problems and solutions.
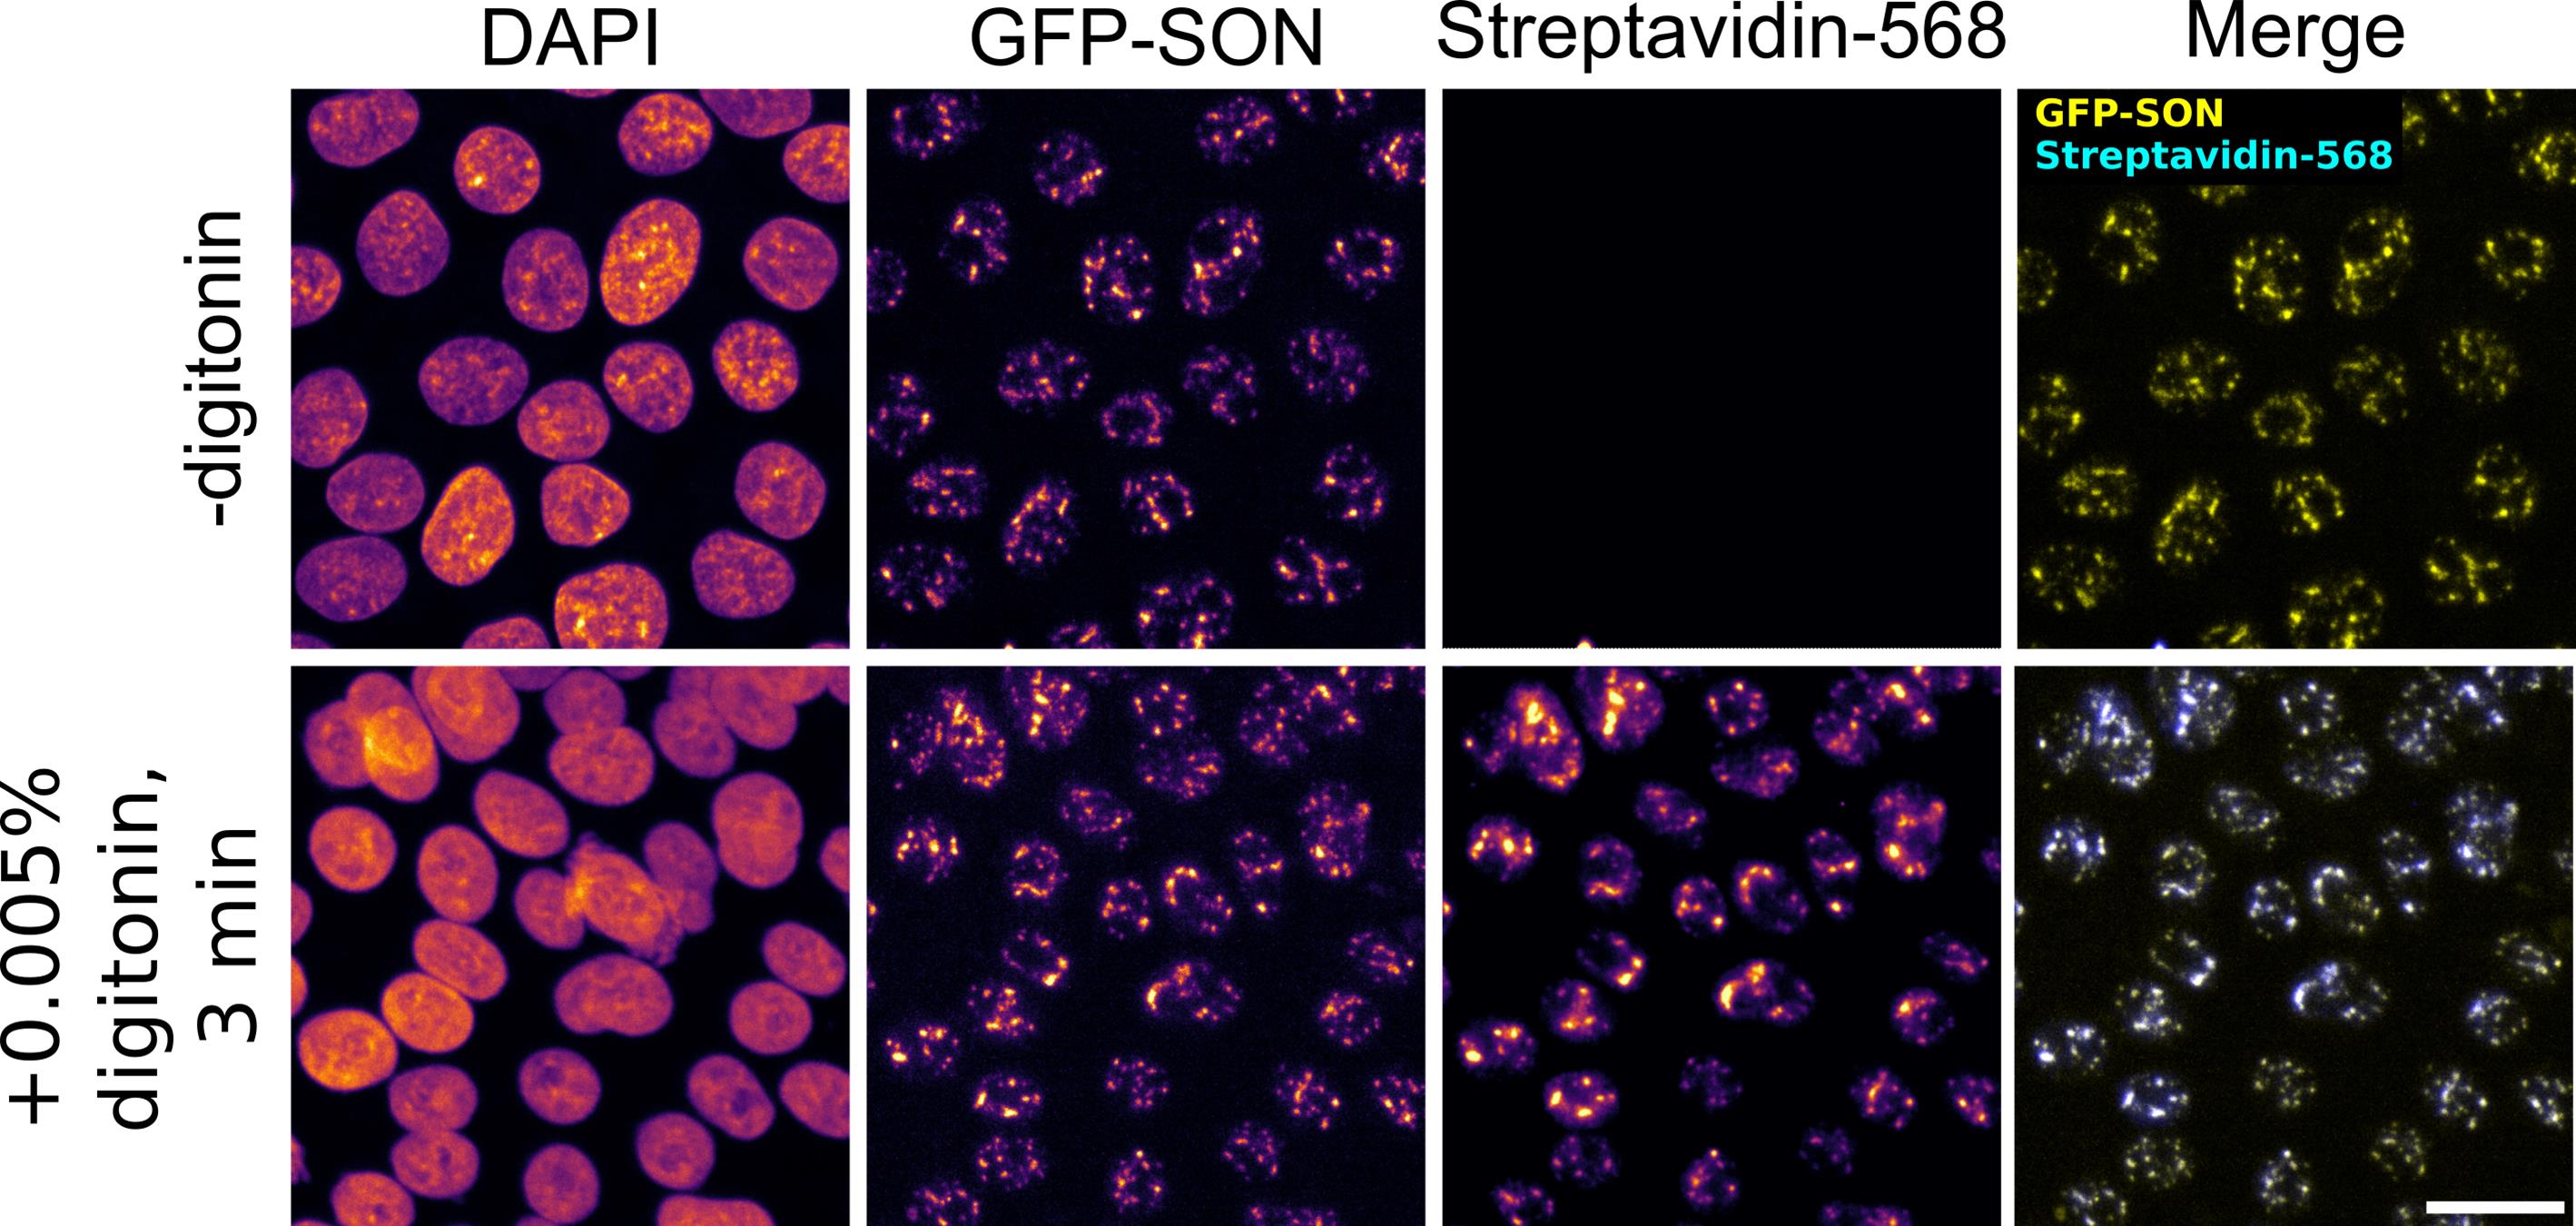
Figure 1. Example results of image-based validation assay using APEX2-GFP-SON hiPSCs. In APEX2-GFP-SON hiPSCs, the standard protocol (no digitonin, 1 h incubation with biotin) does not result in biotin labeling. Addition of 0.005% digitonin to the biotin labeling solution results in efficient biotinylation after incubating with biotin-phenol for only 3 min. Scale bar, 20 μm.
C. RNA extraction and enrichment of biotinylated RNA
1. Follow the Quick-RNA Miniprep kit protocol to extract total RNA. Resuspend RNA in 100 μL of RNase-free water in the elution step.
Note: If you are collecting samples for downstream RNA-seq, set aside 5 μL of extracted total RNA as the input sample.
2. Resuspend DynabeadsTM MyOneTM Streptavidin C1 by vortexing.
3. For each sample, add 30 μL of streptavidin beads to an RNase-free 1.5 mL microcentrifuge tube.
4. Follow the DynabeadsTM MyOneTM Streptavidin C1 protocol for RNA applications to immobilize biotinylated RNA on the streptavidin-coated beads.
a. Wash the beads three times with 1 mL of washing buffer. To remove supernatant, place the tube on a magnetic stand for 1 min.
b. Wash the beads two times with 200 μL of solution A for 2 min to remove RNases.
c. Wash the beads twice with 200 μL of solution B.
d. Resuspend the beads in 95 μL of solution B.
e. Add 95 μL of extracted total RNA to the tube.
f. Immobilize biotinylated RNA on the beads for 2 h at 4 °C with gentle rotation.
g. Remove supernatant by placing the tube for 2–3 min on a magnetic stand.
Note: After immobilization of RNA to the beads is finished, do not discard the leftover solution. This unbound RNA fraction can be used in the dot blot along with the enriched fraction to assess the efficiency of biotinylated RNA enrichment.
h. Wash the beads three times with 200 μL of binding and washing buffer.
i. Resuspend the beads in 54 μL of RNase-free water.
5. To release the RNA from the beads, add 33 μL of 3× proteinase buffer, 3 μL of Riboblock RNase inhibitor, and 10 μL of Proteinase K to the beads. Incubate the beads at 42 °C for 1 h and at 55 °C for 1 h on an orbital thermomixer at 250 rpm.
Note: Alternatively, beads can be incubated in 95% formamide + 10 mM EDTA, pH 8.2, for 5 min at 65 °C to release the RNA. However, harsh conditions like formamide can reduce yield and increase yield variability between replicates [1]. We did not test modifications to the Proteinase K treatment; shorter treatments could be possible.
6. Purify RNA with RNA Clean & Concentrator-5 kit and elute into 15 μL of RNase-free water.
7. Measure the amount of biotinylated RNA on a Qubit™ fluorometer using a Qubit TM RNA High Sensitivity (HS) assay. In our experience, performing the assay in a 10 cm dish of 70%–80% confluent cells results in 3.15–73 ng of biotinylated RNA across four different drug treatments (median = 16.2 ng; SD = 15.88; n = 40) (Figure 2A). Concentrations in this range are generally sufficient to continue with the protocol.
8. Measure RNA integrity on a TapeStation 4200 System using a High Sensitivity RNA ScreenTape. As a guideline, we observed a median RINe value of 7.2 (SD = 0.96, n = 40) for biotinylated samples, and slightly higher RINe values (median = 8.1, SD = 0.83, n = 40) for input samples (Figure 2B).
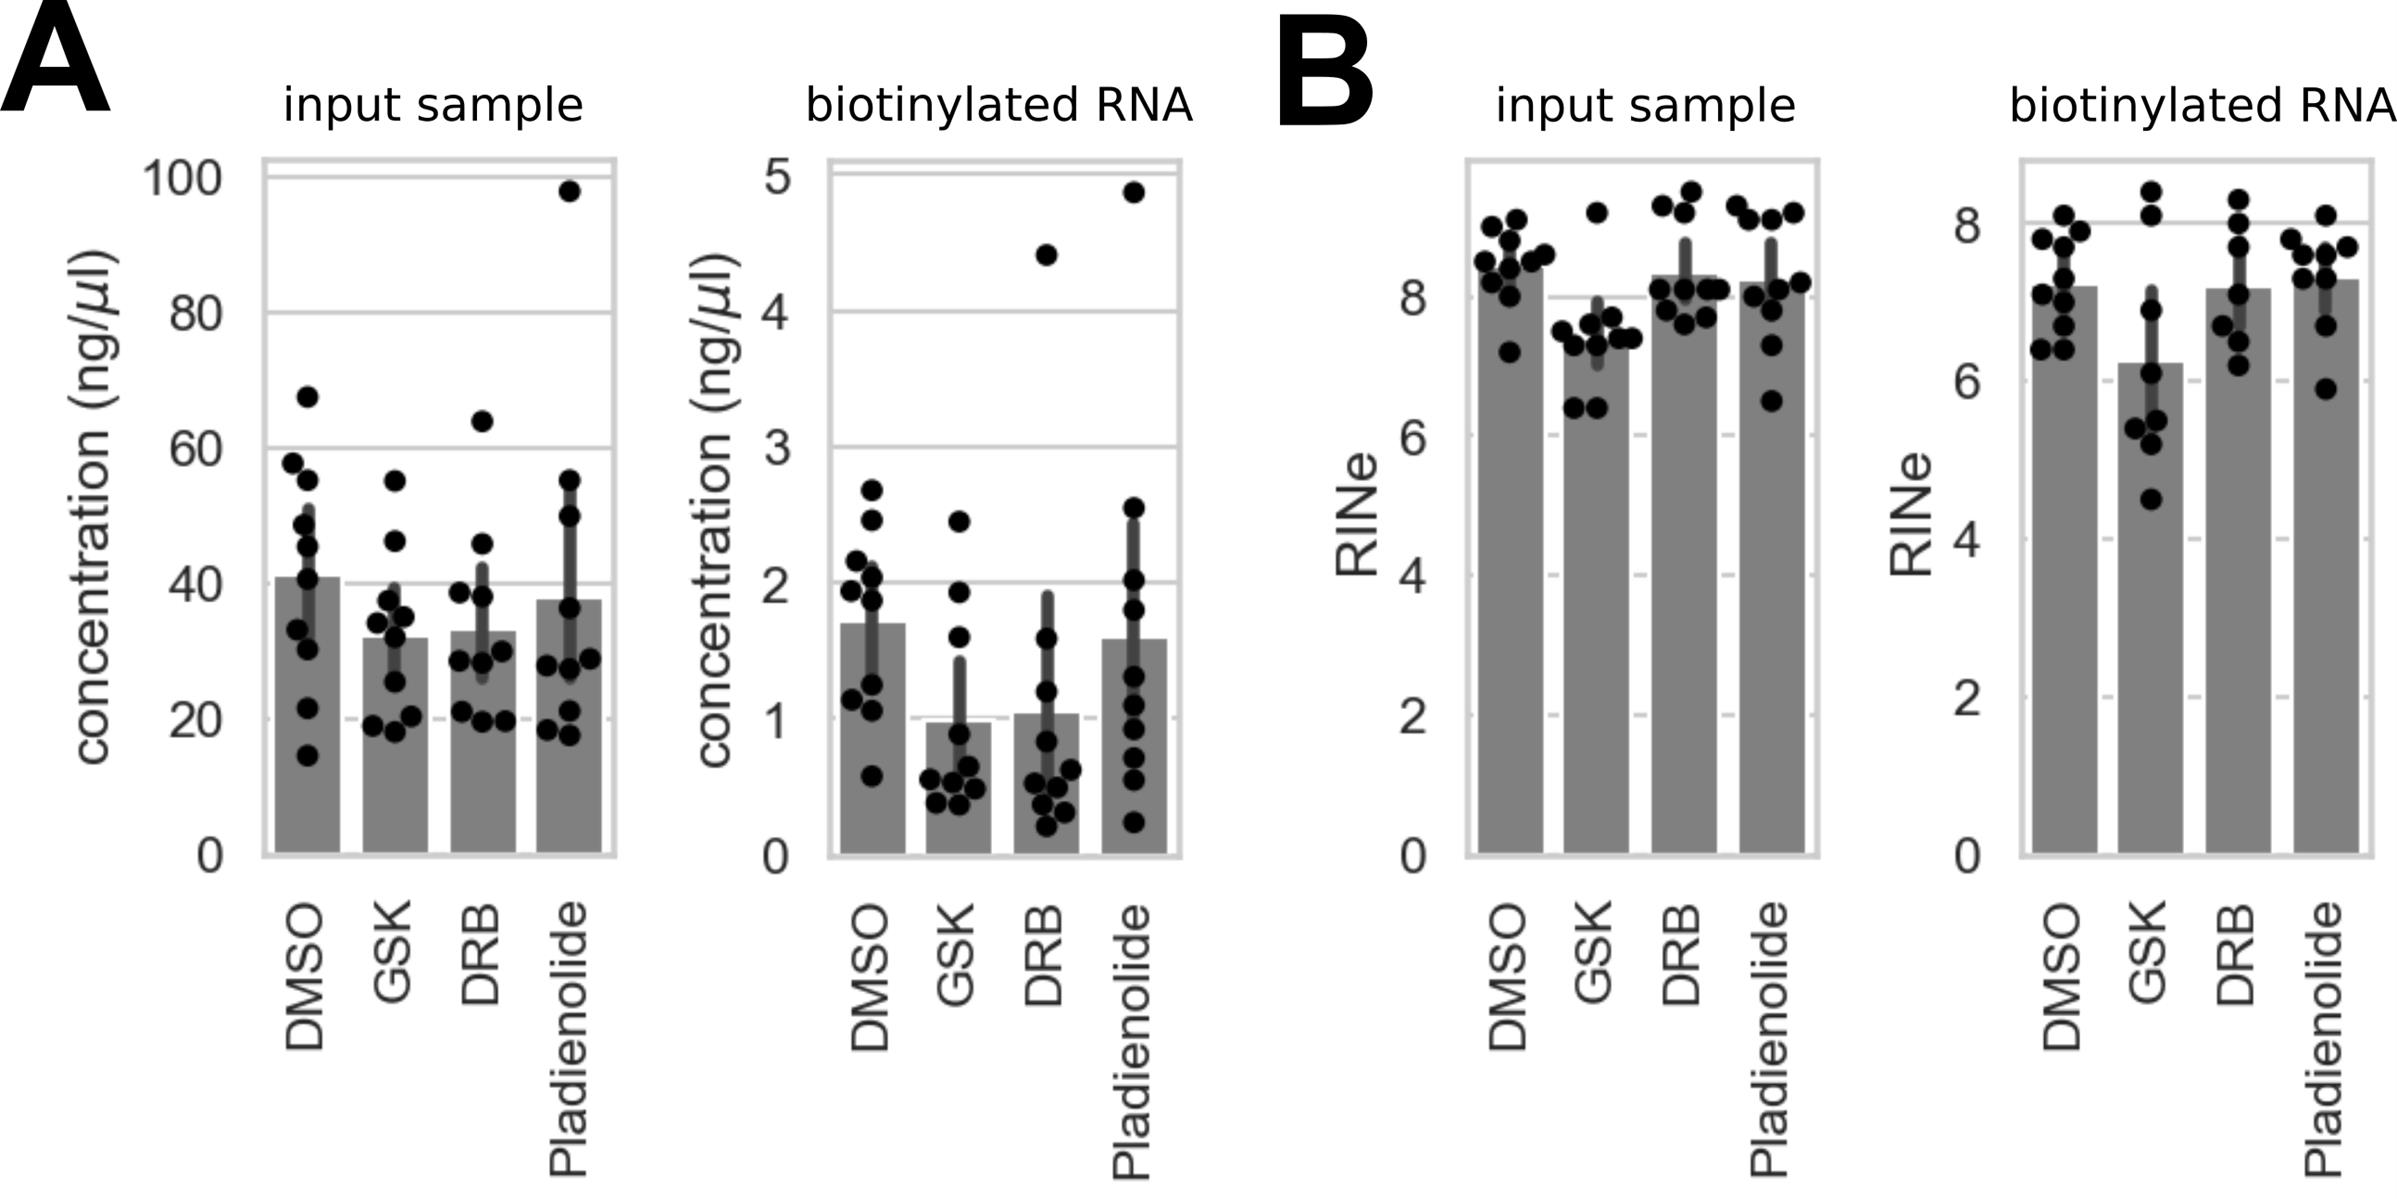
Figure 2. Concentration and RINe values of input and biotinylated samples. (A) RNA concentration measured in input samples and samples enriched for biotinylated RNA across four different drug treatments. (B) RINe values measured in input samples and samples enriched for biotinylated RNA across four different drug treatments. Points indicate one of five replicates across two cell lines (APEX2-SON and APEX2-NLS hiPSCs). Error bars represent standard deviation.
D. Dot blot validation of biotinylated RNA enrichment
Note: This section explains how to validate the labeling of RNAs with biotin after performing sections A and C using a dot blot assay. It is important that biotinylated RNA has been efficiently enriched in section C, especially since the protocol often yields only low amounts of biotinylated RNA. Make sure that the results of dot blot validation are satisfactory before moving on with the protocol.
1. We recommend preparing the following samples for validation on a dot blot:
a. Enriched biotinylated RNA fraction
b. Enriched biotinylated RNA fraction + RNase treatment
c. Control sample without H2O2 treatment
d. Unbound RNA fraction
2. Prepare 3 μL (1–2 ng) of RNA in an RNase-free microcentrifuge tube.
Note: At this step, the RNA concentration in each sample is not crucial. The dot blot assay is sensitive enough to even show minimal levels of RNA. We recommend initially using the undiluted enriched biotinylated RNA fraction.
3. Add 1 μL of RNase A solution to the enriched biotinylated fraction + RNase sample and incubate for 5 min at room temperature.
4. Incubate RNA samples at 95 °C for 3 min on a heat block to disrupt secondary structures.
5. Immediately cool RNA samples on ice for 3 min.
6. Add 1 μL of RNaseOUT to the RNase-treated sample and incubate for 5 min at room temperature.
7. Blot 3 μL of RNA onto a piece of Hybond®-N+ hybridization membrane and crosslink with a UV crosslinker at 120,000 microjoules/cm2.
8. Reveal the signal using a Chemiluminescent Nucleic Acid Detection Module kit assay according to the manufacturer’s instructions.
Note: The kit contains HRP coupled to streptavidin, which binds to the biotinylated RNA blotted on the membrane. This allows chemiluminescent detection of the biotinylated RNA. We perform this assay in a clear 6-well cell culture dish and transfer the membrane to a new well of the plate whenever the protocol calls for a new container. Please see the manufacturer’s instructions for more details.
a. Warm the kit blocking buffer and 4× wash buffer to 37–50 °C in a water bath.
b. Add 4 mL of the kit blocking buffer and incubate for 15 min at room temperature on a rocker.
c. Replace the kit blocking buffer with 4 mL of conjugate/blocking solution. Incubate for 15 min at room temperature on a rocker.
d. Transfer the membrane to a new container and rinse with 5 mL of kit wash solution.
e. Wash the membrane four times with 5 mL of kit wash solution. Leave the membrane in the wash solution for 5 min at room temperature on a rocker at each wash step.
f. Transfer the membrane to a new container and incubate with 7 mL of kit substrate equilibration buffer for 5 min at room temperature on a rocker.
g. Mix 2 mL of kit luminol/enhancer solution with 2 mL of kit stable peroxide solution to prepare the chemiluminescent substrate working solution.
h. Prepare a puddle of chemiluminescent substrate working solution on parafilm.
i. Remove the membrane from the container, remove excess liquid, and place it (nucleic acid side down) on the puddle of chemiluminescent substrate working solution.
j. Incubate for 5 min at room temperature.
k. Remove the membrane from the solution and remove excess liquid.
9. Acquire images of the membrane with an appropriate imaging system. The signal should only be visible where the enriched biotinylated RNA fraction has been blotted. See Figure 3 for example dot blots.
Notes:
1. Residual signal might still be visible where the enriched biotinylated RNA fraction + RNase treatment and unbound RNA fraction have been blotted, but signal intensity should be significantly lower.
2. If you observe unexpected results in the dot blot validation assay, see troubleshooting point 4 for potential problems and solutions.
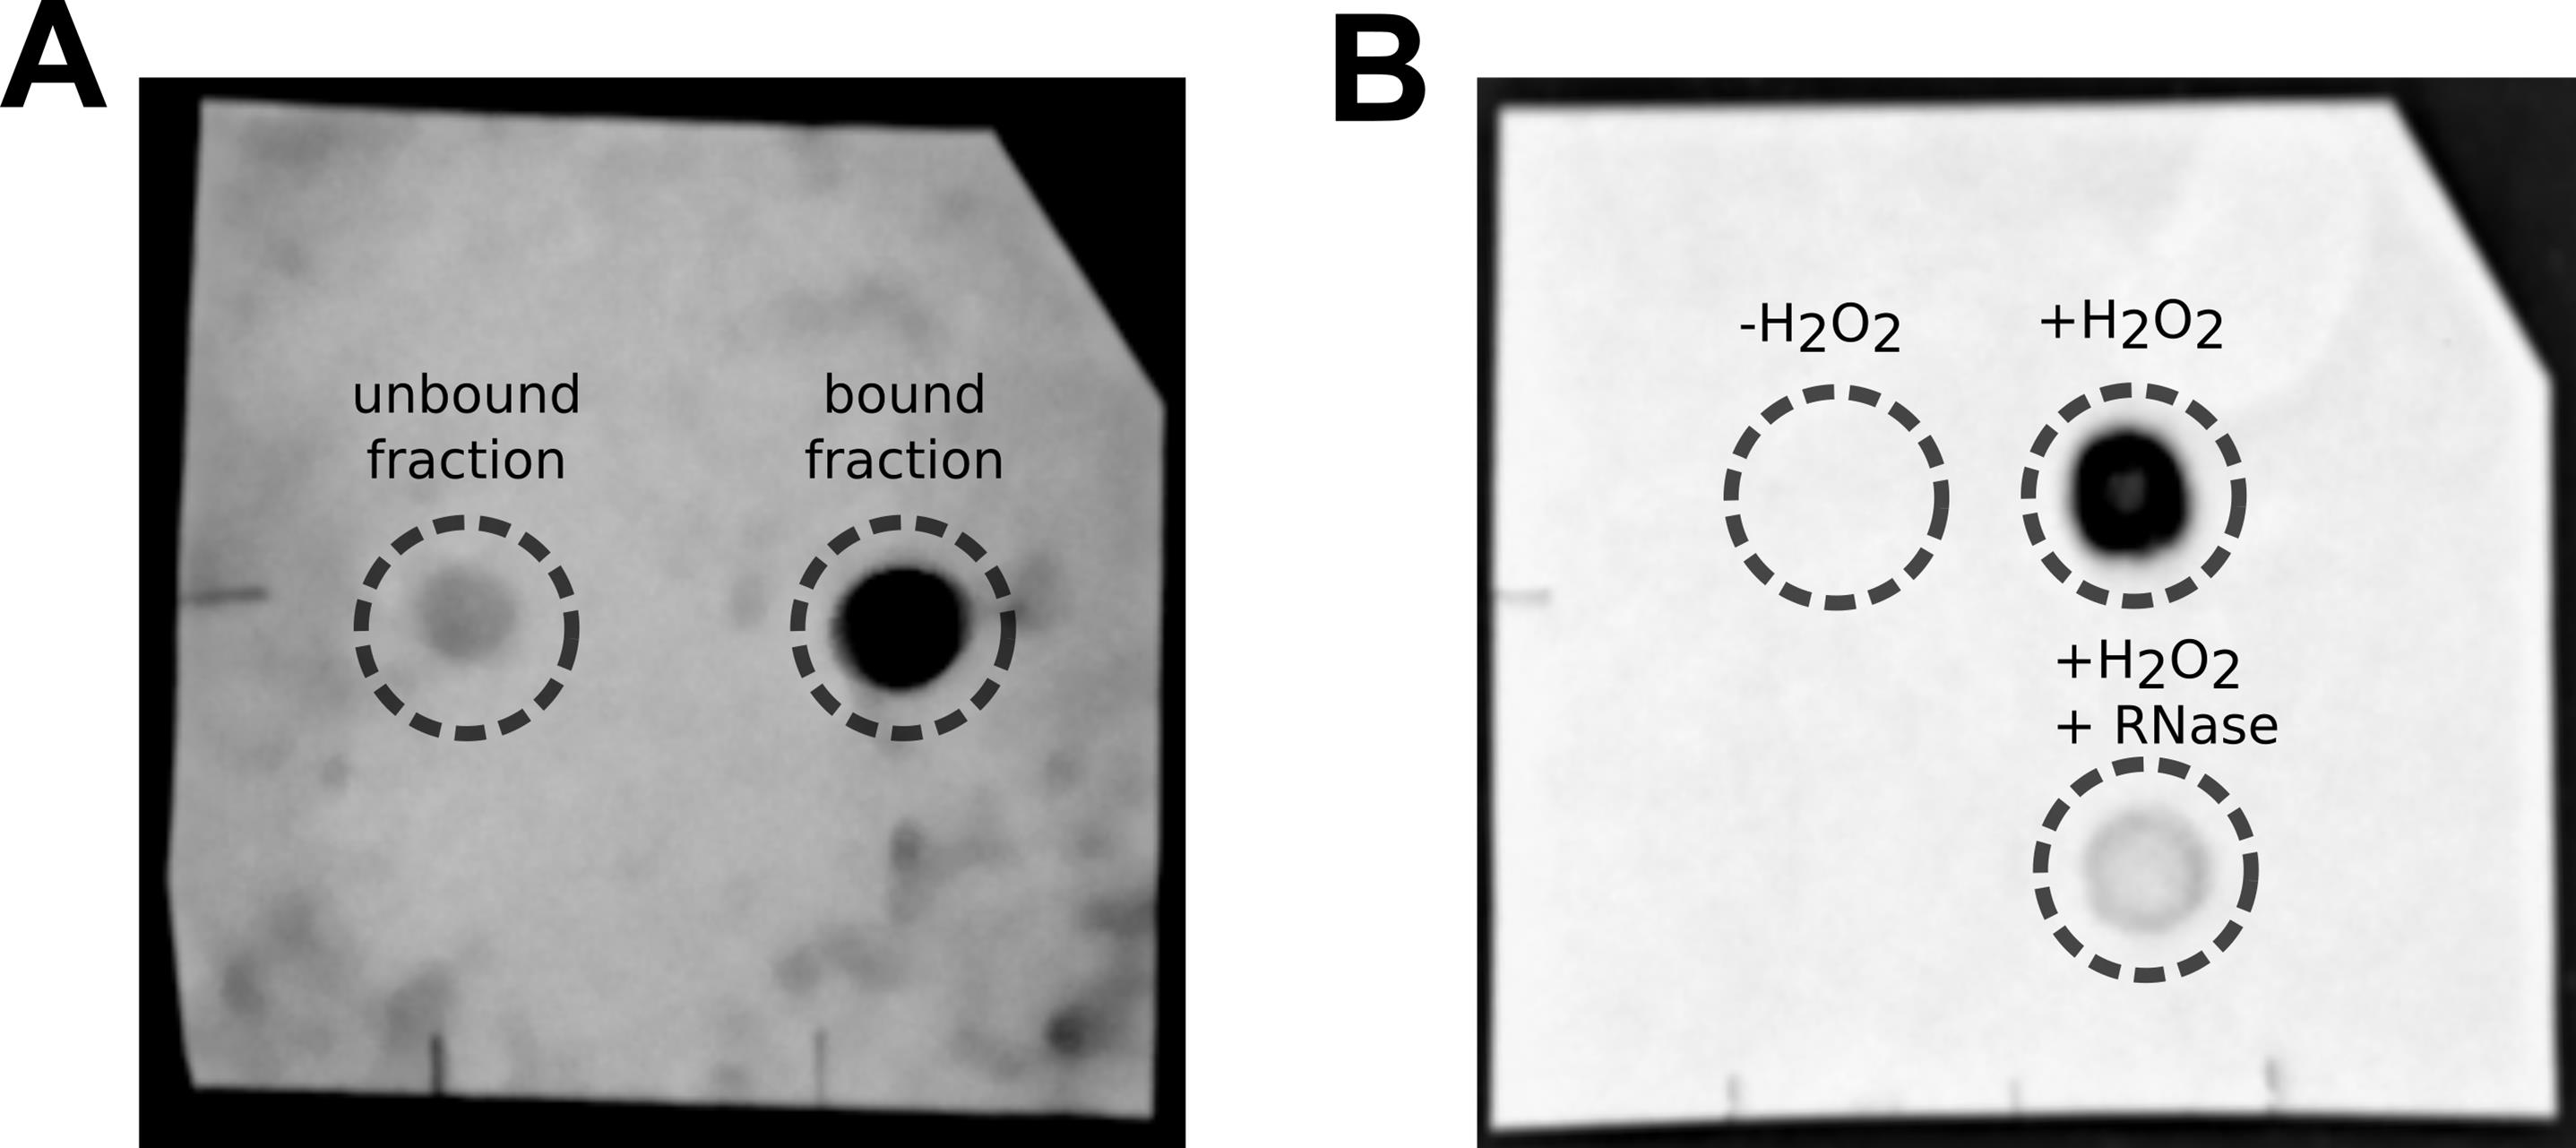
Figure 3. Example images of dot blots. (A) Image of a blot showing RNA from the unbound fraction and RNA enriched from streptavidin-coated beads. (B) Image of a blot showing bead-enriched RNA samples from the biotin labeling protocol under three conditions: without addition of H2O2, with H2O2, and with H2O2 followed by RNase treatment after enrichment. The image in panel b was originally published in [5] (Supplementary Figure 3a) under a Creative Commons Attribution-NonCommercial-NoDerivatives 4.0 International License (http://creativecommons.org/licenses/by-nc-nd/4.0/).
E. Library preparation and RNA sequencing
The assay in this protocol uses one 10 cm cell culture dish of 70%–80% confluent cells expressing an APEX2 construct as starting material for each sequencing replicate. In our experience, the resulting amount of biotinylated RNA can be relatively low (<10 ng). The exact amount will depend on factors such as the cell line used, whether APEX2 is endogenously or over-expressed and to which protein or localization signals it is fused, and the efficiency of the biotinylation reaction, RNA extraction, and enrichment of biotinylated RNA. We generally recommend using a low-input RNA sequencing library prep kit that allows for the removal of ribosomal RNA (for example, SMARTer® Stranded Total RNA-Seq Kit v2, Pico Input Mammalian, see Laboratory supplies section). Following library prep, we performed unpaired sequencing with a sequencing depth of 80 million reads and a read length of 100 bp on the Illumina NovaSeq platform.
Data analysis
Note: Data analysis requires basic knowledge of command line interface tools in Linux and R.
1. Trim adapter sequences from raw reads using Trimmomatic with the following settings:
ILLUMINACLIP:TruSeq3-SE:2:30:10 LEADING:3 TRAILING:3 SLIDINGWINDOW:4:15 MINLEN:36
2. Perform quality checks after trimming adapter sequences with FastQC.
3. Map trimmed reads to the human reference genome using STAR and GENCODE v40 gene annotations.
4. Generate count tables using the featureCounts function of the Rsubread R package.
5. Filter out genes with less than 10 counts in any sample.
6. Perform differential gene expression (DGE) analysis with DESeq2.
a. For a detailed tutorial on how to use DESeq2, see the following R vignette:
https://bioconductor.org/packages/3.21/bioc/vignettes/DESeq2/inst/doc/DESeq2.html
b. To identify differentially expressed genes between APEX2-SON hiPSCs and APEX2-NLS hiPSCs (for example), the following DESeq2 commands can be used:
library(DESeq2)
design = ~ cell_line
dds = DESeqDataSetFromMatrix(
countData = count_data, # Count table output from featureCounts
colData = col, # Column metadata, must include the cell_line column
design = ~ cell_line, # Design of the generalized linear model
)
contrast = ”cell_line_SON_vs_NLS” # DGE between the APEX2-SON and APEX2-NLS
results(
dds,
name = contrast,
alpha = 0.05,
)
d. The contrast cell_line_SON_vs_NLS in this case shows the differential gene expression between the APEX2-SON and APEX2-NLS hiPSCs.
7. The measured log2FC can be biased by overall changes in RNA expression between the cell lines used (e.g., APEX2-SON and APEX2-NLS). The log2FC observed in biotin-labeled samples (log2FC biotin) can be modeled by fitting a linear regression model using the log2FC from input samples (log2FC input) as an independent variable:
The residuals of the data points to the fitted model represent the normalized log2FC for the biotinylated samples. The systematic bias introduced by total RNA changes between cell lines is now removed (Figure 4 ).
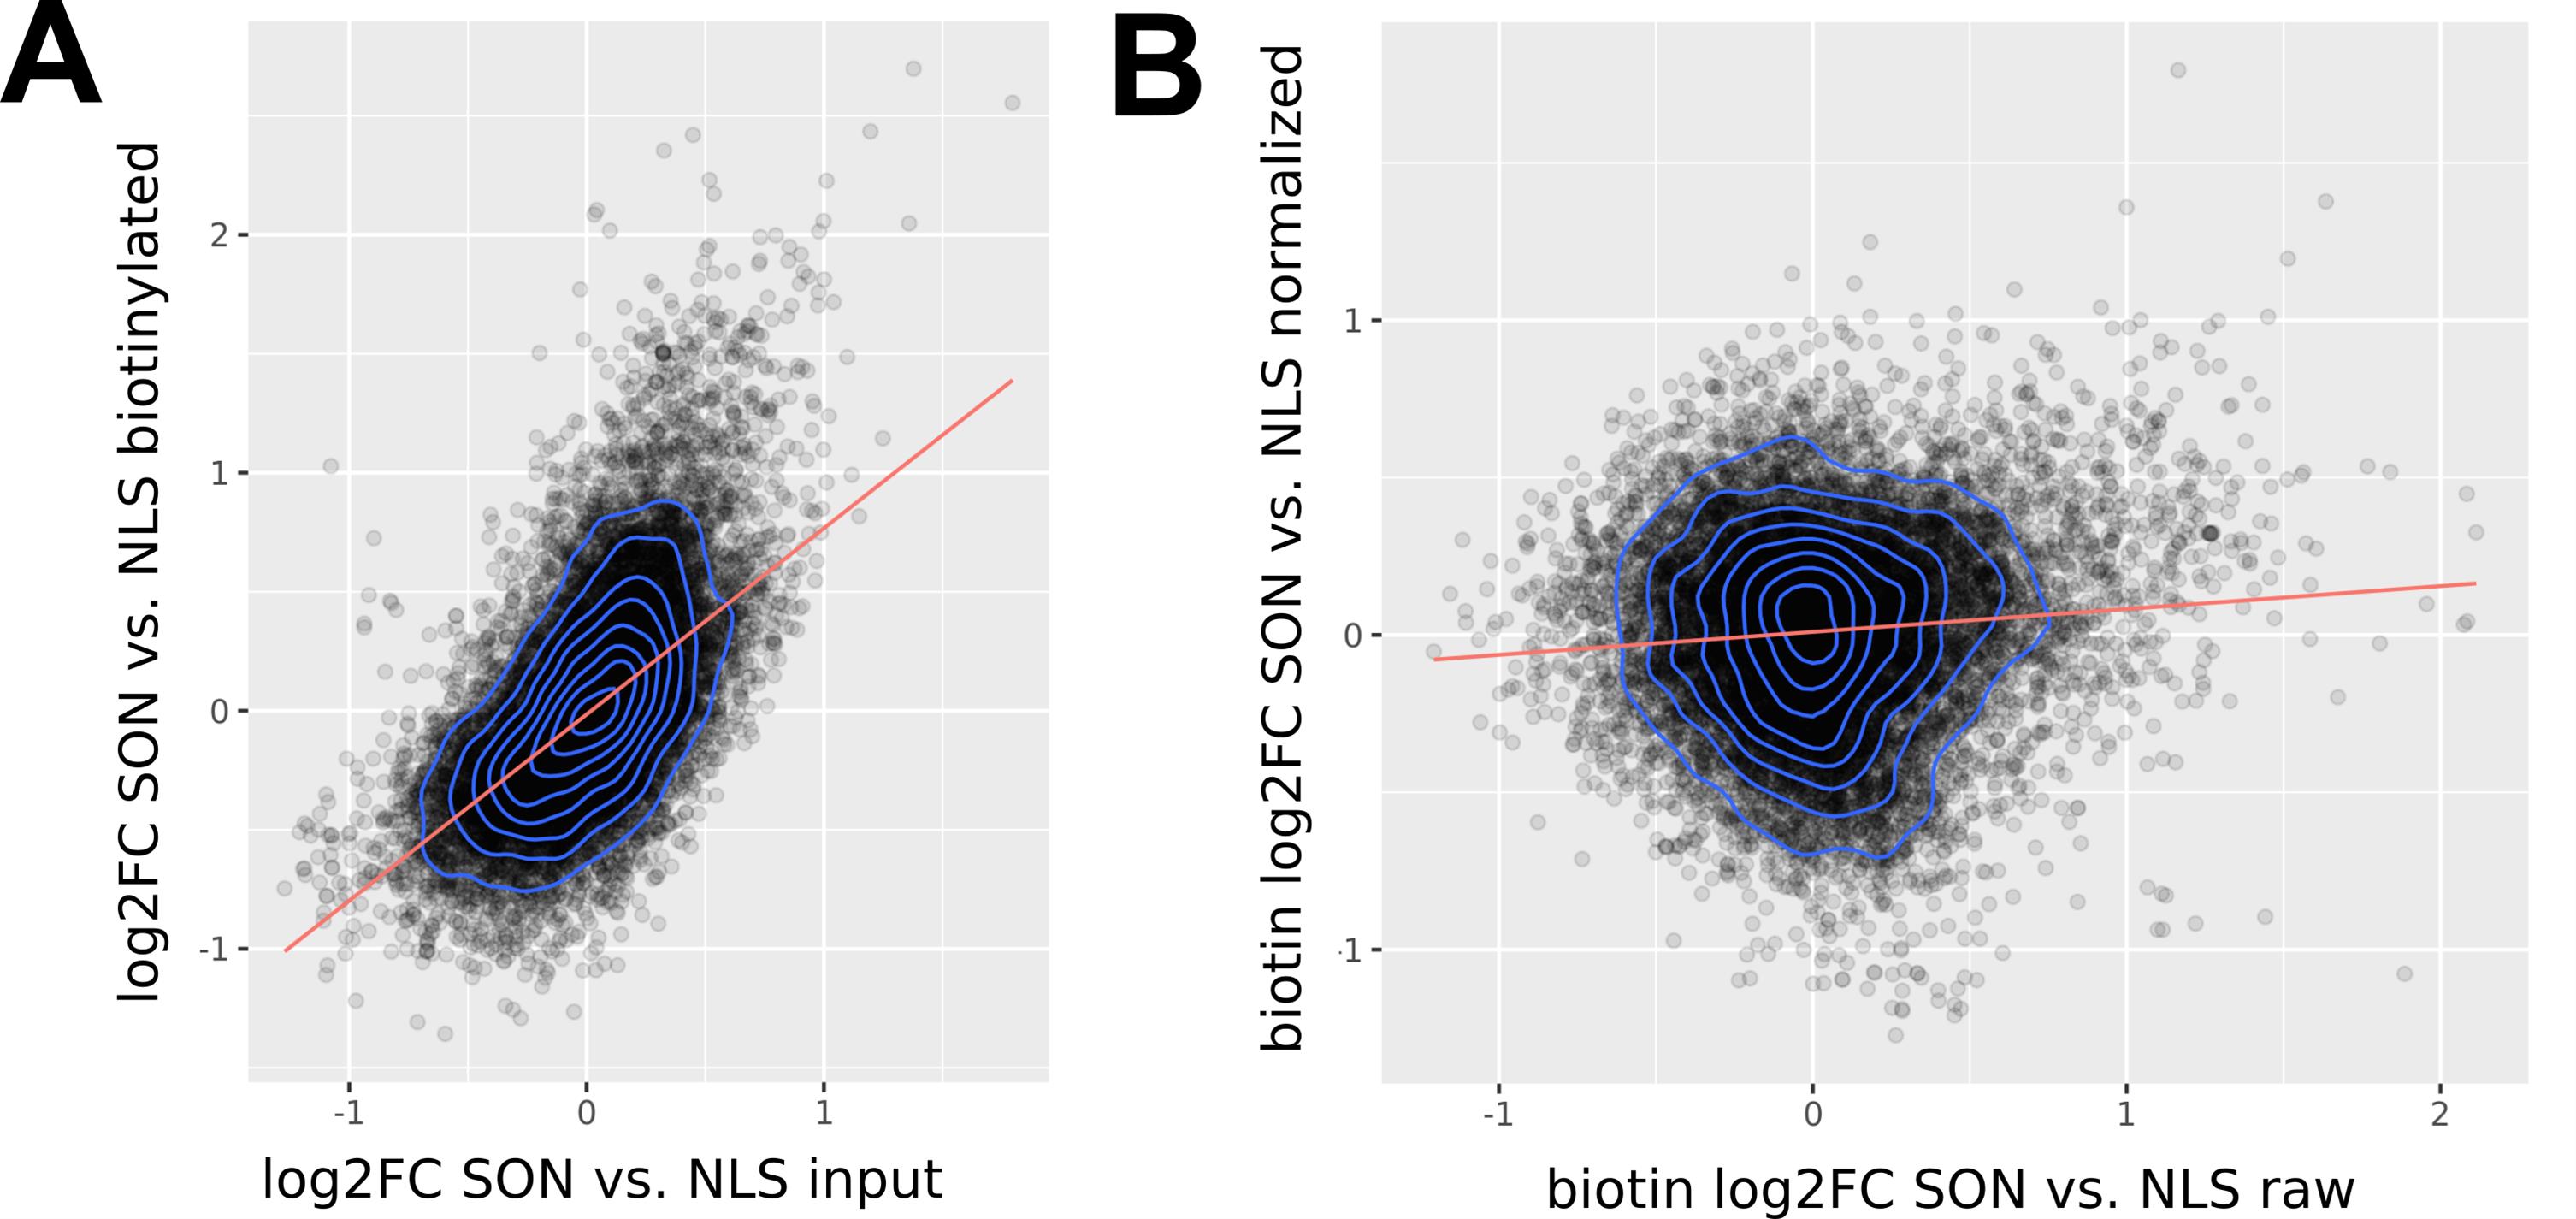
Figure 4. Example of linear model fit. (A) Example linear fit between log2FC of biotinylated samples vs. input samples for individual genes. The corrected log2FC of biotinylated samples is represented by the residuals of the data points to the linear fit. (B) Linear fit between raw log2FC of biotinylated samples vs. normalized values. Red lines indicate the linear fit.
Validation of protocol
This protocol or parts of it has been used and validated in the following research article(s):
McIntyre et al. [5] Phosphorylation of a nuclear condensate regulates cohesion and mRNA retention. Nature Communications (Figure 3).
We tested APEX2 labeling for nuclear speckle labeling in a second endogenously tagged cell line, MCF10As. While we observed biotinylation in a subset of cells in the absence of detergent, the labeling reaction was heterogeneous and inefficient (Figure 5A). Adding digitonin during incubation of the live cells with biotin improved labeling, similar to the effects in hiPSCs (Figure 5B). However, we recommend carefully titrating the concentration of detergent used on live cells, as excessive amounts of detergent can lead to deformation, detachment, and loss of cells (Figure 5B ).
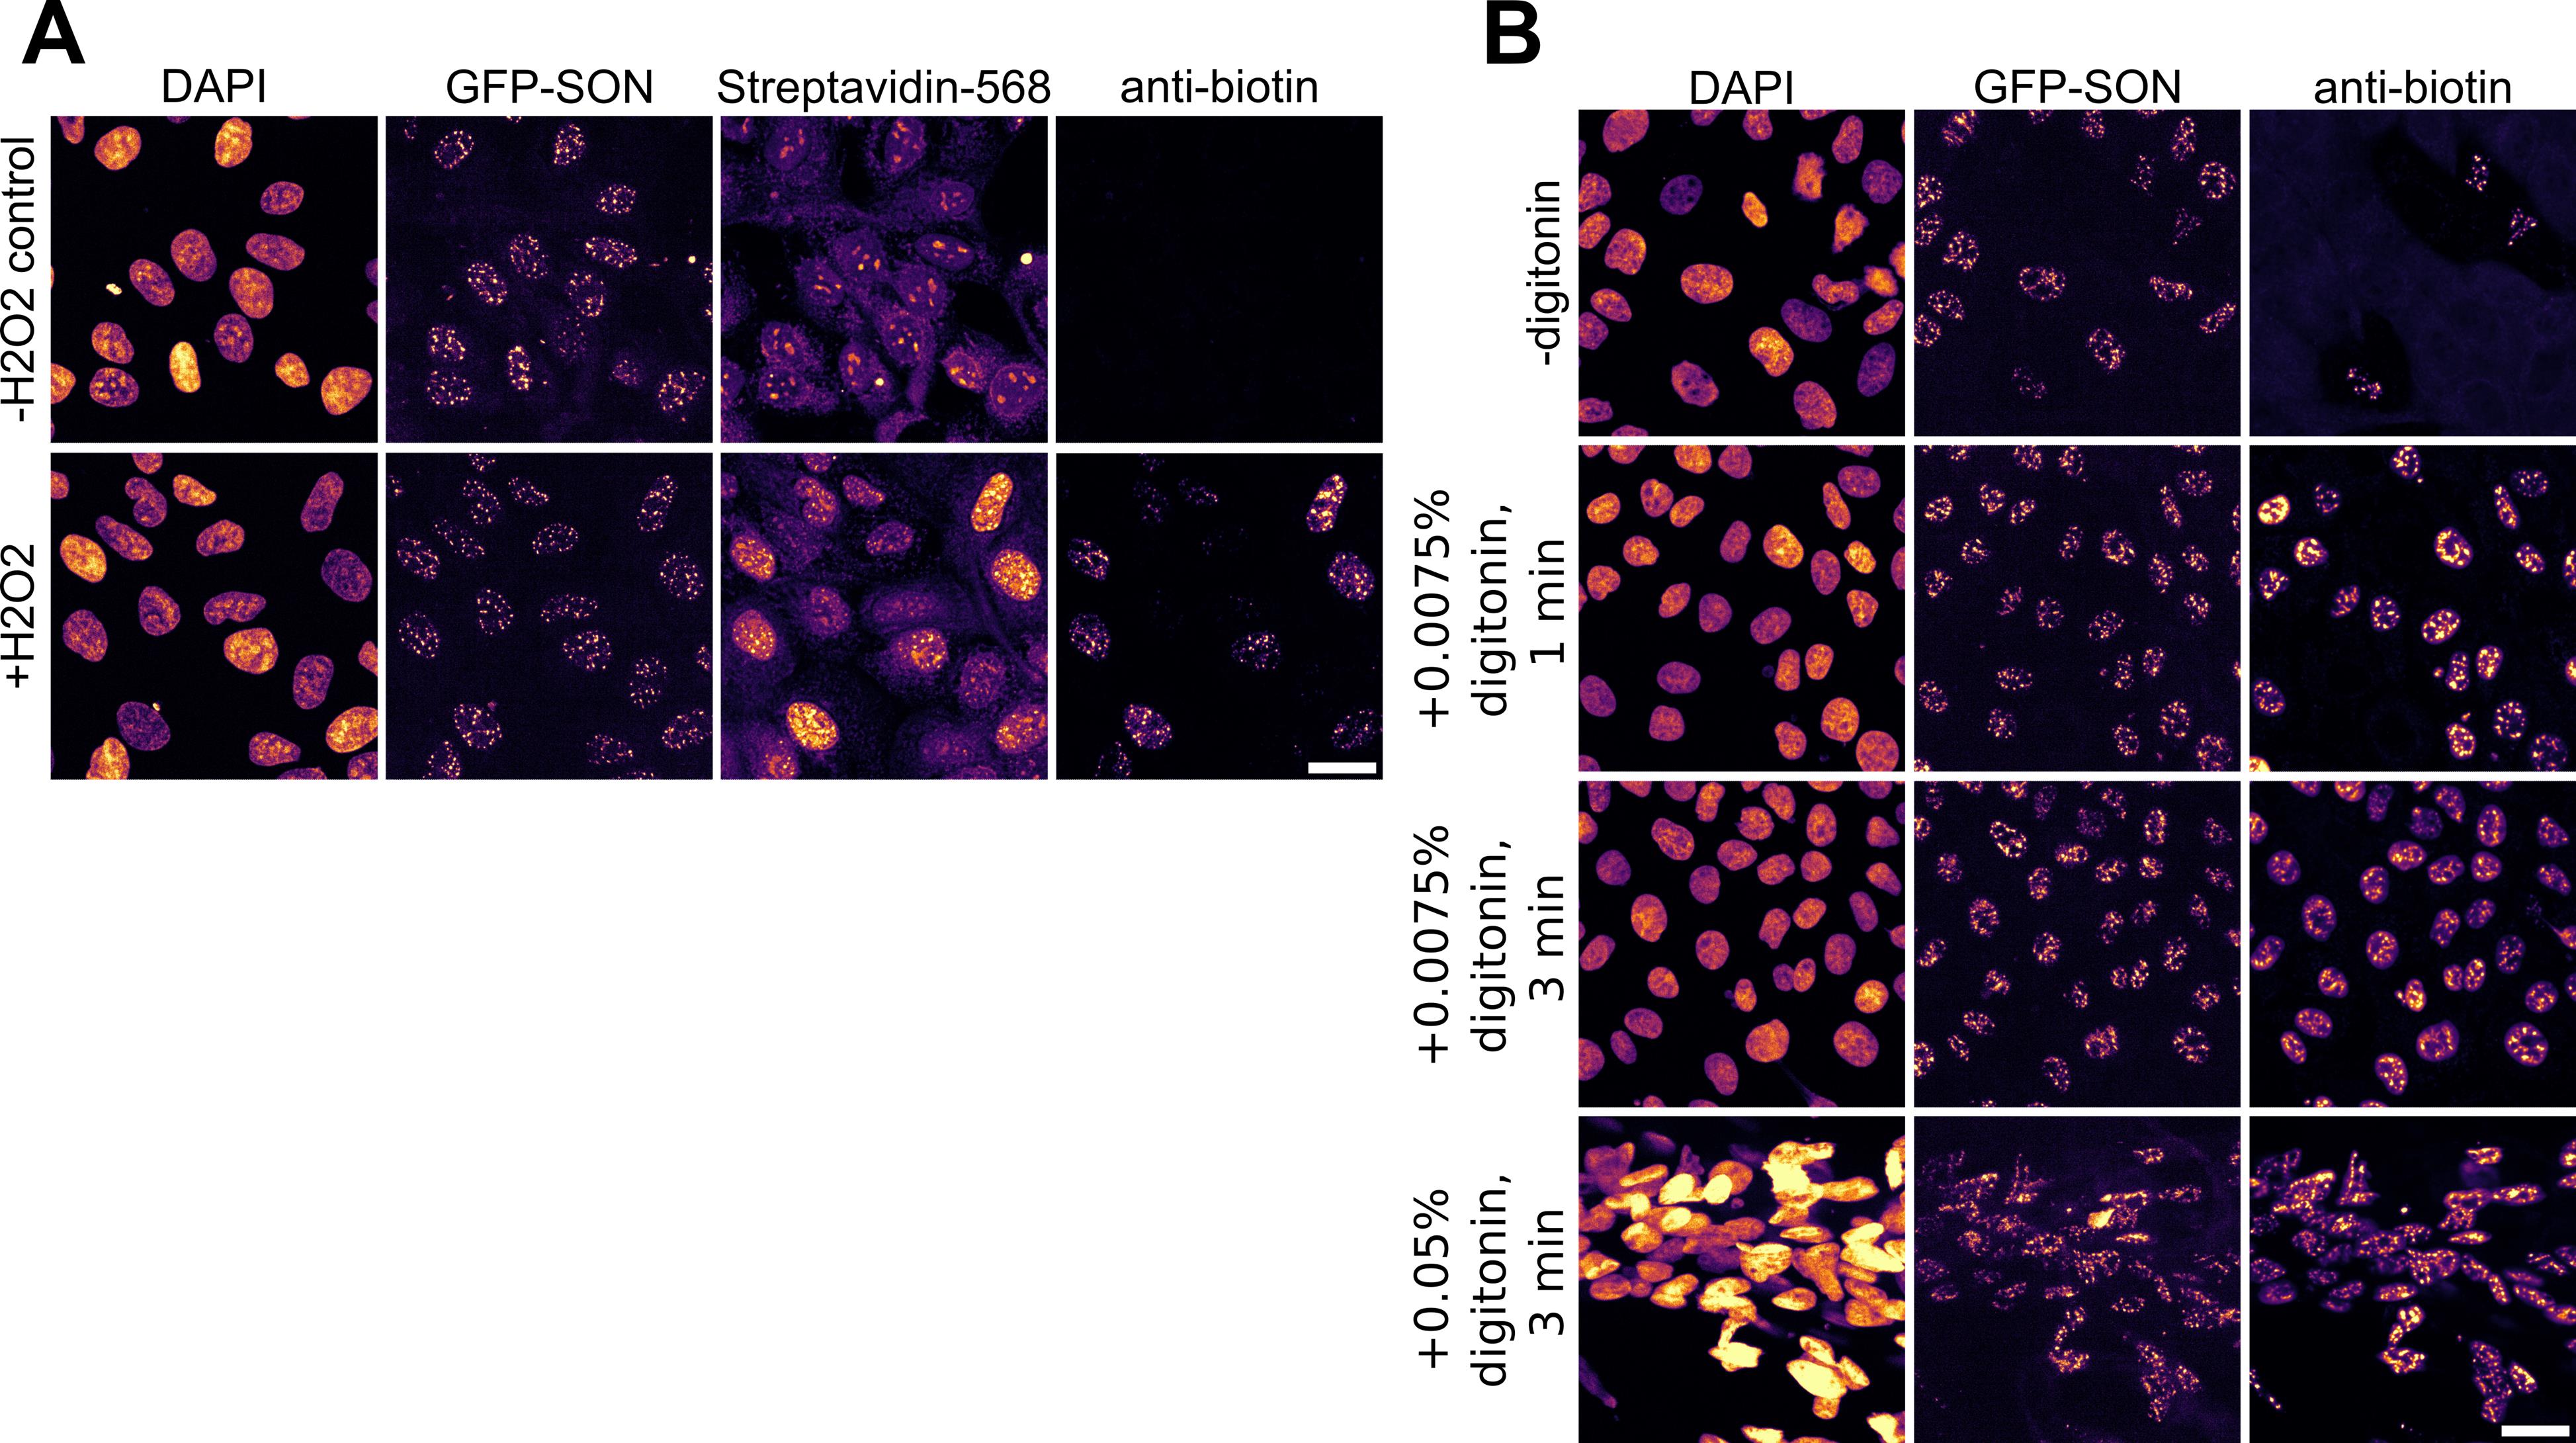
Figure 5.Validation of biotin labeling protocol in MCF10A cells. (A) APEX2-GFP-SON MCF10A cell line shows heterogeneous biotinylation rates across cells without detergent; streptavidin showed higher background staining than an anti-biotin antibody. (B) Digitonin increases biotinylation across MCF10A cells; cells detach under excess detergent. Scale bar, 20 μm.
General notes and troubleshooting
General notes
1. Whenever handling RNA in this protocol, ensure that you work in RNase-free conditions:
a. Clean workbenches and pipettes with RNase-away (or a similar product).
b. Use dedicated tips for pipetting when working with RNA.
c. Whenever possible, use commercial solutions and labware that are certified to be RNase-free.
d. Wear a lab coat to avoid contamination while handling the samples.
e. Store RNA samples at 4 °C during short breaks or transfer them to -80 °C for long-term storage. Avoid freeze-thawing.
2. Permeabilization with digitonin in live cells can lead to loss of RNA. We observed a decrease of around 40% in cytoplasmic mRNA from hiPSCs when permeabilizing with digitonin and then fixing cells and performing polyA FISH to measure mRNA (Figure 6A). However, mRNA levels in the nucleus were only minimally affected, with signal intensities in the overall nucleus and nuclear speckles showing a decrease of 10% and 7%, respectively. Special care should be taken when performing this assay in cell lines with cytoplasmic APEX2 localization.
The APEX2 enzyme remains active in fixed cells [14]. We found that fixation with 1% PFA for 10 min at room temperature, followed by permeabilization in 0.25% Triton X-100 for 5 min at room temperature, before performing the biotin labeling assay, results in biotin labeling in hiPSCs (Figure 6B). In cases where biotin uptake is a limiting factor and the APEX2 enzyme localizes to the cytoplasm, performing the assay in fixed cells may offer an alternative approach. Performing the assay in fixed and permeabilized samples can also be an alternative approach if permeabilization with a mild detergent does not lead to sufficient biotin uptake and may be a useful step to validate the expression and localization of the APEX2 enzyme if results in live cells remain ambiguous.
3. We observed higher background staining when staining for biotin with fluorophore-coupled streptavidin compared to anti-biotin antibody in MCF10A cells. We recommend the antibody approach if results of streptavidin-based staining are unclear.
4. Besides cellular uptake of biotin-phenol, the concentration of biotin-phenol and H 2O2 can affect the efficiency of the biotin labeling reaction [15]. If the protocol with or without digitonin still does not give satisfactory results, consider titrating the concentration of biotin-phenol and H2O2 .
5. In some cases, it might be beneficial to increase the reactivity of the biotin labeling reaction toward nucleic acids. Previous research has shown that alternative APEX2 substrates, for example, biotin-aniline, show higher reactivity toward nucleic acids [16]. In addition, the metabolic incorporation of electron-rich ribonucleosides has been shown to enhance the nucleic acid labeling capacity of APEX2 [17,18].
6. We recommend collecting at least three biological replicates per APEX2 cell line and condition for sequencing.
7. To measure enrichment of biotinylated RNA in a specific subcellular compartment, an appropriate control is necessary. For example, if enrichment in a nuclear compartment is measured, a suitable control could be a cell line expressing APEX2 tagged with a nuclear localization signal.
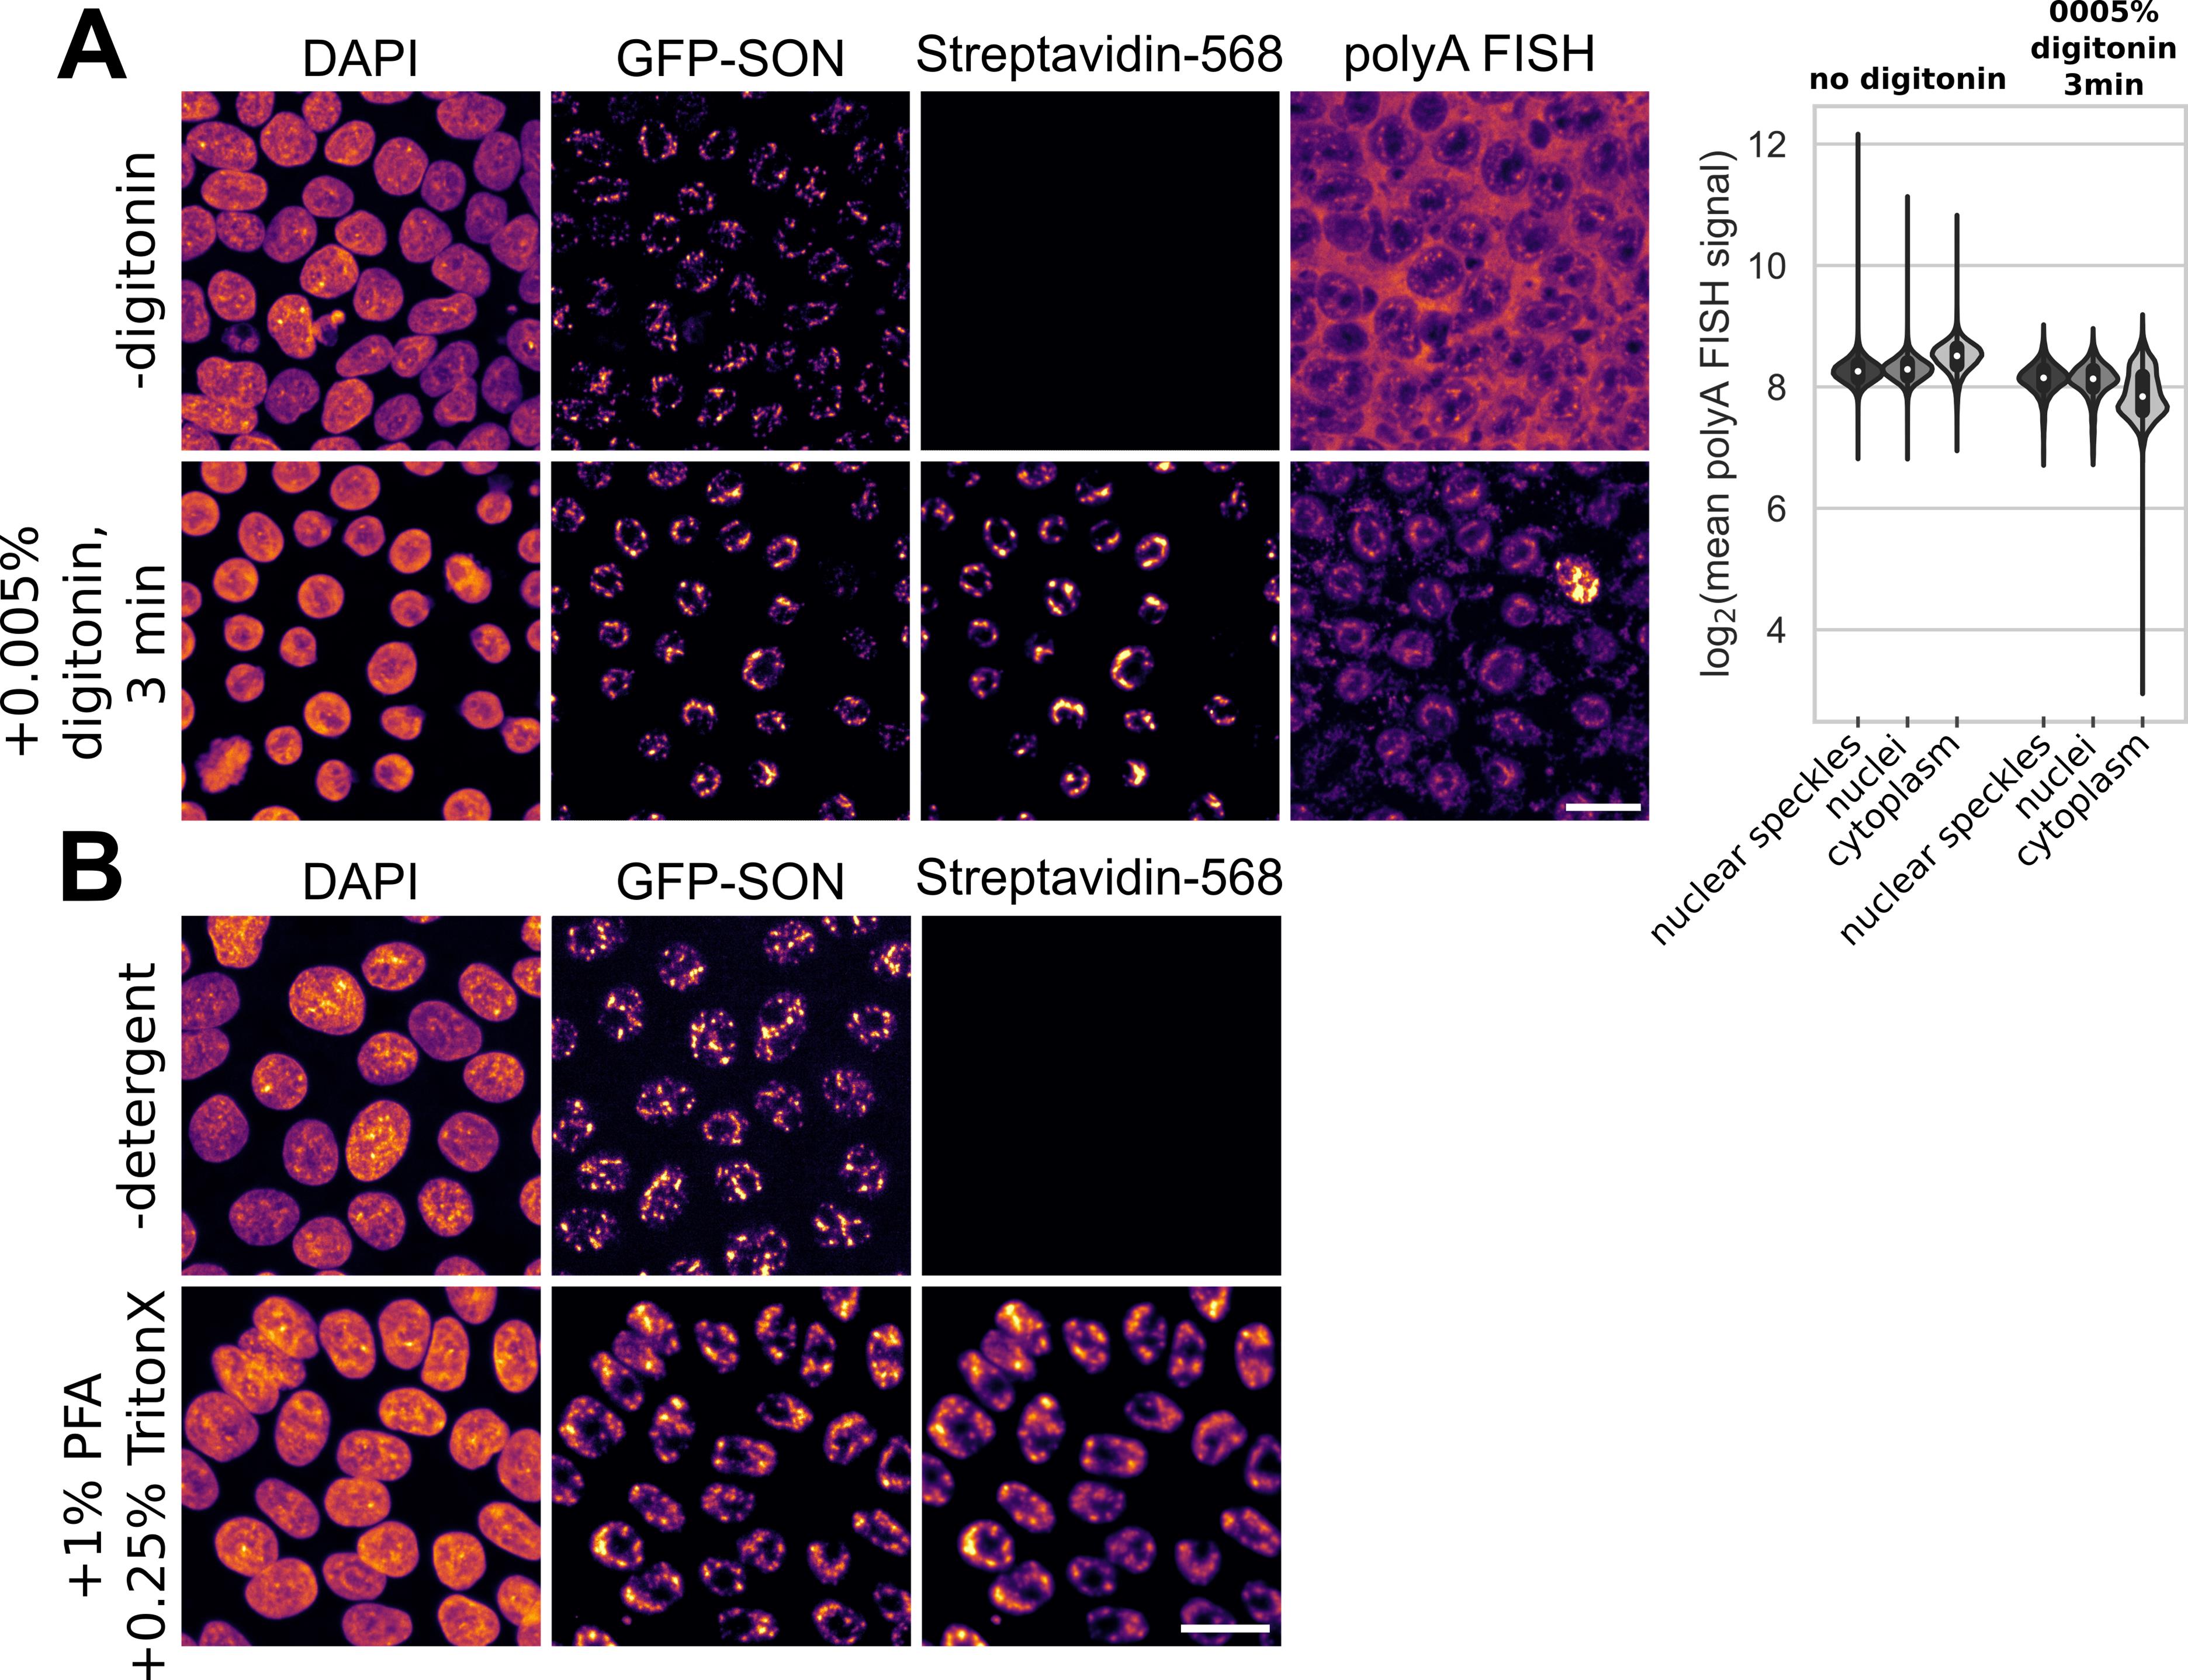
Figure 6. Digitonin treatment can lead to loss of cytoplasmic mRNA. (A) When including a mild detergent, like digitonin, during biotin incubation, levels of cytoplasmic mRNA can be affected. However, nuclear mRNA is not strongly affected. Violin plots show quantification of the data shown in the images. Boxplots in the violin plots show IQR and median. (B) Fixation with 1% PFA for 10 min at room temperature, followed by permeabilization in 0.25% Triton X-100 for 5 min at room temperature, before performing the biotin labeling assay, results in biotin labeling in hiPSCs. Scale bars, 20 µm.
Troubleshooting
Problem 1: Uneven biotinylation levels across cells expressing similar levels of tagged protein.
Possible cause: Differences in biotin uptake.
Solution: Increase digitonin concentration or extend incubation time with biotin-phenol labeling solution.
Problem 2: Cell detachment.
Possible cause: Excess detergent concentration.
Solution: Decrease digitonin concentration or decrease incubation time with biotin-phenol labeling solution. If you use the standard incubation time with biotin-phenol labeling solution (3 min), start by decreasing the digitonin concentration.
Problem 3: Image-based validation shows that biotinylated molecules are not co-localized with APEX2-tagged protein.
Possible cause: RNAs are highly dynamic and relocalized during the hydrogen peroxide pulse.
Solution: Perform assay in fixed cells (see [14]).
Problem 4: Large amount of unbound RNA in the dot blot validation assay.
Possible cause: Streptavidin-coated beads are saturated, or there is not enough time to immobilize RNA.
Solution: Increase the volume of streptavidin-coated beads and increase the time for RNA binding to the beads.
Acknowledgments
Conceptualization, A.T. and A.M. Investigation, A.T. and A.M. Writing—Original Draft, A.T. and A.M.; Writing—Review & Editing, A.T., A.M., A.R., and L.P. Funding acquisition, A.M. and L.P. Supervision, L.P. This work was supported by funding from the European Molecular Biology Organization (EMBO ALTF-455-2020 A.M.), Marie Curie-Sklowdowska Action (MSCA, 101029269 A.M.), and Swiss National Science Foundation (grant 310030_192622 L.P.). The protocol was first described and validated in McIntyre and Tschan et al., 2025. The approach was developed based on work from the Ting Lab [1] and the Ingolia Lab [2], with input from [14,15,19]. Genome-sequencer-5 icon by DBCLS https://togotv.dbcls.jp/en/pics.html used in the workflow illustration is licensed under CC-BY 4.0 Unported https://creativecommons.org/licenses/by/4.0/.
Competing interests
The authors declare no conflicts of interest.
References
- Fazal, F. M., Han, S., Parker, K. R., Kaewsapsak, P., Xu, J., Boettiger, A. N., Chang, H. Y. and Ting, A. Y. (2019). Atlas of Subcellular RNA Localization Revealed by APEX-Seq. Cell. 178(2): 473–490.e26. https://doi.org/10.1016/j.cell.2019.05.027
- Padrón, A., Iwasaki, S. and Ingolia, N. T. (2019). Proximity RNA Labeling by APEX-Seq Reveals the Organization of Translation Initiation Complexes and Repressive RNA Granules. Mol Cell. 75(4): 875–887.e5. https://doi.org/10.1016/j.molcel.2019.07.030
- Qin, W., Cho, K. F., Cavanagh, P. E. and Ting, A. Y. (2021). Deciphering molecular interactions by proximity labeling. Nat Methods. 18(2): 133–143. https://doi.org/10.1038/s41592-020-01010-5
- Barutcu, A. R., Wu, M., Braunschweig, U., Dyakov, B. J., Luo, Z., Turner, K. M., Durbic, T., Lin, Z. Y., Weatheritt, R. J., Maass, P. G., et al. (2022). Systematic mapping of nuclear domain-associated transcripts reveals speckles and lamina as hubs of functionally distinct retained introns. Mol Cell. 82(5): 1035–1052.e9. https://doi.org/10.1016/j.molcel.2021.12.010
- McIntyre, A. B. R., Tschan, A. B., Meyer, K., Walser, S., Rai, A. K., Fujita, K. and Pelkmans, L. (2025). Phosphorylation of a nuclear condensate regulates cohesion and mRNA retention. Nat Commun. 16(1): 1–20. https://doi.org/10.1038/s41467-024-55469-3
- Haupt, A., Grancharova, T., Arakaki, J., Fuqua, M. A., Roberts, B. and Gunawardane, R. N. (2018). Endogenous Protein Tagging in Human Induced Pluripotent Stem Cells Using CRISPR/Cas9. J Visualized Exp. 138: e58130. https://doi.org/10.3791/58130
- Roberts, B., Haupt, A., Tucker, A., Grancharova, T., Arakaki, J., Fuqua, M. A., Nelson, A., Hookway, C., Ludmann, S. A., Mueller, I. A., et al. (2017). Systematic gene tagging using CRISPR/Cas9 in human stem cells to illuminate cell organization. Mol Biol Cell. 28: 2854–2874. https://doi.org/10.1101/123042
- Mudge, J. M., Carbonell-Sala, S., Diekhans, M., Martinez, J. G., Hunt, T., Jungreis, I., Loveland, J. E., Arnan, C., Barnes, I., Bennett, R., et al. (2024). GENCODE 2025: reference gene annotation for human and mouse. Nucleic Acids Res. 53: D966–D975. https://doi.org/10.1093/nar/gkae1078
- R Core Team, R: A language and environment for statistical computing., (2021). https://www.r-project.org/.
- Dobin, A., Davis, C. A., Schlesinger, F., Drenkow, J., Zaleski, C., Jha, S., Batut, P., Chaisson, M. and Gingeras, T. R. (2012). STAR: ultrafast universal RNA-seq aligner. Bioinformatics 29(1): 15–21. https://doi.org/10.1093/bioinformatics/bts635
- Liao, Y., Smyth, G. K. and Shi, W. (2019). The R package Rsubread is easier, faster, cheaper and better for alignment and quantification of RNA sequencing reads. Nucleic Acids Res. 47(8): e47–e47. https://doi.org/10.1093/nar/gkz114
- Bolger, A. M., Lohse, M. and Usadel, B. (2014). Trimmomatic: a flexible trimmer for Illumina sequence data. Bioinformatics. 30(15): 2114–2120. https://doi.org/10.1093/bioinformatics/btu170
- Love, M. I., Huber, W. and Anders, S. (2014). Moderated estimation of fold change and dispersion for RNA-seq data with DESeq2. Genome Biol. 15(12): 1–21. https://doi.org/10.1186/s13059-014-0550-8
- Tran, J. R., Paulson, D. I., Moresco, J. J., Adam, S. A., Yates, J. R., Goldman, R. D. and Zheng, Y. (2020). An APEX2 proximity ligation method for mapping interactions with the nuclear lamina. J Cell Biol. 220(1): e202002129. https://doi.org/10.1083/jcb.202002129
- Tan, B., Peng, S., Yatim, S. M. J., Gunaratne, J., Hunziker, W. and Ludwig, A. (2020). An Optimized Protocol for Proximity Biotinylation in Confluent Epithelial Cell Cultures Using the Peroxidase APEX2. STAR Protoc. 1(2): 100074. https://doi.org/10.1016/j.xpro.2020.100074
- Zhou, Y., Wang, G., Wang, P., Li, Z., Yue, T., Wang, J. and Zou, P. (2019). Expanding APEX2 Substrates for Proximity‐Dependent Labeling of Nucleic Acids and Proteins in Living Cells. Angew Chem Int Ed. 58(34): 11763–11767. https://doi.org/10.1002/anie.201905949
- Li, R., Zou, Z., Wang, W. and Zou, P. (2022). Metabolic incorporation of electron-rich ribonucleosides enhances APEX-seq for profiling spatially restricted nascent transcriptome. Cell Chem Biol. 29(7): 1218–1231.e8. https://doi.org/10.1016/j.chembiol.2022.02.005
- Huang, J., Zhao, R., Qin, S., Yang, S., Li, W., Mo, J., Wang, F., Du, Y., Weng, X., Zhou, X., et al. (2020). Cover Feature: 4‐Thiouridine‐Enhanced Peroxidase‐Generated Biotinylation of RNA (ChemBioChem 1/2021). ChemBioChem. 22(1): 4–4. https://doi.org/10.1002/cbic.202000825
- Mannix, K. M., Starble, R. M., Kaufman, R. S. and Cooley, L. (2019). Proximity labeling reveals novel interactomes in live Drosophila tissue. Development. 146(14): e176644. https://doi.org/10.1242/dev.176644
Article Information
Publication history
Received: Apr 10, 2025
Accepted: Jun 4, 2025
Available online: Jun 23, 2025
Published: Jul 5, 2025
Copyright
© 2025 The Author(s); This is an open access article under the CC BY-NC license (https://creativecommons.org/licenses/by-nc/4.0/).
How to cite
Tschan, A. B., Rai, A. K., Pelkmans, L. and McIntyre, A. B.R. (2025). APEX2 RNA Proximity Labeling in Mammalian Cell Lines With Low Biotin Permeability. Bio-protocol 15(13): e5372. DOI: 10.21769/BioProtoc.5372.
Category
Molecular Biology > RNA > RNA labeling
Cell Biology > Cell-based analysis
Biochemistry > RNA
Do you have any questions about this protocol?
Post your question to gather feedback from the community. We will also invite the authors of this article to respond.