- Protocols

- Articles and Issues
- For Authors
- About
- Become a Reviewer

High-Throughput Indirect Monitoring of TORC1 Activation Using the pTOMAN-G Plasmid in Yeast
(§Technical contact: melissa.gomez.r@usach.cl) Published: Vol 15, Iss 12, Jun 20, 2025 DOI: 10.21769/BioProtoc.5356 Views: 1644
Reviewed by: Ritu GuptaThibaud T. RenaultIsmail Tahmaz
Original research article
The authors used this protocol in:

Nov 2024
Advertisement


Protocol Collections
Comprehensive collections of detailed, peer-reviewed protocols focusing on specific topics


Related protocols
Abstract
The target of rapamycin complex 1 (TORC1) is a highly conserved protein complex whose primary function is to link nutrient availability to cell growth in eukaryotes, particularly nitrogen sources. It was originally identified during the screening of Saccharomyces cerevisiae strains resistant to rapamycin treatment. For its part, S. cerevisiae is well known for being a key model organism in biological research and an essential microorganism for the fermentation of food and beverages. This yeast is widely distributed in nature, with domesticated and wild strains existing. However, little is known about what effects domestication has had on its different phenotypes; for example, how nitrogen sources are sensed for TORC1 activation and what impact domestication has had on TORC1 activation are questions that still have no complete answer. To study the genetic basis of TORC1 activation associated with domestication through approaches such as quantitative trait loci (QTL) mapping or genome-wide association studies (GWAS), and more generally for any study requiring TORC1 activity as a readout for a large number of individuals, it is necessary to have a high-throughput methodology that allows monitoring the activation of this pathway in numerous yeast strains. In this context, the present protocol was designed to assess phenotypical differences in TORC1 activation using a new reporter plasmid, the pTOMAN-G plasmid, specifically designed to monitor TORC1 activation. As a proof of concept, this methodology allowed phenotyping a large population of yeast strains derived from the 1002 Yeast Genomes Project, the most complete catalog of genetic variation in yeasts. This protocol proved to be an efficient alternative to assess TORC1 pathway activation compared to techniques based on immunoblot detection, which, although effective, are considerably more laborious. Briefly, the protocol involves the design and construction of the pTOMAN-G plasmid, which carries a construct containing the firefly luciferase gene (Luc) under the control of the TORC1-regulated RPL26A gene promoter (PRPL26A). The protocol then details the process for selecting subgroups of yeasts based on their ability to grow under nutrient-limited conditions, using proline as the sole nitrogen source. These yeasts are then transformed with the TOMAN-G plasmid, using two alternative transformation methods. Finally, those yeasts that emit luminescence are selected, whose phenotype for TORC1 activation is measured by a nitrogen-upshift experiment in microculture. This approach, using the pTOMAN-G plasmid, offers a rapid and consistent method for assessing TORC1 signaling pathway activation in a large number of yeast strains, highlighting its usefulness to study the activation of the TORC1 pathway and the domestication process associated with it. In the future, a redesign of the plasmid could extend its use as a reporter tool to monitor the activation of the TORC1 pathway, or other pathways, in other yeast species.
Key features
• This protocol is specifically optimized for assessing TORC1 activation in microculture through nitrogen upshift experiments, enabling efficient high-throughput screening of numerous yeast strains.
• This protocol is an improved version of the method applied by Kessi-Pérez et al. [1], being less time-consuming and ensuring better comparability between strains.
• This protocol is only applicable to S. cerevisiae, although a redesign of the pTOMAN-G plasmid could extend its use to other yeast species.
Keywords: LuminescenceGraphical overview
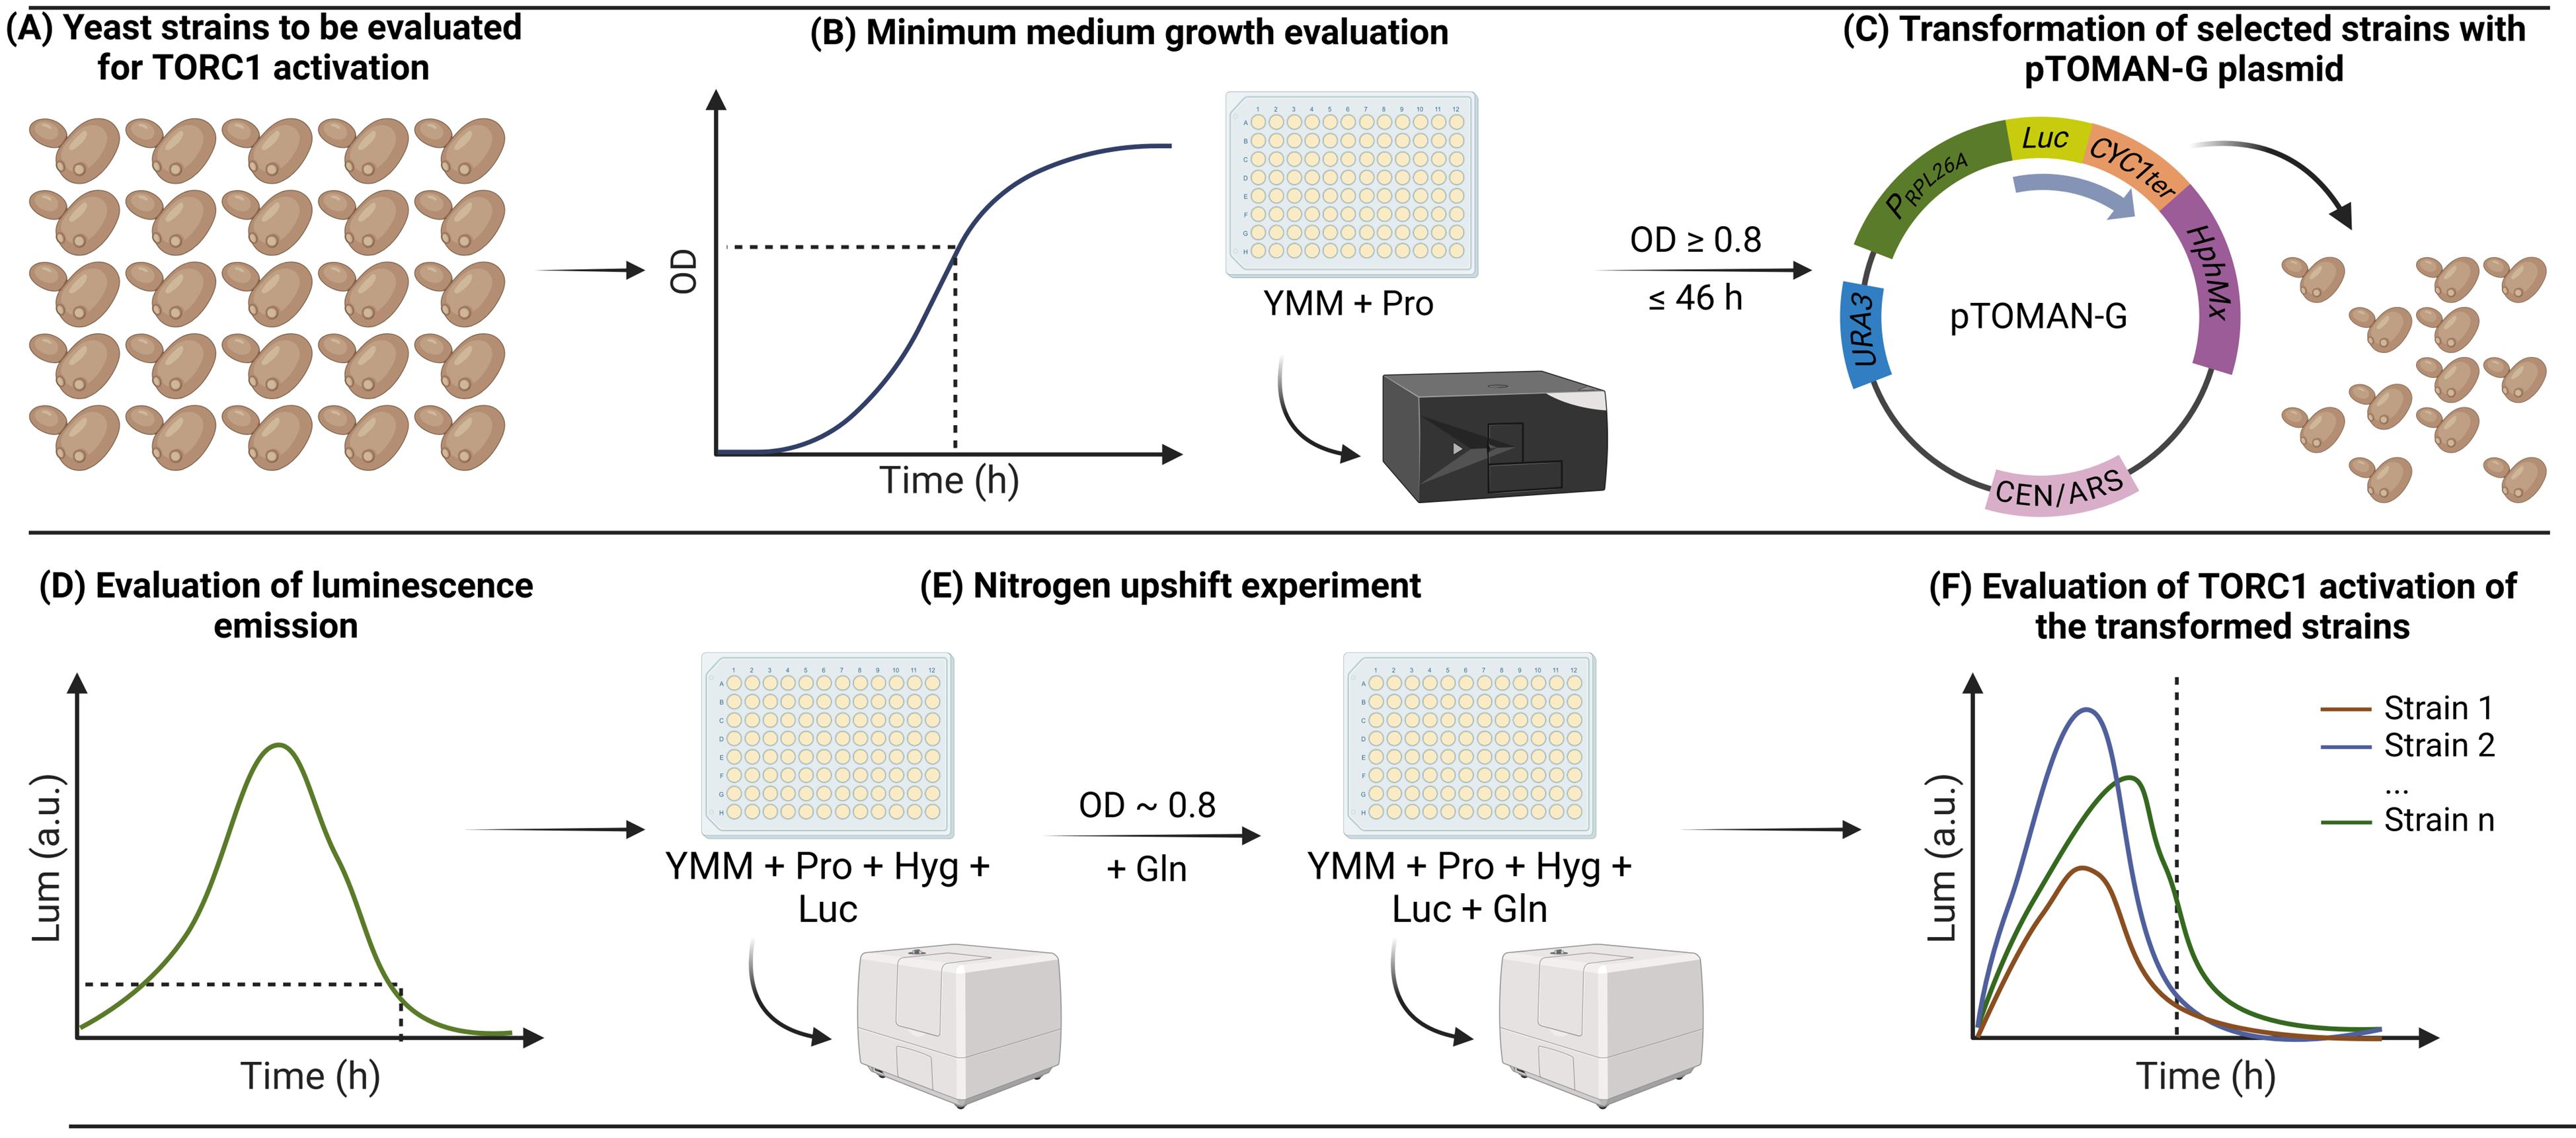
Overview of the method for high-throughput indirect monitoring of TORC1 activation using the pTOMAN-G plasmid in yeast. (A) Yeast strains to be evaluated for TORC1 activation are (B) grown in a minimum medium containing proline as the sole nitrogen source (YMM+Pro), and strains capable of growing to at least an optical density at 600 nm (OD600) of 0.8 in 46 h are (C) transformed with the pTOMAN-G reporter plasmid. Then, (D) the capacity of emitting luminescence by the transformed strains is evaluated, and strains that correctly emit luminescence are (E) evaluated by nitrogen upshift experiments in microculture. Finally, (F) the luminescence curves obtained after the nitrogen pulse are analyzed for every strain evaluated as a readout of TORC1 activation.
Background
Target of rapamycin complex 1 (TORC1) is a highly conserved protein complex whose primary function is to link nutrient availability to cell growth in eukaryotes, particularly nitrogen sources (such as ammonium and amino acids). It was identified during the screening of Saccharomyces cerevisiae strains resistant to rapamycin treatment [2], and since then, this yeast has been fundamental in most of the key advances in understanding the TORC1 signaling pathway [3]. S. cerevisiae, a yeast species well known for being a key model organism in biological research and an essential microorganism for the fermentation of food and beverages, is found in diverse ecological niches and is proposed to be a neutral nomad [4], able to thrive in a wide range of environments: these include natural ecosystems as well as those shaped by human activities, such as the fermentation of grapes for wine production [4]. Consequently, both wild and domesticated strains of this yeast species can be found in different ecological niches. On the other hand, little is known about the genotypic and phenotypic effects associated with the domestication of S. cerevisiae. In recent years, several studies have focused on studying the impact of domestication processes at both phenotypic and genetic levels [5–10], including TORC1 activation [11]. However, how nitrogen sources are sensed for TORC1 activation and what impact domestication has had on TORC1 activation are questions that still have no complete answer.
To study the genetic basis of TORC1 activation associated with domestication through approaches such as quantitative trait loci (QTL) mapping or genome-wide association studies (GWAS), and more generally for any study requiring TORC1 activity as a readout for a large number of individuals (e.g., library screening), it is necessary to have a high-throughput methodology that allows monitoring the activation of this pathway in numerous yeast strains. However, the two most widely used methods to study TORC1 activation, which use phosphorylation of the Sch9 kinase [12] or of the ribosomal protein S6 (Rps6) [13,14] as readouts, are both based on immunoblot detection, which makes them laborious and time-consuming and therefore difficult to use for the analysis of a large number of yeast strains. In this context, in a previous work, we generated a method for high-throughput indirect monitoring of TORC1 activation in microculture through nitrogen upshift experiments (in which yeasts are grown in a medium with proline as the sole nitrogen source, and in late-exponential phase, a nitrogen pulse is given to activate TORC1), using luminescence as a readout [1]. To achieve this, each yeast strain to be evaluated was transformed with a reporter construct containing the firefly luciferase gene (Luc) replacing its endogenous RPL26A open reading frame (ORF); RPL26A was selected because it is known to be expressed upon TORC1 activation and does not cause growth defects upon deletion [1]. This original method allowed us to interrogate the genetic basis associated with TORC1 activation by phenotyping a recombinant biparental population composed of 96 segregant yeast strains and performing QTL mapping [15]. Nevertheless, this methodology had room for improvement to be used with larger yeast populations with greater genotypic diversity, such as those typically used for GWAS. First, each yeast strain transformed with the reporter construct had to be verified by polymerase chain reaction (PCR) to ensure that the reporter construct was in the correct genomic locus, which was time-consuming. Even more important, each strain had the Luc gene controlled by its endogenous RPL26A gene promoter (PRPL26A), so differences in luminescence could be due to differences in the PRPL26A sequence and not to differences in TORC1 activation.
The present protocol was developed on the study by Rocha et al. [11] as an improvement of the previous methodology [1], where a reporter plasmid, called the pTOMAN-G plasmid, was generated. The use of this plasmid also allows for indirectly monitoring the activation of the TORC1 signaling pathway through the expression of the Luc gene under the control of PRPL26A, but it overcomes the aforementioned limitations. First, in the pTOMAN-G plasmid, the Luc gene is under the control of the PRPL26A obtained from the S. cerevisiae laboratory strain BY4741 (a haploid derived from strain S288c, which is the reference strain of the species), which ensures consistent regulation of the promoter in all transformed strains as each one has the same PRPL26A controlling Luc expression. Additionally, the use of a plasmid carrying an antibiotic resistance gene as a selectable marker facilitates the confirmation of transformant yeast strains, with no need for the PCR step. As a proof of concept, this improved method allowed monitoring the activation of the TORC1 signaling pathway quickly and effectively in a large yeast population, derived from the 1002 Yeast Genomes Project (a project that fully sequenced 1011 yeast strains from different ecological niches) [16], giving rise to the TOMAN-G population (which is composed of 270 yeast strains transformed with the TOMAN-G plasmid) [11]. As presented here, this protocol is restricted to yeast strains capable of growth on proline as the sole nitrogen source (because nitrogen upshift experiments require it) but could be extended to other types of experiments (e.g., TORC1 signaling inhibition by rapamycin) that would allow for the assessment of other aspects of TORC1 activation in even more yeast strains. Although in principle the applicability and efficacy of this protocol are restricted to S. cerevisiae, because the plasmid design includes amplified elements from the BY4741 strain genome (such as the PRPL26A sequence), a redesign of the plasmid could extend its use as a reporter tool to monitor activation of the TORC1 pathway, or other pathways, in other yeast species.
Materials and reagents
Biological materials
1. Yeast strains to be evaluated
2. Saccharomyces cerevisiae BY4741 strain, genotype: MATa; his3∆1; leu2∆0; met15∆0; ura3∆0 (this yeast strain is available at ATCC®, catalog number: 201388)
3. Escherichia coli DH5α strain, competent cells, genotype: F– ϕ80lacZΔ M15 Δ (lacZYA-argF) U169 recA1 endA1 hsdR17 (rK– mK+) phoA supE44 λ- thi–1 gyrA96 relA1 (Thermo Scientific, catalog number: EC0112)
4. pRS316 plasmid [17] (available at ATCC®, catalog number: 77145)
5. pRS426 plasmid including the luciferase reporter (Luc), CYC1 terminator (CYCTER), and the hygromycin cassette (HphMx) [18]
Note: The pTOMAN-G plasmid is available upon request from the authors.
Reagents
1. BD DifcoTM yeast nitrogen base without amino acids and ammonium sulfate (BD Biosciences, catalog number: 233520)
2. Yeast nitrogen base without amino acids (BD Biosciences, catalog number: 291940)
3. BD DifcoTM LB broth, Lenox (BD Biosciences, catalog number: 240230)
4. Dropout medium without uracil, histidine, leucine, and tryptophan (USBiological, catalog number: D9540)
5. Yeast extract powder (HuanKai Microbial, catalog number: HAM009)
6. D-glucose, anhydrous (ChemCruz, catalog number: sc-211203A)
7. BactoTM peptone (GibcoTM, catalog number: 211677)
8. Agar-agar (MilliporeSigma, catalog number: 1016141000)
9. D-luciferin, potassium salt (GoldBio, catalog number: LUCK-1G)
10. L-proline (Sigma-Aldrich, catalog number: P5607-100G)
11. L-glutamine (Sigma-Aldrich, catalog number: G3126-100G)
Note: See General note 2.
12. L-leucine (Sigma-Aldrich, catalog number: L8000-25G)
13. L-histidine (Sigma-Aldrich, catalog number: H8000-5G)
14. L-tryptophan (Sigma-Aldrich, catalog number: T0254-5G)
15. Hygromycin B (50 mg/mL) (GibcoTM, catalog number: 10687010)
16. Enzyme phusion flash high-fidelity master mix (Thermo ScientificTM, catalog number: F548S); contains all the necessary reaction components for PCR, except for template DNA and primers
17. Sorbitol (Millipore, catalog number: 56755-1KG)
18. Glycerol (Santa Cruz Biotechnology, Inc., catalog number: sc-29095)
19. Sheared salmon sperm DNA (10 mg/mL) (InvitrogenTM, catalog number: AM9680)
20. Lithium acetate dihydrate (Sigma-Aldrich, catalog number: L6883-250G)
21. Poly(ethylene glycol) 3350 (PEG 3350) (Sigma-Aldrich, catalog number: 202444-250G)
22. GeneJET Plasmid Miniprep kit (Thermo ScientificTM, catalog number: K0503)
23. Ampicillin sodium salt (USBiological, catalog number: A2260)
24. BamHI restriction enzyme (New England BioLabs, catalog number: R0136S)
25. XhoI restriction enzyme (New England BioLabs, catalog number: R0146S)
26. Zymoprep Yeast Plasmid Miniprep I kit (Zymo Research, catalog number: D2001)
27. Wizard® Genomic DNA Purification kit (Promega, catalog number: A1120)
28. GoTaq green master mix (Promega, catalog number: M7122)
29. UltraPureTM DNase/RNase-free distilled water (Thermo ScientificTM, catalog number 10977-023)
Note: Referred to as UPdH2O in the protocol, to distinguish it from regular distilled water (dH2O)
30. Lafken agarose (Fermelo Biotec, catalog number: FER00AL200G)
31. TAE (Tris, acetic acid, EDTA) buffer (Winkler, catalog number: BM-0490)
32. Zymolyase 20T (MP Biomedicals, catalog number: 320921)
Solutions
1. L-proline stock solution (50×) (see Recipes)
2. L-glutamine stock solution (30×) (see Recipes)
3. D-luciferin stock solution (25×) (see Recipes)
4. Yeast minimal medium (YMM) (see Recipes)
5. YMM+Pro/YMM+Pro+Hyg/YMM+Pro+Luc+Hyg (see Recipes)
6. YPD medium/YPD-Agar+Hyg medium (see Recipes)
7. Sorbitol 1 M (see Recipes)
8. Glycerol 30% (v/v) (see Recipes)
9. Lithium acetate 1 M (see Recipes)
10. Lithium acetate 100 mM (see Recipes)
11. Salmon sperm DNA carrier 2.0 mg/mL (see Recipes)
12. PEG 50% (w/v) (see Recipes)
13. Synthetic complete (SC) medium minus uracil (see Recipes)
14. Zymolyase 10 mg/mL (see Recipes)
15. Lysogeny broth (LB) medium (see Recipes)
Recipes
1. L-proline stock solution (50×)
Mix 250 mg of L-proline in 10 mL of dH2O. Then, sterilize with a 0.22 μm syringe filter. The stock solution should be prepared up to one week in advance and stored at 4 °C until use.
| Reagent | Final concentration | Quantity or volume |
|---|---|---|
| L-proline | 25 mg/mL | 250 mg |
| dH2O | n/a | 10 mL |
2. L-glutamine stock solution (30×)
Mix 150 mg of L-glutamine in 10 mL of dH2O. Then, sterilize with a 0.22 μm syringe filter. The stock solution should be prepared up to one day in advance and stored at 4 °C until use.
| Reagent | Final concentration | Quantity or volume |
|---|---|---|
| L-glutamine | 15 mg/mL | 150 mg |
| dH2O | n/a | 10 mL |
Note: See General note 2.
3. D-luciferin stock solution (25×)
Mix 400 mg of D-luciferin in 50 mL of dH2O. Then, sterilize with a 0.22 μm syringe filter. Aliquot into 1.5 mL tubes (1 mL each), protect from light, and store at -20 °C. D-luciferin stock solutions are stable for at least 5 freeze-thaw cycles.
| Reagent | Final concentration | Quantity or volume |
|---|---|---|
| D-luciferin | 25 mM | 400 mg |
| dH2O | n/a | 50 mL |
4. Yeast minimal medium (YMM)
Prepare 1 L of YMM. Mix 20 g of glucose and 1.71 g of yeast nitrogen base w/o amino acids and ammonium sulfate in 500 mL of dH2O. Then, complete to 1 L with dH2O and sterilize in an autoclave at 121 °C and 15 PSI for 15 min. YMM can be stored at room temperature for several months.
| Reagent | Final concentration | Quantity or volume |
|---|---|---|
| D-glucose | 2% | 20 g |
| Yeast nitrogen base w/o amino acids and ammonium sulfate | 0.171% | 1.71 g |
| dH2O | n/a | 1 L |
5. YMM+Pro/YMM+Pro+Hyg/YMM+Pro+Luc+Hyg
Prepare 50 mL. Mix the components according to the solution to be used. Prepare for immediate use.
| Reagent | Final concentration | Quantity or volume |
|---|---|---|
| L-proline stock solution (Recipe 1) | 0.5 mg/mL | 1 mL |
| D-luciferin stock solution (Recipe 3) | 1 mM | 2 mL |
| Hygromycin B (50 mg/mL) | 0.3 mg/mL | 0.3 mL |
| YMM (Recipe 4) | n/a | To 50 mL |
6. YPD medium/YPD-Agar+Hyg medium
Prepare 500 mL of YPD medium. Mix the reagents: 10 g of glucose, 5 g of yeast extract, 10 g of peptone, and 10 g of agar-agar (optional) in 400 mL of dH2O. Then, complete to 500 mL with dH2O and sterilize in an autoclave at 121 °C and 15 PSI for 15 min. Optional: When the medium has cooled down to approximately 50–55 °C, add 3 mL of hygromycin B, mix, and pour into plates. YPD medium can be stored at room temperature for several months, whereas YPD-Agar+Hyg medium plates should be stored at 4 °C for up to 1 month.
| Reagent | Final concentration | Quantity or volume |
|---|---|---|
| D-glucose | 2% | 10 g |
| Yeast extract | 1% | 5 g |
| Peptone | 2% | 10 g |
| Agar-agar (optional for plates) | 2% | 10 g |
| Hygromycin B (50 mg/mL) (optional for plates) | 0.3 mg/mL | 3 mL |
| dH2O | n/a | 500 mL |
7. Sorbitol 1 M
Prepare 100 mL of sorbitol 1 M. Mix 18.22 g of sorbitol in 80 mL of dH2O. Then, complete to 100 mL with dH2O and sterilize the solution using a 0.22 μm filter. Store at room temperature. Shelf life: 2 years.
| Reagent | Final concentration | Quantity or volume |
|---|---|---|
| Sorbitol | 1 M | 18.22 g |
| dH2O | n/a | 100 mL |
8. Glycerol 30% (v/v)
Prepare 100 mL of glycerol 30% (v/v). For this, measure 30 mL of glycerol using a graduated cylinder, add 60 mL of dH2O, and mix thoroughly. Transfer the solution to a 100 mL graduated cylinder and complete to 100 mL with dH2O. Sterilize in an autoclave at 121 °C and 15 PSI for 15 min. Store at room temperature. Shelf life: 3 years.
| Reagent | Final concentration | Quantity or volume |
|---|---|---|
| Glycerol | 30% | 30 mL |
| dH2O | n/a | 100 mL |
9. Lithium acetate 1 M
Prepare 100 mL of lithium acetate 1 M. Mix 10.2 g of lithium acetate in 80 mL of dH2O. Stir until the lithium acetate is completely dissolved and complete to 100 mL with dH2O. Sterilize in an autoclave at 121 °C and 15 PSI for 15 min. Store at room temperature. Shelf life: 2 years.
| Reagent | Final concentration | Quantity or volume |
|---|---|---|
| Lithium acetate | 1 M | 10.2 g |
| dH2O | n/a | 100 mL |
10. Lithium acetate 100 mM
Prepare 100 mL of lithium acetate 100 mM. Mix 10 mL of lithium acetate and 90 mL of sterile dH2O. Store at room temperature until ready to use.
| Reagent | Final concentration | Quantity or volume |
|---|---|---|
| Lithium acetate | 100 mM | 1.02 g |
| Sterile dH2O | n/a | 100 mL |
11. Salmon sperm DNA carrier 2.0 mg/mL
Prepare 1 mL of salmon sperm DNA carrier solution at 2.0 mg/mL from the sheared salmon sperm DNA (10 mg/mL) stock. Store at -20 °C, ensuring to avoid repeated freeze-thaw cycles. The solution remains stable for up to one year.
| Reagent | Final concentration | Quantity or volume |
|---|---|---|
| Salmon sperm DNA carrier (10 mg/mL) | 2.0 mg/mL | 200 μL |
| UPdH2O | n/a | 800 μL |
12. PEG 50% (w/v)
Prepare 100 mL of PEG 50% (w/v). In a volumetric flask, dissolve 50 g of PEG 3350 in 60 mL of dH2O, stirring with a magnetic stirrer until fully dissolved. Adjust the volume to exactly 100 mL with dH2O. Transfer the solution to an airtight container and sterilize in an autoclave at 121 °C and 15 PSI for 15 min. Store the solution tightly sealed, protected from light. Shelf life: 1 year stored at 4 °C.
| Reagent | Final concentration | Quantity or volume |
|---|---|---|
| PEG 3350 | 50% | 50 g |
| dH2O | n/a | 100 mL |
13. Synthetic complete (SC) medium minus uracil
Prepare 500 mL of SC medium minus uracil by mixing the reagents in 400 mL of dH2O. Stir until the reagents are fully dissolved, then adjust the volume to 500 mL with dH2O. Sterilize the medium in an autoclave at 121 °C and 15 PSI for 15 min. Optionally, pour plates for solid medium if required. Protect from light and prepare it for immediate use.
| Reagent | Final concentration | Quantity or volume |
|---|---|---|
| YNB | 0.68% | 3.4 g |
| D-glucose | 2% | 10 g |
| Dropout medium without uracil, histidine, leucine, and tryptophan | 0.2% | 1 g |
| L-Histidine | 0.002% | 10 mg |
| L-Leucine | 0.01% | 50 mg |
| L-Tryptophan | 0.002% | 10 mg |
| Agar-agar (optional for plates) | 2% | 10 g |
| dH2O | n/a | 500 mL |
14. Zymolyase 10 mg/mL
| Reagent | Final concentration | Quantity or volume |
|---|---|---|
| Zymolyase 20T | 10 mg/mL | 10 mg |
| Molecular biology nuclease-free dH2O | n/a | 1 mL |
15. Lysogeny broth (LB) medium
Prepare 500 mL of LB medium by mixing the reagents in 400 mL of dH2O. Stir until the reagents are fully dissolved, then adjust the volume to 500 mL with dH2O. Sterilize the medium in an autoclave at 121 °C and 15 PSI for 15 min. Optionally, pour plates for solid medium if required; if needed, when the medium has cooled down to approximately 50–55 °C, add 500 μL of ampicillin, mix, and pour into plates. LB medium can be stored at room temperature for several months.
| Reagent | Final concentration | Quantity or volume |
|---|---|---|
| DifcoTM LB broth | 2% | 10 g |
| Agar-agar (optional for plates) | 1.5% | 7.5 g |
| Ampicillin sodium salt (100 mg/mL) (optional for bacterial selection, add it after the sterilization process) | 100 µg/mL | 500 μL |
| dH2O | n/a | 500 mL |
Laboratory supplies
1. Syringe filters, MCE membrane, 30 mm, 0.22 μm, sterile (Jet Biofil, catalog number: FMC201030-ZX)
2. 96-well plate transparent bottom, sterile (SPL Life Sciences, catalog number: 30096)
3. 96-well plate white/optical bottom, non-treated surface, no lid, non-sterile (Thermo ScientificTM, catalog number: 265302)
4. Electroporation cuvettes, 2 mm (Genesee Scientific, catalog number: 40-101)
5. Conical tubes, 15 mL (Jet Biofil, catalog number: CFT011150-ZX)
6. Conical tubes, 50 mL (Jet Biofil, catalog number: CFT011500-ZX)
7. 14 mL culture tubes (FalconTM, catalog number: 352057)
8. Pipette tips, 10 μL (Tarsons, catalog number: 521000)
9. Pipette tips, 200 μL (Tarsons, catalog number: 521010-Y)
10. Pipette tips, 1,000 μL (Tarsons, catalog number: 521020-B)
11. Microcentrifuge tubes, 1.5 mL (Servicebio, catalog number EP-150-J)
12. Multichannel micropipette, 12 × 20 (GilsonTM, catalog number: F144071)
13. Multichannel micropipette, 12 × 200 μL (GilsonTM, catalog number: F144073)
14. Micropipette, 2 μL (GilsonTM, catalog number: F144054M)
15. Micropipette, 20 μL (GilsonTM, catalog number: F144056M)
16. Micropipette, 200 μL (GilsonTM, catalog number: F144058M)
17. Micropipette, 1,000 μL (GilsonTM, catalog number: F144059M)
18. Sterile cryogenic tubes, 2 mL (SSI Bio, catalog number: 2341-S0)
19. Petri dish 90 × 14 mm (Tarsons, catalog number: 460095)
20. 0.2 mL PCR tubes (Citotest, catalog number: 5460-0001)
22. Parafilm (Amcor, catalog number: PM-996)
22. Disposable gloves (Health Touch, catalog number: GEE1222)
23. Smear loop (Deltalab, catalog number: 302755)
24. Cell spreader (Deltalab, catalog number: 200500.1)
Equipment
1. SynergyTM HTX multi-mode microplate reader (BioTek Instruments, Inc., model: S1LFA)
Note: The use of this equipment cannot be replaced by that of the SunriseTM microplate reader.
2. SunriseTM absorbance reader with temperature control (Tecan Group Ltd., model: Sunrise)
Note: The use of this equipment may be replaced by that of the SynergyTM HTX microplate reader.
3. Electroporation system (Bio-Rad Laboratories, Inc., model: Gene Pulser XcellTM)
4. Microcentrifuge refrigerated (Gyrozen Co., Ltd., model: 1730R)
5. Centrifuge for conical tubes (Kubota Corporation, model: S300TR)
6. Centrifuge with a rotor A6-50P for 50 and 15 mL tubes (DLAB, model: DM0412)
7. Thermal cycler (Bio-Rad, model: T100)
8. Incubator at 30 °C (Faithful, model: DH4000BII)
9. Incubator at 37 °C (Breed Elos, model: B055F230)
10. Shaker incubator at 30 °C (LabTech, model: LSI-3016R)
11. Shaker incubator at 37 °C (LABWIT, model: Benchtop)
12. Laminar flow cabinet (BIOBASE, model: BBS-V800)
13. Thermal bath (LabTech, model: LWB-106D)
14. Heat block (DLAB, model: HB120-S)
15. Power supplies (C.B.S. Scientific, model: 300 Series)
16. Electrophoresis chamber (Fermelo Biotec, model: H2)
17. UV/Vis spectrophotometer (MicroDigital, model: Nabi)
Software and datasets
1. BioTek Gen5 software (BioTek Instruments, Inc., version 3.16.10)
2. Microsoft Office (Microsoft Corporation, version 16.91)
Note: Microsoft Office is a relevant software, because the data generated in the SynergyTM HTX microplate reader is extracted as Excel files from the BioTek Gen5 software.
3. Online platform Benchling for in silico design and other bioinformatics analyses (https://www.benchling.com/)
4. GraphPad Prism software (GraphPad Software, LLC., version 7.04)
5. Sanger sequencing service (Macrogen Inc., Republic of Korea)
6. Primer synthesis (Macrogen Inc., Republic of Korea)
Procedure
A. Construction of the pTOMAN-G plasmid
To indirectly monitor TORC1 signaling pathway activation in yeast, begin by constructing the pTOMAN-G plasmid, following the detailed instructions in sections A1–A8 below. An overview of the plasmid assembly is provided in Figure 1, and further details on its sequence are provided in Supplementary information (Sequence S1 and Figure S1).
Note: The pTOMAN-G plasmid is available upon request from the authors.
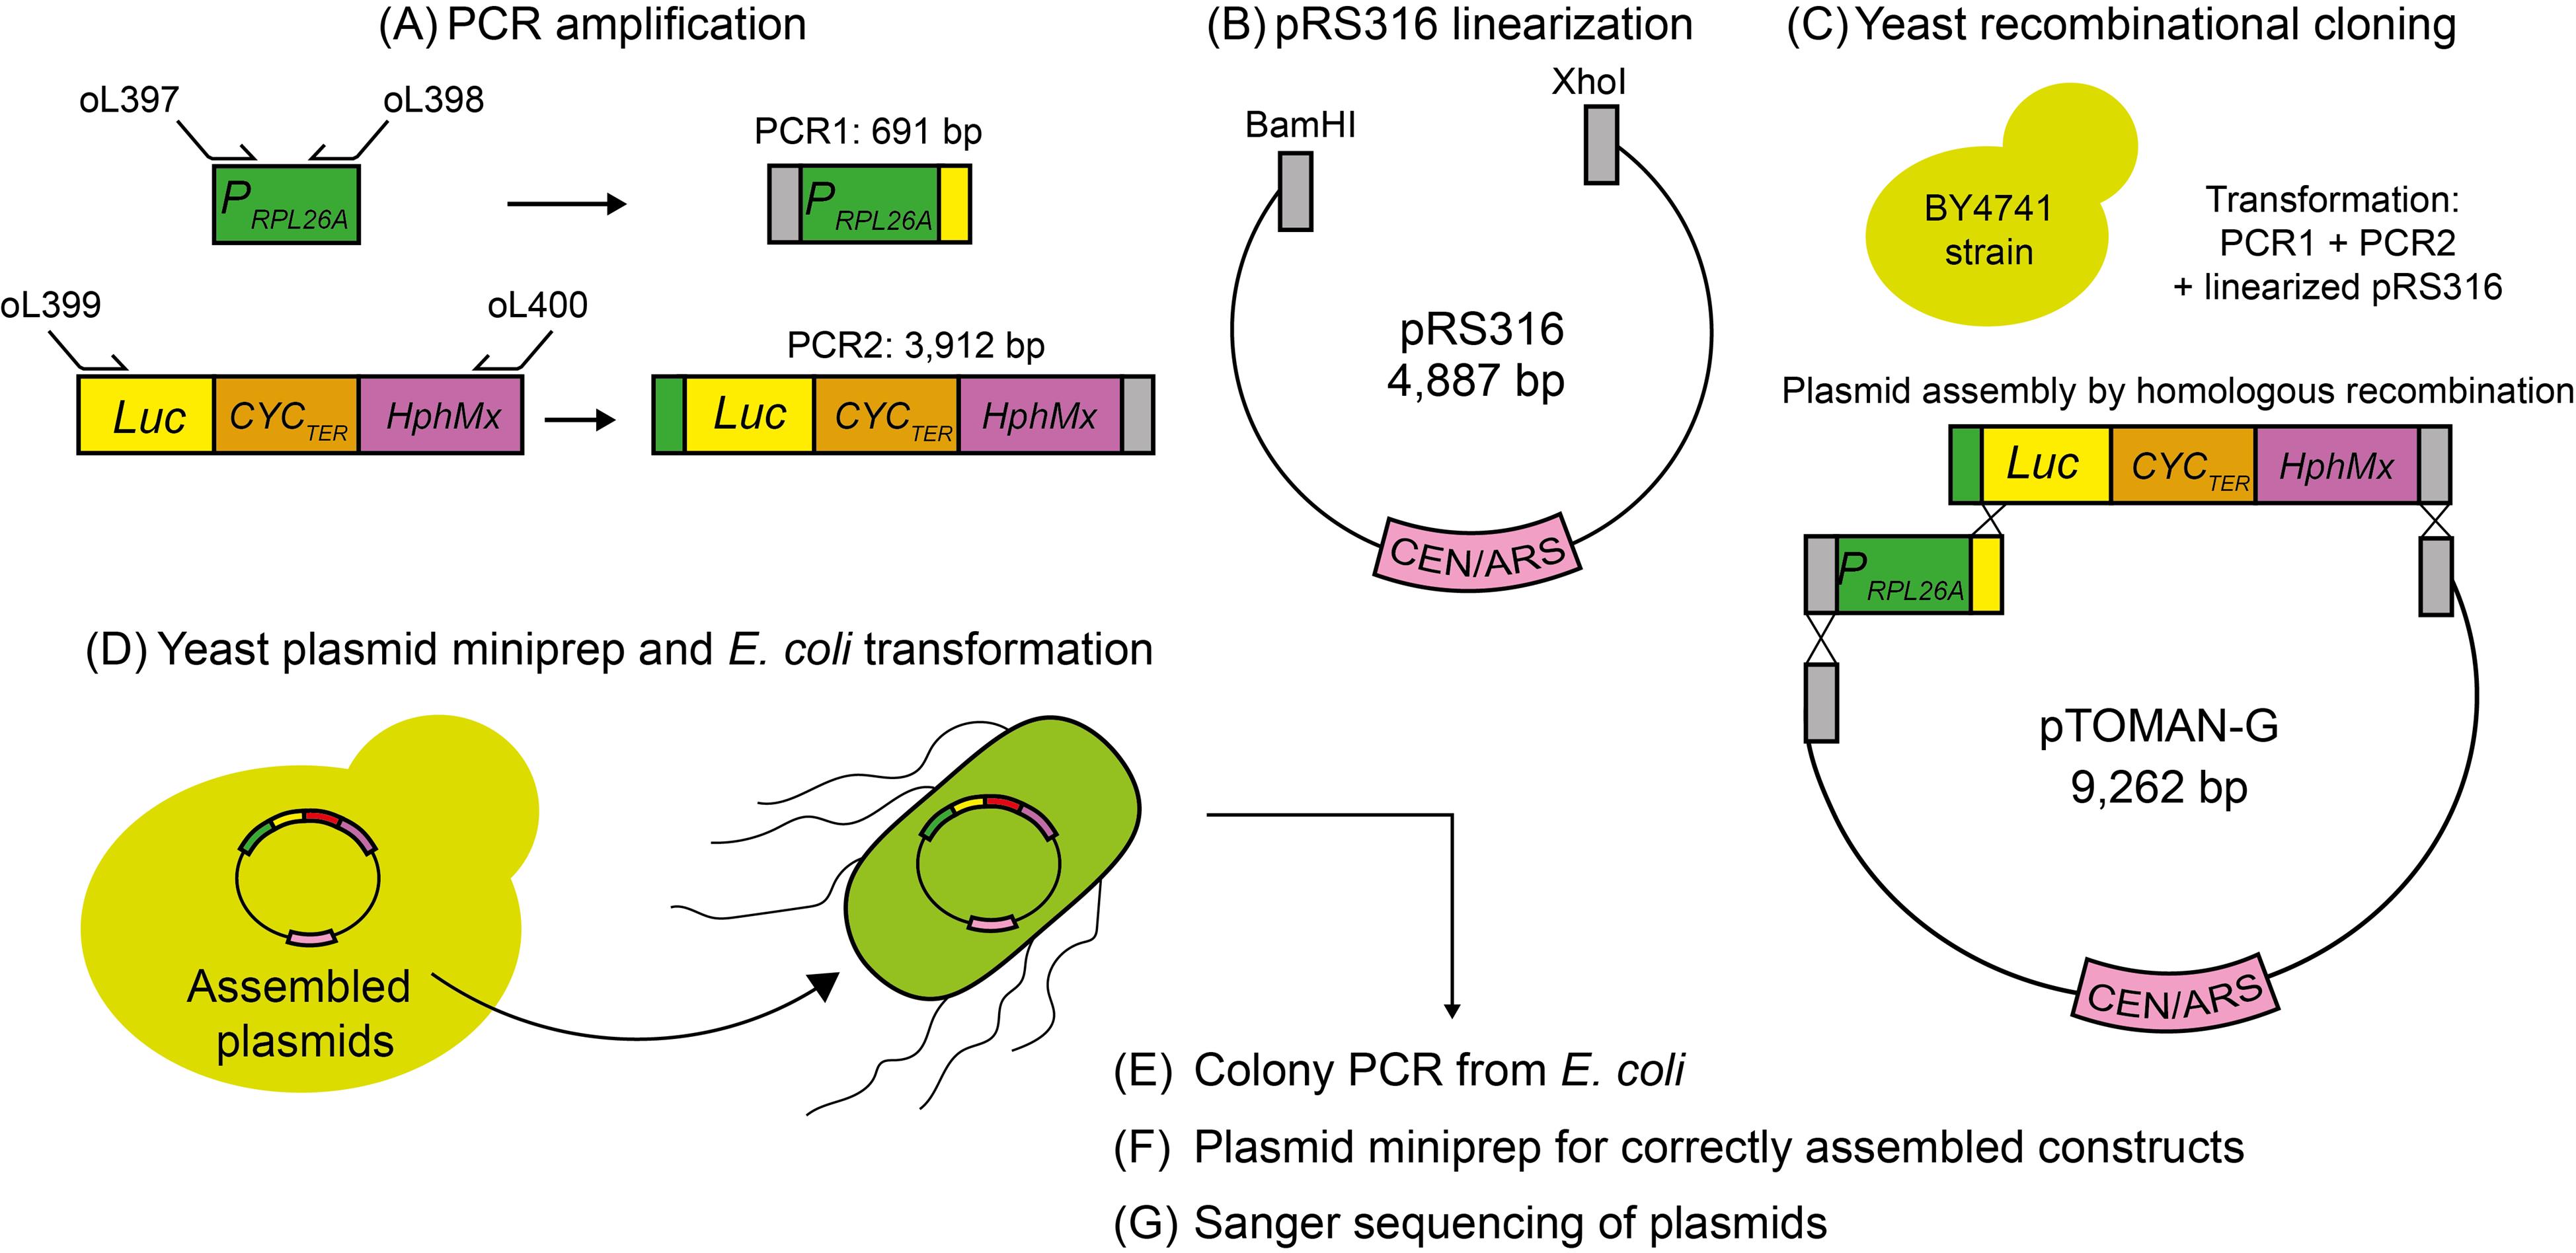
Figure 1. Overview of the protocol for pTOMAN-G plasmid assembly. (A) The RPL26A promoter (PRPL26A) is amplified by PCR (PCR1) using primers oL397 (forward) and oL398 (reverse). In addition, a genetic construct including the luciferase (Luc) reporter gene fused to the CYC1 terminator (CYCTER) and the hygromycin cassette (HphMx) was amplified by PCR (PCR2) using primers oL399 (forward) and oL400 (reverse). (B) The pRS316 plasmid is linearized using the BamHI and XhoI restriction enzymes. (C) The PCR1, PCR2, and linearized pRS316 are co-transformed into the BY4741 yeast strain for yeast recombinational cloning. (D) Assembled plasmids are extracted from yeast and transformed into E. coli. (E) Colony PCR from E. coli allows confirmation of the correctly assembled plasmid. (F) Three positive colonies from different colony PCR reactions are subjected to plasmid DNA extraction. (G) Selected plasmids are confirmed by Sanger sequencing. A plasmid without errors in the sequence of the RPL26A promoter and Luc reporter is selected as the pTOMAN-G plasmid.
A1. PCR amplification of DNA fragments included in the pTOMAN-G plasmid
1. Design primers for PCR amplification of the different fragments included in the pTOMAN-G plasmid. The sequence of the designed primers can be found in Table 1.
Notes:
1. Primer design can be carried out using the Benchling online platform. Refer to the section Software and datasets to access the link to the platform.
2. Refer to the Supplementary information to access the link for viewing and downloading the design of the pTOMAN-G plasmid from the Benchling online platform.
Table 1. Primers used for the pTOMAN-G plasmid assembly and confirmation
| Primer name | Sequence 5'-3' | Description |
| oL4 | TCGCCCGCAGAAGCGCGGCC | Internal to HphMx |
| oL303 | AGTTCTCAGAGCACACCACG | Internal to Luc |
| oL383 | TGCTTCCGGCTCCTATGTTG | Downstream HphMx |
| oL384 | TTCGCTATTACGCCAGCTGG | Upstream RPL26A promoter |
| oL397 | TTGTAATACGACTCACTATAGGGCGAATTGTTTAATTTTTTAGCGCACTA | RPL26A promoter amplification for assembly; use genomic DNA from the BY4741 yeast strain as template for PCR |
| oL398 | GCCCTTCTTAATGTTCTTAGCATCGGCCATTCTGATACTTTTTTGTTGGT | RPL26A promoter amplification for assembly; use genomic DNA from the BY4741 yeast strain as template for PCR |
| oL399 | TATTGACGTAACCAACAAAAAAGTATCAGAATGGCCGATGCTAAGAACAT | Luc-CYC1 terminator-HphMx amplification for assembly; use plasmid DNA from [18] as template for PCR |
| oL400 | ATTAACCCTCACTAAAGGGAACAAAAGCTGATCGATGAATTCGAGCTCGT | Luc-CYC1 terminator-HphMx amplification for assembly; use plasmid DNA from [18] as template for PCR |
For primers oL397 to oL400, 30 nt overhangs for yeast recombination cloning are highlighted in bold, and 20 nt for amplification of the target fragment are in black.
2. Extract genomic DNA from the BY4741 yeast strain with the Wizard® Genomic DNA Purification kit according to the manufacturer’s instructions.
3. Perform the following PCR reactions to obtain the following amplified products:
a. PCR1: Amplify the RPL26A promoter region using genomic DNA from the BY4741 yeast strain as the template. Follow the PCR amplification conditions outlined in Table 2. The expected PCR product size is 691 bp.
Table 2. Conditions for PCR reaction and amplification of the RPL26A promoter region
| PCR reaction: | ||
| Reagent | Final concentration | Volume |
| Phusion flash high-fidelity master mix 2× | 1× | 12.5 μL |
| Primer oL397 (10 μM) | 0.2 μM | 0.5 μL |
| Primer oL398 (10 μM) | 0.2 μM | 0.5 μL |
| Yeast genomic DNA | 10 ng/µL | 1 μL |
| UPdH2O | - | 10.5 μL |
| Thermal cycler amplification program: | ||
| 94 °C for 30 s; 35 cycles of 94 °C for 5 s, 55 °C for 30 s, and 72 °C for 15 s; final extension at 72 °C for 3 min, and 15 °C infinite incubation | ||
b. PCR2: Amplify the fragment containing the luciferase reporter (Luc), CYC1 terminator (CYCTER), and hygromycin cassette (HphMx). Follow the PCR amplification conditions outlined in Table 3. The expected PCR product size is 3,912 bp.
Table 3. Conditions for PCR reaction and amplification of the fragment containing Luc, CYCTER, and HphMx cassette
| PCR reaction: | ||
| Reagent | Final concentration | Volume |
| Phusion flash high-fidelity master mix 2× | 1× | 12.5 μL |
| Primer oL399 (10 µM) | 0.2 µM | 0.5 μL |
| Primer oL400 (10 µM) | 0.2 µM | 0.5 μL |
| Plasmid DNA encoding the genetic construct [18] | 10 ng/µL | 1 μL |
| UPdH2O | - | 10.5 μL |
| Thermal cycler amplification program: | ||
| 94 °C for 30 s; 35 cycles of 94 °C for 5 s, 55 °C for 30 s, and 72 °C for 1 min; final extension at 72 °C for 3 min, and 15 °C infinite incubation. | ||
4. Confirm the PCR products’ size by electrophoresis in 1% agarose gel. Perform electrophoresis in TAE buffer at 100 V for 20 min.
A2. Digestion of the pRS316 plasmid
1. Perform the double digestion of the pRS316 plasmid using BamHI and XhoI restriction enzymes, as specified in Table 4. Incubate the digestion at 37 °C overnight.
Table 4. Conditions for double enzymatic digestion of the pRS316 plasmid
| Reagent | Final concentration | Volume |
|---|---|---|
| Reaction buffer r3.1 (10×) | 1× | 5 μL |
| BamHI (20,000 U/mL) | 0.8 U/µL | 2 μL |
| XhoI (20,000 U/mL) | 0.8 U/ μL | 2 μL |
| pRS316 (200 ng/µL) | 50 ng/µL | 12.5 μL |
| UPdH2O | - | 28.5 μL |
2. Confirm the plasmid digestion by electrophoresis in 1% agarose gel. Perform electrophoresis in TAE buffer at 100 V for 20 min, using the undigested plasmid as a control.
A3. Yeast recombinational cloning
Perform the co-transformation of PCR1, PCR2, and linearized pRS316 plasmid in the BY4741 yeast strain for cloning by homologous recombination, as previously described [19]. For this, transform the selected yeast using the following lithium acetate transformation protocol adapted from [20].
1. Preparation of pre-inoculum (first day):
a. In a 15 mL conical tube, add 5 mL of YPD medium (Recipe 6) and inoculate the BY4741 yeast using a sterile toothpick.
b. Grow it at 30 °C for 24 h in a shaker incubator.
2. Preparation of inoculum (second day):
a. In a new 15 mL conical tube, add 5 mL of YPD medium and transfer 300 μL of the pre-inoculum.
b. Grow it at 30 °C for 4 h in a shaker incubator.
3. Preparation of salmon sperm DNA carrier (2.0 mg/mL): heat salmon sperm DNA at 94 °C for 10 min to denature it using a heat block (Recipe 11).
4. Harvesting and washing the cells (after the 4 h of incubation):
a. Centrifuge the tube at 2,612× g for 5 min and discard the supernatant.
b. Resuspend the pellet in 1 mL of cold sterile dH2O, transfer to a 1.5 mL microcentrifuge tube, and centrifuge at 15,928× g for 1 min. Discard the supernatant.
c. Repeat washing with 1 mL of sterile dH2O twice.
d. Discard the supernatant and resuspend the cells in 1 mL of lithium acetate 100 mM (Recipe 10)
e. Centrifuge at top speed for 30 s and remove the lithium acetate using a micropipette.
f. Resuspend the pellet in 1 mL of lithium acetate 100 mM, then divide the cells into two 1.5 mL microcentrifuge tubes, each containing 500 μL.
g. Spin the tubes briefly at low speed and carefully remove the supernatant with a micropipette.
Critical: Ensure the cell pellet remains loose to facilitate resuspension in the transformation mix (next step).
5. Add the components of the mix in the following order:
a. 240 μL of PEG 50% (w/v) (Recipe 12).
b. 36 μL of lithium acetate 1 M (see Recipe 9).
c. 20 μL of denatured salmon sperm DNA carrier (2.0 mg/mL) (see Recipe 11).
d. 8 μL of PCR1 (400 ng/µL), 8 μL of PCR2 (400 ng/µL), and 3 μL of linearized pRS316 plasmid (50 ng/µL).
Critical: This order is critical because PEG protects cells from lithium acetate. Gently mix the components only after all ingredients have been added.
Note: This mix can be added to one or both tubes, depending on experimental requirements.
6. Mixing and incubation:
a. Vortex the 1.5 mL tubes vigorously until the cell pellet is fully resuspended (approximately 1 min).
b. Incubate at 30 °C for 30 min.
7. Heat shock:
a. Apply heat shock in a water bath at 42 °C for 30 min.
Note: Optimum heat shock time may vary for different yeast strains.
b. Centrifuge the tubes at 6,032× g for 1 min and remove the transformation mix using a micropipette.
c. Add 1 mL of sterile dH2O and resuspend the pellet gently. Centrifuge at 6,032× g for 1 min and discard the supernatant.
8. Plating and incubation:
a. Add 200 μL of sterile dH2O and plate on SC plates without uracil (Recipe 13).
b. Incubate the plates for 3 days at 30 °C.
A4. Plasmid DNA extraction from yeast
1. After 3 days of incubation of the SC plates without uracil, scrape all the yeast colonies using a smear loop.
2. Transfer the yeast biomass to a 1.5 mL tube containing 150 μL of solution 1 from the Zymoprep Yeast Plasmid Miniprep I kit.
3. Add 10 μL of zymolyase 10 mg/mL (Recipe 14) and incubate at 37 °C for 1 h (use a shaker incubator).
4. Proceed with the plasmid DNA extraction using the Zymoprep Yeast Plasmid Miniprep I kit, according to the manufacturer’s instructions.
A5. E. coli transformation
1. Use 5 μL of plasmid DNA extracted from yeast in section A4 for E. coli transformation.
2. Mix 5 μL of plasmid with 20 μL of E. coli DH5α competent cells using a 1.5 mL tube.
3. Incubate E. coli cells on ice for 30 min.
4. Heat shock the E. coli cells at 42 °C for 1 min using a water bath.
5. Add 1 mL of LB medium and incubate at 37 °C for 1 h (use a shaker incubator).
6. Centrifuge at 6,032 × g for 1 min and discard the supernatant.
7. Add 200 μL of LB medium and plate on LB ampicillin plates (Recipe 15).
8. Incubate the plates overnight at 37 °C.
A6. Colony PCR for plasmid confirmation
1. Select 10 colonies of E. coli and perform a patch on a new LB ampicillin plate.
2. Incubate the plate overnight at 37 °C.
3. On the next day, perform the confirmation PCR1. Follow the PCR amplification conditions outlined in Table 5. The expected PCR product size is 1,020 bp.
Table 5. Conditions for PCR1 reaction
| PCR reaction: | ||
| Reagent | Final concentration | Volume |
| GoTaq green master mix 2× | 1× | 12.5 μL |
| Primer oL303 (10 μM) | 0.2 μM | 0.5 μL |
| Primer oL384 (10 μM) | 0.2 μM | 0.5 μL |
| E. coli colony biomass | - | a tip |
| UPdH2O | - | 11.5 μL |
| Thermal cycler amplification program: | ||
| 94 °C for 3 min; 35 cycles of 94 °C for 30 s, 55 °C for 30 s, and 72 °C for 1 min; final extension at 72 °C for 5 min, and 15 °C infinite incubation. | ||
4. For the positive E. coli colonies identified in the confirmation PCR1, perform the confirmation PCR2. Follow the PCR amplification conditions outlined in Table 6. The expected PCR product size is 483 bp.
Table 6. Conditions for PCR2 reaction
| PCR reaction: | ||
| Reagent | Final concentration | Volume |
| GoTaq green master mix 2× | 1× | 12.5 |
| Primer oL304 (10 µM) | 0.2 µM | 0.5 μL |
| Primer oL383 (10 µM) | 0.2 µM | 0.5 μL |
| E. coli colony biomass | - | a tip |
| UPdH2O | - | 11.5 μL |
| Thermal cycler amplification program: | ||
| 94 °C for 3 min; 35 cycles of 94 °C for 30 s, 55 °C for 30 s, and 72 °C for 30 s; final extension at 72 °C for 5 min, and 15 °C infinite incubation | ||
5. Select three positive colonies for both PCR reactions.
A7. Plasmid miniprep from E. coli
1. Grow each selected E. coli colony in 5 mL of LB medium supplemented with ampicillin at a final concentration of 100 µg/mL (Recipe 15). Use 14 mL culture tubes.
2. Incubate the tubes overnight at 37 °C in a shaker incubator set at 180 rpm.
3. Centrifuge the tubes at 1,968× g and discard the supernatant.
4. Proceed with the plasmid DNA extraction using the GeneJET Plasmid Miniprep kit, according to the manufacturer’s instructions.
5. Check the quality of the plasmid DNA extraction and quantify its concentration using a UV/Vis spectrophotometer, measuring absorbance (A) at 260 and 280 nm. An A260/A280 ratio of around 1.8 is generally acceptable, but it can be in the range of 1.7–1.9. For Sanger sequencing, a minimum concentration of 60–100 ng/µL is accepted, in a minimum volume of 15 μL.
6 Test three candidate plasmids by Sanger sequencing using primers oL303, oL384, and oL399.
7. Perform the analysis of the ABI files (obtained from sequencing reactions) using the alignment tool of the Benchling online platform.
8. Select a plasmid without any mutations in the DNA sequences of the RPL26A promoter and the luciferase gene reporter (pTOMAN-G plasmid).
B. Evaluation of yeast growth in microculture using YMM+Pro medium
Before transforming the yeast strains for which TORC1 activation is to be evaluated with the pTOMAN-G plasmid, assess their ability to grow in YMM+Pro medium (Recipe 5), where proline is the sole nitrogen source.
Note: See General note 1.
1. Prepare a pre-inoculum plate (first day):
a. Dispense 200 μL of YMM+Pro into each well of a sterile 96-well (transparent) plate using a multichannel micropipette.
b. Inoculate each well with a sample of yeast biomass using a sterile toothpick. Mix gently.
2. Incubate the plate at 28 °C for 48 h (optional shaking).
Note: Although shaking provides aeration and therefore improves growth, it is not crucial for the pre-inoculum.
3. Prepare a 1:10 dilution of the pre-inoculum (after 48 h of incubation):
a. Add 180 μL of sterile dH2O to a new sterile 96-well (transparent) plate using a multichannel micropipette.
b. Transfer 20 μL from each well of the pre-inoculum plate to the corresponding well of the new plate.
Note: Gently resuspend the cells in the pre-inoculum plate before pipetting the 20 μL sample.
4. Set up the experiment:
a. Dispense 190 μL of YMM+Pro into each well of a new sterile 96-well (transparent) plate using a multichannel micropipette.
b. Add 10 μL from the pre-inoculum dilution plate to each well of the new plate.
5. Absorbance measurement:
a. Place the experimental plate (without a lid) into the Sunrise™ temperature-controlled absorbance reader.
b. Follow the protocol detailed in Table 7 for absorbance measurement, using 30 °C as experimental temperature.
Note: Perform at least two independent biological replicates for each experimental plate.
6. Data evaluation and selection of candidate yeasts:
a. Extract the data from the plate reader in Excel format.
b. Select candidates based on their growth performance.
Note: Refer to the Data analysis section of this protocol for detailed guidance on result interpretation.
Table 7. SunriseTM temperature-controlled absorbance reader protocol
| Measuring mode | Absorbance |
| Measuring wavelength | 620 nm |
| Reading mode | Normal |
| Number of kinetic cycles | 92 |
| Kinetic interval | 1,800 s |
| Valid temperature range | 25–35 °C |
| Stirring duration (normal range) | 120 s |
| Unit | OD |
Notes:
1. The SunriseTM microplate reader has a fixed wavelength of 620 nm (OD620), but the results are practically the same as those obtained by measuring OD600. If another microplate reader is used (such as SynergyTM HTX), a 600 nm wavelength could be used.
2. The number of kinetic cycles used corresponds to an experiment of 46 h, which is the minimum suggested. Longer times can be used if more complete growth curves are desired.
3. The kinetic interval used corresponds to a measurement every 30 min. Shorter times can be used if denser growth curves are desired.
C. Transformation of selected strains with the pTOMAN-G plasmid
Transform the selected yeasts from section B using a modified electroporation protocol for Saccharomyces [21]:
1. Preparation of pre-inoculum (first day):
a. In a 15 mL conical tube, add 5 mL of YPD medium (Recipe 6) and inoculate the yeast using a sterile toothpick.
b. Grow it at 28 °C for 24 h in a shaker incubator.
2. Preparation of inoculum (second day):
a. In a new 15 mL conical tube, add 5 mL of YPD medium and transfer 300 μL of the pre-inoculum.
b. Grow it at 28 °C for 4 h in a shaker incubator.
3. Harvesting and washing the cells (after the 4 h of incubation):
a. Centrifuge the cells at 2,612× g for 5 min. Discard the supernatant.
b. Resuspend the pellet in 1 mL of cold sterile dH2O, transfer to a 1.5 mL microcentrifuge tube, and centrifuge at 15,928× g for 1 min. Discard the supernatant.
c. Wash the pellet sequentially: first with 1 mL of cold sterile dH2O, then with 1 mL of sorbitol 1 M (Recipe 7).
4. Preparation for electroporation:
a. Resuspend the cells in 100 μL of sorbitol 1 M.
b. Transfer 50 μL to a 1.5 mL microcentrifuge tube. Add 450 ng of plasmid DNA and mix gently.
Note: The plasmid DNA amount is approximate; adjust as needed to obtain only a few transformants. For this experiment, only one transformant is required.
5. Electroporation:
a. Transfer the entire cell-DNA mixture into an electroporation cuvette.
b. Electroporate under the following conditions: 25 μF, 200 Ω, and 1.5 kV.
Note: These settings are optimized for S. cerevisiae and may need adjustment for other yeasts.
6. Recovery:
a. Add 1 mL of YPD medium to the cuvette, recover the mixture from the cuvette using a P1000 micropipette, and transfer it to a 1.5 mL microcentrifuge tube.
b. Incubate at 28 °C for 1 h (optional shaking).
7. Plating:
a. Centrifuge the tube at 15,928× g for 1 min and discard the supernatant.
b. Resuspend the cells in 100 μL of YPD medium and plate them onto YPD-Agar+Hyg medium (Recipe 6).
c. Incubate at 28 °C for 48 h or until transformant colonies appear.
8. Long-term storage:
a. Store transformant yeast strains at -80 °C in sterile cryogenic tubes with glycerol 30% (Recipe 8).
Note: Rocha et al. [11] used electroporation instead of the standard lithium acetate protocol because it proved to be more efficient in terms of transformed strains per day. However, if transformants are not obtained via electroporation and/or the standard lithium acetate transformation protocol is preferred, it can be used alternatively. Please refer to section A3 and take into consideration the following:
Follow steps A3.1–3.7, considering that in step A3.5d, you must add 450 ng of plasmid DNA. Then, continue with the steps detailed below:
8. Overnight growth:
a. Resuspend the cells in 1 mL of YPD medium and incubate overnight at 4 °C.
9. Plating and incubation:
a. Centrifuge the cells at 6,032× g for 1 min and remove the YPD medium.
b. Resuspend the pellet in 200 μL of YPD medium and plate onto YPD-Agar+Hyg medium.
c. Incubate at 28 °C for 48 h or until transformant colonies appear.
D. Evaluation of luminescence emission of strains transformed with the pTOMAN-G plasmid
Select yeast strains and evaluate their growth ability in YMM+Pro+Luc+Hyg (Recipe 5), as well as their capacity to emit luminescence.
1. Preparation of the pre-inoculum plate (first day):
a. Dispense 200 μL of YMM+Pro+Hyg into a sterile 96-well (transparent) plate using a multichannel micropipette.
b. Inoculate each well with a sample of transformed yeast biomass using a sterile toothpick. Mix gently.
Note: Perform three technical replicates for each strain on the same plate.
2. Incubate the plate at 28 °C for 48 h (optional shaking).
3. Prepare a 1:10 dilution of the pre-inoculum (after 48 h of incubation):
a. Add 180 μL of sterile dH2O to a new sterile 96-well (transparent) plate using a multichannel micropipette.
b. Transfer 20 μL from each well of the pre-inoculum plate to the corresponding well of the new plate.
Note: Gently resuspend the cells in the pre-inoculum plate before pipetting the 20 μL sample.
4. Set up the experiment:
a. Dispense 290 μL of YMM+Pro+Luc+Hyg into each well of a new sterile 96-well (white/optical) plate using a multichannel micropipette.
b. Add 10 μL from the pre-inoculum dilution plate to each well of the new plate.
5. Luminescence measurement:
a. Place the experimental plate (preferably without a lid) into the SynergyTM HTX multi-mode microplate reader.
Note: Although using the lid may prevent evaporation of the medium, sometimes its use causes condensation, which in turn interferes with absorbance and luminescence measurements.
b. Follow the protocol detailed in Table 8 for luminescence measurement, using 30 °C as experimental temperature.
6. Data evaluation and selection of candidate yeasts:
a. Extract the data from the plate reader in Excel format.
b. Identify yeast strains that emit luminescence [measured in arbitrary units (a.u.)].
Note: Refer to the Data analysis section for detailed guidance on result interpretation.
Table 8. SynergyTM HTX multi-mode microplate reader protocol for evaluation of luminescence emission
| Plate type | 96-well plate |
| Eject plate on completion | |
| Set temperature | Setpoint 30 °C, gradient 0 °C |
| Start kinetic | Runtime 48:00:00 (HH:MM:SS), interval 0:30:00, 97 reads |
| Read | Absorbance endpoint |
| Full plate | |
| Wavelengths: 600 | |
| Read speed: normal, delay: 100 ms, measurements/data point: 8 | |
| Read | Luminescence endpoint |
| Full plate | |
| Integration time: 0:01,00 (MM:SS,ss) | |
| Filter set 1 Emission: hole Optics: top, gain: 150 | |
| Read speed: normal, delay: 100 ms | |
| Extended dynamic range | |
| Read height: 1 mm | |
| End Kinetic | |
Notes:
1. The runtime used corresponds to an experiment of 48 h, which should be sufficient to ensure all yeast strains reach an OD600 of 0.8. Longer times can be used if some yeast strains show delayed growth.
2. The kinetic interval used corresponds to a measurement every 30 min. Shorter times can be used if denser growth curves are desired.
E. Evaluation of TORC1 activation in strains transformed with the pTOMAN-G plasmid
1. Determine optimal growth timing:
a. Identify the time at which the transformed yeast strains reach an optical density at 600 nm (OD600) of approximately 0.8 (use results from section D). Organize yeast samples into groups based on similar growth rates.
2. Prepare pre-inoculum plates for each group:
a. Using a multichannel micropipette, dispense 200 μL of YMM+Pro+Hyg (Recipe 5) into a sterile 96-well (transparent) plate.
b. Inoculate three wells for each yeast strain by transferring yeast biomass with a sterile toothpick (technical triplicates for each strain). Mix gently.
3. Incubate the plate at 28 °C for 48 h without shaking.
4. Prepare a 1:10 dilution of the pre-inoculum (after 48 h of incubation):
a. Add 180 μL of sterile dH2O to a new sterile 96-well (transparent) plate using a multichannel micropipette.
b. Transfer 20 μL from each well of the pre-inoculum plate to the corresponding well of the new plate.
Note: Gently resuspend the cells in the pre-inoculum plate before pipetting the 20 μL sample.
5. Set up the nitrogen upshift experiment:
a. Dispense 290 μL of YMM+Pro+Luc+Hyg into the wells of a new sterile 96-well (white/optical) plate using a multichannel micropipette.
b. Add 10 μL from the pre-inoculum dilution plate to each well of the new plate.
6. Monitor growth in the plate reader:
a. Place the experimental plate (without a lid) into the SynergyTM HTX multi-mode microplate reader.
b. Follow the protocol detailed in Table 8 for luminescence measurement.
c. Monitor yeast growth until the OD600 reaches approximately 0.8.
Note: Refer to the Data analysis section of this protocol for detailed guidance on OD600 selection.
7. Induce nitrogen upshift:
a. Once the desired OD600 is achieved, remove the 96-well (white/optical) plate from the reader. In a flow hood, add 10 μL of L-glutamine stock solution (Recipe 2) to each well using a multichannel micropipette.
b. Return the plate to the reader and use the protocol specified in Table 9, using 30 °C as experimental temperature.
Note: See General note 2.
8. Analyze luminescence curves:
a. Extract the data from the plate reader in Excel format.
b. Analyze the data using GraphPad Prism software.
Note: Refer to the Data analysis section for detailed guidance on result interpretation.
Table 9. SynergyTM HTX multi-mode microplate reader protocol for nitrogen upshift experiment
| Plate type | 96-well plate |
| Eject plate on completion | |
| Set temperature | Setpoint 30 °C, gradient 0 °C |
| Start kinetic | Runtime 12:00:00 (HH:MM:SS), interval 0:10:00, 73 reads |
| Read | Absorbance endpoint |
| Full plate | |
| Wavelengths: 600 | |
| Read speed: normal, delay: 100 ms, measurements/data point: 8 | |
| Read | Luminescence endpoint |
| Full plate | |
| Integration time: 0:01,00 (MM:SS,ss) | |
| Filter set 1 Emission: hole Optics: top, gain: 150 | |
| Read speed: normal, delay: 100 ms | |
| Extended dynamic range | |
| Read height: 1 mm | |
| End kinetic | |
Notes:
1. The runtime used corresponds to an experiment of 12 h, which is the time at which all yeast strains typically cease to show luminescence after the glutamine pulse. Longer times can be used if the luminescence signal lasts longer using other nitrogen sources, and shorter times can be used if only the 0–4 h interval is to be evaluated.
2. The kinetic interval used corresponds to a measurement every 10 min. Shorter times can be used if denser luminescence curves are desired (Kessi-Pérez et al. [1] performed measurements every 5 min, while Rocha et al. [11] every 10 min; Kessi-Pérez et al. [15] used both intervals in different experiments).
Data analysis
Evaluation of yeast growth in microculture using YMM+Pro medium
Extract the data from the microplate reader in Excel format. For each growth curve, evaluate whether the criterion imposed to positively select a yeast strain for subsequent transformation with the pTOMAN-G plasmid is met. For this, first set a time limit for growth assessment based on OD600 measurements over time. For instance, Rocha et al. [11] established a selection criterion for strains based on achieving an OD600 of at least 0.8 within 46 h; strains unable to reach that OD600 in 46 h were discarded due to poor growth in the YMM+Pro medium. However, this criterion can be modified depending on specific experimental needs: for example, if you want to evaluate one or a few yeast strains, you can choose to consider a longer growth time so as not to discard them.
Evaluation of luminescence emission of strains transformed with the pTOMAN-G plasmid
Extract the data from the microplate reader in Excel format. For each luminescence curve, calculate the maximum luminescence obtained. Select yeast strains capable of growing in YMM+Pro+Luc medium and emitting luminescence of at least 50 a.u. Discard any transformed strains that do not emit luminescence.
Evaluation of TORC1 activation in strains transformed with the pTOMAN-G plasmid
Extract the data from the microplate reader (BioTek Gen5 software) in Excel format (CSV file). For each luminescence curve, calculate the following kinetic parameters (Figure 2) using Excel and/or GraphPad Prism software (or another equivalent software that allows extracting these kinetic parameters in an automated way). An example of the data analysis process is provided in the Supplementary information (Data analyses S1 and S2, using the same data sets as in Figure 3):
1. Maximum luminescence value (“Max”), which is indicative of the maximum TORC1 activation obtained. Copy the luminescence data and corresponding time values from the original CSV file to a new Excel file. In the example, these are columns B and C–N, respectively.
a. Identify the time interval(s) of interest (e.g., 0–4 h, 4–12 h, and/or 0–12 h) and locate the corresponding rows. In the example, these are rows 3–27 (0–4 h), 3–75 (0–12 h), and 28–75 (4–12 h)
b. Calculate the “Max” parameter values using the “MAX” function. In the example, these calculations are in rows 76, 78, and 80 [e.g., cell C76, where the formula used was =MAX(B3:B27)].
c. Drag the formula horizontally to apply it to all luminescence data.
d. Copy the results and paste them into a new GraphPad Prism file to perform statistical analysis and create graphs.
2. Time at which maximum luminescence occurs (“Time”), which is indicative of the time it takes for TORC1 to be activated after the nitrogen upshift. In the same Excel file, locate the cells corresponding to the “Max” parameter values. In the example, these values are in rows 76, 78, and 80.
a. Calculate the “Time” parameter values using the “XLOOKUP” function. In the example, these calculations are in rows 77, 79, and 81 [e.g., cell C77, where the formula used was =XLOOKUP(B76;B3:B27;$A3:$A27)].
b. Drag the formula horizontally to apply it to all luminescence data.
c. Copy the results and paste them into a new GraphPad Prism file to perform statistical analysis and create graphs.
3. Area under the luminescence curve (“AUC”), which is indicative of TORC1 activation obtained over time. Copy the luminescence data and corresponding time values from the original CSV file to a new GraphPad Prism file. Identify the time interval(s) of interest (e.g., 0–4 h, 4–12 h, and/or 0–12 h), and copy the corresponding luminescence data into a new Data Table (create as many data tables as necessary).
a. Calculate the “AUC” parameter values using the “Area Under Curve” function (with default settings). For each Data Table, select Insert > New Analysis > XY analyses > Area under curve.
b. A results sheet will be generated with the “AUC” values for each Data Table. Copy the results and paste them into a new GraphPad Prism file to perform statistical analysis and create graphs.
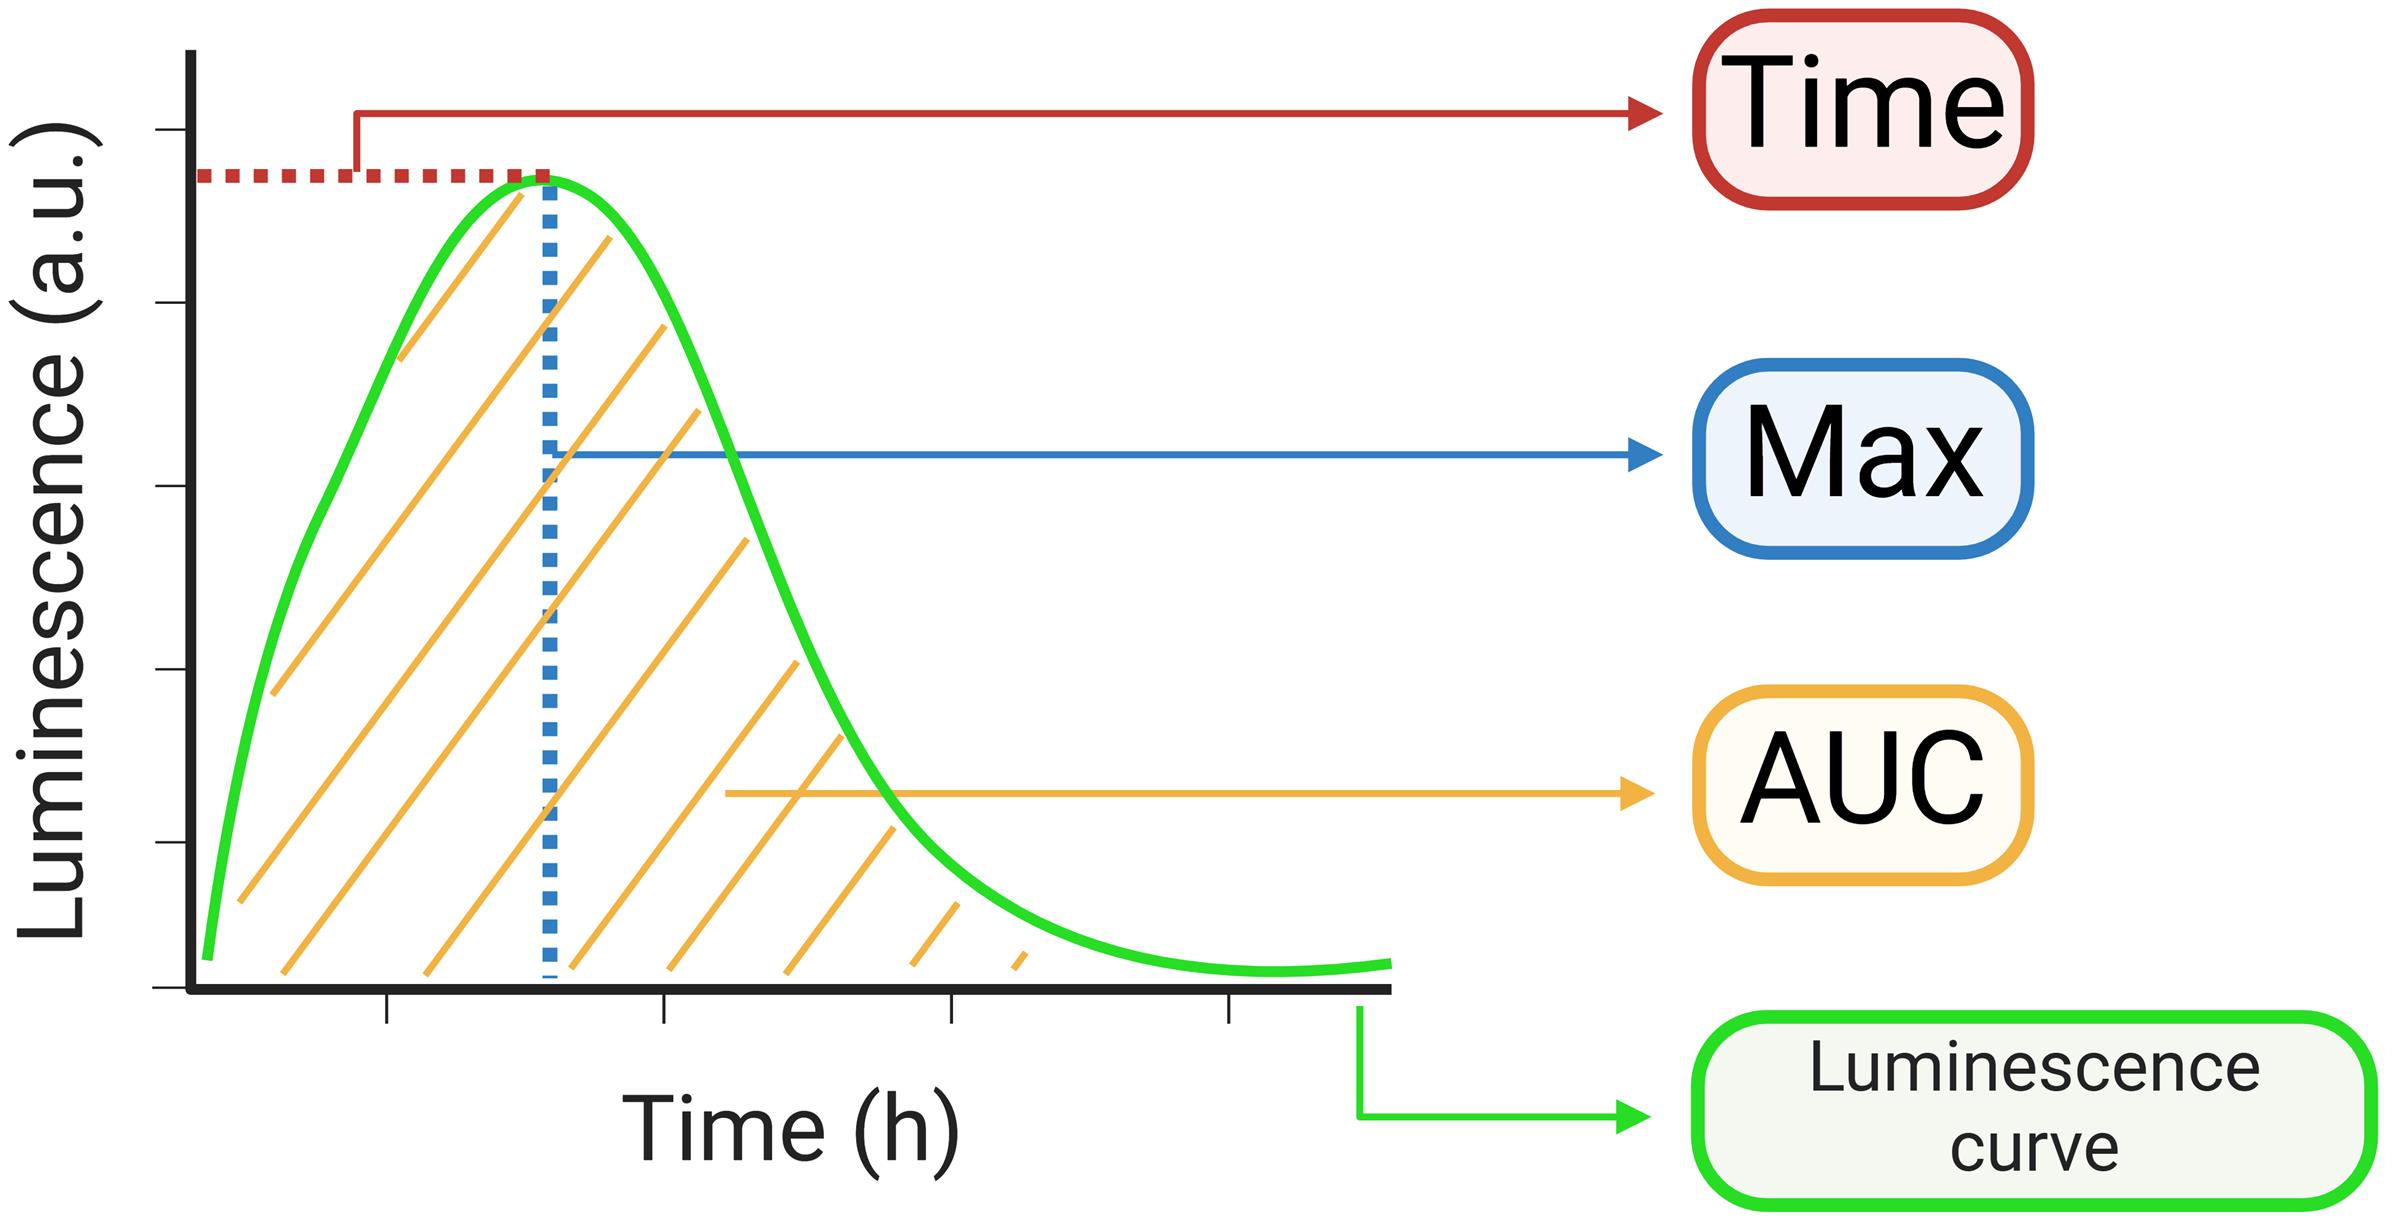
Figure 2. Diagram of the kinetic parameters obtained from the luminescence curves. The kinetic parameters of time at which maximum luminescence occurs (“Time”), maximum luminescence value (“Max”), and area under the luminescence curve (“AUC”) are depicted in different colors. For a real luminescence curve, please see Figure 3.
Calculate these parameters for your time interval of interest. For example, in the works of Kessi-Pérez et al [1, 15] and Rocha et al. [11], three intervals were defined, based on the existence of two luminescence peaks for some strains (one after and one before 4 h post addition of the L-glutamine) [1]: 0–4 h, 0–12 h, and 4–12 h.
For each time interval, compare the results to identify significant differences between specific strains or groups of strains, depending on the objective of the study being carried out. Particular attention should be paid to the initial hours after the nitrogen pulse, as this period may capture the first (and often only) peak in luciferase gene expression. Depending on the number of data groups to be compared, the following statistical analyses are recommended:
a. Use two-tailed Mann–Whitney tests when comparing only two groups, as has been done previously [6,11].
b. Use Kruskal–Wallis tests with Dunn's multiple comparisons when comparing three or more groups, as has been done previously [6,11].
c. Use ordinary one-way ANOVA using Holm–Šídák's multiple comparisons test when comparing two or more strains with a reference strain (e.g., when comparing a wild-type strain with a set of mutant strains derived from it), as has been done previously [6,22].
Validation of protocol
1. The pTOMAN-G plasmid is a single-copy plasmid used to evaluate TORC1 activation. It contains a destabilized version of the Luc gene, which includes an ARE sequence for mRNA destabilization and a PEST sequence for proteasome-mediated degradation of the luciferase protein. Rienzo et al. [23] have shown that this design ensures transient expression of the Luc gene, allowing for real‐time quantification of gene expression in vivo (results in Figures 1–5 of [23]), a feature that has been exploited in various works [1,11,15,18, 24–25].
2. The original indirect evaluation of TORC1 activation described in Kessi-Pérez et al. [1], by genomic transformation of the reporter gene, was validated by comparing its results to those obtained using the most common evaluation methods. For this, western blot assays were performed for the phosphorylation of proximal TORC1 effectors, the Sch9 protein, and the ribosomal protein Rps6 after the nitrogen upshift (results in Figure 4 of [1]).
3. In the work of Kessi-Pérez et al. [1], four yeast strains were transformed with the reporter construct integrated into the genome, including the Y12 strain. This strain was also transformed with the TOMAN-G plasmid and used as a positive control by Rocha et al. [11] when this protocol was applied. A comparison between the luminescence profiles of strains from both mentioned studies is shown below in Figure 3 [using the same data sets as in the Supplementary information (Data analyses S1 and S2)]; although the maximum luminescence is higher when using the pTOMAN-G plasmid, the kinetics are almost identical.
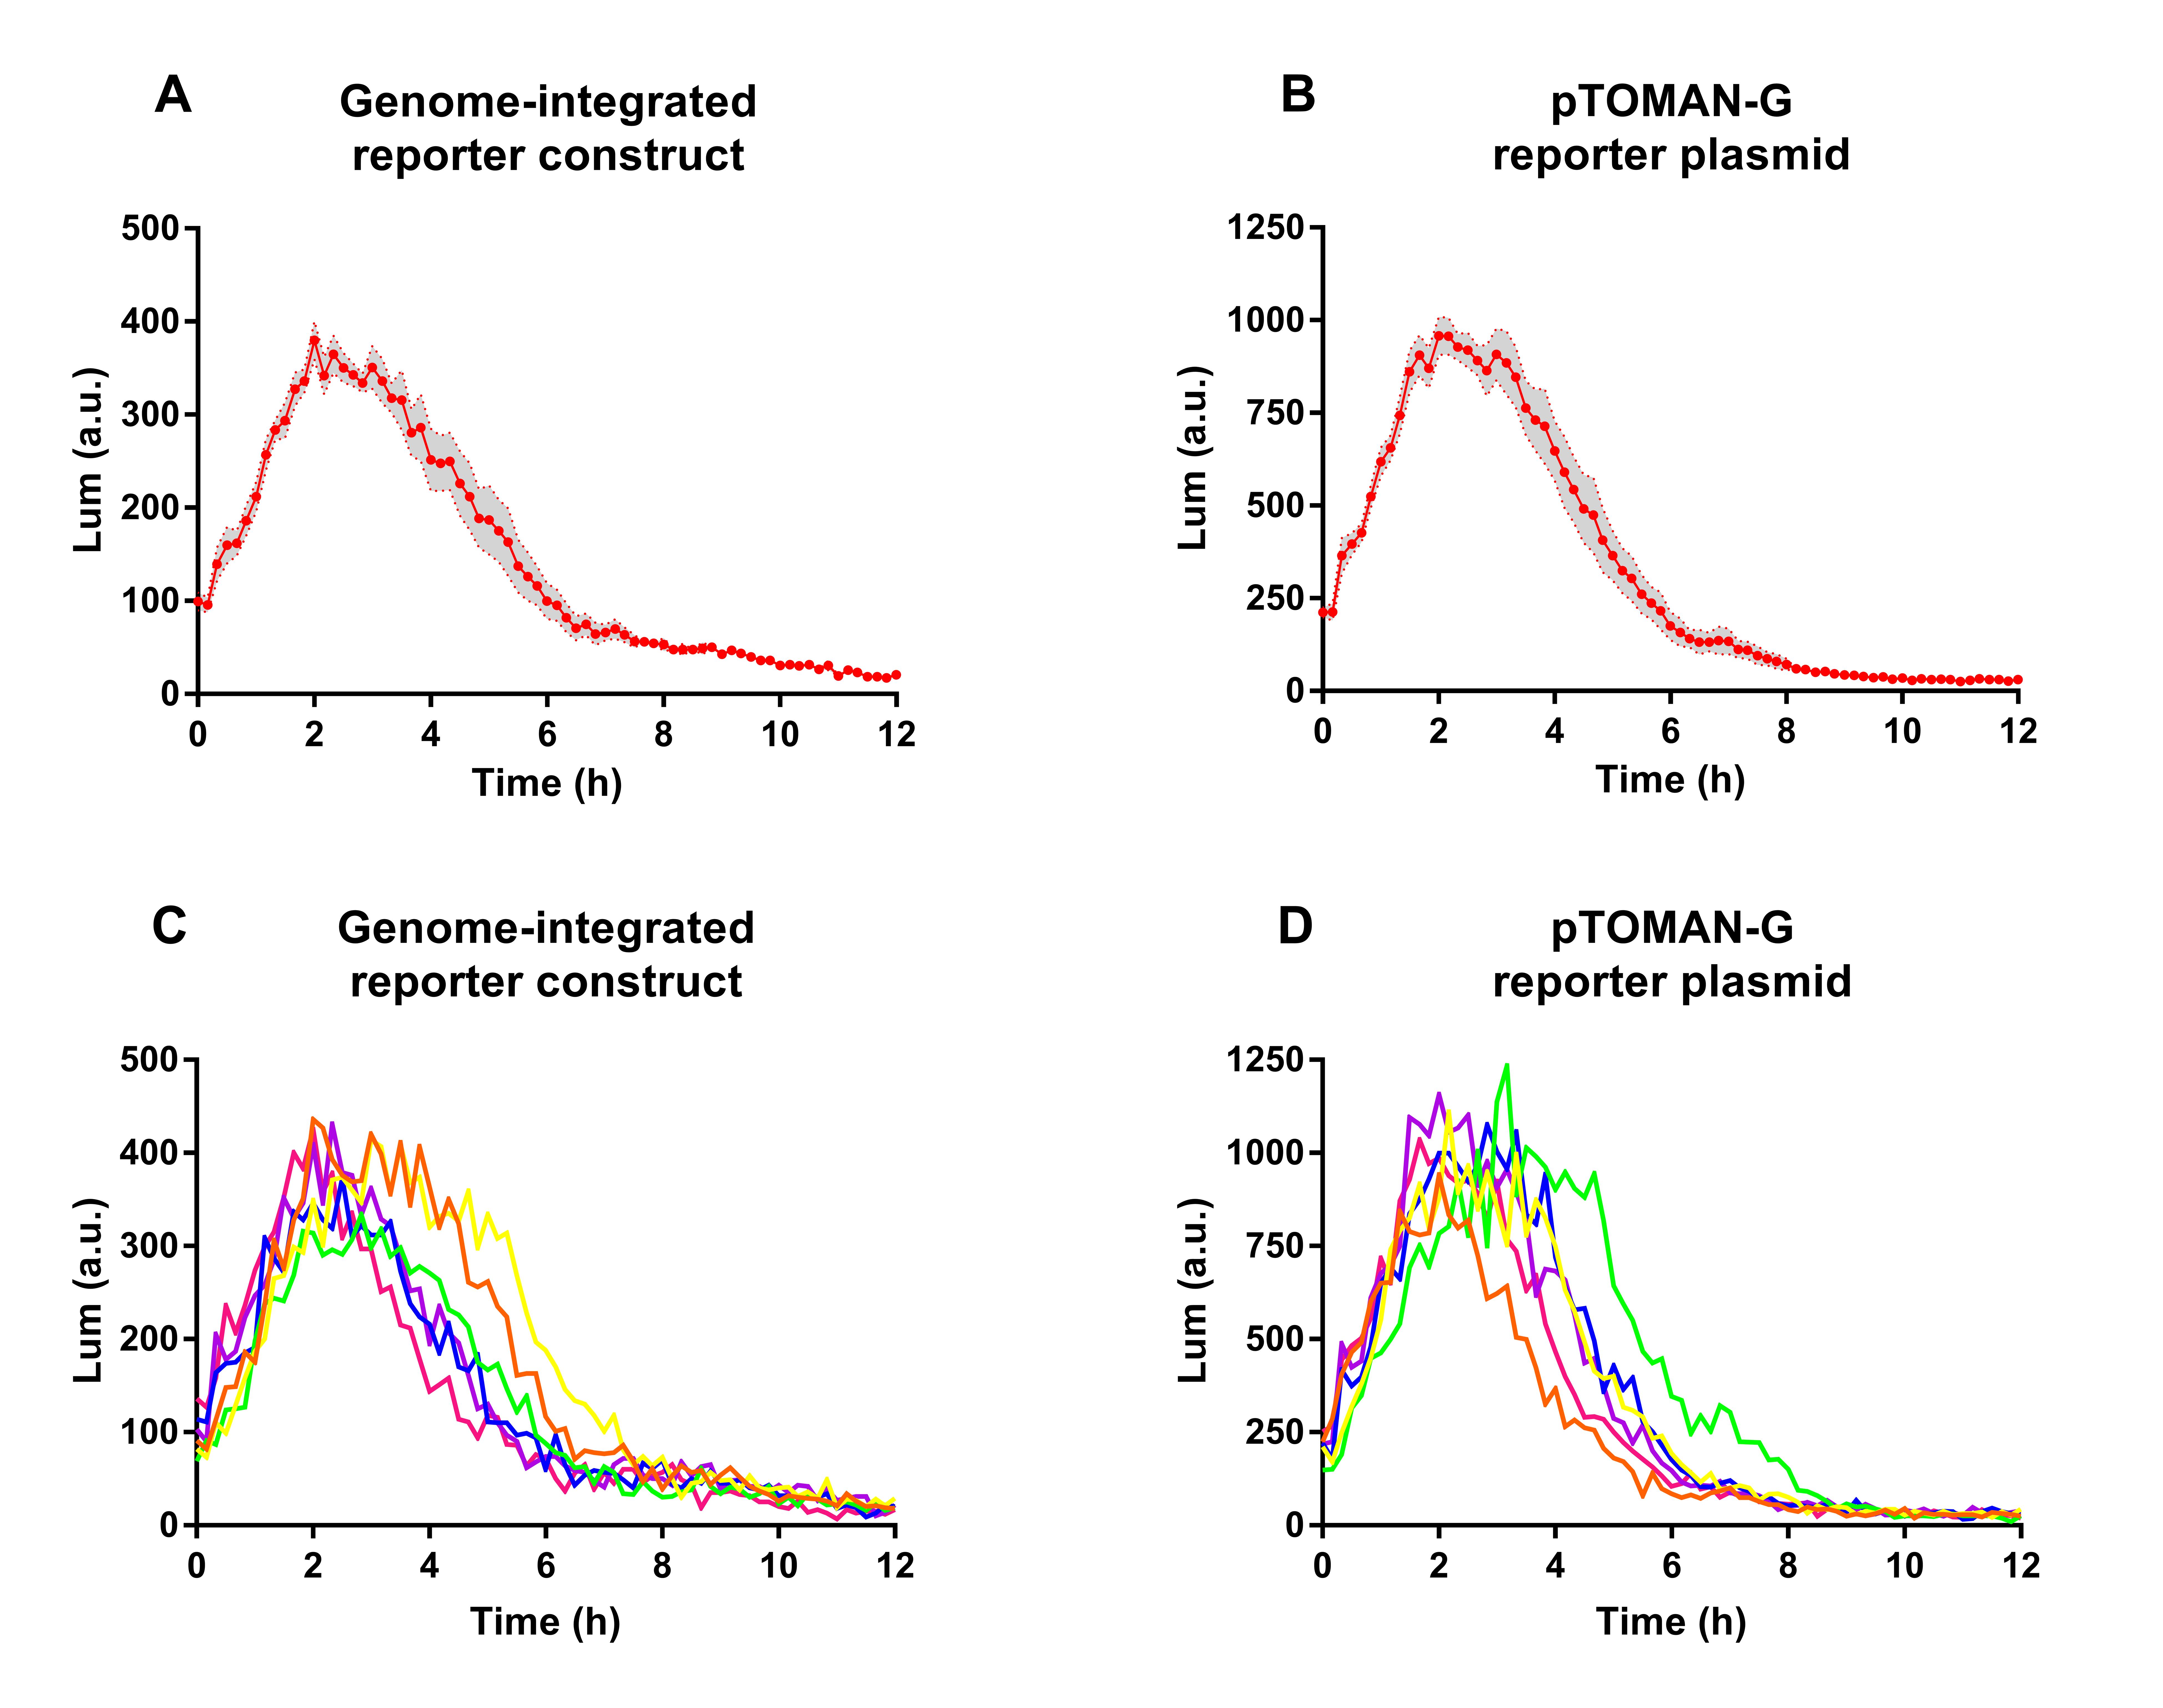
Figure 3. Nitrogen upshift experiment using the Y12 strain. The Y12 strain was transformed with (A and C) the genome-integrated reporter construct and (B and D) the pTOMAN-G reporter plasmid. Luminescence was evaluated under microculture conditions after a glutamine pulse, in which time 0 h corresponds to the addition of glutamine. (A–B) Plotted values correspond to the average of six biological replicates, with their standard error represented by shadow regions (mean ± SEM). (C–D) Individual curves of the biological replicates are shown in different colors. a.u.: arbitrary units.
4. The number of biological and technical replicates is mentioned throughout this protocol. Statistical tests used for data analysis are mentioned in the Data analysis section.
5. More detailed results and data interpretation can be found in the supplementary information of the article by Rocha et al. [11].
General notes and troubleshooting
General notes
1. As presented here, this protocol proposes carrying out nitrogen upshift experiments, which restricts its applicability to yeast strains capable of growth on proline as the sole nitrogen source. However, this protocol could be extended to other types of experiments (e.g., TORC1 signaling inhibition by rapamycin) that would allow for the assessment of other aspects of TORC1 activation in even more yeast strains, because in those types of experiments, the capacity of growth on proline is not needed. Furthermore, although not documented in the literature, other less preferred nitrogen sources (e.g., urea) could be tested as a replacement for proline.
2. As presented here, this protocol proposes carrying out nitrogen upshift experiments using glutamine as the nitrogen source, as performed by Kessi-Pérez et al. [15] and Rocha et al. [11]. Nevertheless, in principle, any other nitrogen sources could be used. However, it is important to note that Kessi-Pérez et al. [1] showed that the original method (using the genome-integrated reporter construct) worked with glutamine but not with leucine as the nitrogen source, so it is necessary to experimentally verify which nitrogen sources are compatible with the present protocol.
3. This protocol was applied to a highly genetically diverse population of S. cerevisiae strains [11]. Despite being a very diverse population, the protocol was applicable, since a large group of yeasts could be transformed with the pTOMAN-G plasmid and then evaluated for the activation of TORC1. For its use in yeasts of another species, it is recommended to adapt this protocol, namely the transformation conditions (see section C) and antibiotic concentrations used as selective pressure to maintain the plasmid. Furthermore, the plasmid was designed to replicate and express the reporter construct in S. cerevisiae; therefore, it must be redesigned for other yeast species.
Troubleshooting
Problem 1: A specific yeast strain to be evaluated does not grow in minimal medium (YMM+Pro).
Possible cause: The components of the medium are not sufficient to satisfy all the metabolic needs of that specific yeast strain.
Solution: In this case, there is no solution; as presented here, the protocol is not applicable to that specific yeast strain (see General note 1 for potential variations of the protocol). However, yeast growth on solid medium can be assessed by plating the yeast suspension left over from step B3 onto a YMM+Pro-Agar plate to cross-confirm the inability of the yeast strain to grow on proline as the sole nitrogen source.
Problem 2: A specific yeast strain cannot be transformed with the pTOMAN-G plasmid.
Possible cause: The transformation conditions are not optimal for that specific yeast strain.
Solution: The transformation conditions for the selected method, whether the lithium acetate protocol or the electroporation protocol, should be optimized for that specific yeast strain. For example, higher DNA concentrations and prolonged incubation times can be tested.
Problem 3: A specific yeast strain does not emit luminescence after being transformed with the pTOMAN-G plasmid.
Possible cause: The yeast strain lost the pTOMAN-G plasmid.
Solution: Re-transform the yeast strain with the pTOMAN-G plasmid. After transforming any yeast strain, always maintain selective pressure with the antibiotic (hygromycin), since the plasmid is dispensable for the yeast.
Supplementary information
The following supporting information can be downloaded here:
1. Sequence S1. pTOMAN-G plasmid sequence (GenBank format)
2. Figure S1. pTOMAN-G plasmid sequence (PDF format)
3. Data analysis S1. Max and Time parameters (Excel file)
4. Data analysis S2. AUC parameter (GraphPad Prism file)
Alternatively, the pTOMAN-G plasmid sequence can be visualized and downloaded from the online platform Benchling using the following link:
https://benchling.com/s/seq-LDmtEvCgieGdRyS7c8pC?m=slm-IR4dS2T8kAngQ0rJ382R
Acknowledgments
Conceptualization, F.S. and E.I.K.P; Methodology, F.S. and E.I.K.P.; Validation, F.S. and E.I.K.P.; Formal Analysis, G.R. and E.I.K.P.; Investigation, M.G. and G.R.; Resources, C.M., F.S. and E.I.K.P.; Writing—Original Draft, M.G., G.R., D.R. and F.S.; Writing—Review & Editing, M.G., G.R., D.R., C.M., F.S. and E.I.K.P.; Visualization, F.S. and E.I.K.P.; Supervision, F.S. and E.I.K.P.; Project administration, E.I.K.P; Funding acquisition, E.I.K.P. All authors have read and agreed to the published version of the manuscript.
Graphical overview and Figure 2 were created in BioRender by Rocha, G. (2025) (https://BioRender.com/d88h014) and Kessi-Pérez, E.I. (2025) (https://BioRender.com/bnhod1t), respectively.
This work was funded by ANID/FONDECYT (grant 11220533) and ANID/Subdirección de Investigación Aplicada (grant ID24I10027) to E.I.K.P., ANID/FONDECYT (grant 1210955) and ANID/Millennium Science Initiative Program (grant ICN17_022) to F.S., ANID/FONDECYT (grants 1201104 and 1250815) to C.M., and ANID/PhD scholarship (grant 21250350) to D.R.
We especially thank ANID/Subdirección de Investigación Aplicada (grant ID24I10027) for providing the funds to cover this publication.
Original research paper in which the protocol was described and validated:
• Rocha, et al. [10]. Phenotyping of a new yeast mapping population reveals differences in the activation of the TORC1 signalling pathway between wild and domesticated yeast strains. Biol Res.
Previous work from which the protocol was developed, modified, or derived:
• Kessi-Pérez et al. [1]. Indirect monitoring of TORC1 signalling pathway reveals molecular diversity among different yeast strains. Yeast.
• Kessi-Pérez et al. [15]. KAE1 allelic variants affect TORC1 activation and fermentation kinetics in Saccharomyces cerevisiae. Front Microbiol.
Competing interests
The authors declare no conflicts of interest.
References
- Kessi-Pérez, E. I., Salinas, F., Molinet, J., González, A., Muñiz, S., Guillamón, J. M., Hall, M. N., Larrondo, L. F., and Martínez, C. (2019) Indirect monitoring of TORC1 signalling pathway reveals molecular diversity among different yeast strains. Yeast. 36(1): 65–74. https://doi.org/10.1002/yea.3351.
- Heitman, J., Movva, N. R., and Hall, M. N. (1991) Targets for cell cycle arrest by the immunosuppressant rapamycin in yeast. Science. 253(5022): 905–909. https://doi.org/10.1126/science.1715094.
- Loewith, R. (2010) (Chap 9) TORC1 signaling in budding yeast. In Hall M. N. and Tamanoi, F. (eds) Volume 27: The Enzymes. Academic Press, 147–175. https://www.sciencedirect.com/science/article/pii/S1874604710270099.
- Goddard, M. R., and Greig, D. (2015) Saccharomyces cerevisiae: A nomadic yeast with no niche? FEMS Yeast Res. 15(3): fov009. https://doi.org/10.1093/femsyr/fov009.
- De Chiara, M., Barré, B. P., Persson, K., Irizar, A., Vischioni, C., Khaiwal, S., Stenberg, S., Amadi, O. C., Žun, G., Doberšek, K., et al. (2022) Domestication reprogrammed the budding yeast life cycle. Nat Ecol Evol. 6(4): 448–460. https://doi.org/10.1038/s41559-022-01671-9.
- Kessi-Pérez, E. I., Acuña, E., Bastías, C., Fundora, L., Villalobos-Cid, M., Romero, A., Khaiwal, S., De Chiara, M., Liti, G., Salinas, F., et al. (2023) Single nucleotide polymorphisms associated with wine fermentation and adaptation to nitrogen limitation in wild and domesticated yeast strains. Biol Res. 56(1): 43. https://doi.org/10.1186/s40659-023-00453-2.
- Tengölics, R., Szappanos, B., Mülleder, M., Kalapis, D., Grézal, G., Sajben, C., Agostini, F., Mokochinski, J. B., Bálint, B., Nagy, L. G., et al. (2024) The metabolic domestication syndrome of budding yeast. Proc Natl Acad Sci USA. 121(11): e2313354121. https://doi.org/10.1073/pnas.2313354121.
- Yue, J. X., Li, J., Aigrain, L., Hallin, J., Persson, K., Oliver, K., Bergström, A., Coupland, P., Warringer, J., Lagomarsino, M. C., et al. (2017) Contrasting evolutionary genome dynamics between domesticated and wild yeasts. Nat Genet. 49(6): 913–924. https://doi.org/10.1038/ng.3847.
- Kessi-Pérez, E. I., Molinet, J., and Martínez, C. (2020) Disentangling the genetic bases of Saccharomyces cerevisiae nitrogen consumption and adaptation to low nitrogen environments in wine fermentation. Biol Res. 53(1): 2. https://doi.org/10.1186/s40659-019-0270-3.
- Kessi-Pérez, E. I., Ponce, B., Li, J., Molinet, J., Baeza, C., Figueroa, D., Bastías, C., Gaete, M., Liti, G., Díaz-Barrera, A., et al. (2020) Differential gene expression and allele frequency changes favour adaptation of a heterogeneous yeast population to nitrogen-limited fermentations. Front Microbiol. 11: 1204. https://doi.org/10.3389/fmicb.2020.01204.
- Rocha, G., Gómez, M., Baeza, C., Salinas, F., Martínez, C., and Kessi-Pérez, E. I. (2024) Phenotyping of a new yeast mapping population reveals differences in the activation of the TORC1 signalling pathway between wild and domesticated yeast strains. Biol Res. 57(1): 82. https://doi.org/10.1186/s40659-024-00563-5.
- Stracka, D., Jozefczuk, S., Rudroff, F., Sauer, U., and Hall, M. N. (2014) Nitrogen source activates TOR (Target of Rapamycin) complex 1 via glutamine and independently of Gtr/Rag proteins. J Biol Chem. 289(36): 25010–25020. https://doi.org/10.1074/jbc.M114.574335.
- González, A., Shimobayashi, M., Eisenberg, T., Merle, D. A., Pendl, T., Hall, M. N., and Moustafa, T. (2015) TORC1 promotes phosphorylation of ribosomal protein S6 via the AGC Kinase Ypk3 in Saccharomyces cerevisiae. PLoS ONE. 10(3): e0120250. https://doi.org/10.1371/journal.pone.0120250.
- Yerlikaya, S., Meusburger, M., Kumari, R., Huber, A., Anrather, D., Costanzo, M., Boone, C., Ammerer, G., Baranov, P. V. and Loewith, R. (2016) TORC1 and TORC2 work together to regulate ribosomal protein S6 phosphorylation in Saccharomyces cerevisiae. Mol Biol Cell. 27(2): 397–409. https://doi.org/10.1091/mbc.E15-08-0594.
- Kessi-Pérez, E. I., Salinas, F., González, A., Su, Y., Guillamón, J. M., Hall, M. N., Larrondo, L. F., and Martinez, C. (2019) KAE1 allelic variants affect TORC1 activation and fermentation kinetics in Saccharomyces cerevisiae. Front Microbiol. 10: 1686. https://doi.org/10.3389/fmicb.2019.01686.
- Peter, J., De Chiara, M., Friedrich, A., Yue, J. X., Pflieger, D., Bergström, A., Sigwalt, A., Barre, B., Freel, K., Llored, A., et al. (2018) Genome evolution across 1,011 Saccharomyces cerevisiae isolates. Nature. 556(7701): 339–344. https://doi.org/10.1038/s41586-018-0030-5.
- Sikorski, R.S., and Hieter, P. (1989) A system of shuttle vectors and yeast host strains designed for efficient manipulation of DNA in Saccharomyces cerevisiae. Genetics. 122(1): 19–27. https://doi.org/10.1093/genetics/122.1.19.
- Salinas, F., De Boer, C. G., Abarca, V., Garcia, V., Cuevas, M., Araos, S., Larrondo, L .F., Martinez, C., and Cubillos, F. A. (2016) Natural variation in non-coding regions underlying phenotypic diversity in budding yeast. Sci Rep. 6: 21849. https://doi.org/10.1038/srep21849.
- Oldenburg, K. R., Vo, K.T ., Michaelis, S., and Paddon, C. (1997) Recombination-mediated PCR-directed plasmid construction in vivo in yeast. Nucleic Acids Res. 25(2): 451–452. https://doi.org/10.1093/nar/25.2.451.
- Gietz, R. D., and Schiestl, R. H. (2007) High-efficiency yeast transformation using the LiAc/SS carrier DNA/PEG method. Nat Protoc. 2(1): 31–34. https://doi.org/10.1038/nprot.2007.13.
- Kawai, S., Hashimoto, W., and Murata, K. (2010) Transformation of Saccharomyces cerevisiae and other fungi: methods and possible underlying mechanism. Bioeng Bugs. 1(6): 395–403. https://doi.org/10.4161/bbug.1.6.13257.
- Bastías, C., Pérez, Y., Kessi-Pérez, E. I., Guillamón, J. M., and Martínez, C. (2025) Specific point mutations in the RRT5 gene modulate fermentative phenotypes of an industrial wine yeast. Fermentation. 11(2): 88. https://doi.org/10.3390/fermentation11020088.
- Rienzo, A., Pascual-Ahuir, A., and Proft, M. (2012) The use of a real-time luciferase assay to quantify gene expression dynamics in the living yeast cell. Yeast. 29(6): 219–231. https://doi.org/10.1002/yea.2905.
- Devia, J., Bastías, C., Kessi-Pérez, E. I., Villarroel, C., De Chiara, M., Cubillos, F. A., Liti, G., Martínez, C., and Salinas, F. (2020) Transcriptional activity and protein levels of horizontally acquired genes in yeast reveal hallmarks of adaptation to fermentative environments. Front Genet. 11: 293. https://doi.org/10.3389/fgene.2020.00293.
- Figueroa, D., Ruiz, D., Tellini, N., De Chiara, M., Kessi-Pérez, E. I., Martínez, C., Liti, G., Querol, A., Guillamón, J. M., and Salinas, F. (2025) Optogenetic control of horizontally acquired genes prevent stuck fermentations in yeast. Microbiol Spectr. 13(2): e0179424. https://doi.org/10.1128/spectrum.01794-24.
Article Information
Publication history
Received: Feb 6, 2025
Accepted: May 20, 2025
Available online: Jun 3, 2025
Published: Jun 20, 2025
Copyright
© 2025 The Author(s); This is an open access article under the CC BY-NC license (https://creativecommons.org/licenses/by-nc/4.0/).
How to cite
Gómez, M., Rocha, G., Ruiz, D., Martínez, C., Salinas, F. and Kessi-Pérez, E. I. (2025). High-Throughput Indirect Monitoring of TORC1 Activation Using the pTOMAN-G Plasmid in Yeast. Bio-protocol 15(12): e5356. DOI: 10.21769/BioProtoc.5356.
Category
Microbiology > Microbial genetics > Plasmid
Cell Biology > Cell signaling > Intracellular Signaling
Do you have any questions about this protocol?
Post your question to gather feedback from the community. We will also invite the authors of this article to respond.