- Protocols

- Articles and Issues
- For Authors
- About
- Become a Reviewer

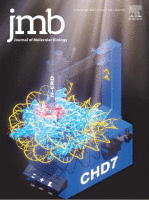
Protein Structural Characterization Using Electron Transfer Dissociation and Hydrogen Exchange-Mass Spectrometry
Published: Vol 15, Iss 12, Jun 20, 2025 DOI: 10.21769/BioProtoc.5350 Views: 1992
Reviewed by: Dhananjay D ShindeAnonymous reviewer(s)
Original research article
The authors used this protocol in:
Nov 2021
Advertisement


Protocol Collections
Comprehensive collections of detailed, peer-reviewed protocols focusing on specific topics


Related protocols
Abstract
Intermediate states are often populated during the folding and unfolding reactions of a protein, and their detection is very challenging as they form transiently. Structural characterization of these short-lived intermediate species is difficult as it requires high-resolution methodologies. Hydrogen exchange-mass spectrometry (HX-MS) can identify and yield direct structural information on folding and unfolding intermediates, as well as information about the cooperativity of the folding or unfolding processes. The mass distributions of intact protein molecules are obtained first to determine their exchange pattern. Then, segment-specific structural information is obtained by analyzing the fragments of the protein. Enzymatic digestion is widely used with HX to determine the sequence-specific structural changes that occur to the protein during folding or unfolding. However, if a protein is an inhibitor of the protease, then alternative methodologies are required. Using electron transfer dissociation (ETD), it is possible to fragment the protein inside a mass spectrometer, and segment-specific structural changes occurring during the folding and unfolding process can be determined. In the case of HX-ETD-MS, protein molecules are first allowed to undergo HX, followed by their fragmentation. Deuterium retention in each fragment is measured. Very little, if any, scrambling of deuterium across fragments occurs during ETD-enabled fragmentation; hence, there is little scope for misinterpretation of the HX data.
Key features
• Analysis of intact protein data allows the identification of the intermediate states even in native and native-like conditions.
• Precursor mass is determined from the intact protein analysis.
• Fragments undergoing cooperative and non-cooperative transitions during protein unfolding can be distinguished from each other using HX-ETD-MS.
• Analysis of the protein fragments that are obtained using ETD also enables the determination of the sequence of structural changes occurring in the protein.
• HX-ETD-MS can provide structural insights into transiently formed intermediate states.
Keywords: Non-cooperativeGraphical overview
Protein structural characterization using hydrogen exchange–electron transfer dissociation–mass spectrometry (HX-ETD-MS)
Background
Protein folding or unfolding reactions can vary from being highly cooperative to being non-cooperative in nature. A cooperative transition does not involve the formation of any intermediate states [1,2], whereas multiple intermediates are populated during a non-cooperative transition [3–7]. If the partially unfolded intermediate states are not populated to detectable extents, then the folding or unfolding reaction might appear to be a cooperative process [8–11]. Conventional ensemble-averaging probes such as fluorescence or circular dichroism (CD), which are commonly used to study protein folding and unfolding reactions, are unable to detect sparsely populated intermediate species. High-resolution methodologies are required that can not only detect co-existing conformations but also quantify them. Methodologies such as hydrogen exchange (HX) [12–16], sulfhydryl exchange (SX) [17,18], time-resolved fluorescence resonance energy transfer (trFRET) [19,20], and single-molecule FRET (smFRET) [21] have the potential to quantitatively measure the populations of co-existing conformations, and hence have been used to delineate the sequence of structural changes that occur during folding and unfolding. These methodologies have also enabled the structural characterization of transiently formed intermediate states very efficiently [22–25].
However, fluorescence studies require labeling of the protein with a high quantum yield dye, which is not very straightforward. Incorporation of the dye might also have some implications for the secondary and tertiary structure of the protein. On the other hand, HX studies typically rely on enzymatic digestion by pepsin for fragmenting the protein in order to determine where the protein exchange occurred. While pepsin digestion is easy to carry out [12,23,26,27], some proteins are inhibitors of pepsin, disallowing its use [16,28]. As electron transfer dissociation (ETD) involves the fragmentation of the protein inside the mass spectrometer, it has the advantage that it can be used for all proteins. This method was discovered in 2004 [29]. Briefly, a small chemical molecule having a lower electron affinity is allowed to transfer its electron to the protein backbone under a set of conditions. This energizes the protein molecule, leading to its fragmentation at the N-Cα bond, generating c and z ions. ETD has been used in the past to study posttranslational modifications of protein [30,31] and protein–protein interactions [32]. Coupling ETD with HX allows the study of the structural changes occurring in a protein during folding, and the structural characterization of the intermediate states [7,16,28]. The disadvantage of this method is the very low fragmentation efficiency of the protein. The intensities of the peptides are often very low, and many peptides cannot be detected reliably.
HX-MS is not only used to study protein folding but has also been used to study protein–protein interactions, protein–drug interactions, etc. Moreover, mass spectrometry alone has a broad application in proteomics studies. For larger proteins, enzymatic digestion does not give full coverage of the sequence; hence, enzymatic digestion can be coupled with ETD to increase the sequence coverage. This will enable the reliable detection and identification of the proteins and their interacting partners [33].
Materials and reagents
Reagents
1. Guanidine hydrochloride (GdnHCl) (United States Biochemicals, catalog number: 75823)
2. Deuterium oxide (D2O) (Sigma-Aldrich, catalog number: 151882)
3. Tris base (Sigma-Aldrich, catalog number: T1378)
4. Glycine (United States Biochemicals, catalog number: 75826)
5. Sodium hydroxide (Fischer chemicals, catalog number: S318)
6. Hydrochloric acid (HCl) (Fischer chemicals, catalog number: A144S)
7. Sodium deuteroxide (NaOD) (Sigma-Aldrich, catalog number: 176788)
8. Deuterium chloride (DCl) (Sigma-Aldrich, catalog number: 543047)
9. 1,4-dicyano benzene (Sigma-Aldrich, catalog number: D76722)
10. Formic acid (Merck, catalog number: 5.33002.0050)
11. Acetonitrile (Merck, catalog number: 1.00029.2500)
12. Horse heart myoglobin (Sigma-Aldrich, catalog number: M1882)
13. Glu-fibrinopeptide (Waters, catalog number: 700004729)
14. Ice-cold Mili-Q water at pH 2.6 (adjust pH with LC–MS-grade formic acid)
Solutions
1. Labeling buffer (see Recipes)
2. Quenching buffer (see Recipes)
3. Tris D2O buffer (see Recipes)
Recipes
1. Labeling buffer (50 mL)
| Reagent | Final concentration | Quantity or volume |
|---|---|---|
| Tris (2 M) | 20 mM | 500 μL |
| H2O | n/a | see note* |
| Total | n/a | 50 mL |
*Add water up to 45 mL, adjust pH to 8 by adding HCl, and make up the volume to 50 mL. Filter the solution using a 0.22 μm filter.
2. Quenching buffer (50 mL)
| Reagent | Final concentration | Quantity or volume |
|---|---|---|
| Glycine (2 M) | 100 mM | 2.5 mL |
| Guanidine hydrochloride | 8 M | 38.2 g |
| H2O | n/a | see note* |
| Total | n/a | 50 mL |
*Add water up to 45 mL. While dissolving GdnHCl, put the beaker in hot water to facilitate the hydration of GdnHCl. Adjust the pH to 2.2 by adding HCl, then make up the volume to 50 mL. Filter the solution using a 0.22 μm filter.
3. Tris D2O buffer (10 mL)
| Reagent | Final concentration | Quantity or volume |
|---|---|---|
| Tris in D2O (2 M) | 10 mM | 50 μL |
| D2O | n/a | see note* |
| Total | n/a | 10 mL |
*Add D2O up to 8 mL and adjust pH to 8.2 by adding DCl. Then, make up the volume to 10 mL and filter the solution using a 0.22 μm filter.
Laboratory supplies
1. 1.5 mL microcentrifuge tube (Tarsons, catalog number: 500010)
2. 0.22 µm filters (Sartorius, catalog number: 16534K)
3. CD cuvette (Starna Scientific, catalog number: 21/Q/1)
4. Hamilton glass syringe (Hamilton company, catalog number: 81165/00)
5. Sephadex G-25 Hi-trap desalting column (Cytiva, catalog number: 17140801)
6. C18 VanGuard trap column (Waters, catalog number: 186003975)
7. C18 analytical column (Waters, catalog number: 186002346)
Equipment
1. High-definition mass spectrometer (Waters Corporation, model: Synapt G2)
2. UPLC (Waters corporation, model: nanoAcquity)
3. HDX module (Waters corporation)
4. Chromatographic system (Postnova, model: AF4)
5. Cary spectrophotometer (Agilent)
6. Refractometer (Abbe)
7. pH meter (Thermo Scientific)
8. CD spectrophotometer (Jasco J15)
Software and datasets
1. MassLynx (SCN 781, Waters)
2. Microsoft Excel (MS office home and student 2016) from Microsoft
3. SigmaPlot (v12.0, Systat Software Inc.)
4. OriginPro (v9.0, OriginLab)
5. Pymol molecular graphics system (v2.3.3)
Procedure
We describe below the step-by-step procedure for performing the HX experiment on intact protein, followed by analysis of either the intact protein or protein fragments. Intact protein analysis is necessary before proceeding to the analysis of protein fragments. The precursor mass, which is allowed to undergo fragmentation by the ETD method, is obtained from the analysis of the intact protein. Moreover, analysis of the intact protein identifies the high-energy intermediate(s) populating during the unfolding reaction and sheds light on the cooperativity of the unfolding process.
A. Deuteration of protein
1. Dissolve 7–8 mg of the lyophilized protein in 500 μL of D2O buffer. Check the concentration of the protein by measuring the absorbance at 280 nm using a spectrophotometer. For double-chain monellin (dcMN), the absorbance coefficient value used is 14,600 M-1·cm-1.
Critical: The initial protein concentration before the pH jump should be higher than the desired working stock concentration, as the protein concentration decreases during the pH jump due to the addition of NaOD and DCl. For example, an ideal initial protein concentration would be in the range of 250–300 μM to obtain a deuterated protein stock with a final concentration of 200 μM.
2. Increase the pH of the solution to 12.8 by the addition of 1 N NaOD and incubate it for 5 min at room temperature (see General note 1).
3. Decrease the pH directly to 1.6 by adding 1 N DCl (see General note 2).
4. Finally, increase the pH gradually to 8 by adding NaOD.
Critical: Determine the volumes of NaOD and DCl required for the pH jump in a separate experiment using only buffer solutions. Use an equal volume of D2O buffer and perform the pH jump with 1 N NaOD and 1 N DCl. Once the appropriate volumes are established, use the same volumes of base and acid for deuterating the protein. This approach avoids consuming protein during the standardization of the deuteration protocol.
5. Check the concentration of the deuterated protein.
6. Dilute the deuterated protein with D2O buffer to make a working deuterated protein stock with a final protein concentration of 200 μM.
7. Check the mass of the deuterated protein.
Alternative method: The protein can also be deuterated by a temperature jump [26]. A high temperature unfolds the protein, allowing full deuteration. The protein is then refolded at a lower temperature.
8. Check the Far-UV CD spectra of the protonated and deuterated protein to confirm that no secondary structural change occurred due to pH jump (Figure 1). For acquiring spectra, use a protein concentration of 10 μM.
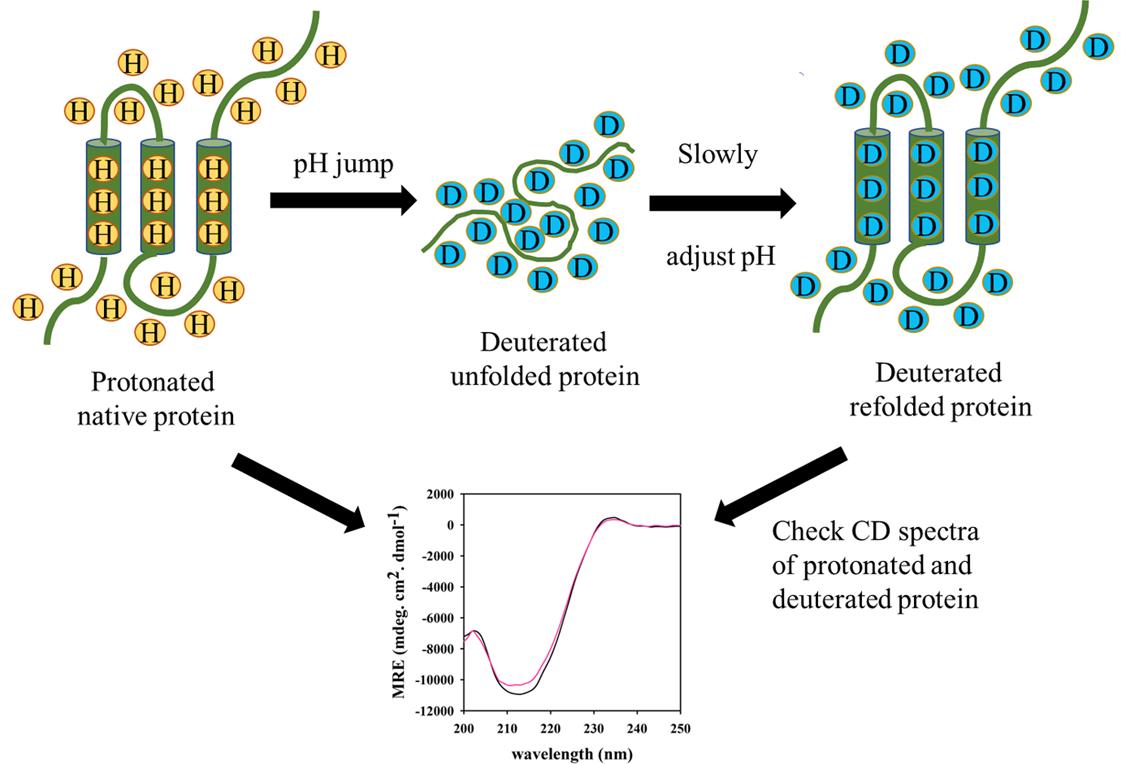
Figure 1. Deuteration of a protein by pH jump. The Far-UV circular dichroism (CD) spectra are acquired before and after the pH jump to look for any structural perturbations that may occur during the pH jump.
B. HX into the deuterated protein
1. Mix 7 μL of 200 μM deuterated protein in D2O buffer with 133 μL of protonated labeling buffer to start the exchange reaction.
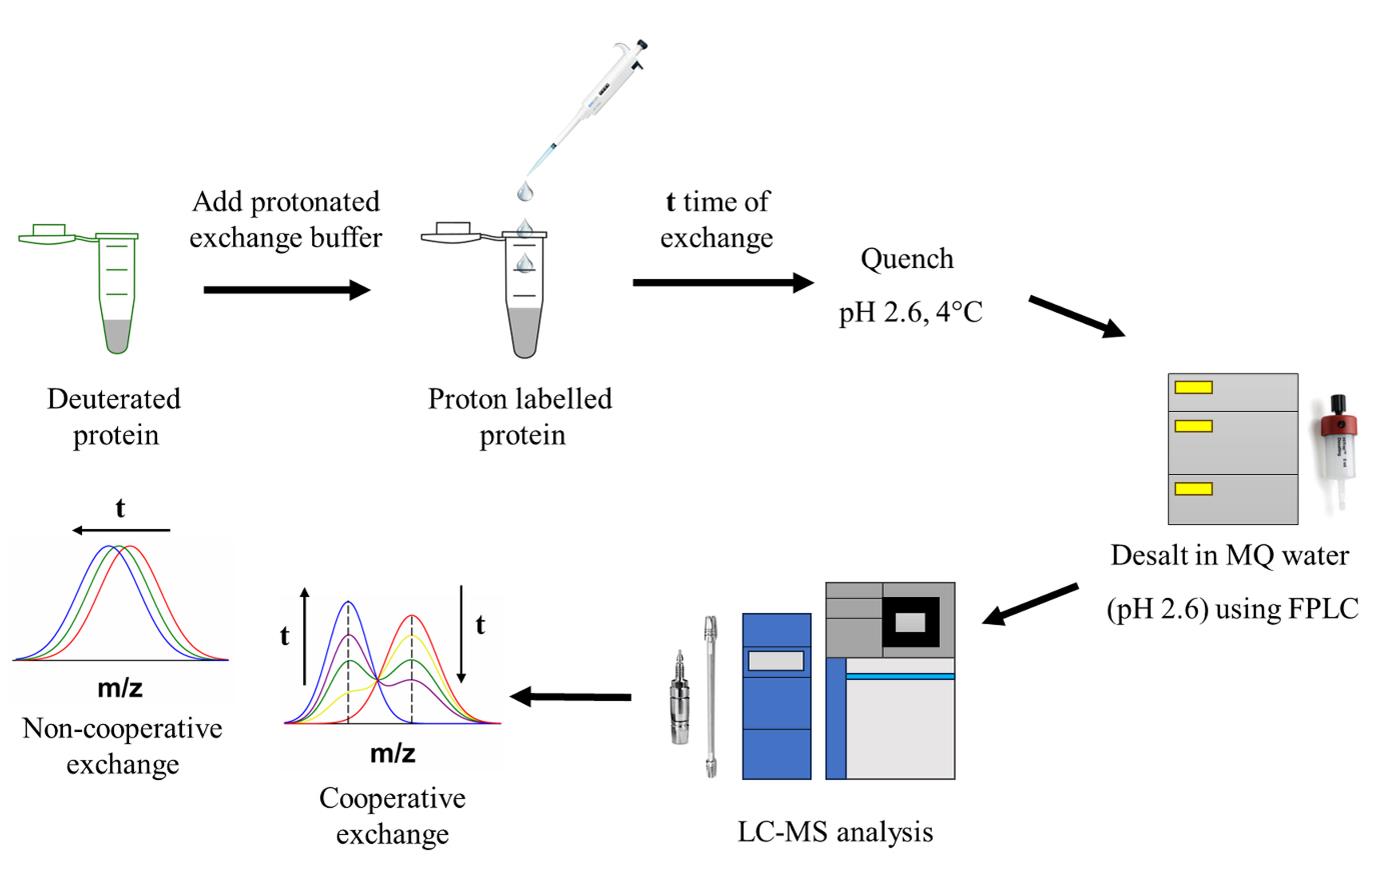
2. At different times of exchange, mix 125 μL of exchange reaction with 375 μL of quenching buffer on ice (Figure 2).
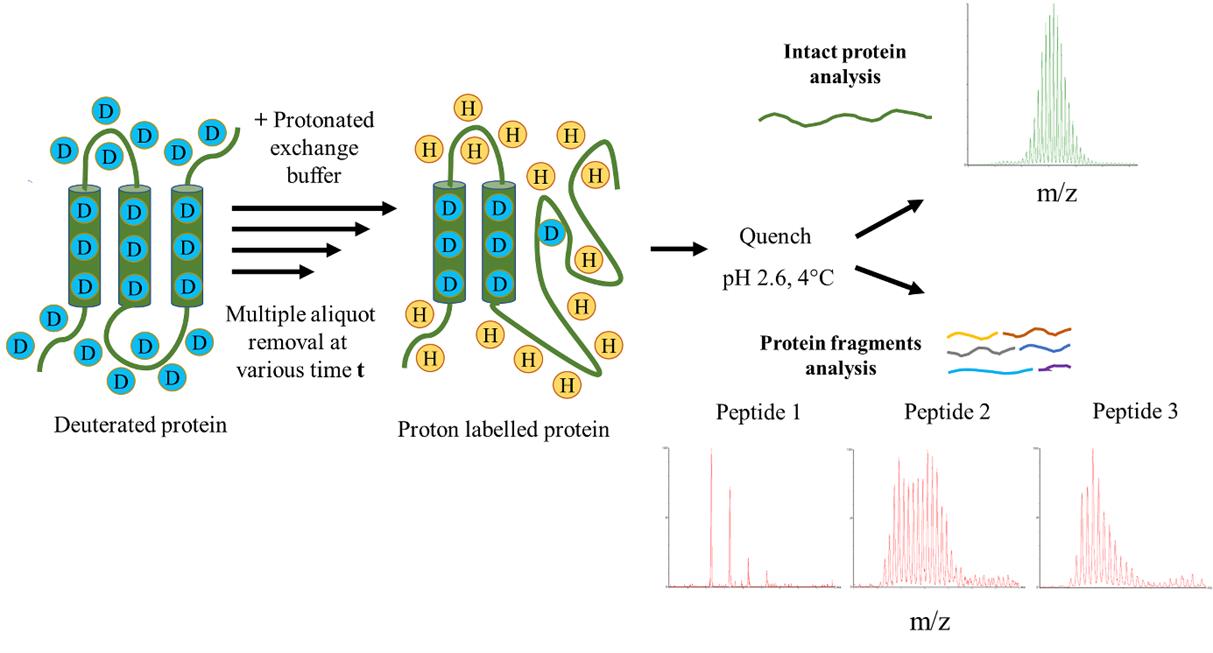
Figure 2. Hydrogen exchange (HX) into a protein. The deuterated native protein is diluted into protonated exchange buffer in order to initiate labeling. The exchange buffer may contain a denaturant that promotes the unfolding of the protein. The part of the protein that loses its structure transiently within the labeling time undergoes labeling/exchange. Labeling is stopped by quenching the reaction by reducing both the pH to 2.6 and the temperature of the solution to 0–4 °C. Samples are then analyzed either of the intact protein or of fragments.
3. Incubate the samples at quenching conditions (pH 2.6, 4 °C) for 1 min.
Critical: A back-exchange control sample must also be examined to determine the number of deuteriums lost during the sample processing (see below). For the back-exchange control, use the deuterated buffer instead of the protonated labeling buffer.
C. Sample processing for mass spectrometry
1. Desalt the reaction mixture with ice-cold acidic water at pH 2.6 using a Sephadex G-25 Hi-trap desalting column from GE.
Critical: The flow rate must be 5 mL/min, because a lower flow rate leads to greater loss of deuterium during desalting.
2. Collect around 300–500 μL of desalted protein and readily inject it into the HDX module coupled to a nanoAcquity UPLC.
Critical: Collect only the rising arm of the chromatogram as GdnHCl starts eluting afterward.
3. Workflow for intact protein analysis and chain separation using C18 reverse phase chromatography:
a. Intact protein analysis
i. First, load the protein onto a C18 reverse phase VanGuard trap column using Mili-Q water containing 0.05% formic acid at a flow rate of 100 μL/min for 1 min.
ii. Use the following acetonitrile gradients to elute the protein from the trap column as mentioned below in Table 1.
Table 1. Acetonitrile gradient used to elute the intact protein
| Step no. | Time (min) | Flow rate (μL/min) | Water with 0.1% formic acid | Acetonitrile with 0.1% formic acid |
|---|---|---|---|---|
| 1 | Initial | 40 | 97 | 3 |
| 2 | 1 | 40 | 65 | 35 |
| 3 | 2 | 40 | 5 | 95 |
| 4 | 2.5 | 40 | 97 | 3 |
| 5 | 3 | 40 | 97 | 3 |
b. Separation of the two chains of the protein: For carrying out ETD, the chains/subunits of multichain/multisubunit protein need to be separated, as only one precursor mass can be allowed to undergo ETD fragmentation at a time. To separate the two chains, an analytical (C18 reverse phase) column needs to be attached after the VanGuard trap column.
i. After step C2, load the protein onto a C18 reverse phase VanGuard trap column using Mili-Q water containing 0.05% formic acid at a flow rate of 100 μL/min for 1.5 min.
ii. Use the following acetonitrile gradients to separate the chains of the protein by the analytical column as mentioned below in Table 2.
Table 2. Acetonitrile gradient used to separate the chains of the protein
| Step no. | Time (min) | Flow rate (μL/min) | Water with 0.1% formic acid | Acetonitrile with 0.1% formic acid |
|---|---|---|---|---|
| 1 | Initial | 40 | 97 | 3 |
| 2 | 0.5 | 40 | 65 | 35 |
| 3 | 2.5 | 40 | 60 | 40 |
| 4 | 4.5 | 40 | 55 | 45 |
| 5 | 7 | 40 | 50 | 50 |
| 6 | 7.5 | 40 | 5 | 95 |
| 7 | 8 | 40 | 97 | 3 |
| 8 | 9 | 40 | 97 | 3 |
4. Maintain the temperature of the entire chromatographic assembly (VanGuard trap column, analytical column, and the tubing connecting the columns) at 4 °C to minimize back-exchange during sample processing [34].
5. Carry out 1–2 blank runs in between two consecutive sample runs by injecting only water.
Critical: This step is necessary in order to minimize the carry-over from the previous sample run.
D. Data acquisition
1. Use the following source parameters for ionization while analyzing the intact protein:
Capillary voltage: 3 kV
Sample cone voltage: 40 V
Extraction cone voltage: 4 V
Source temperature: 80 °C
Desolvation temperature: 200 °C
2. Calibrate the mass spectrometer in resolution mode using horse heart myoglobin (HHM) as a standard before the start of the acquisition.
3. Acquire the data for 3 min.
4. For ETD experiments, calibrate the mass spectrometer in the resolution MS/MS mode using Glu-fibrinopeptide (GFP) before the start of the acquisition.
5. After calibration, check the ETD reagent (1,4-dicyanobenzene) count in the ETD glow discharge mode. Use a glow discharge current of 35 μA and a makeup gas (nitrogen) with a flow rate of 35 mL/min. Reagent ion counts must be >106 per scan to obtain an efficient fragmentation of the protein.
6. Use the following instrument parameters for ETD:
Trap wave velocity: 350 m/s
Trap wave height: 0.5 V
Transfer collision energy ramp: 10–14 eV
Use the same source parameters as mentioned in step D1.
7. Acquire data for the protein chain that elutes first from the analytical column, followed by the next chain. For dcMN, chain A elutes faster than chain B; hence, chain A is fragmented before chain B.
8. Allow one precursor mass at a time for each chain to undergo fragmentation by ETD.
Critical: Allow the highest intensity peak as the precursor to obtain optimal fragmentation.
9. Acquire the data on multiple channels, depending on the number of protein chains. For example, if the protein is composed of two chains (like dcMN), use two channels. For proteins with a higher number of chains/subunits, use a higher number of channels (see General note 3).
Data analysis
A. Analysis of intact protein data
1. Combine 40–50 scans (each 1 s long) from the elution peak of the total ion count (TIC) chromatogram to generate the protein mass spectrum at each time point (Figure 3).
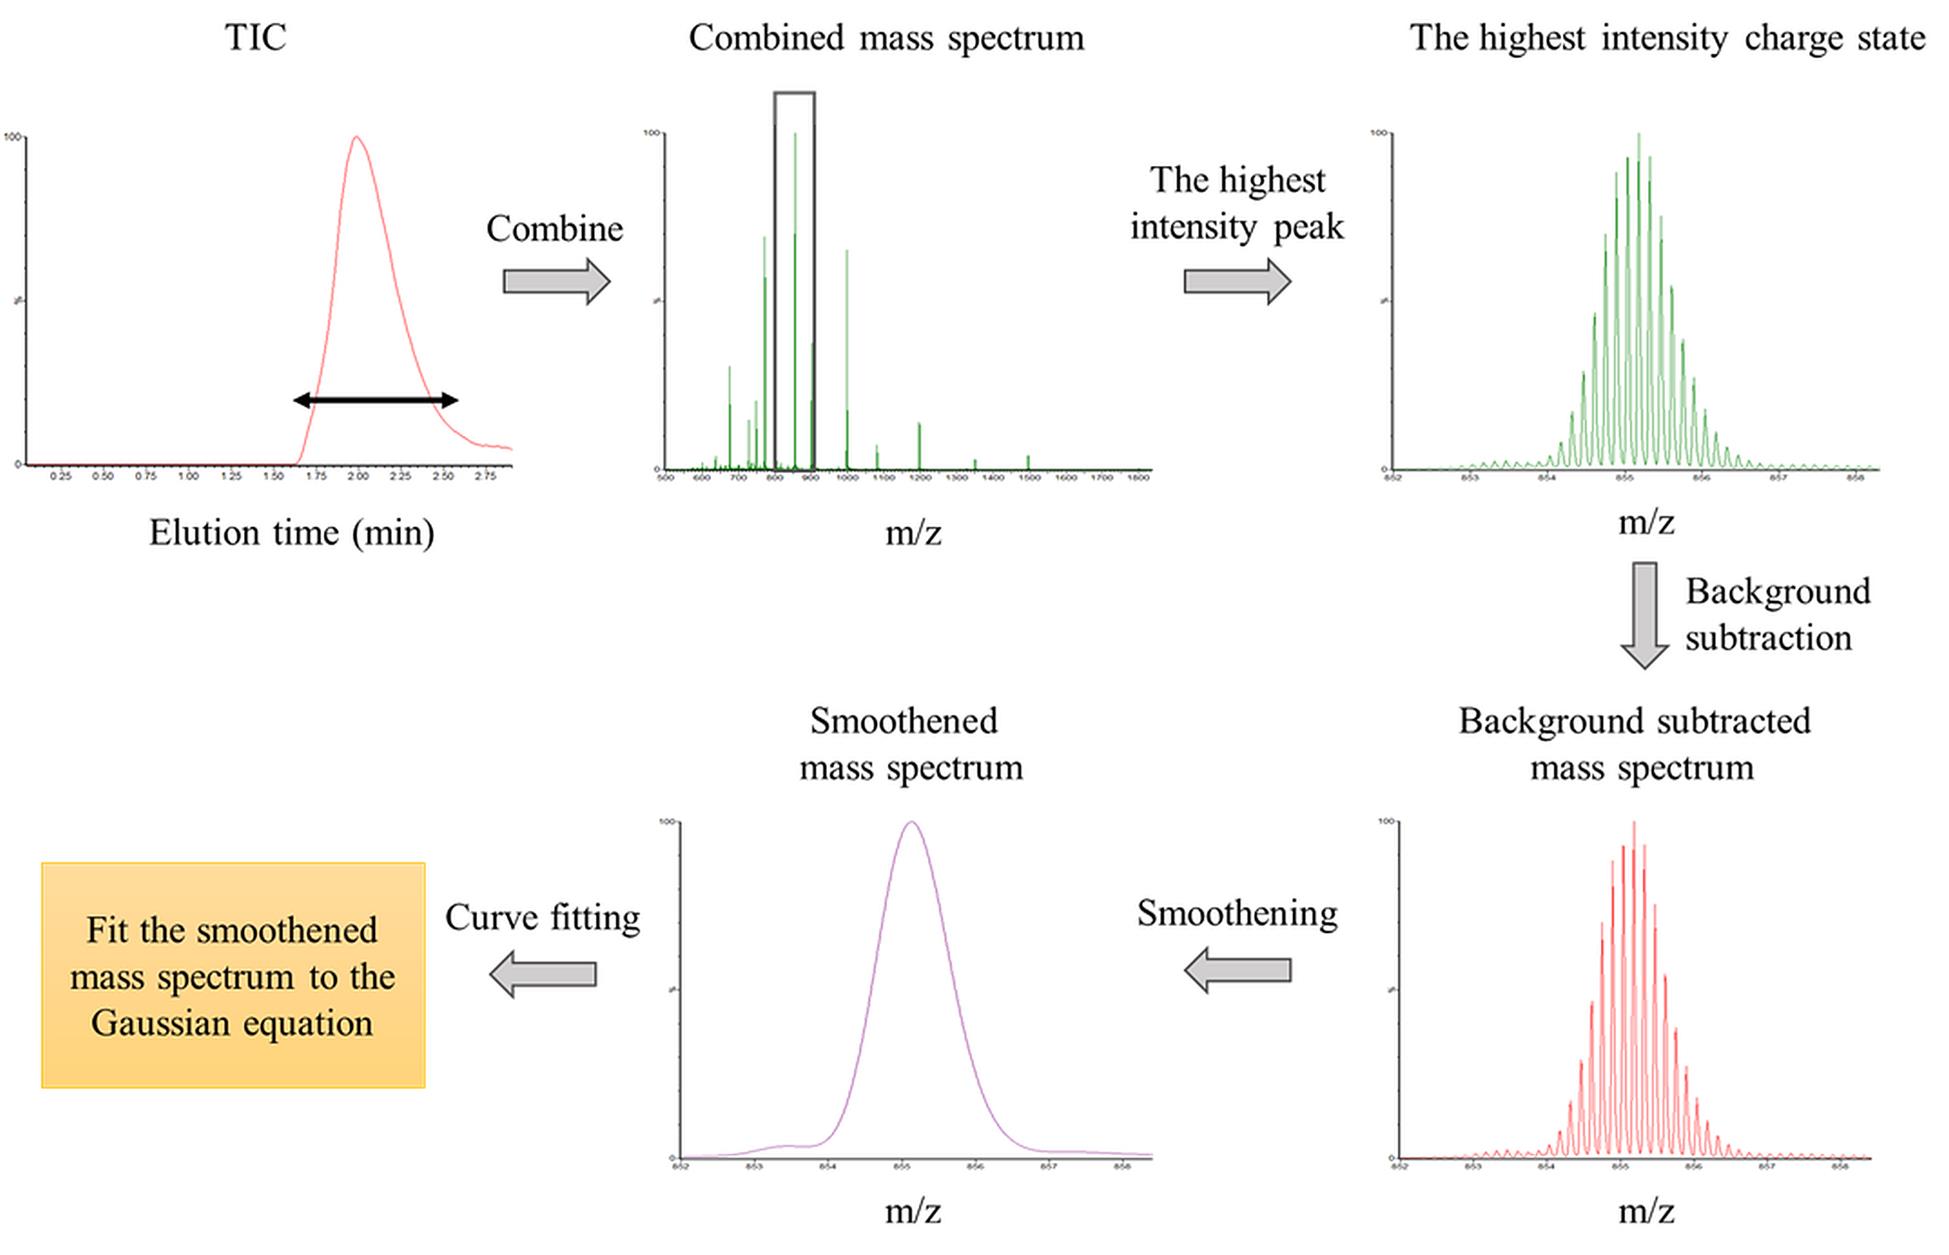
Figure 3. Analysis of the mass spectrum of intact protein
2. Perform background subtraction (20% of maximum peak intensity) using the MassLynx software.
3. Smoothen the spectrum using the Savitzky–Golay function (see General note 4).
4. Take the highest intensity peak at every time point and calculate the total area under the curve using the Origin software.
5. Normalize the mass distribution at every time point with the corresponding total area under the curve.
6. Fit the area-normalized mass distributions to either a single Gaussian equation (if it is unimodal) or to the sum of two Gaussian equations (if it is bimodal) and determine the width, height, and centroid of the mass distribution at each time point.
7. Calculate the number of deuteriums retained at a particular time point by each chain by subtracting the protonated chain mass from the mass obtained from the centroid of the mass distribution.
8. Determine the rate constant of exchange (opening to HX) by fitting the number of deuteriums retained vs. the time of exchange plot to a single, double, or triple exponential equation using the SigmaPlot software.
9. Also, obtain the fraction of completely unfolded protein by dividing the area under the lower m/z peak by the total area under mass distribution.
10. Fit the fraction of completely unfolded protein vs. the time of exchange plot to a single exponential equation to determine the rate constant of the slowest phase of exchange.
B. Analysis of ETD fragments data
1. First, generate the peptide map of the protein by fragmenting it using ETD. Identify the c and z ions corresponding to the different chains using Biolynx software. For example, the peptide map of dcMN generated by ETD fragmentation is shown in Figure 4.
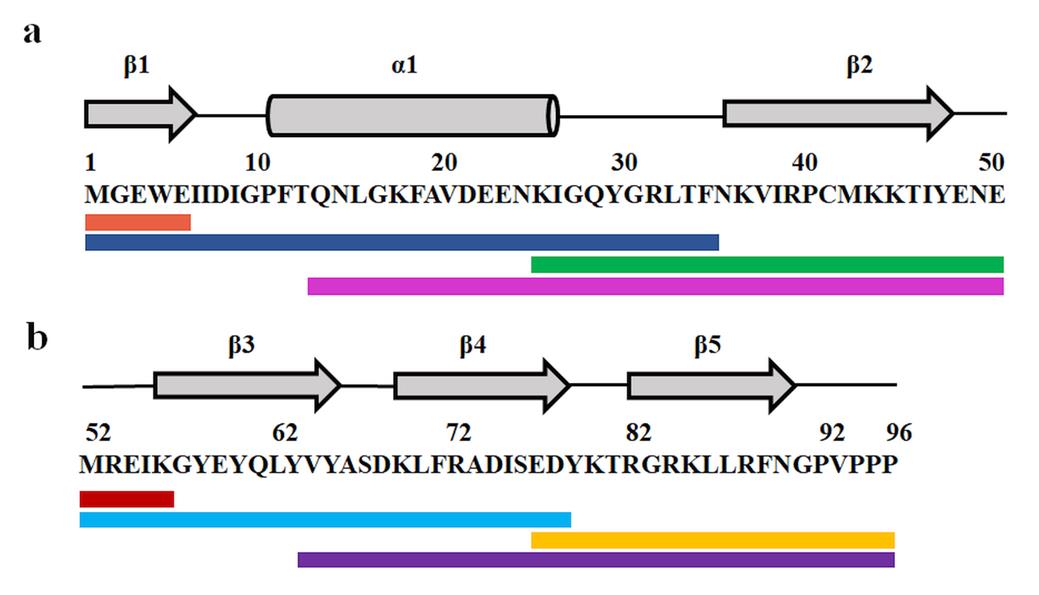
Figure 4. Electron transfer dissociation (ETD) fragmentation of chain B (panel a) and chain A (panel b) of double-chain monellin (dcMN). The c and z ions obtained from ETD fragmentation have been mapped onto the sequence and secondary structure of the protein. The grey arrows and the bar represent the β-strands and the sole α-helix, respectively. The solid lines in different colors below the sequence show the c and z ions. (a) Ions from chain B: c4 (Met1–Glu5; orange), c34 (Met1–Phe35; blue), z26 (Lys25–Glu51; green), and z37 (Gln14–Glu51; pink). (b) Ions from chain A: c4 (Met52–Lys56; red), c26 (Met52–Asp78; cyan), z19 (Glu77–Pro96; yellow), and z32 (Val64–Pro96; purple). The figure is adapted from Bhattacharjee and Udgaonkar [16].
Table 3. Determination of the number of deuteriums retained by individual sequence segments of chain B (text underlined) and chain A (text in italics) of dcMN from their corresponding ETD ions shown in Figure 4. The table is adapted from Bhattacharjee and Udgaonkar [16].
| Calculation | Sequence segment |
|---|---|
| c4 | Met1 – Glu5 |
| c34 – [c4 + (z37 – z26) + (z26 – [Intact chain B – c34])] | Ile6 – Thr13 |
| z37 – z26 | Gln14 – Asn25 |
| z26 – (Intact chain B – c34) | Lys26 – Phe35 |
| Intact chain B – c34 | Asn36 – Glu51 |
| c4 | Met52 – Lys56 |
| c26 | Gly57 – Asp78 |
| z32 – z19 | Val64 – Ser76 |
| z19 | Glu77 – Pro96 |
2. Generate the mass spectra of the ETD fragments of the different chains by combining the elutionpeaks of the TIC chromatograms obtained separately for the different chains.
3. Obtain the centroid mass spectra from the combined mass spectra of each peptide and analyze using the Biolynx software to identify the individual c and z ions of the different chains.
4. Determine the width, height, and centroid of the mass distribution of each ion generated by ETD in the same way as was done for the intact protein (see step A6).
5. Calculate the masses of the individual ions from the intensity-weighted isotopic abundances and determine the deuterium retained by each fragment at a particular time in the same way as was done for the intact protein (see step A7). Determine the extent of exchange at different sequence segments by doing multiple subtractions with consecutive c and z ions. The same process was employed to analyze the fragments of dcMN (Table 3) [16].
6. Obtain the kinetic traces for HX into different sequence segments by plotting the number of deuteriums retained vs. the time of exchange for each fragment and analyze in the same way as was done for the intact protein (see step A8).
7. Compare the rates of unfolding of different fragments to identify the secondary structural elements of the protein that undergo fast unfolding and the other secondary structural elements opening up in subsequent steps during unfolding.
8. Depending on the shapes of the mass distributions (unimodal vs. bimodal) of each fragment, identify the cooperativity of unfolding of different parts of the protein.
Validation of protocol
This protocol has been used and validated in the following research article:
• Bhattacharjee and Udgaonkar. [16]. Structural characterization of the cooperativity of unfolding of a heterodimeric protein using hydrogen exchange-mass spectrometry. Journal of molecular biology 433, 167268.
The protocol was first used to structurally characterize single-chain monellin (MNEI) protein [28]. In that study, it was shown that different secondary structural elements unfold in a gradual manner during the unfolding in native and native-like conditions, and the sequence of structural changes was determined. A simpler version of the protocol was used, since MNEI is a single-chain protein, and no analytical column was used. The data was also acquired on only one channel.
However, the protocol was modified to use for the two-chain protein to structurally characterize it as well. In this protocol, the chains were separated using an analytical column, followed by fragmentation of each chain using ETD. For double-chain monellin (dcMN), it was shown using this HX-ETD-MS protocol that chain B unfolds in a gradual manner, whereas chain A unfolds in a cooperative manner in native and native-like conditions (Figure 2 of [16]). In mild denaturing conditions, both chains B and A unfold in a cooperative manner (Figure 3 of [16]). The sequence of structural events occurring during unfolding in both native and mildly denaturing conditions was determined (Figures 5 and 6 of [16]). Moreover, the differences in the sequence of structural events occurring in the two conditions were also identified (Figure 7 of [16]). This protocol was used in a robust manner in the study of dcMN to structurally characterize the high-energy intermediates that populate during unfolding. Each experiment was repeated at least once.
General notes and troubleshooting
General notes
1. High pH promotes the unfolding of protein. Long-time exposure at high pH might cause deamidation.
2. Decrease the pH of the solution from high to low directly to prevent precipitation.
3. Multiple channels allow different precursor masses to be sequentially selected for ETD fragmentation. Since only one precursor mass can be transmitted through the quadrupole at a time during ETD, multiple channels are required to acquire data for multiple precursor ions. The number of channels should be adjusted based on the number of protein chains or subunits being analyzed.
4. Increase the number of smoothing iterations as needed to produce a well-smoothed spectrum.
Troubleshooting
Problem 1: Low ETD reagent count.
Possible cause: Dirty source block and ETD needle, and/or misorientation of the ETD needle.
Solution: Clean the source block and ETD needle, and properly orient it.
Problem 2: No fragmentation of the protein.
Possible cause: Low ETD reagent counts, and/or low protein concentration.
Solution: Clean the source block and ETD needle, and properly orient it. If necessary, increase protein concentration. Purity of protein might also affect the signal.
Acknowledgments
J.B.U. is a recipient of a JC Bose National Research Fellowship from the Government of India. This work was funded by the Tata Institute of Fundamental Research, Indian Institute of Science Education and Research Pune, and by the Department of Science and Technology, Government of India. We thank all the lab members for their insightful discussions. This protocol was used in Bhattacharjee and Udgaonkar [16]. Structural characterization of the cooperativity of unfolding of a heterodimeric protein using hydrogen exchange-mass spectrometry. Journal of molecular biology 433, 167268.
Competing interests
The authors declare no competing interests.
References
- Chan, H. S., Bromberg, S. and Dill, K. A. (1995). Models of cooperativity in protein folding. Philos Trans R Soc Lond, B, Biol Sci. 348(1323): 61–70. https://doi.org/10.1098/rstb.1995.0046
- Yang, W. Y. and Gruebele, M. (2003). Folding at the speed limit. Nature. 423(6936): 193–197. https://doi.org/10.1038/nature01609
- Swaminathan, R., Nath, U., Udgaonkar, J. B., Periasamy, N. and Krishnamoorthy, G. (1996). Motional Dynamics of a Buried Tryptophan Reveals the Presence of Partially Structured Forms during Denaturation of Barstar. Biochemistry. 35(28): 9150–9157. https://doi.org/10.1021/bi9603478
- Lakshmikanth, G., Sridevi, K., Krishnamoorthy, G. and Udgaonkar, J. B. (2001). Structure is lost incrementally during the unfolding of barstar. Nat Struct Biol. 8(9): 799–804. https://doi.org/10.1038/nsb0901-799
- Ahmed, Z., Beta, I. A., Mikhonin, A. V. and Asher, S. A. (2005). UV−Resonance Raman Thermal Unfolding Study of Trp-Cage Shows That It Is Not a Simple Two-State Miniprotein. J Am Chem Soc. 127(31): 10943–10950. https://doi.org/10.1021/ja050664e
- Waldauer, S. A., Bakajin, O., Ball, T., Chen, Y., DeCamp, S. J., Kopka, M., Jäger, M., Singh, V. R., Wedemeyer, W. J., Weiss, S., et al. (2008). Ruggedness in the folding landscape of protein L. HFSP J. 2(6): 388–395. https://doi.org/10.2976/1.3013702
- Bhattacharjee, R. and Udgaonkar, J. B. (2022). Differentiating between the sequence of structural events on alternative pathways of folding of a heterodimeric protein. Protein Sci. 31(12): e4513. https://doi.org/10.1002/pro.4513
- Zaidi, F. N., Nath, U. and Udgaonkar, J. B. (1997). Multiple intermediates and transition states during protein unfolding. Nat Struct Biol. 4(12): 1016–1024. https://doi.org/10.1038/nsb1297-1016
- Sánchez, I. E. and Kiefhaber, T. (2003). Evidence for Sequential Barriers and Obligatory Intermediates in Apparent Two-state Protein Folding. J Mol Biol. 325(2): 367–376. https://doi.org/10.1016/s0022-2836(02)01230-5
- Aviram, H. Y., Pirchi, M., Barak, Y., Riven, I. and Haran, G. (2018). Two states or not two states: Single-molecule folding studies of protein L. J Chem Phys. 148(12): e4997584. https://doi.org/10.1063/1.4997584
- Bai, Y. (2003). Hidden intermediates and levinthal paradox in the folding of small proteins. Biochem Biophys Res Commun. 305(4): 785–788. https://doi.org/10.1016/s0006-291x(03)00800-3
- Miranker, A., Robinson, C. V., Radford, S. E., Aplin, R. T. and Dobson, C. M. (1993). Detection of Transient Protein Folding Populations by Mass Spectrometry. Science. 262(5135): 896–900. https://doi.org/10.1126/science.8235611
- Bai, Y., Sosnick, T. R., Mayne, L. and Englander, S. W. (1995). Protein Folding Intermediates: Native-State Hydrogen Exchange. Science. 269(5221): 192–197. https://doi.org/10.1126/science.7618079
- Wani, A. H. and Udgaonkar, J. B. (2009). Native state dynamics drive the unfolding of the SH3 domain of PI3 kinase at high denaturant concentration. Proc Natl Acad Sci USA. 106(49): 20711–20716. https://doi.org/10.1073/pnas.0908617106
- Malhotra, P. and Udgaonkar, J. B. (2015). Tuning Cooperativity on the Free Energy Landscape of Protein Folding. Biochemistry. 54(22): 3431–3441. https://doi.org/10.1021/acs.biochem.5b00247
- Bhattacharjee, R. and Udgaonkar, J. B. (2021). Structural Characterization of the Cooperativity of Unfolding of a Heterodimeric Protein using Hydrogen Exchange-Mass Spectrometry. J Mol Biol. 433(23): 167268. https://doi.org/10.1016/j.jmb.2021.167268
- Malhotra, P. and Udgaonkar, J. B. (2014). High-Energy Intermediates in Protein Unfolding Characterized by Thiol Labeling under Nativelike Conditions. Biochemistry. 53(22): 3608–3620. https://doi.org/10.1021/bi401493t
- Jha, S. K. and Udgaonkar, J. B. (2007). Exploring the Cooperativity of the Fast Folding Reaction of a Small Protein Using Pulsed Thiol Labeling and Mass Spectrometry. J Biol Chem. 282(52): 37479–37491. https://doi.org/10.1074/jbc.m706714200
- Kishore, M., Krishnamoorthy, G. and Udgaonkar, J. B. (2013). Critical Evaluation of the Two-State Model Describing the Equilibrium Unfolding of the PI3K SH3 Domain by Time-Resolved Fluorescence Resonance Energy Transfer. Biochemistry. 52(52): 9482–9496. https://doi.org/10.1021/bi401337k
- Sridevi, K., Lakshmikanth, G., Krishnamoorthy, G. and Udgaonkar, J. B. (2004). Increasing Stability Reduces Conformational Heterogeneity in a Protein Folding Intermediate Ensemble. J Mol Biol. 337(3): 699–711. https://doi.org/10.1016/j.jmb.2003.12.083
- Kuzmenkina, E. V., Heyes, C. D. and Ulrich Nienhaus, G. (2006). Single-molecule FRET Study of Denaturant Induced Unfolding of RNase H. J Mol Biol. 357(1): 313–324. https://doi.org/10.1016/j.jmb.2005.12.061
- Pan, H., Raza, A. S. and Smith, D. L. (2004). Equilibrium and Kinetic Folding of Rabbit Muscle Triosephosphate Isomerase by Hydrogen Exchange Mass Spectrometry. J Mol Biol. 336(5): 1251–1263. https://doi.org/10.1016/j.jmb.2003.12.076
- Hu, W., Walters, B. T., Kan, Z. Y., Mayne, L., Rosen, L. E., Marqusee, S. and Englander, S. W. (2013). Stepwise protein folding at near amino acid resolution by hydrogen exchange and mass spectrometry. Proc Natl Acad Sci USA. 110(19): 7684–7689. https://doi.org/10.1073/pnas.1305887110
- Walters, B. T., Mayne, L., Hinshaw, J. R., Sosnick, T. R. and Englander, S. W. (2013). Folding of a large protein at high structural resolution. Proc Natl Acad Sci USA. 110(47): 18898–18903. https://doi.org/10.1073/pnas.1319482110
- Aghera, N. and Udgaonkar, J. B. (2017). Stepwise Assembly of β-Sheet Structure during the Folding of an SH3 Domain Revealed by a Pulsed Hydrogen Exchange Mass Spectrometry Study. Biochemistry. 56(29): 3754–3769. https://doi.org/10.1021/acs.biochem.7b00374
- Jethva, P. N. and Udgaonkar, J. B. (2017). Modulation of the Extent of Cooperative Structural Change During Protein Folding by Chemical Denaturant. J Phys Chem B. 121(35): 8263–8275. https://doi.org/10.1021/acs.jpcb.7b04473
- Hoang, L., Bédard, S., Krishna, M. M. G., Lin, Y. and Englander, S. W. (2002). Cytochrome c folding pathway: Kinetic native-state hydrogen exchange. Proc Natl Acad Sci USA. 99(19): 12173–12178. https://doi.org/10.1073/pnas.152439199
- Malhotra, P. and Udgaonkar, J. B. (2016). Secondary Structural Change Can Occur Diffusely and Not Modularly during Protein Folding and Unfolding Reactions. J Am Chem Soc. 138(18): 5866–5878. https://doi.org/10.1021/jacs.6b03356
- Syka, J. E. P., Coon, J. J., Schroeder, M. J., Shabanowitz, J. and Hunt, D. F. (2004). Peptide and protein sequence analysis by electron transfer dissociation mass spectrometry. Proc Natl Acad Sci USA. 101(26): 9528–9533. https://doi.org/10.1073/pnas.0402700101
- Wiesner, J., Premsler, T. and Sickmann, A. (2008). Application of electron transfer dissociation (ETD) for the analysis of posttranslational modifications. Proteomics. 8(21): 4466–4483. https://doi.org/10.1002/pmic.200800329
- Zhou, Y., Dong, J. and W. Vachet, R. (2011). Electron Transfer Dissociation of Modified Peptides and Proteins. Current Pharm Biotechnol. 12(10): 1558–1567. https://doi.org/10.2174/138920111798357230
- Song, H., Olsen, O. H., Persson, E. and Rand, K. D. (2014). Sites Involved in Intra- and Interdomain Allostery Associated with the Activation of Factor VIIa Pinpointed by Hydrogen-Deuterium Exchange and Electron Transfer Dissociation Mass Spectrometry. J Biol Chem. 289(51): 35388–35396. https://doi.org/10.1074/jbc.m114.614297
- Rand, K. D., Zehl, M., Jensen, O. N. and Jørgensen, T. J. D. (2009). Protein Hydrogen Exchange Measured at Single-Residue Resolution by Electron Transfer Dissociation Mass Spectrometry. Anal Chem. 81(14): 5577–5584. https://doi.org/10.1021/ac9008447
- Walters, B. T., Ricciuti, A., Mayne, L. and Englander, S. W. (2012). Minimizing Back Exchange in the Hydrogen Exchange-Mass Spectrometry Experiment. J Am Soc Mass Spectrom. 23(12): 2132–2139. https://doi.org/10.1007/s13361-012-0476-x
Article Information
Publication history
Received: Jan 6, 2025
Accepted: May 15, 2025
Available online: Jun 5, 2025
Published: Jun 20, 2025
Copyright
© 2025 The Author(s); This is an open access article under the CC BY-NC license (https://creativecommons.org/licenses/by-nc/4.0/).
How to cite
Bhattacharjee, R. and Udgaonkar, J. B. (2025). Protein Structural Characterization Using Electron Transfer Dissociation and Hydrogen Exchange-Mass Spectrometry. Bio-protocol 15(12): e5350. DOI: 10.21769/BioProtoc.5350.
Category
Biochemistry > Protein > Structure
Do you have any questions about this protocol?
Post your question to gather feedback from the community. We will also invite the authors of this article to respond.