- Protocols

- Articles and Issues
- For Authors
- About
- Become a Reviewer

Protocol of Whey Protein Isolate–Based Microgel Targeted Delivery in Mouse Kidney
Published: Vol 15, Iss 12, Jun 20, 2025 DOI: 10.21769/BioProtoc.5347 Views: 1984
Reviewed by: Olga KopachAnonymous reviewer(s)
Original research article
The authors used this protocol in:

Nov 2024
Advertisement


Protocol Collections
Comprehensive collections of detailed, peer-reviewed protocols focusing on specific topics


Related protocols
Abstract
Every year, there is an increase in the number of cases of chronic kidney disease, and a delay in the initiation of adequate treatment can lead to kidney failure, which requires regular dialysis or transplantation. Intensive systemic therapy used to treat kidney diseases often has a negative impact on other weakened organs, making it crucial to ensure targeted delivery of medications directly to the kidneys and to minimize systemic side effects. In order to reduce the toxicity of medications and decrease dosages, innovative delivery methods are being developed, such as micro-sized targeted delivery systems, which ensure highly effective distribution of encapsulated drugs directly within the organs. In a recent article, we presented innovative emulsified microgels stabilized with whey protein isolate (WPI), specifically designed for targeted drug delivery to the kidneys. Our stability studies revealed that these microgels start to degrade after 72 h, with this degradation exhibiting a time-dependent profile. Furthermore, intravenous administration of the microgel suspension through the tail vein showed significant selective accumulation in both the liver and kidneys over a duration of 5 days. As part of our research, we present the protocol for synthesizing emulsion microgels derived from whey protein isolate. This article provides a comprehensive overview of the procedures for precursor preparation, along with an in-depth investigation of the emulsion system's stability over time. The protocol also includes the injection of an emulsion microgel suspension into the tail vein of mice, enabling the evaluation of their biocompatibility and potential therapeutic efficacy. This protocol outlines the precautions and important nuances that should be considered at each stage of the experiment.
Key features
• This protocol provides detailed instructions on the synthesis of fluorescently labeled emulsion microgels using mucoadhesive whey protein isolate, allowing the replication of this process.
• The protocol describes in detail how to prepare samples for confocal microscopy.
• We are exploring a method to study the stability of emulsion microgels by analyzing the size of emulsion droplets using optical microscopy.
• We provide guidance on the administration of suspension into the tail vein of mice, followed by visualization of the microgels' body biodistribution.
Keywords: Emulsion microgels (EM)Graphical overview
Background
The prevalence of chronic kidney disease continues to steadily increase each year [1,2]. Delayed initiation of adequate therapy can lead to kidney failure [3,4]. Often, intensive systemic therapy causes complications in other weakened organs and systems, highlighting the need for targeted drug delivery directly to the affected organ to minimize systemic side effects of treatment. The method of administering drugs through the renal artery has the potential to concentrate therapeutic agents in the cargo, which could greatly enhance the treatment of chronic kidney disorders. However, this approach carries risks such as vascular damage, aortic blockage, and the need for highly trained personnel.
To address this issue and to reduce the necessary therapeutic doses, alternative addressing methods are being developed, such as micro-sized targeted delivery systems [5,6]. These systems can effectively regulate the distribution of encapsulated drugs in the organs, opening new horizons in the treatment of chronic kidney disease.
Currently, emulsion systems are actively being studied as a promising treatment for diseases of the genitourinary system [7]. One of the main advantages of these systems for targeted drug delivery is their ability to provide long-term release of both hydrophobic and hydrophilic drugs [7]. This is due to the presence of both aqueous and oil phases in the system.
Modification of emulsions with mucoadhesive components allows an increase in targeting of the drug delivery system, their retention on the mucous surface of organs, and, at the same time, the localization, safety, and effectiveness of the administered drug. The use of mucoadhesive emulsions is gaining popularity due to their unique combination of properties that make them ideal for delivering drugs directly to the mucosal surfaces. In our study, we use the naturally derived mucoadhesive component whey protein isolate (WPI). WPI, along with its efficient mucosal specificity, provides the formation of the hydrogel shell at the oil surfaces upon the ultrasonically stimulated denaturation. In this way, the emulsion microgel system is formed.
Recently, we described the protocol for synthesizing emulsion microgels with high mucosal adhesion properties to the urothelium of the bladder provided by the mucoadhesive component, WPI [8]. We provided precautions and nuances that should be paid attention to at each stage of the experiment. During the study, the main physico-chemical parameters of microgels, such as filling capacity and drug release rate, were studied. The processes of drug release, both from the oil core of microgels (hydrophobic drug) and from the hydrogel protein shell (hydrophilic drug), strongly depend on the ionic strength of the medium in which microgels are incubated [8–10]. It has been shown that the ionic strength affects the degradation rate of protein hydrogel shells and, thus, the overall stability of microgels. This, in turn, affects the drug release behavior. The high ionic strength of the medium causes the high hydrophobicity of the protein molecules in the shell, which, accordingly, increases the stability of the microgels. The stability of microgels in artificial urine (0.3 M) is higher than in saline solution (0.15 M). Correspondingly, in artificial urine, the drug release from microgels demonstrates a more prolonged behavior, as compared with saline 0.15 M NaCl. The amount of hydrophilic drug released from the protein shell reaches 45% at 72 h of incubation in artificial urine [8]. The biodistribution of emulsion microgels in vivo after intravesical administration showed that local delivery ensures effective accumulation of carriers in the bladder due to the high adhesive properties of the protein on the surface of the microgels.
Due to the possibility of varying the synthesis conditions to produce microgels with precisely specified physical and chemical properties, such as particle size, surface area, zeta potential, and drug loading efficiency, emulsion microgels have been studied as a potential drug delivery system for the kidneys [11]. Intravenous delivery of these microgels resulted in a long-term accumulation (at least 5 days) of these particles in the liver and kidneys, indicating a high efficiency of biodistribution and targeting to the target organ. The experimental conditions for synthesizing these microgels allow for the creation of particles with exactly the desired characteristics. The developed microgels provide a customized therapeutic approach to the treatment of kidney diseases, with reduced side effects. This opens up new possibilities for the systemic treatment of the urinary system.
This protocol provides detailed instructions on the synthesis, preparation, and research of fluorescently labeled emulsion microgels based on whey protein isolate. It allows researchers to accurately replicate these procedures and achieve the desired results.
The protocol includes the following steps:
1. Synthesis of fluorescently labeled microgels: This involves the preparation of a mixture of whey protein isolate and a fluorescent dye, which is then processed to create the microgel structure.
2. Preparation of samples for confocal microscopy: The microgels are prepared for analysis by confocal microscopy, which helps to visualize their structure and distribution.
3. Optical microscopy analysis: The stability of the microgels is assessed using optical microscopy, specifically focusing on the size and distribution of the emulsion droplets within the microgel.
4. In vivo imaging: A suspension of the microgels is injected into the tail vein of a mouse, allowing for the visualization of the distribution of the fluorescent dye signal in the animal's body using fluorescence imaging.
Overall, this protocol provides a comprehensive guide for researchers interested in studying fluorescently labeled emulsion microgels using whey protein as a basis. It ensures accurate and efficient sample preparation, making it a valuable tool for further research in this field.
Materials and reagents
Reagents
1. Linseed oil OLEOS (Russia) (unrefined cold pressed linseed oil, refractive index n20/D 1.4795, density 0.93 g/mL at 25 °C, commercial use)
Note: It is possible to use linseed oil from another manufacturer. However, it is worth paying attention to its properties (the refractive index n20/D of 1.4795 and the density of 0.93 g/mL at 25 °C).
2. Whey protein isolate (WPI) California Gold Nutrition (USA), iHerb, https://www.californiagoldnutrition.com/products/california-gold-nutrition-sport-whey-protein-isolate-unflavored-5-lb-2-27-kg-76479 (27 g of protein, 6.2 g of BCAAs, 4.7 g of glutamic acid, low lactose; lactose is used as an excipient, which is not involved in the formation of emulsion microgels; no additives or flavor enhancers)
Note: It is important to pay attention to the content of additional proteins in the WPI composition (such as BCAAs and glutamic acid) since this can affect the properties of the resulting emulsion microgels. It is also worth avoiding the presence of flavor enhancers and additives in the WPI composition.
3. Sodium chloride (NaCl) (Sigma-Aldrich, catalog number S9888)
4. Cyanine 7 NHS-ester (Cy7), analytical reagent grade; reagent for research and development. Quality control: NMR 1H, HPLC–MS (95%) (Lumiprobe, catalog number 65020)
5. Phosphate-buffered saline (PBS) (Sigma-Aldrich, catalog number P4417)
6. Dimethyl sulfoxide (DMSO) (EcoChemAnalyt, Russia, CAS: 67-68-5)
7. Sodium hydroxide (NaOH) (EcoChemAnalyt, Russia, State Standard 4328-77, CAS: 1310-73-2)
8. Nile red (Sigma-Aldrich, catalog number: 72485)
9. Milli-Q water (Millipore filtration system) (used in all experiments)
10. Zoletil (Virbac, catalog number: L042-00118-31/00014469)
11. Xylazine (Alfasan International, catalog number: 528-3-7.16-3256№PBI-3-8.0/03450)
Solutions
1. 5% WPI aqueous solution (see Recipes)
2. Saline, 0.9% NaCl solution (see Recipes)
3. 5 mg/mL Cy7 solution (see Recipes)
4. 1 M NaOH solution (see Recipes)
5. PBS solution (0.1 M, pH 8.3) (see Recipes)
Recipes
1. 5 % WPI (w/v) aqueous solution
| Reagent | Final concentration | Amount |
|---|---|---|
| WPI | 5 % | 500 mg |
| Saline 0.9% NaCl solution (Recipe 2) | 0.9% (w/v) | 10 mL |
| Total | n/a | 10 mL |
Caution: The solution must be mixed thoroughly. Wait until the foam disappears before use.
Note: For the conjugation procedure, protein solutions are prepared in PBS (pH 8.3) in equivalent amounts.
2. Saline, 0.9% NaCl (w/v) solution
| Reagent | Final concentration | Amount |
|---|---|---|
| NaCl | 0.9% (w/v) | 9 g |
| H2O | n/a | 1 L |
| Total | n/a | 1 L |
3. 5 mg/mL Cy7 solution
| Reagent | Final concentration | Amount |
|---|---|---|
| Cy7 | 5 mg/mL | 5 mg |
| DMSO | n/a | 1 mL |
| Total | n/a | 1 mL |
Note: Due to the difficulty in weighing a 5 mg sample, it is advisable to prepare a larger quantity of the Cy7, which necessitates a larger volume of DMSO to create the final solution with the desired Cy7 concentration of 5 mg/mL. To achieve this, you must proportionally increase the mass of the Cy7 and the volume of DMSO. For instance, weigh out 25 mg of Cy7 and then add DMSO until the volume reaches 5 mL. This will result in a final Cy7 solution of 5 mg/mL, in a volume of 5 mL.
4. 1 M NaOH solution (100 mL)
| Reagent | Final concentration | Amount |
|---|---|---|
| NaOH | 1 M | 0.4 g |
| H2O | n/a | 100 mL |
| Total | n/a | 100 mL |
5. PBS solution (0.1 M, pH 8.3)
| Reagent | Final pH | Amount |
|---|---|---|
| PBS | pH 7.2 | 1 tablet |
| H2O | n/a | 200 mL |
| Total | n/a | 200 mL |
Note: Adjust the pH of the resulting solution to 8.3 using NaOH 1 M.
Laboratory supplies
1. Centrifuge tubes with flat cap, 15 mL (JetBioFil, catalog number: CFT550150)
2. Centrifuge tubes with flat cap, 50 mL (JetBioFil, catalog number: CFT500500)
3. Microcentrifuge tubes, 1.5 mL (JetBioFil, catalog number: CFT000015)
4. Microcentrifuge tubes, 2.0 mL (JetBioFil, catalog number: CFT000020)
5. Laboratory glass jar 100 mL, with divisions, with screw lid, dark glass (MiniMed, catalog number: 10007205)
6. Vial 2 mL, dark glass (ALWSCI Technologies, catalog number: C0001177)
7. Vial 10 mL, clear glass, 22 mm × 52 mm (ALWSCI Technologies, catalog number: C0000053)
8. Dialysis bag M-Cel, pore diameter 14 kDa (Viscase, catalog number: 2141-1425)
9. Dialysis bag clamp (Scienova GmbH, catalog number: 40329)
10. Laboratory beaker, clear glass, 2 L (MiniMed, catalog number: 10003807)
11. Glass for microslides (MiniMed, catalog number: 12003421)
12. Cover glass for microslides (MiniMed, catalog number: 12003309)
13. Syringe 1 mL (BD Micro-Fine Plus, catalog number: 320935)
14. Pipette microtips, 2–20 μL (JetBioFil, catalog number: PPT100020)
15. Pipette microtips, 10–200 μL (JetBioFil, catalog number: PPT000200)
16. Pipette microtips, 100–1,000 μL (JetBioFil, catalog number: PPT000000)
Equipment
1. Bandelin Sonopuls HD 2070 homogenizer at a frequency of 20 kHz and a power density of 1 W/cm2 (Germany)
2. Magnetic stirrer (IKA, model: 0025004132)
3. Multifunctional refrigerated centrifuge (Eppendorf, model: 5810R)
4. Inverted confocal microscope (Leica Microsystems, model: Leica TCS SP8 X)
5. Inverted microscope, 40× objective (Olympus, model: IX73)
6. Single-channel variable volume dispenser 100–1,000 mL, 10–100 mL, 20–200 mL, 5–50 mL, and 1,000–5,000 mL (Thermo Fisher Scientific)
7. IVIS SpectrumCT imaging system (PerkinElmer, Waltham, MA, USA)
8. Water purification system for ultrapure water (Merck Millipore, model: Milli-QTM Advantage A10TM)
Software and datasets
1. ImageJ software 1.51j8 (National Institutes of Health, USA) (the open-source version is available online for free for download)
2. OriginPro 2018 SR1 (OriginLab Corporation, USA)
3. Excel 2019 (Microsoft Corporation, USA)
4. LAS X Life Science Microscope Software (Leica Microsystems, Germany)
5. Living Image 4.7.3 software (PerkinElmer, USA)
Procedure
A. Conjugation of WPI by Cy7
1. Create a solution of 5% WPI in PBS (0.1 M, pH 8.3). Dissolve 1 g of WPI in 20 mL of PBS.
2. Prepare a 0.5 mL solution of Cy7 in DMSO (5 mg/mL) in a dark glass vial.
3. Combine the WPI and Cy7 solutions in a dark glass vial. Stir the resulting mixture at 900 rpm using an IKA magnetic stirrer for 24 h in the dark at 4 °C (Figure 1).
4. Place the prepared WPI-Cy7 solution in a dialysis bag (pore size 14 kD). Submerge the dialysis bag containing the WPI-Cy7 solution in 2 L of deionized water and stir at 300 rpm for 48 h in the dark at 4 °C.
5. Determine the Cy7 dye concentration in the freshly prepared WPI-Cy7 solution by the spectrophotometric method. To do this, measure the optical density of the WPI-Cy7 solution at a 671 nm wavelength. The amount of Cy7 is determined on the basis of the optical density value at 671 nm using the corresponding calibration curve for Cy7. See our previous protocol for detailed instructions for obtaining calibration curves for a fluorescent dye (DOI: 10.21769/BioProtoc.5027, Section E, p. 4).
6. Store 20.5 mL of the freshly prepared Cy7-conjugated WPI in a refrigerator, away from light.
Caution: Fluorescent dyes are light-sensitive, so any experiments involving proteins labeled with fluorescent markers must be conducted in dark containers or with aluminum foil covers. The Cy7 concentration should be optimized and controlled in experiments for consistent fluorescence intensity, particularly when different batches of fluorescent dye are used.
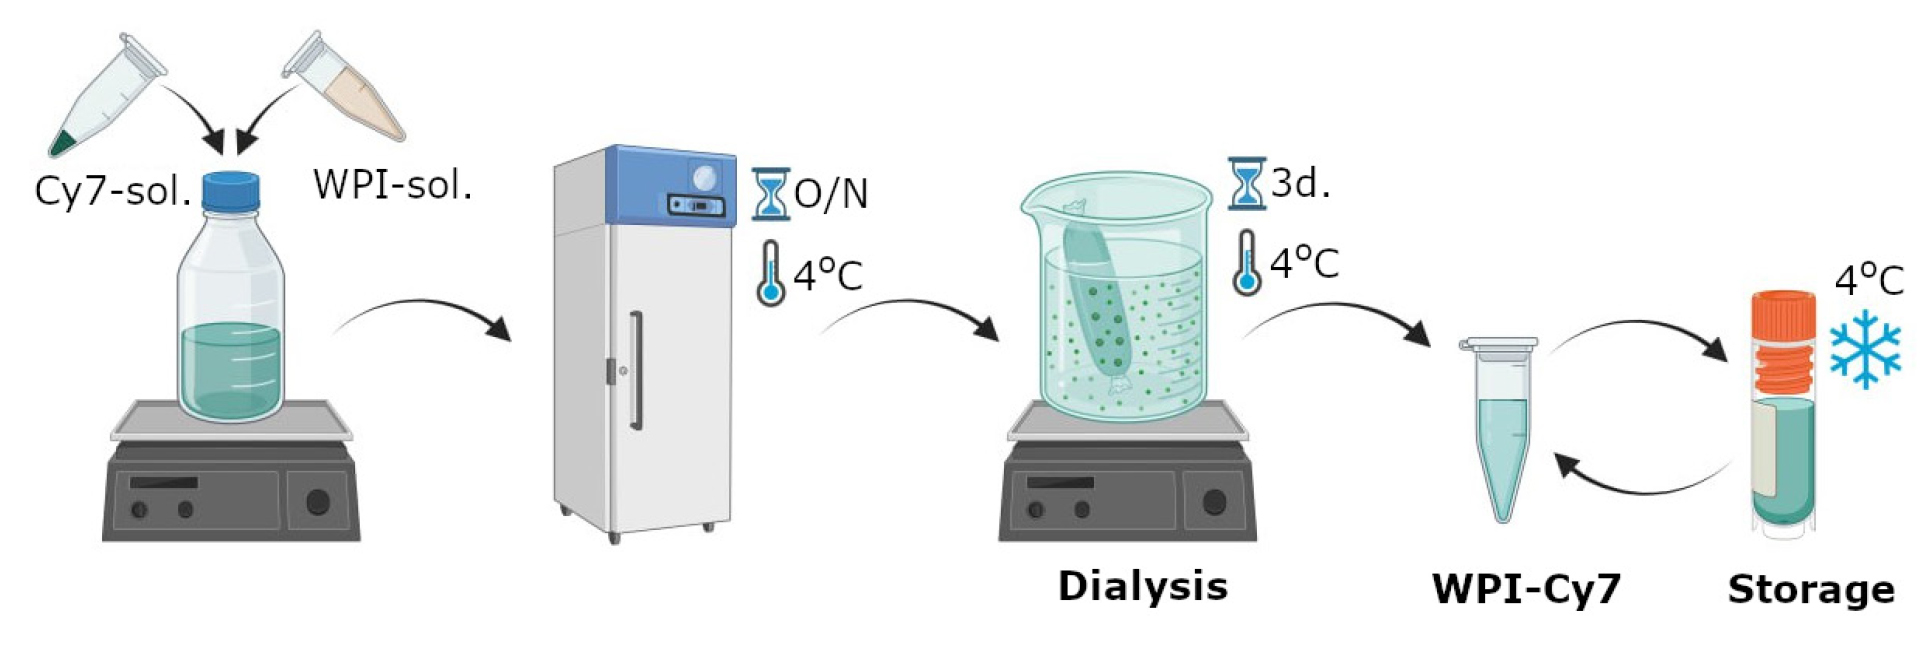
Figure 1. Scheme of labeling whey protein isolate with Cyanine 7 NHS ester produced by Lumiprobe
B. Formation of WPI-based emulsion microgels
1. Place 2 mL of 5% WPI-Cy7 solution in a 20 mL glass beaker.
2. Add 0.3 mL of linseed oil to the 2 mL of WPI-Cy7 solution. This corresponds to a ratio of WPI solution:oil (w:w) of 1:3.
Caution: It is crucial to adhere to the precise proportions of the WPI and oil phases, as the size of the resulting microgels will be significantly influenced by this ratio.
Note: For fluorescent visualization of emulsion microgels, Nile red was dissolved with linseed oil to a final concentration of 1 mg/mL.
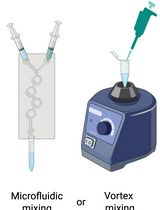
a. Immerse the probe of the ultrasonic homogenizer into the resulting mixture of WPI solution and oil. Apply ultrasound at a frequency of 20 kHz and a power density of 1 W/cm2 for 1 min to obtain the emulsion microgels (Figure 2A).
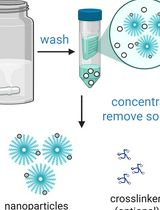
b. Transfer the resulting emulsion microgels to 2 mL Eppendorf tubes and centrifuge at 10,500× g for 5 min.
c. Carefully collect the infusion fluid using a syringe.
d. Then, wash emulsion microgels with saline solution twice according to sections D and E.
e. Store the prepared emulsion microgels in 2 mL of saline solution in a refrigerator at 4 °C.
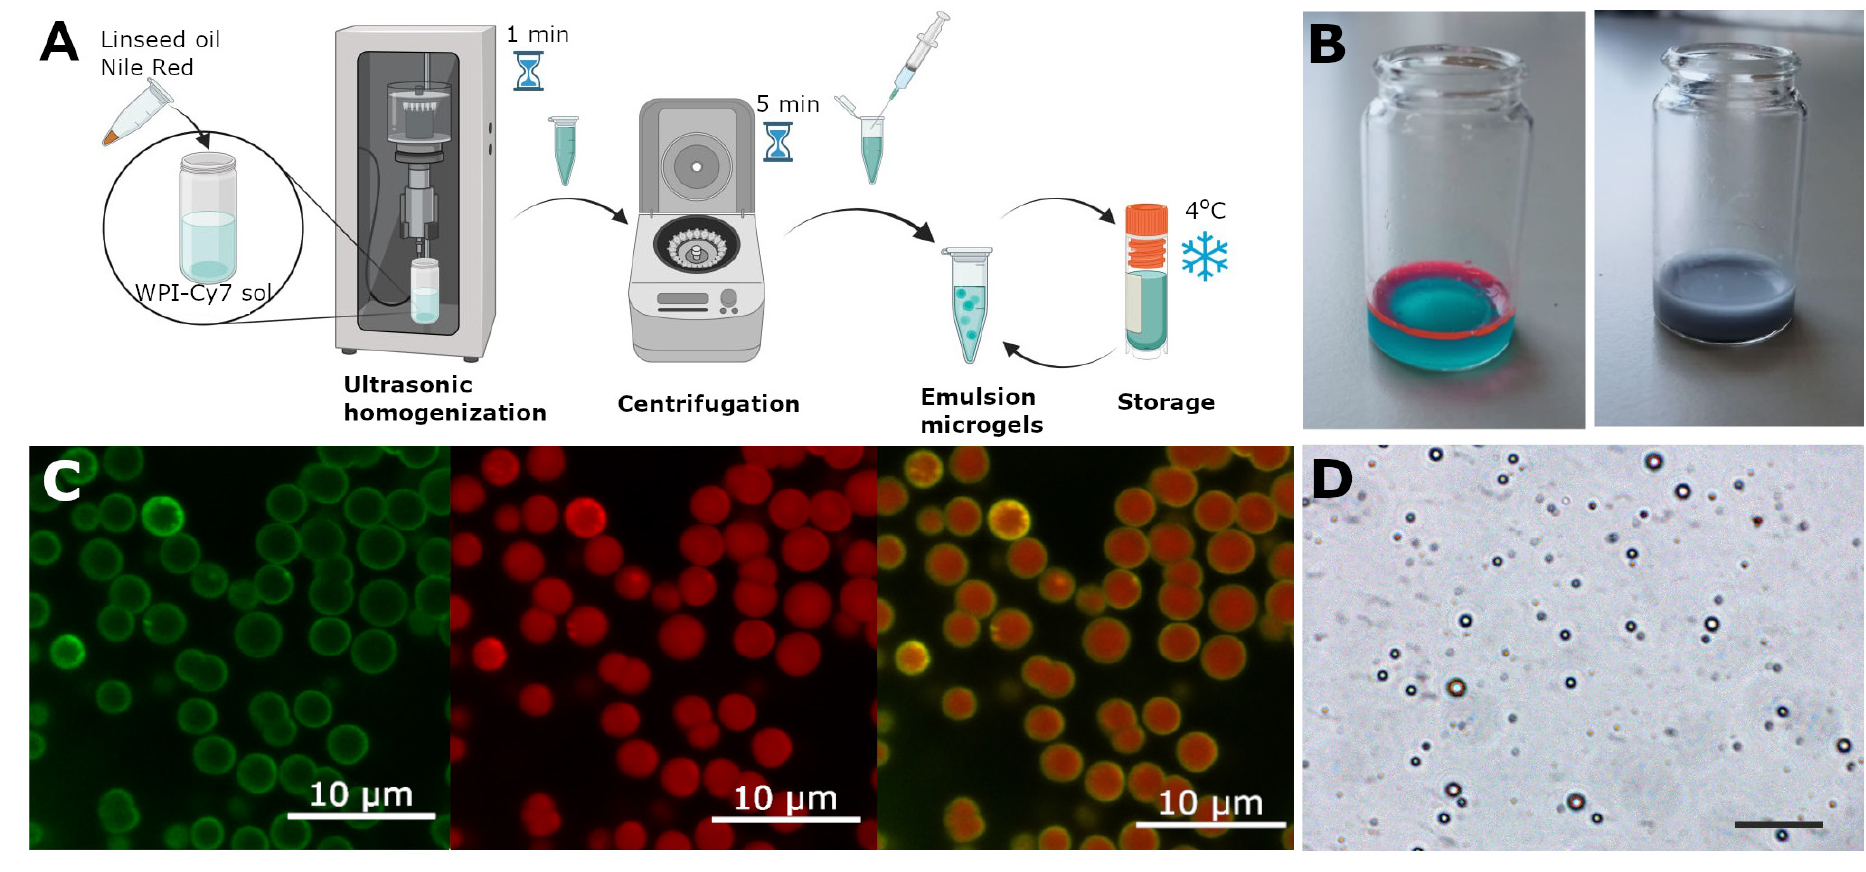
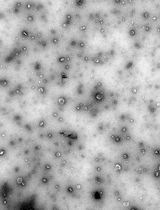
Figure 2. Method for synthesizing emulsion microgels and characterizing them using microscopy. (A) Scheme of the synthesis of emulsion microgels using whey protein isolate (WPI) labeled with Cy7 fluorescent dye and linseed oil containing Nile Red dye. (B) Visual representations of Cy7-WPI and linseed oil containing Nile Red solution before and after ultrasonic mixing. (С) Split channel images of emulsion droplets, demonstrating oil core stained with Nile Red (red color staining) and Cy7-WPI (green color staining), located at the oil–water interface and indicating WPI stabilization of emulsions. (D) Optical image of emulsion microgels. Scale bar, 50 μm.
Note: The reproducibility of the results depends on the amount of encapsulated substances and the size of the resulting microgel. The loading capacity of the microgel can be determined by a spectrophotometric method by maximum absorption in accordance with the protocol [10.21769/BioProtoc.5027].
C. Confocal laser scanning microscopy
1. Dilute the initial emulsion microgel sample 1,000× with saline (0.15 M NaCl). Place the 5 μL diluted emulsion microgel on a glass slide and cover with a coverslip.
2. Observe the fluorescent properties of the prepared emulsion samples using a Leica TCS SP8 X inverted confocal microscope equipped with diode-pumped solid-state lasers (561 nm and 671 nm) focused through a 20×/0.70 N.A. objective (Figure 2B).
3. The Cy7 fluorescence is stimulated by a laser with a wavelength of 671 nm, and the resulting emission is measured in the range of 730–795 nm (green channel, Figure 2B).
4. The Nile Red fluorescence is activated by a laser with a wavelength of 561 nm, and the resulting emission is measured in the range of 580–650 nm (red channel, Figure 2B).
5. Use the LAS X Life Science Microscope Software for image processing.
D. Optical microscopy and determination of emulsion microgel sizes
1. Measure the diameters of the emulsion microgels using the optical images of the samples.
2. For the sample preparation process for optical microscopy, follow a similar procedure to that of scanning laser microscopy, as described in section C1.
Obtain optical images of emulsion microgels with the Olympus I × 73 inverted microscope and a 40× objective.
4. Measure the diameters of the emulsion microgel particles with the optical images obtained in the previous step using measurement tools of the ImageJ software.
5. For the calculation of the average diameter of the emulsion microgel, at least 100 measurements and 10 images for each sample are analyzed. Present the average diameter of particles as mean ± standard deviation.
6. In our case, the microgels were predominantly composed of particles with an average diameter of 2.2 ± 0.3 μm.
E. Preparing mice for intravenous injection
1. Administer general anesthesia to a mouse by intraperitoneal injection using a mixture of Zoletil (40 mg/kg) and 2% Xylazine (10 mg/kg). We carried out this experiment with Balb/c mice (age 6–8 weeks, weight 20–25 g).
Note: Alternatively, 2% Rometar can be used instead of Xylazine.
2. After 5–7 min, check for the reflex response of the hind limbs. If there is no hind limb reflex, proceed with manipulation. If the reflex is still present, wait a few more minutes before continuing.
3. Place the mouse on the desk and use a trimmer to shave off all the fur from its body, except for the head.
4. Apply a depilatory cream designed for sensitive skin. Carefully remove the cream using cotton pads soaked in saline or water.
Note: Be sure not to leave the cream on the skin for more than 30–60 s to avoid any potential harm.
F. Tail vein injection of emulsion microgel suspension and lifetime bio-visualization
1. To prepare the tail for injection, it is important to submerge it in water at 42 °C for approximately 20–30 s. After that, the tail should be dried with a paper towel to remove any excess moisture.
Note: This will help dilate the blood vessels in the tail.
Caution: Locate the tail vein by following the middle dorsal side of the tail. The left and right tail veins are located on either side of the artery. These veins are the targets for administration. However, pigmentation on the tail may obscure some blood vessels, so it is important to be careful when locating them.
2. After locating the vein, slowly insert the needle of the syringe (30 G) at a slight angle, about 5 cm from the tip of the tail (at an angle of 10–15°).
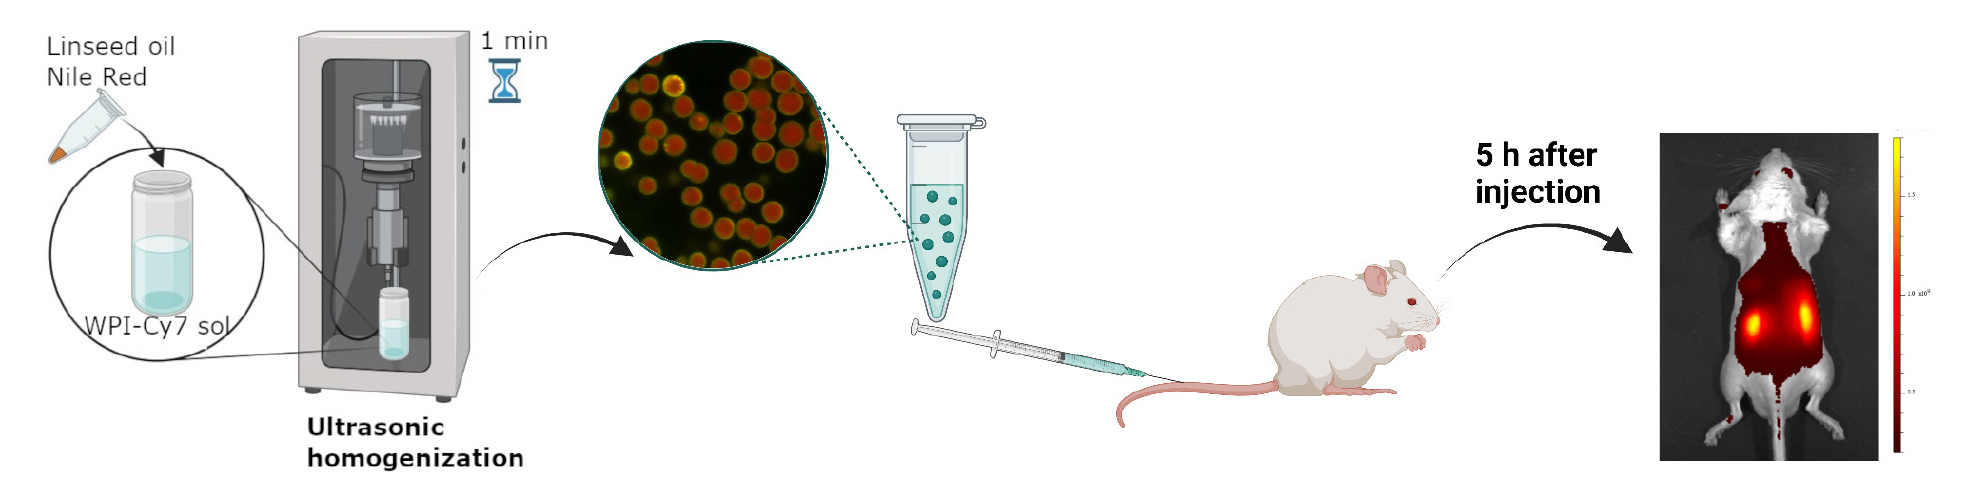
3. Slowly press down on the plunger of the syringe, injecting 50 μL of microgel suspended in saline solution at a concentration of 5 × 10⁷ microgels. Inject at a constant rate of about 30 μL/s to prevent damage to the blood vessels. A graphical representation of the in vivo experiment is shown in Figure 3A and Video 1.
4. Place the animal, positioned on a dark background, in the IVIS SpectrumCT imaging system, using an excitation/emission wavelength of 745/800 nm. Observe each mouse before and at specific times after the administration (10 min, 1 h, 5 h).
5. Analyze the results using the Living Image 4.7.3 software (Figure 3B).
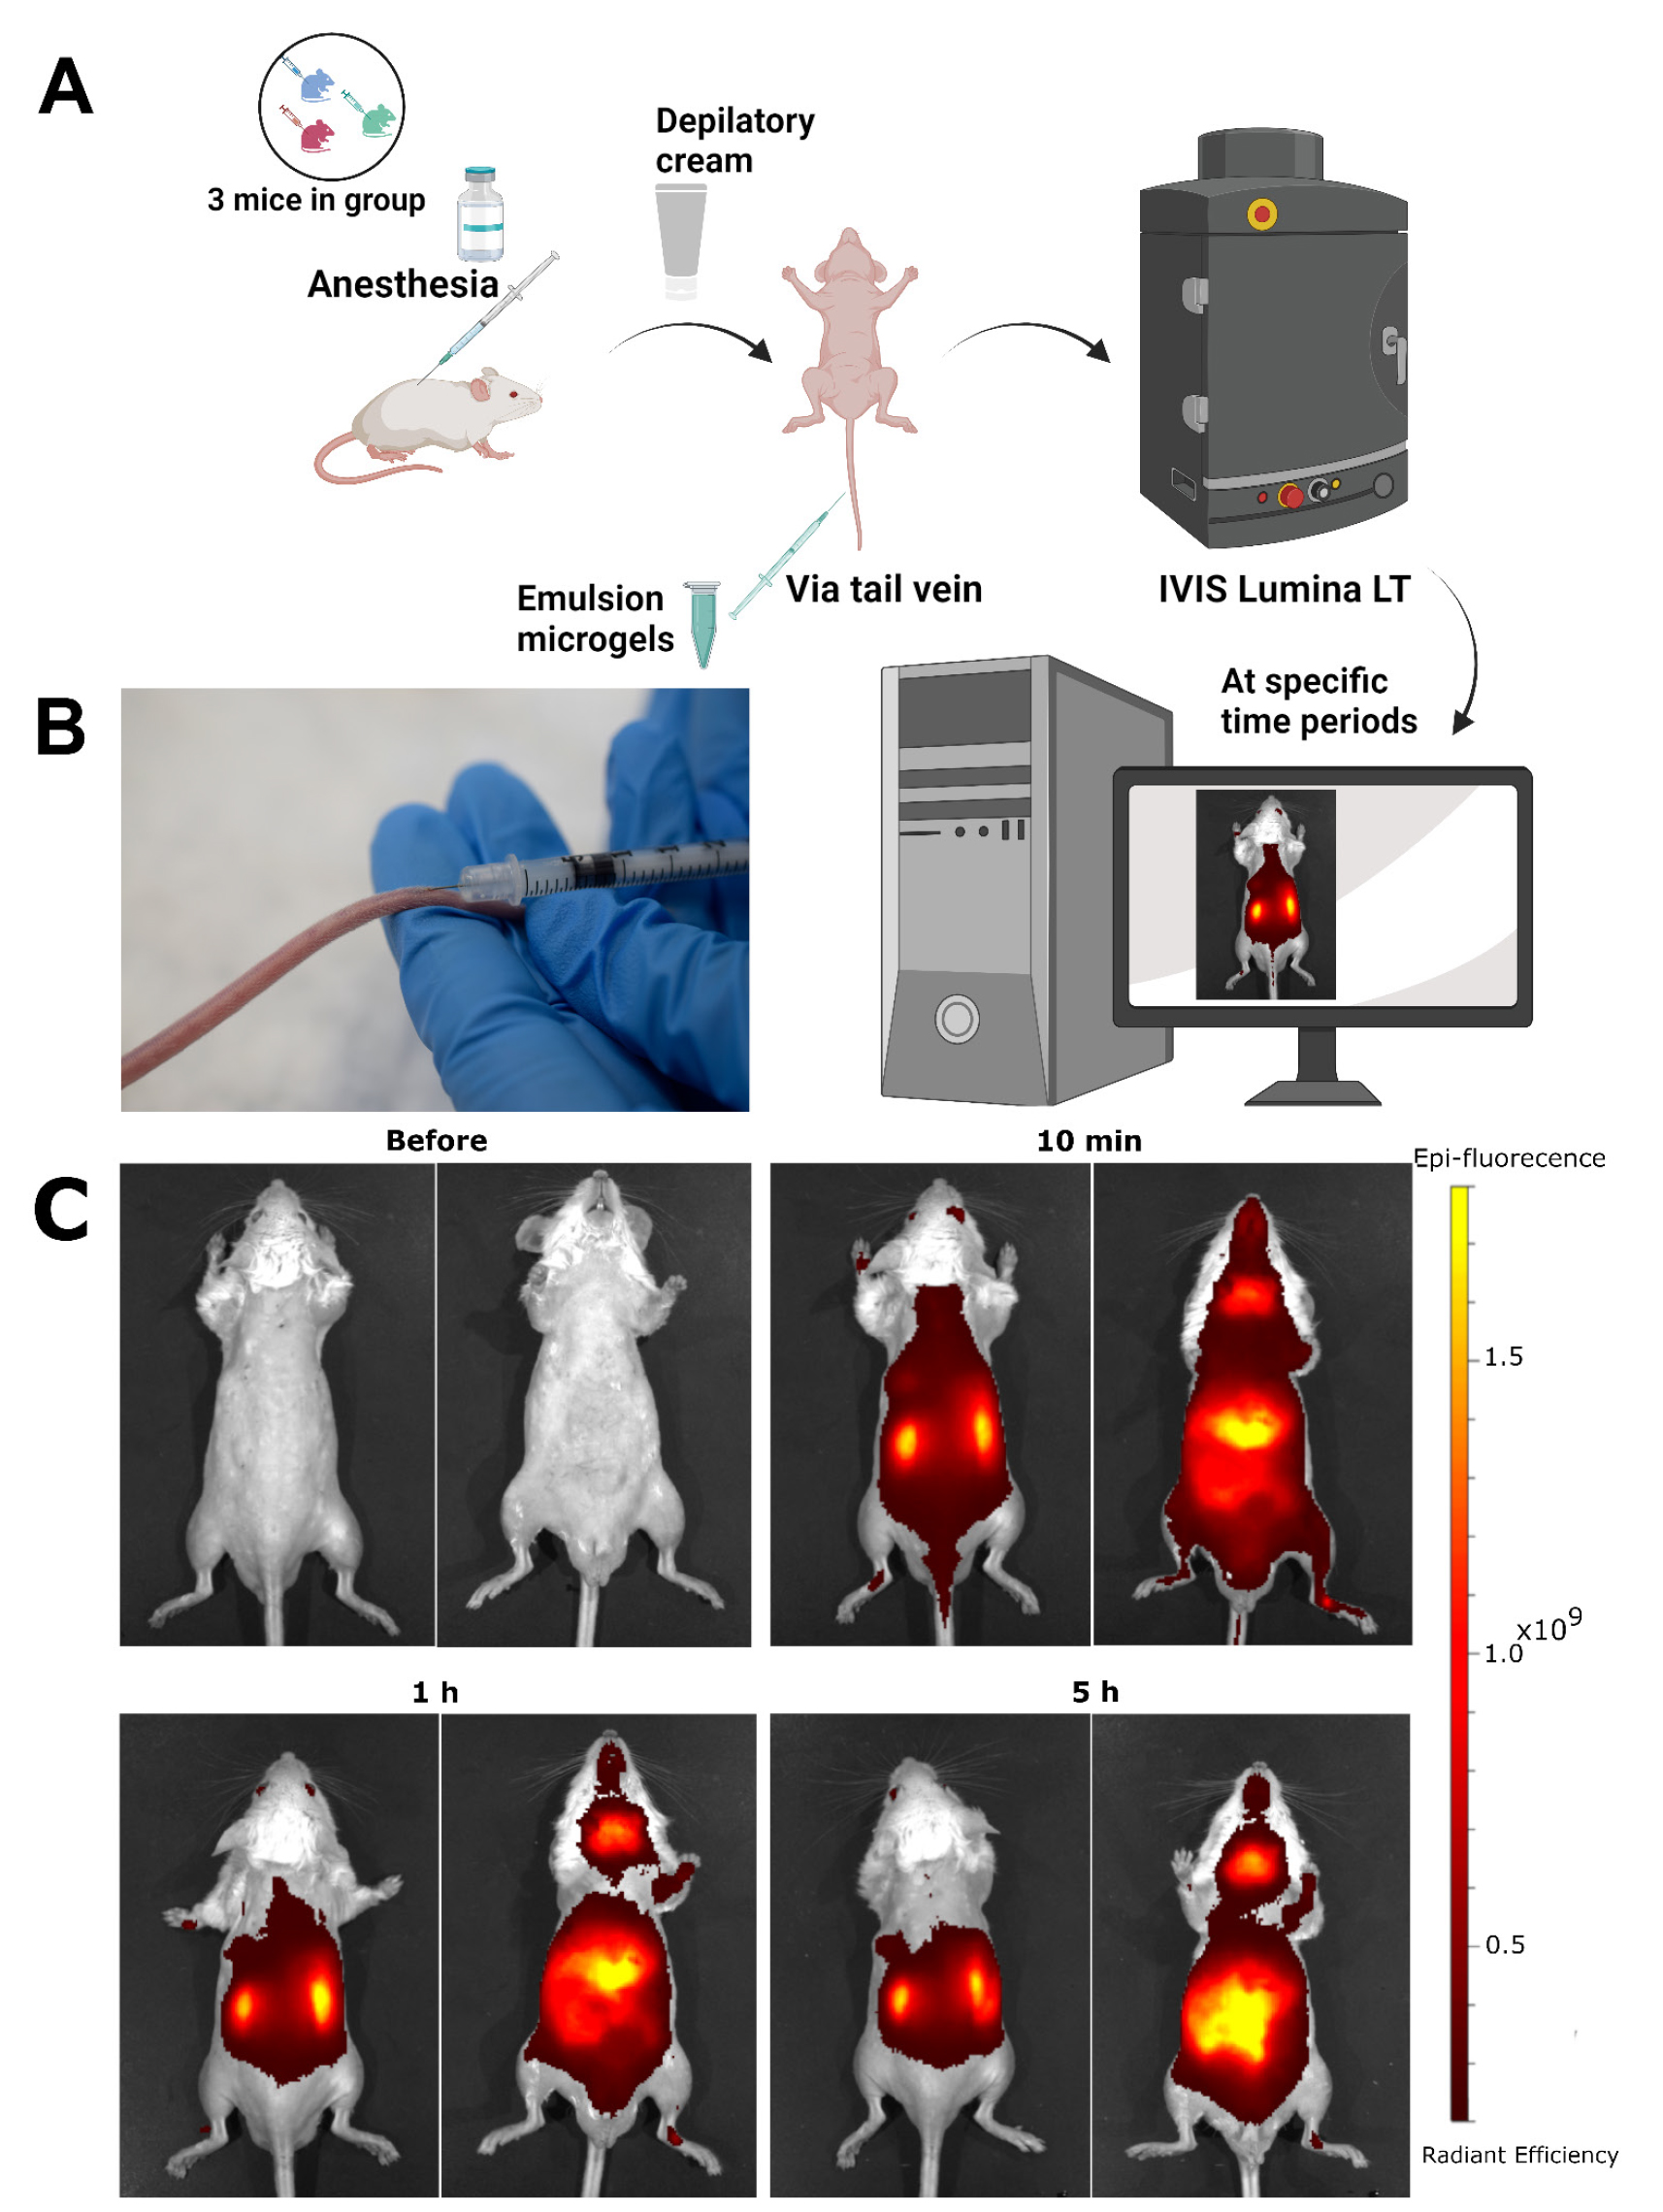
Figure 3. Administration of the suspension into the tail vein of mice. (A) Schematic process of the biodistribution of the fluorescent signal from the WPI-Cy7 dye, which is immobilized in emulsion microgel, after intravenous injection into the tail vein of a mouse. (B) Microgel administration into the mouse’s tail vein at a 10–15° angle. (C) Dynamics of biodistribution of microgel suspensions stabilized with WPI-Cy7 after intravenous administration in vivo in the dorsal (right) and ventral (left) positions for each time point.
Data analysis
Calculation of droplet size of emulsion microgels
To determine the mean size of emulsion droplets, at least 100 measurements were taken with the use of 10 images per sample. ImageJ software was used for image processing and data analysis. First, an optical image of the emulsion microgel was imported into the ImageJ program. Next, the image scale was calibrated in terms of length. Then, using the linear measurement tools available within the program, the diameter of each emulsion droplet was measured directly on the image. Based on the 100 measurements, the average particle diameter and standard deviation were calculated using statistical methods in Excel. Data should be presented as the mean ± standard deviation. Considering the 5% WPI concentration and the 1:3 WPI solution to oil ratio used in the microgels synthesis, we expect the average size of the microgels to be approximately 3.5 ± 0.2 μm. To compare the average particle sizes of different types of emulsion microgels, ANOVA can be used. If the p-value is less than 0.05, the differences are considered statistically significant. To ensure the reproducibility of data analysis and to make it more transparent, we have identified outliers using Grubbs' test statistical method.
Semi-quantitative measurement of the quantity of Cy-WPI following intravenous injection ex vivo
The Living Image 4.7.3 software was used to analyze the distribution of the fluorescent signal in the organs of mice (n = 3) after intravenous administration of microgels. The total and average radiation efficiency values were determined for each region of interest (ROI), which represents the boundaries of the organs (bladder, left and right kidney, lungs, heart, spleen, liver, stomach, intestines, and appendix) ex vivo (Figure 4A).
The total radiation efficiency is the total number of photons per second emitted from a selected area and is normalized by the intensity of illumination. The average radiation efficiency is the number of photons per square centimeter that leave the tissue and are emitted at a solid angle of one steradian, again normalized by the incident radiation intensity. For each organ, the results are presented as an average radiation efficiency value, from which the control group's average values have been subtracted (Figure 4B). Organ autofluorescence indices were analyzed similarly using control (intact) animals (n = 3) without the introduction of fluorescent microgels.
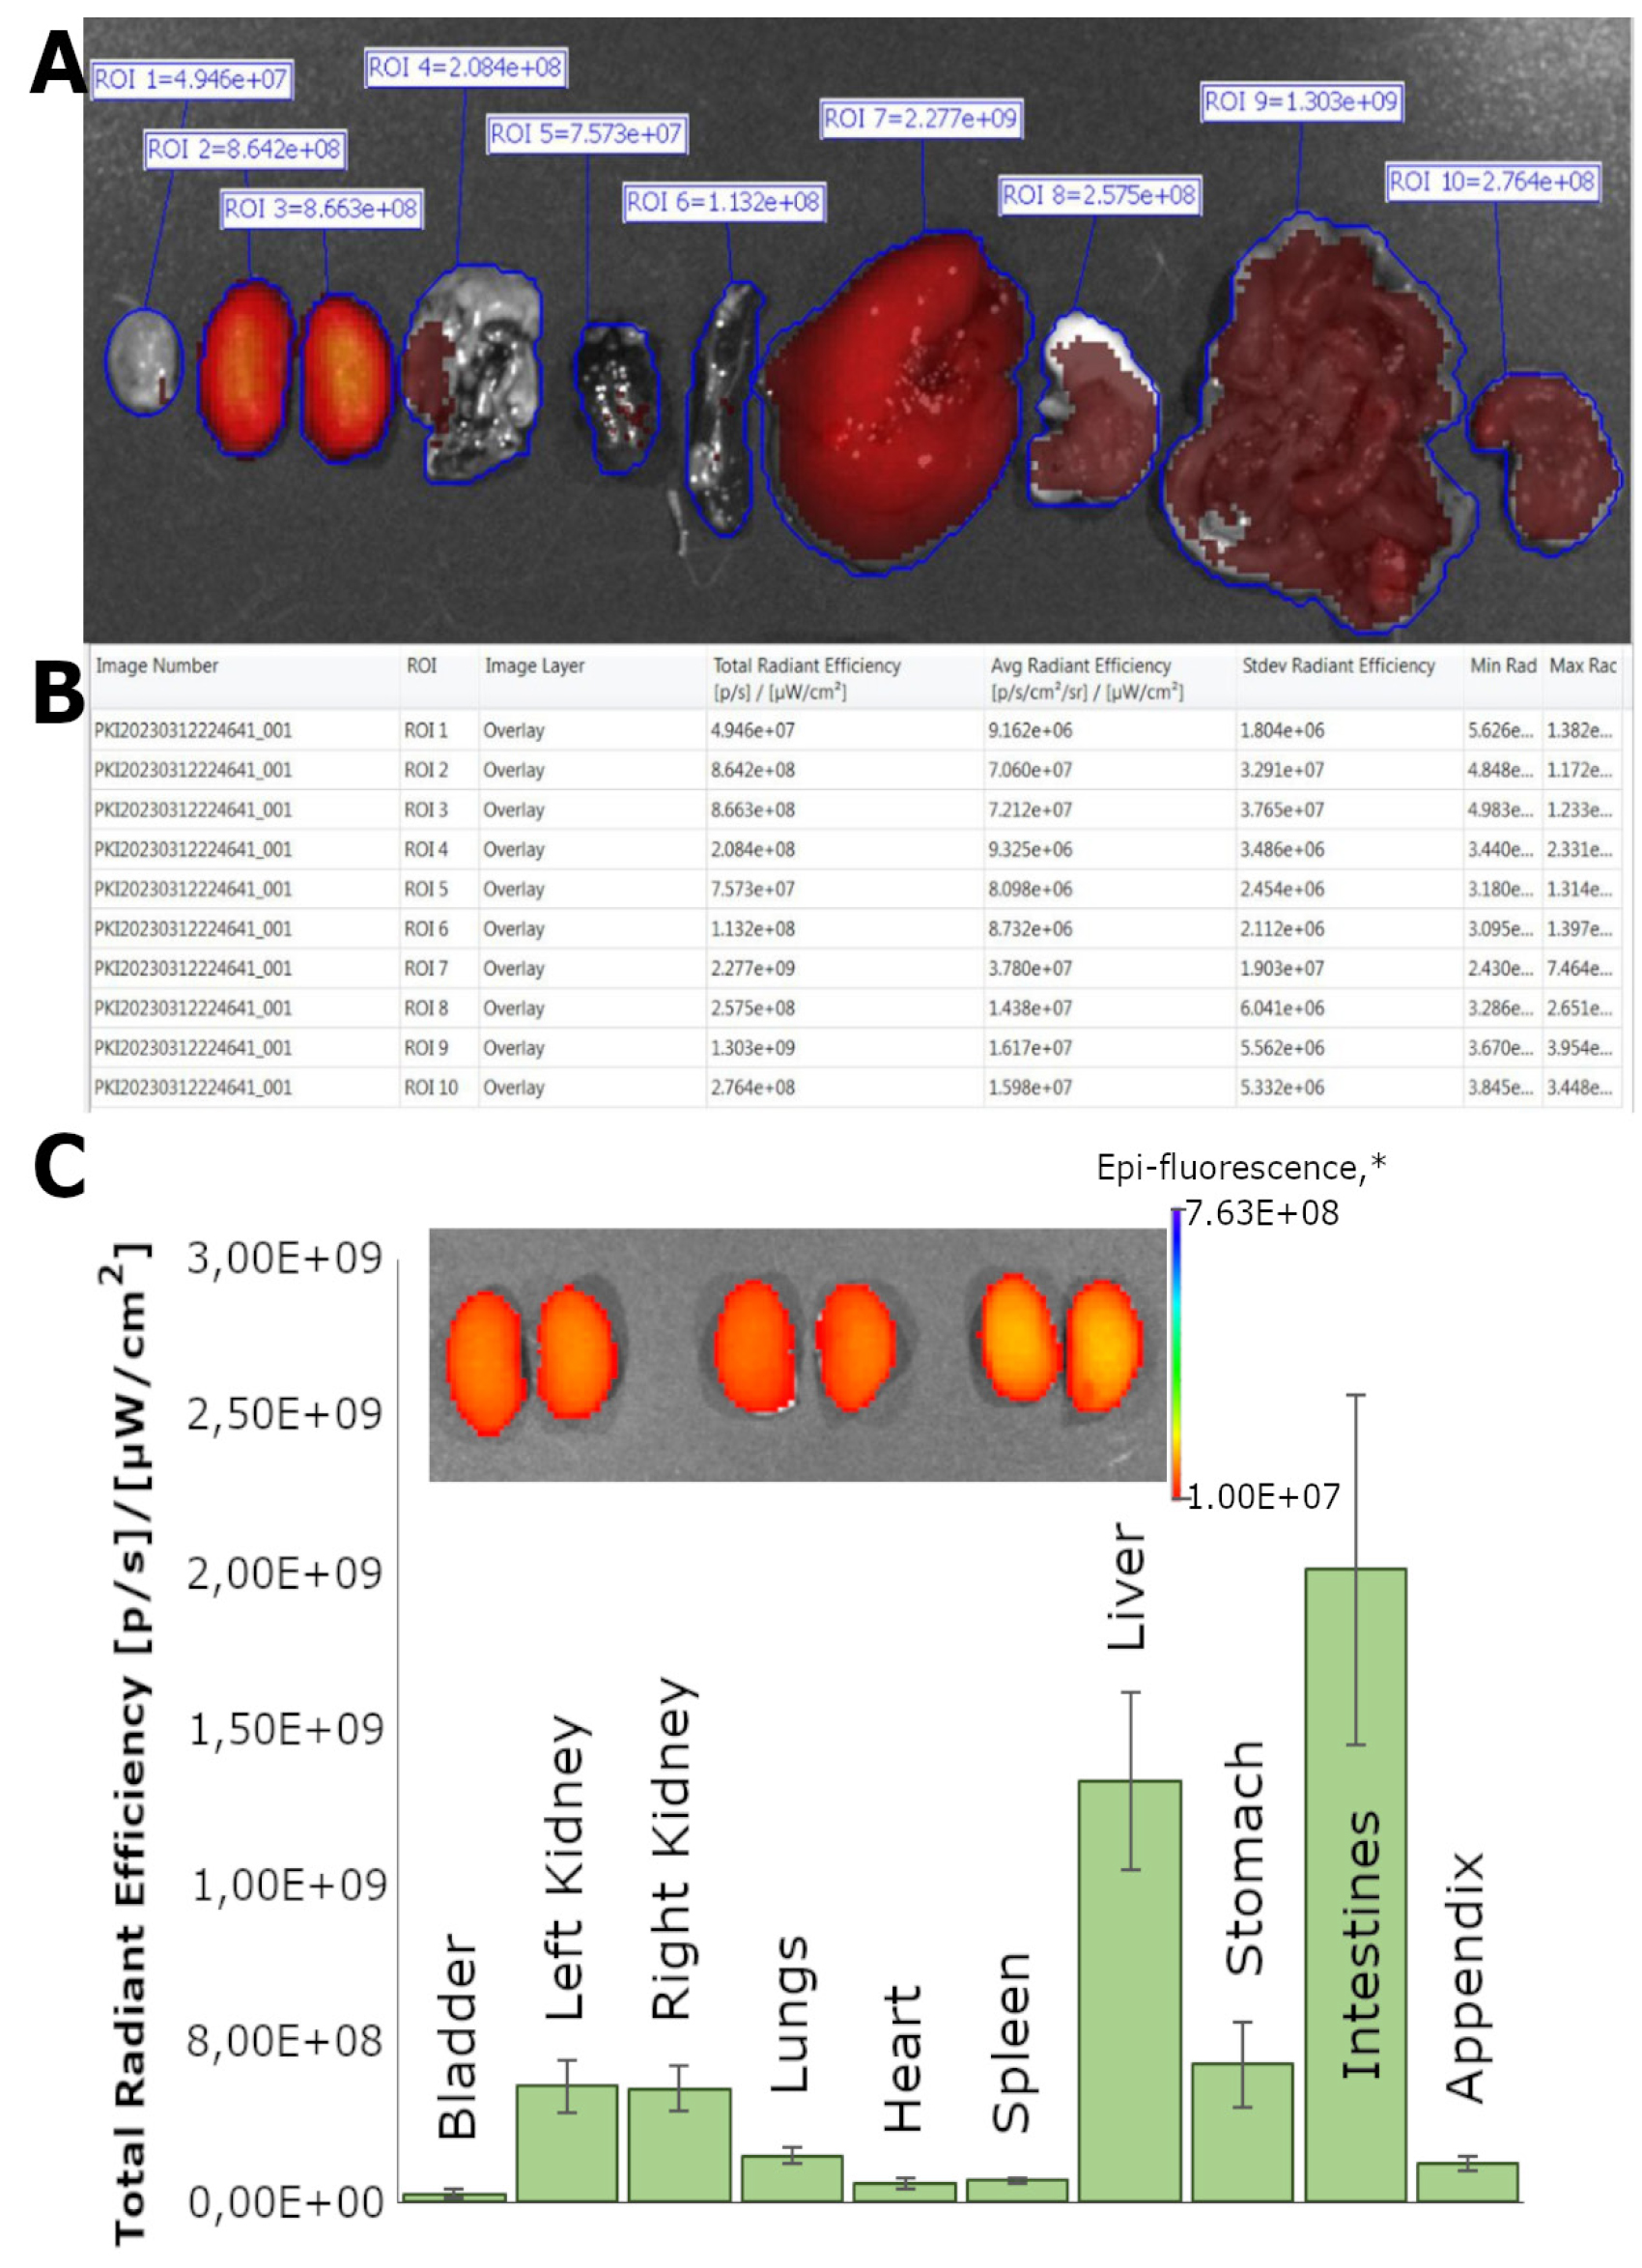
Figure 4. Analysis of the distribution of microgels in various organs and the dynamics of their biodistribution. (A) Representative image of the ex vivo biodistribution analysis process, with regions of interest (ROIs) allocated for each organ: bladder, left kidney, right kidney, lungs, heart, spleen, liver, stomach, intestines, and appendix. (B) The ROI Measurements tab displays data for all ROIs created in images or sequences during the session (one ROI per row). The table provides a convenient way to review and export ROI data. (C) Dynamics of biodistribution of microgel suspensions stabilized by WPI-Cy7 at 5 h after intravenous administration ex vivo. Fluorescent images of the kidneys of experimental animals 5 h after administration of the microgel suspension. * The unit of epi-fluorescence is [p/s]/[μWcm2]. All data are presented as the mean ± SD, n = 3.

Validation of protocol
This protocol (or parts of it) has been used and validated in the following research article:
Sindeeva et al. [12] Targeted treatment of kidney using intravenous and intraarterial delivery of whey protein isolate-based microgels. Opt Mater (Figures 1 and 3–6 and Figure SI 1).
General notes and troubleshooting
General notes
1. To ensure accurate results, it is crucial to ensure that the dialysis bag containing the Cy7-WPI solution is sealed tightly to prevent water absorption and dilution of the protein concentration.
2. In the process of creating microgels, various dyes and drugs with similar physicochemical properties can be used.
3. In order to ensure successful performance and improve the reproducibility of emulsion microgel synthesis results, it is essential to carefully monitor the concentrations of initial components (WPI, linseed oil) and control the duration and power of ultrasonic treatment.
4. It is recommended to store the produced microgels in a refrigerator at 4 °C for no more than 10 days in a dark place. For in vivo experiments, it is recommended to use freshly prepared emulsion microgels. If microgels have been reused or not prepared immediately before, the particle concentration and amount of the loaded substance must be recalculated, as described in the previous protocol (DOI: 10.21769/BioProtoc.5027, Section E, p. 4).
5. To obtain optical images, a drop of emulsion microgels should be covered with a cover glass. This will help prevent the drug from drying out and preserve the integrity of the microdrops.
6. Animal experiments should only be conducted under general anesthesia, and the level of anesthesia should be monitored regularly, paying close attention to the response of the hind legs.
7. Before starting the experiment, all undercoats must be carefully removed to exclude the appearance of additional fluorescent signals.
Troubleshooting
Problem 1: Emulsion stratification.
Possible causes and solutions: 1) Improper homogenization: insufficient ultrasound power or exposure time. After completing ultrasound exposure, visually make sure that there are no oil droplets on the emulsion surface, as well as no inclusions of other phases in the emulsion volume. The uniform and evenly colored sample without inclusions indicates proper homogenization of the emulsion. 2) Violation of storage conditions: the emulsion should be stored in a dark glass container at 4 °C. 3) Long-term storage: we recommend using only freshly prepared microgels that have been synthesized in accordance with all necessary parameters of ultrasonication (frequency of 20 kHz and a power density of 1 W/cm2) for 1 min.
Problem 2: Absence of a fluorescent signal from emulsion microgels in confocal microscopy.
Possible causes: 1) The concentration of the dye used may be incorrect. 2) The settings for excitation and emission on the microscope's instrument panel may be incorrect. 3) The suspension may have been stored improperly.
Solutions: 1) Use microgels with a higher dye content. 2) Verify the correct settings on the microscope. 3) Use freshly prepared samples of emulsion microgels.
Problem 3: Absence of a fluorescent signal from the dye in the process of in vivo biovisualization.
Possible causes: 1) Concentration of the dye used was insufficient. 2) The device settings may have been selected incorrectly. 3) The signal from the autofluorescence could exceed the signal from the dye.
Solutions: 1) Use microgels with a higher dye concentration. 2) Check the correct settings of the device. 3) Carefully prepare the animals by removing the fur from the entire body, as the presence of hair can create a fluorescence signal and distort the data on the intensity of fluorescence in the emulsion microgel. 4) Verify the accuracy of the drug administration. Ensure that the entire suspension has been injected into the vein. If the suspension cannot be injected from the initial puncture site, reinsert the needle deeper into the vein.
Acknowledgments
This study was supported by the Russian Science Foundation (Project 23-75-10070, https://rscf.ru/en/project/23-75-10070/). The Graphical Overview has been created in BioRender. Mayorova, O. (2025) https://BioRender.com/m49w061; Figure 1 has been created in BioRender. Mayorova, O. (2025) https://BioRender.com/x39d993; Figure 2 has been created in BioRender. Mayorova, O. (2025) https://BioRender.com/f16p444, Figure 3 has been created in BioRender. Mayorova, O. (2025) https://BioRender.com/t93q594.The original research paper in which the protocol was described and validated is Sindeeva et al [12].
Competing interests
The authors declare no competing interests.
Ethical considerations
The laboratory animal studies were performed according to the rules of Saratov State Medical University (Ethics Committee Protocol No. 7, dated 7 February 2023).
References
- Kovesdy, C. P. (2022). Epidemiology of chronic kidney disease: an update 2022. Kidney Int Suppl. 12(1): 7–11. https://doi.org/10.1016/j.kisu.2021.11.003
- Levin, A., Tonelli, M., Bonventre, J., Coresh, J., Donner, J. A., Fogo, A. B., Fox, C. S., Gansevoort, R. T., Heerspink, H. J. L., Jardine, M., et al. (2017). Global kidney health 2017 and beyond: a roadmap for closing gaps in care, research, and policy. Lancet. 390(10105): 1888–1917. https://doi.org/10.1016/s0140-6736(17)30788-2
- Zarbock, A., Kellum, J. A., Schmidt, C., Van Aken, H., Wempe, C., Pavenstädt, H., Boanta, A., Gerß, J. and Meersch, M. (2016). Effect of Early vs Delayed Initiation of Renal Replacement Therapy on Mortality in Critically Ill Patients With Acute Kidney Injury. JAMA. 315(20): 2190. https://doi.org/10.1001/jama.2016.5828
- Hoste, E. A. J., Bagshaw, S. M., Bellomo, R., Cely, C. M., Colman, R., Cruz, D. N., Edipidis, K., Forni, L. G., Gomersall, C. D., Govil, D., et al. (2015). Epidemiology of acute kidney injury in critically ill patients: the multinational AKI-EPI study. Intensive Care Med. 41(8): 1411–1423. https://doi.org/10.1007/s00134-015-3934-7
- Alallam, B., Choukaife, H., Seyam, S., Lim, V., and Alfatama, M. (2023). Advanced Drug Delivery Systems for Renal Disorders. Gels. 9(2): 115. https://doi.org/10.3390/GELS9020115
- Huang, X., Ma, Y., Li, Y., Han, F. and Lin, W. (2021). Targeted Drug Delivery Systems for Kidney Diseases. Front Bioeng Biotechnol. 9: e683247. https://doi.org/10.3389/fbioe.2021.683247
- Sawant, A., Kamath, S., KG, H. and Kulyadi, G. P. (2021). Solid-in-Oil-in-Water Emulsion: An Innovative Paradigm to Improve Drug Stability and Biological Activity. AAPS PharmSciTech. 22(5): 1–14. https://doi.org/10.1208/s12249-021-02074-y
- Saveleva, M. S., Lobanov, M. E., Gusliakova, O. I., Plastun, V. O., Prikhozhdenko, E. S., Sindeeva, O. A., Gorin, D. A. and Mayorova, O. A. (2023). Mucoadhesive Emulsion Microgels for Intravesical Drug Delivery: Preparation, Retention at Urothelium, and Biodistribution Study. ACS Appl Mater Interfaces. 15(21): 25354–25368. https://doi.org/10.1021/acsami.3c02741
- Mayorova, O. A., Gusliakova, O. I., Saveleva, M. S., Kulikov, O. A., and Inozemtseva, O. A. (2025). Microgels containing whey protein as a new way of treating bladder and renal diseases. Izvestiya of Saratov University. Physics. 25(1): 76–85. https://doi.org/10.18500/1817-3020-2025-25-1-76-85
- Plastun, V. O., Saveleva, M. S., Gusliakova, O. I., Lobanov, M. E., and Mayorova, O. A. (2024). Encapsulation in emulsion microgels: A high-tech strategy for the rational use of antibiotics. Izvestiya of Saratov University. Physics. 24(3): 228–238. https://doi.org/10.18500/1817-3020-2024-24-3-228-238
- Sindeeva, O., Gusliakova, O., Prikhozhdenko, E., Shushunova, N. and Sukhorukov, G. (2024). Mouse Renal Artery Catheterization for Local Delivery of Drugs in Capsulated or Free Forms. Bio Protoc. 14(1353): e5070. https://doi.org/10.21769/bioprotoc.5070
- Sindeeva, O. A., Terentyeva, D. A., Saveleva, M. S., Gusliakova, O. I., Prikhozhdenko, E. S., Kulikov, O. A., Gorin, D. A. and Mayorova, O. A. (2024). Targeted treatment of kidney using intravenous and intraarterial delivery of whey protein isolate-based microgels. Opt Mater. 157: 116043. https://doi.org/10.1016/j.optmat.2024.116043
Article Information
Publication history
Received: Mar 19, 2025
Accepted: May 13, 2025
Available online: May 30, 2025
Published: Jun 20, 2025
Copyright
© 2025 The Author(s); This is an open access article under the CC BY-NC license (https://creativecommons.org/licenses/by-nc/4.0/).
How to cite
Mayorova, O. A., Saveleva, M. S., Terentyeva, D. A., Gusliakova, O. I. and Sindeeva, O. A. (2025). Protocol of Whey Protein Isolate–Based Microgel Targeted Delivery in Mouse Kidney. Bio-protocol 15(12): e5347. DOI: 10.21769/BioProtoc.5347.
Category
Biological Engineering > Biomedical engineering > Drug Delivery
Medicine
Do you have any questions about this protocol?
Post your question to gather feedback from the community. We will also invite the authors of this article to respond.