- Protocols

- Articles and Issues
- For Authors
- About
- Become a Reviewer

The Centriole Stability Assay: A Method to Investigate Mechanisms Involved in the Maintenance of the Centrosome Structure in Drosophila Cultured Cells
Published: Vol 15, Iss 11, Jun 5, 2025 DOI: 10.21769/BioProtoc.5330 Views: 2383
Reviewed by: Vikash VermaAnonymous reviewer(s)
Original research article
The authors used this protocol in:
Jan 2024
Advertisement


Protocol Collections
Comprehensive collections of detailed, peer-reviewed protocols focusing on specific topics


Related protocols
Abstract
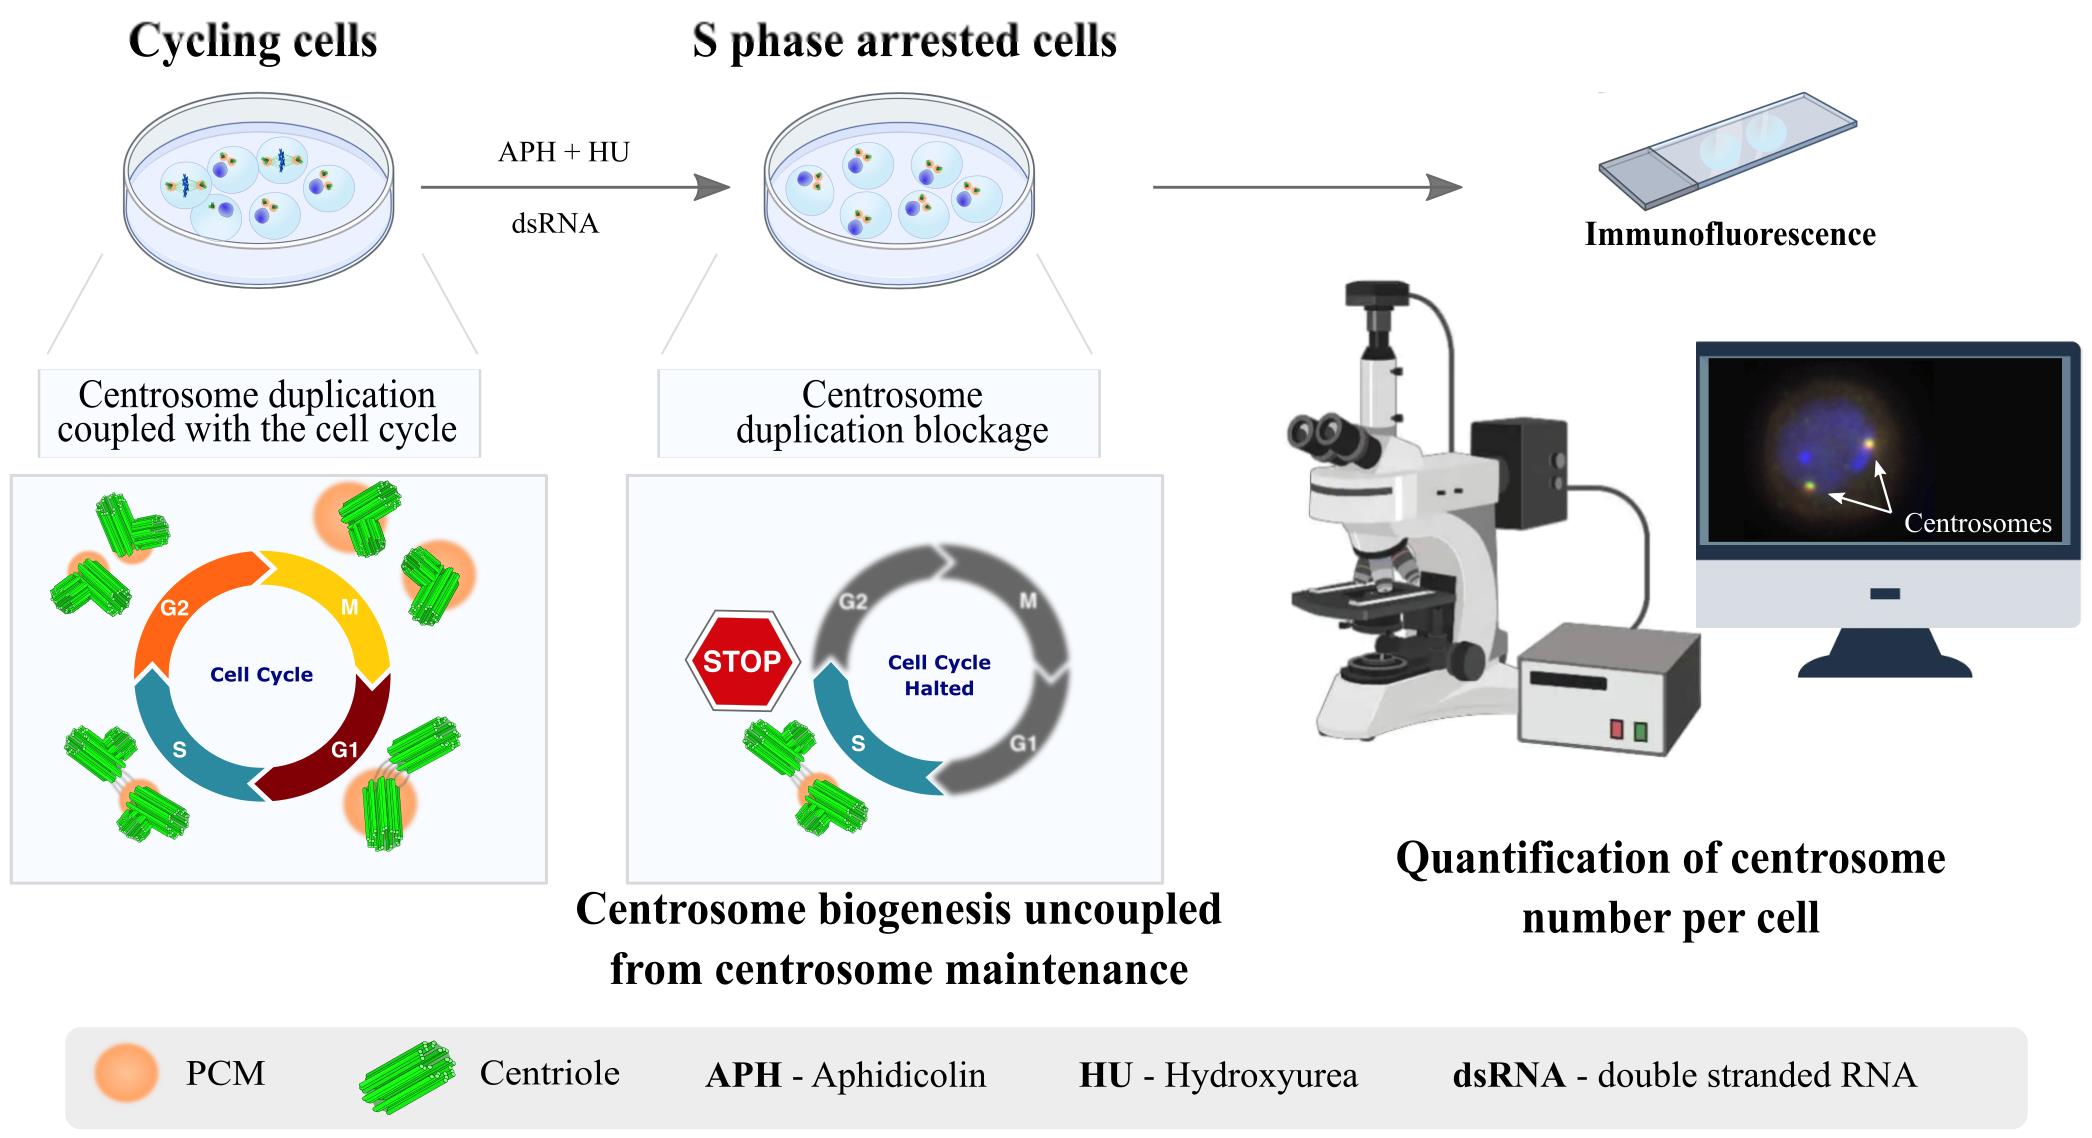
Centrosomes are vital eukaryotic organelles involved in regulating cell adhesion, polarity, mobility, and microtubule (MT) spindle assembly during mitosis. Composed of two centrioles surrounded by the pericentriolar material (PCM), centrosomes serve as the primary microtubule-organizing centers (MTOCs) in proliferating cells. The PCM is crucial for MT nucleation and centriole biogenesis. Centrosome numbers are tightly regulated, typically duplicating once per cell cycle, during the S phase. Deregulation of centrosome components can lead to severe diseases. While traditionally viewed as stable structures, centrosomes can be inactivated or disappear in differentiating cells, such as epithelial cells, muscle cells, neurons, and oocytes. Despite advances in understanding centrosome biogenesis and function, the mechanisms maintaining mature centrosomes or centrioles, as well as the pathways regulating their inactivation or elimination, remain less explored. Studying centrosome maintenance is challenging as it requires the uncoupling of centrosome biogenesis from maintenance. Tools for acute spatial-temporal manipulation are often unavailable, and manipulating multiple components in vivo is complex and time-consuming. This study presents a protocol that decouples centrosome biogenesis from maintenance, allowing the study of critical factors and pathways involved in the maintenance of the integrity of these important cellular structures.
Key features
• Drosophila cultured cells are resistant to centriole reduplication during S phase arrest, making them a suitable model for studying centrosome integrity without confounding effects from centriole biogenesis.
Keywords: CentrosomesGraphical overview
Background
An essential aspect of cell homeostasis is the maintenance of various cellular components, including proteins and lipids, and even the integrity of entire organelles. One such organelle is the centrosome, a conserved eukaryotic structure that plays a crucial role in several cellular processes. These include the regulation of cell adhesion, polarity, and mobility during interphase, as well as the assembly of the mitotic spindle, mainly composed of microtubules (MTs) [1,2]. Centrosomes serve as the primary microtubule-organizing centers (MTOCs) in proliferating eukaryotic cells. Each centrosome is composed of two centrioles—MT-based cylindrical structures surrounded by a multiprotein matrix known as the pericentriolar material (PCM) (Figure 1A). The PCM contains factors essential for MT nucleation and anchoring, also being critical for centriole biogenesis [3]. In cycling cells, the number of centrosomes is tightly controlled. Centrosomes are typically duplicated once per cell cycle, with duplication coupled to DNA replication, during the S phase [4]. In some cell types, during interphase, the centrosome migrates to the cell cortex, promoting the growth of an MT-based axoneme to form cilia or flagella [4]. Deregulation of centrosomal components leads to a wide range of diseases, many of which are incompatible with life.
Historically, centrosomes have been regarded as exceptionally stable structures [5,6]. However, in some differentiating cell types, these structures can be inactivated (i.e., lose their MTOC activity) or even disappear, as seen in epithelial cells, muscle cells, neurons, and oocytes [7–9]. Advances in various technological approaches have uncovered the major conserved components and pathways regulating centrosome duplication and maturation into fully functional MTOCs. However, much less is known about the components involved in the maintenance of mature centrosomes or centrioles, the pathways that regulate their inactivation or elimination, and how deregulation of these pathways may contribute to disease [10]. Hyperactive MTOC function at centrosomes has been linked to epithelial cancers and invasive tumor cell behavior [11–15]. Additionally, centrosome inactivation has been proposed as a strategy employed by cancer cells to silence supernumerary centrosomes, which would otherwise lead to cell death [16]. Therefore, elucidating the mechanisms that regulate centrosome and centriole stability is crucial not only for understanding the pathways of centrosome inactivation and/or elimination in post-mitotic and differentiating cells but also for uncovering how deregulation of these processes may contribute to cancer and other diseases.
Studying centrosome maintenance poses experimental challenges and limitations. Experimental setups must ensure that any manipulation (loss- or gain-of-function, such as in vivo RNAi or ectopic expression) is performed only after centrosomes have been fully assembled and that such manipulations do not affect centriole biogenesis. This requires tools for acute spatial-temporal manipulation, which are often unavailable or difficult to implement in many systems. Additionally, depending on the model system used, simultaneously manipulating (depleting or over-expressing) two or more components in vivo can be very challenging and time-consuming.
Taking into account these limitations, we provide a protocol that uncouples centriole biogenesis from maintenance in Drosophila melanogaster cultured cells (DMEL-2). By using this protocol, we have successfully identified components required for the maintenance of centrosome integrity [17,18]. That knowledge allowed us to generate tools to validate the function of such components in vivo [17,18]. In this assay, cells are arrested in S phase using aphidicolin (APH) and hydroxyurea (HU), which stall DNA replication. Unlike some commonly used human cultured cell lines, which allow for multiple rounds of centriole reduplication under S phase arrest conditions [19–21], Drosophila cultured cell lines do not exhibit this behavior. This distinction allows for the separation of centrosome duplication from centrosome maintenance. Moreover, Drosophila cultured cells are easy to culture and manipulate, and the addition of long double-stranded RNAs (dsRNA) enables the depletion of different proteins individually or simultaneously by RNAi. Therefore, following treatment with HU and APH, the number of centrioles is not affected by pathways involved in centriole biogenesis. This allows for the investigation of the effects of different experimental manipulations on centrosome stability.
Materials and reagents
Biological materials
1. Schneider’s Drosophila melanogaster cultured cell line 2 [D. Mel. (2), SL2] (DMEL-2, ATCC, catalog number: CRL-1963); cells isolated in 1969 from embryos
Reagents
1. Express 5 SFM medium (Gibco, catalog number: 10486025)
2. L-Glutamine (Thermo Scientific, catalog number: 25030024)
3. Penicillin-streptomycin-glutamine (PSG) (100×) (Gibco, catalog number: 10378016)
4. Aphidicolin (APH) (Sigma-Aldrich, catalog number: A0781)
5. Hydroxyurea (HU) (Sigma-Aldrich, catalog number: H8627)
6. Effectene Transfection Reagent kit (QIAGEN, catalog number: 301427)
7. Absolute methanol (Fisher Scientific, catalog number: 10675112)
8. 16% paraformaldehyde (formaldehyde) aqueous solution (Science Services GmbH, catalog number: E15710)
9. PIPES for buffer solutions (PanReac AppliChem, catalog number: A1079)
10. N-2-hydroxyethylpiperazine-N-2-ethane sulfonic acid (HEPES) (1 M) (Gibco, catalog number: 15630080)
11. Ethylene glycol-bis (2-aminoethylether)-N,N,N',N'-tetraacetic acid (EGTA) (Sigma-Aldrich, catalog number: E3889)
12. Magnesium sulfate heptahydrate (MgSO4) (Sigma-Aldrich, catalog number: M1880)
13. Phosphate buffered saline (PBS) (Biowest, catalog number: L0615-500)
14. Bovine serum albumin (BSA) (Sigma-Aldrich, catalog number: A3912)
15. Triton X-100 (Sigma-Aldrich, catalog number: T8787)
16. Vectashield with DAPI mounting medium (Vector Laboratories, catalog number: H-1000-10)
Solutions
1. Express 5 SFM medium supplemented with L-glutamine (see Recipes)
2. Express 5 SFM medium supplemented with penicillin-streptomycin and L-glutamine (see Recipes)
3. Paraformaldehyde fixative solution (see Recipes)
4. PBSTB (see Recipes)
Recipes
1. Express 5 SFM medium supplemented with L-glutamine
| Reagent | Final concentration | Quantity or Volume |
|---|---|---|
| Express 5 SFM medium | n/a | 495 mL |
| 200 mM L-glutamine | 2 mM | 5 mL |
| Total | n/a | 500 mL |
Store at 4 °C.
2. Express 5 SFM medium supplemented with penicillin-streptomycin and L-glutamine
| Reagent | Final concentration | Quantity or Volume |
|---|---|---|
| Express 5 SFM medium | n/a | 495 mL |
| 100× PSG | 1× | 5 mL |
| Total | n/a | 500 mL |
Store at 4 °C.
3. Paraformaldehyde fixative solution
Prepare fresh before using. Cells in each well will require 400 μL of this fixative solution. Therefore, depending on the number of wells (conditions tested), different volumes of fixative solution might be required. Here, we present a recipe for 10 mL of fixative solution.
| Reagent | Final concentration | Quantity or Volume |
|---|---|---|
| 0.2 M PIPES pH 6.8 | 60 mM | 3 mL |
| 0.2 M HEPES pH 7.0 | 30 mM | 1.5 mL |
| 0.5 M EGTA pH 6.8 | 10 mM | 200 μL |
| 1 M MgSO4 | 4 mM | 40 μL |
| 16% paraformaldehyde | 4% | 2.5 mL |
| ddH2O | n/a | 2.76 mL |
| Total | n/a | 10 mL |
4. PBSTB
| Reagent | Final concentration | Quantity or Volume |
|---|---|---|
| 1× PBS | 1× | 99 mL |
| 10% Triton X-100 | 0.1% | 1 mL |
| BSA | 1% | 1 g |
| Total | n/a | 100 mL |
Prepare fresh and store at 4 °C.
Laboratory supplies
1. Tissue culture dish 150 mm (Sarstedt, catalog number: 3023421)
2. Cell culture flask, T-75 (Sarstedt, catalog number: 83.3911.002)
2. Cell culture flask, T-25 (Sarstedt, catalog number: 83.3910.002)
4. Tissue culture test plate, 6 wells (TPP, catalog number: 92006)
5. Tissue culture test plate, 24 wells (Corning, catalog number: 3526)
6. Round coverslips, 13 mm, No. 1.5 (VWR, catalog number: 631-0150)
7. Microscope slides (VWR, catalog number: 631-1553)
8. Hemocytometer (Neubauer)
9. Foil paper
Equipment
1. Cell culture flow hood
2. Cell culture incubator capable of maintaining a constant temperature of 25–27 °C
Note: The medium used to culture DMEL-2 cells does not require pH control; therefore, it is not necessary to use an incubator with a CO2 supply line.
3. Nikon Ti-E motorized microscope (computer-controlled microscope) equipped with a Zyla 4.2 Mpx sCMOS Andor camera (or equivalent with high quantum efficiency and low noise) and 100× 1.4 NA objective lens
Software and datasets
1. Fiji; Java-based program: https://imagej.net/software/fiji/ [22]
Procedure
A. Experiment design and controls to investigate centriole stability
The centriole stability assay can be used not only to investigate the role of individual proteins in maintaining centrosome integrity but also to explore how different protein functions interact to ensure the proper maintenance of centrosomes and centrioles. In this context, DMEL-2 cultured cells can be treated with various dsRNAs simultaneously. In our previous studies addressing the role of the pericentriolar material (PCM) in centriole stability, we examined both the function of individual PCM components and their collective contribution to the overall process of centriole stability. We successfully silenced up to four PCM genes simultaneously (ASL, CNN, SPD2, and PLP: “ALL PCM”) [17,18]. Interestingly, while the single depletion of these proteins did not significantly affect centriole stability, the simultaneous RNA-mediated silencing of all four proteins resulted in a high percentage of cells lacking centrioles (Figure 1). This was achieved by transfecting cells with 10–20 μg of each dsRNA, totaling 40–80 μg [17,18].
Each experimental setup must include both negative and positive controls. We recommend using dsRNA for targeting mCherry as a negative control (see Table 1 for primers to generate dsRNA). For positive controls, two options are available: dsRNA for the centriolar wall protein ANA1, or the combination of four different dsRNAs targeting the PCM (“ALL PCM;” see Table 1 for primers). In both cases, treating cells with these dsRNAs results in a significant loss of centrioles (Figure 1) [17,18].
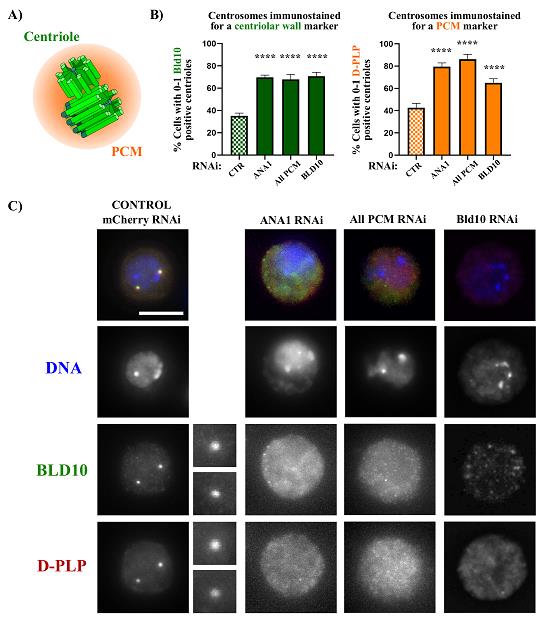
Figure 1. Centriole stability assay showing that depletion of the centriolar wall protein ANA1 and the pericentriolar material (PCM) leads to centrosome loss. (A) The centrosome is composed of two barrel-shaped microtubule-based centrioles surrounded by a multiprotein cloud called the PCM. (B) Centriolar numbers were assessed by considering the staining of the centriolar marker BLD10 (green bars) and the PCM marker D-PLP (orange bars). Plots showing the percentage of cells with abnormally low centriole numbers (0–1 centrioles) upon treatment with the different dsRNAs. We also included a condition in which BLD10 was depleted to validate the BLD10 antibody as a good centrosomal marker. Data are the mean ± SEM of three independent experiments (for each biological replicate in each experimental condition, n ≥ 100 cells). Statistical significance was determined by performing a bimodal regression test. The impact of the different RNAi treatments on the number of cells with 0–1 centrioles was estimated based on the number of cells that present a reduced number of centrioles with the different markers. Estimates indicate the log odds ratio that the indicated treatment increases the number of cells with 0–1 centrioles. *p < 0.05; **p < 0.01; ***p < 0.001; ****p < 0.0001; ns, not significant. Adapted from Pimenta-Marques et al. [18] (C) Representative images of centrosomes stained for the centriolar protein BLD10 (green) and the PCM protein D-PLP in control cells (mCherry RNAi) and cells with dsRNA transfection for the centriolar protein ANA1, the PCM (“All PCM;” ASL, CNN, D-PLP, and SPD2), and the centriolar protein BLD10. DNA (blue) enlargements of centrosomes present in each cell are shown. Scale bar, 5 μm.
Table 1. Primers for the generation of negative and positive control dsRNAs
| Primer name | Primer sequence |
|---|---|
| mCherry FW | 5'- TAATACGACTCACTATAGGGATGGTGAGCAAGGG - 3' |
| mCherry REV | 5'- TAATACGACTCACTATAGGGGTTGACGTTGTAGG - 3' |
| ANA1 FW | 5'- TAATACGACTCACTATAGGGAGAATGGCTCTGCAGCTAACAGTAA - 3' |
| ANA1 REV | 5'- TAATACGACTCACTATAGGGAGATTGACCAAAACATGCTCACGCC - 3' |
| ASL FW | 5'- TAATACGACTCACTATAGGGAGATTATGGTGAATGCCTTCGAC- 3' |
| ASL REV | 5'- TAATACGACTCACTATAGGGGTTGACGTTGTAGG - 3' |
| CNN FW | 5'- TAATACGACTCACTATAGGGAGAACCTCCAGGCGGCGGCAACT - 3' |
| CNN REV | 5'- TAATACGACTCACTATAGGGAGATGGCTCGAGCGGCATCCTT - 3' |
| D-PLP FW | 5'- TAATACGACTCACTATAGGGAGAGGAGCGCCTAAAGAACAGTG - 3' |
| D-PLP REV | 5'- TAATACGACTCACTATAGGGAGACTGATCGAGCTGTTTGTGGA - 3' |
| SPD-2 FW | 5'- TAATACGACTCACTATAGGGAGAGTCGCGTTCCAGCCAAGCAAAGA - 3' |
| SPD-2 REV | 5'- TAATACGACTCACTATAGGGAGAAATCCCCCACCTCCGTTAAGACTCAG - 3' |
Notes:
1. We have used an already established standard protocol [23] to generate the different dsRNAs used in our experiments [17,18]. dsRNA is produced from cDNA prepared from Drosophila cultured cells or exon sequences of the gene of choice, preceded by the T7 promoter sequence (underlined in Table 1) [24]. Primers used were designed to produce templates between 200 and 600 bp in length, which target all isoforms of the gene of interest to ensure effective knockdown of all transcript variants. In general, the target sequence of the primer should be 18–24 nucleotides in length. Programs such as Primer3 and SnapGene can be used to design primers that fit guidelines for PCR effectiveness, such as GC content and predicted melting temperatures [24].
2. The efficiency of the RNAi can be tested by either performing a western blot to analyze total protein levels or by RT-PCR to monitor the expression level of the targeted mRNAs, using standard protocols. We have used as internal RT-PCR controls constitutively expressed genes, such as actin or eukaryotic initiation factor-4a (see Suppl. Figure 3 from Pimenta-Marques et al. [11]).
For each condition tested, we typically use a maximum of 40 μg of dsRNA. When using different combinations of dsRNA, the total amount should not exceed 100 μg. Below, we provide examples of different centriole stability assays in which hypothetical proteins A and B are depleted to test their roles in the maintenance of centrosome integrity (Figure 2). Additionally, simultaneous depletions of proteins A and B can be performed to explore potential cooperative or interdependent roles in this process. While this approach does not account for the full complexity of cellular interaction networks, including feedback loops, branching pathways, or nonlinear interactions, it offers an initial framework to evaluate whether these proteins contribute interdependently or in coordination to centrosome integrity (Figure 3).
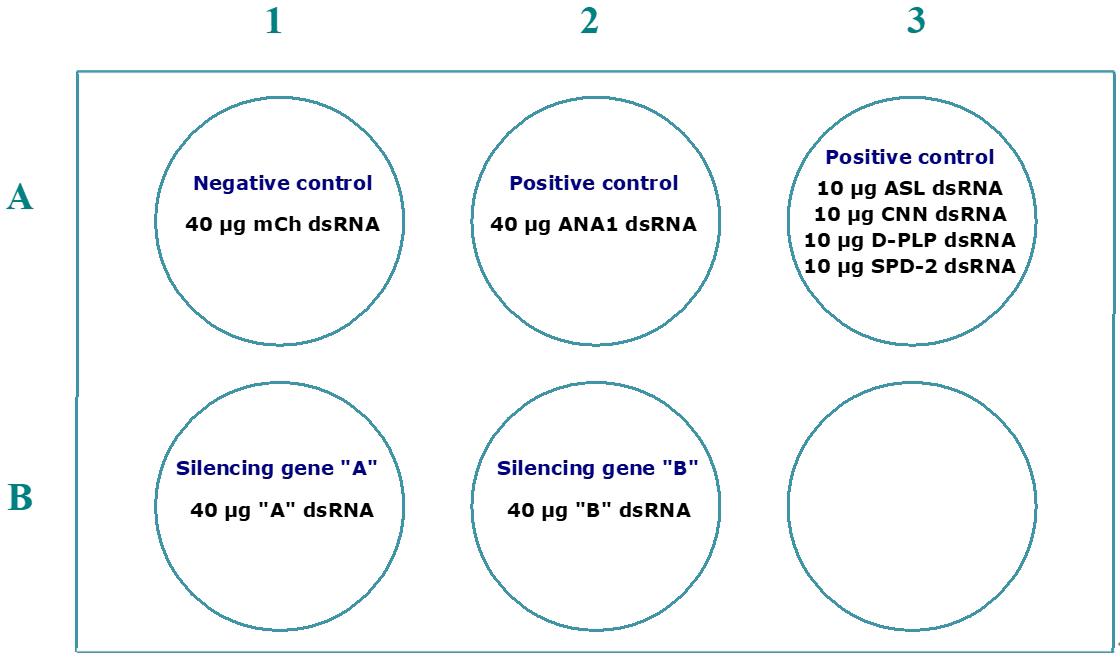
Figure 2. Example of a 6-well plate layout for an assay where the function of individual proteins is tested for their role in centrosome stability. In this setup, we recommend using 40 μg when single genes are silenced by the dsRNA. To ensure the same total amount of dsRNA in all conditions, for the positive control where the PCM is silenced (“All PCM”), we recommend the use of 10 μg of dsRNA to silence each gene, which is sufficient to induce defects in centrosome stability (Figure 1).
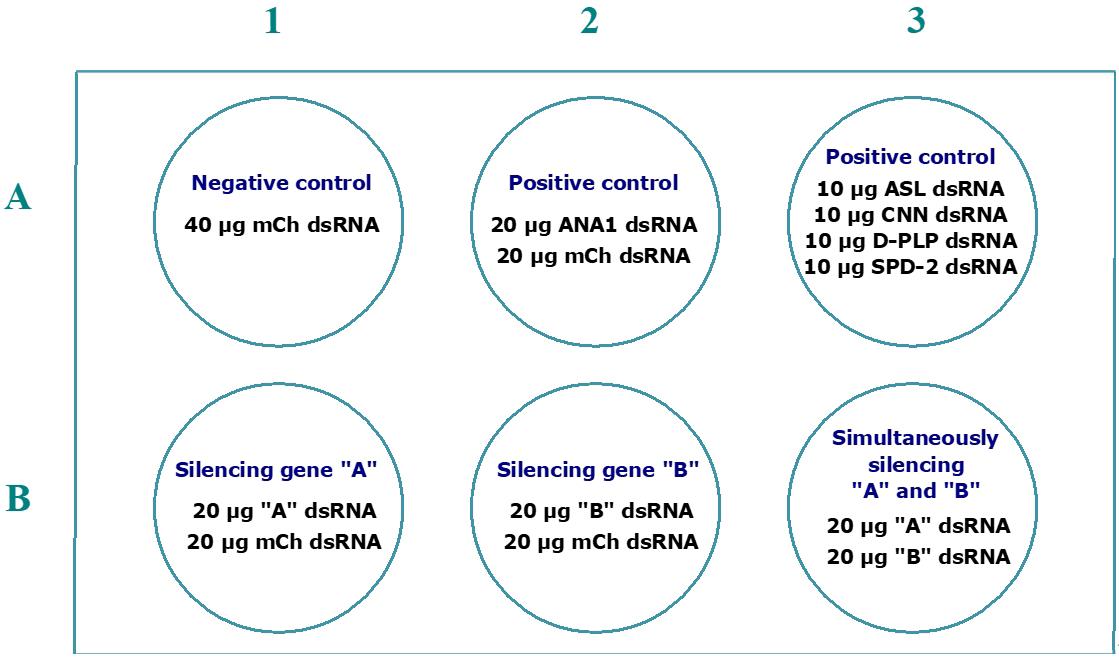
Figure 3. Example of a 6-well plate layout for an assay in which the function of individual proteins and their interaction are tested for a role in centrosome stability. This assay includes the individual and simultaneous silencing of the hypothetical genes A and B. To compare phenotypes between single and simultaneous RNAi of genes A and B, the total amount of dsRNA silencing these genes (40 μg) must be equal in all wells (B1, B2, and B3). Therefore, when depleting A and B individually, we add 20 μg of mCherry dsRNA to have a total of 40 μg of dsRNA. The same rationale must be applicable to the negative and positive controls.
B. Preparation of cells
1. Drosophila DMEL-2 cells should be cultured according to standard tissue culture techniques [23]. They are maintained at 25 °C in T-75 flasks with Express 5 SFM medium supplemented with penicillin-streptomycin and L-glutamine.
2. Cells should be split every 3–4 days (~90% confluency) to avoid the formation of cell clumps and reduction of nutrients in the medium, for a maximum of 30–40 passages.
3. To dilute and transfer cells to a new flask with fresh medium, gently dissociate the cells from the bottom of the flask by resuspending with a pipette. Add 3 mL of resuspended cells to a flask containing 12 mL of fresh medium (Express 5 SFM supplemented with 1× PSG).
C. Centriole stability assay
1. Culture DMEL-2 cells with Express 5 SFM medium supplemented with 1× PSG at 25 °C.
2. On the day before dsRNA transfection (Day 1), dilute the resuspended cells by mixing one part of the cell suspension with one part of fresh medium. For example, if cells are cultured in a flask with a total volume of 7 mL, resuspend the cells thoroughly and transfer 3.5 mL of the resuspended cells into a new flask containing 3.5 mL of fresh medium.
3. On Day 0, resuspend cells into a Falcon tube and count them using a hemocytometer to determine cell concentration.
4. Collect the required volume of resuspended cells to seed 1 × 10⁷ cells per well (of a 6-well plate). Centrifuge cells and discard most of the supernatant, leaving 1 mL of conditioned medium (with growth factors). Resuspend the cell pellet in Express 5 SFM medium (not supplemented) for a final concentration of 1 × 10⁷ cells/mL. Add 1 mL to each well of a 6-well plate and incubate for 1 h at 25 °C for cells to adhere to the bottom of the well. After 1 h, use an inverted microscope to confirm that most of the cells are associated with the plastic. Attached cells look darker and tend to be stretched at the bottom of the plate.
5. For each condition tested (each well), prepare 1 mL of Express 5 SFM (not supplemented) medium (without PSG) with 10 μM APH (2 μL of a 5 mM stock solution) and 1.5 mM HU (1.5 μL of a 1 M stock solution) and add the dsRNA. Mix gently and let it stand at room temperature (RT) for 15 min.
6. Remove the medium from the cells and add the prepared 1 mL containing the dsRNA with APH and HU to each well. Incubate the plates at 25 °C for 16 h.
7. For each well of the experiment, prepare 2 mL of Express 5 SFM medium supplemented with 1× PSG along with 4 μL of APH and 3 μL of HU. Add 2 mL of this medium to the 1 mL with dsRNA already in each well. Incubate at 25 °C.
8. Harvest cells at Day 4 for immunofluorescence. If needed, RT-PCR and flow cytometry can be performed as previously described [23].
Notes:
1. Instructions should be followed for each hemocytometer. For the hemocytometer we use, cell concentration is determined by pipetting 10 μL of the cell suspension into both chambers of the hemocytometer. Under the microscope (10× magnification), we focus on the grid and count the number of cells in both chambers (2 large squares, each containing 16 smaller squares). Each chamber represents 0.1 mm (equivalent to 104 mL). Therefore, cell concentration is calculated by using the following formula: Cell concentration (cells/mL) = (Total number of cells counted / # squares counted) × 104 × dilution factor. If the cell concentration is too low, cells can be concentrated by centrifugation and by resuspending cells in a smaller volume with fresh medium. For example, if 306 and 301 cells are counted in each chamber, the final concentration of cells in the suspension is 3.0 × 10⁶ cells/mL.
2. DMEL cells are semi-adherent, so all solution changes in the assay must be done carefully to prevent the cells from detaching from the bottom of the well.
3. The aliquots of dsRNAs are very concentrated and therefore viscous. Therefore, in order to not waste any dsRNA, tubes containing harvested dsRNA should be briefly spinned down.
4. In Drosophila cultured cells, usually 3–4 days of dsRNA treatment are sufficient to target the mRNA and significantly downregulate the respective protein. However, in the case of very stable or abundant proteins, the treatment can be extended up to 8 days. In this case, at Day 4 after dsRNA transfection, repeat the procedure from steps C4–7.
5. APH is an inhibitor of DNA polymerase in eukaryotic cells, and HU inhibits the synthesis of deoxyribonuclease. Therefore, cells treated with these drugs will arrest in S phase. Because the centrosome duplication cycle is coupled with the cell cycle [2,3], as a consequence, centrosome duplication will also be arrested in these cells [25].
6. The depletion of certain proteins under investigation may lead to a high percentage of cell death. Dead cells typically detach from the bottom of the well and become suspended in the medium. Therefore, prior to harvesting cells in step C7, they should be inspected under a microscope (10× magnification) to ensure that there is not a significant number of floating cells in the medium. If that is the case, the medium should be carefully removed, discarded, and replaced with fresh medium before resuspending and harvesting the cells attached to the bottom of the well for further analysis. These cells should be used not only for immunostaining analysis but also for validating the siRNA treatment (RT-PCR/western blot). Since there is a reduction in the number of cells attached to the bottom of the well, they should be counted using a hemocytometer to adjust the volume of cells required for further analysis. For the immunostaining, a total amount of ~2 × 10 cells should be added to each coverslip in step E5.
7. As an initial approach, we recommend assessing the efficiency of the RNAi by RT-PCR and/or western blot [23]. However, it should be acknowledged that these methods provide information on mRNA and protein levels at the whole-cell population level. If required, an alternative approach is to perform an immunostaining with an antibody recognizing the protein targeted, allowing for the analysis of protein localization and the evaluation of variability of RNAi efficiency within the cell population. However, this method may not always be feasible due to practical limitations, such as the availability of high-quality antibodies or challenges associated with performing immunostaining for a large number of proteins, especially in high-throughput screening settings.
D. Transfecting cells with different DNA constructs
Depending on the question to be approached, the expression of specific proteins might be useful in the context of the centriole stability assay. In this case, the assay should be performed as described in section C until step 5, and then proceed with the following steps:
1. For each well, prepare the transfection mix according to the standard Effectene Transfection Reagent protocol: dilute 400 ng of each plasmid in 100 μL of EC buffer and add 3.2 μL of enhancer.
2. Vortex for 1 s, spin down, and incubate for 5 min at RT.
3. Add 10 μL of Effectene, mix by gently pipetting, and incubate for 10 min at RT.
4. Add 1 mL of Express 5 SFM supplemented with L-Glutamine (no antibiotics), 10 μM APH (2 μL of a 5 mM stock solution), and 1.5 mM HU (1.5 μL of a 1 M stock solution) to the transfection mix.
5. Add the prepared transfection solution to the cells (that already have 1 mL of the dsRNA mix) in a dropwise manner. Incubate for 1 h at 25 °C.
6. Add 1 mL of Express 5 SFM medium supplemented with 1× PSG, 10 μM APH, and 1.5 mM HU per well, totalizing 3 mL in each.
7. Harvest cells at Day 4 for immunofluorescence, as well as RT-PCR and flow cytometry, if needed. RT-PCR and flow cytometry can be performed as previously described [23].
Notes:
1. The expression of some DNA constructs requires the co-transfection of cells with an inducer plasmid (e.g., Gal-4 expression plasmid to induce expression of UAS promoter). In this case, the total amount of DNA with which cells are transfected should not exceed 400 ng, and we typically use 200 ng of each plasmid.
2. In cases where an 8-day centriole stability assay is being performed, after plasmid transfection, instead of step D7, proceed with steps C4–C8 on Day 4; 16 h later, proceed with steps D1–D6. Cells should then be harvested at Day 8.
E. Immunofluorescence
1. Place one round coverslip (13 mm) in each well of a 24-well plate.
2. Wash coverslips inside the wells with Express 5 SFM (not supplemented).
3. Gently remove the medium from the cells and replace it with 4 mL of fresh medium per well. This step ensures the removal of dead cells that are detached and floating in the medium.
4. Resuspend the cells from each experimental condition, pipetting up and down in the newly added medium.
5. Plate between 250 and 300 μL of cells (~2 × 10⁶ cells) into each well and incubate for 1 h at 25 °C to allow cells to adhere to the coverslips.
6. Prepare the fixative solution. Depending on the staining to be performed, cells might be fixed with paraformaldehyde or methanol.
a. Paraformaldehyde fixation:
i. After confirming cells have attached to the coverslip, carefully remove the medium from the coverslip and add the paraformaldehyde fixative solution.
ii. Incubate for 10 min at RT.
iii. Remove the fixative solution and perform two washes of 5 min in PBS.
iv. Remove PBS, add freshly made PBSTB, and incubate for 30 min at RT.
b. Methanol fixation:
i. After confirming cells have attached to the coverslip, carefully remove the medium from the coverslip and add cold methanol (stored at -20 °C).
ii. Incubate for 10 min at -20 °C.
iii. Remove the fixative solution and perform two washes of 5 min in PBS.
iv. Remove PBS, add freshly made PBSTB, and incubate for 30 min at RT.
7. Dilute primary antibodies in PBSTB and centrifuge the mix at maximum speed at 4 °C for 10 min.
8. In order to reduce the amount of antibody solution used, coverslips can be removed from the 24-well plate and transferred to a hydrophobic surface, such as ParafilmTM, with the side containing cells facing up.
9. Add 40 μL of the antibody solution to each coverslip.
10. Depending on the antibody used, cells can be incubated with the antibody from 1 h at RT to overnight at 4 °C.
11. To avoid evaporation of the antibody solution, coverslips can be maintained in a humid chamber during the incubation period. We typically use big Petri dishes with two pieces of paper soaked in water.
12. Carefully transfer the coverslips back to each well of the 24-well plates (cells facing up) and perform three washes of 5 min in PBSTB.
13. Dilute secondary antibodies in PBSTB and centrifuge the mix at maximum speed at 4 °C for 10 min.
14. Incubate coverslips with secondary antibody mix as in steps E8, E9, and E11 for 1 h at RT, protected from light.
15. Transfer the coverslips back to each well of the 24-well plates (cells facing up) and perform three washes of 5 min in PBSTB.
16. Perform a final wash with PBS and mount coverslips with the appropriate mounting media. We generally use Vectashield, which contains DAPI, to stain DNA.
Notes:
1. To investigate how the centrosome structure is affected under specific conditions, antibodies targeting different substructures of the centrosome can be used. In interphase, Drosophila centrioles are surrounded by a thin PCM layer composed of proteins such as ASL, D-PLP, and SPD-2 [26]. Antibodies against these components can be used to analyze this region of the centrosome [17,18,27,28]. Furthermore, antibodies targeting the distal tip of the centriole (anti-CP110) and the centriolar wall (anti-ANA1, anti-SAS4, and anti-BLD10) [18] are suitable for labeling these specific substructures. Using these markers allows one to investigate how different parts of the centrosome are affected under specific experimental conditions, offering valuable insights into the organelle’s structure (Table 2). Moreover, centrosomes can by quantified either by using different markers independently or by accessing the colocalization of multiple centrosomal markers. This approach allows for the distinction between the presence/absence of centrosomes and the specific loss of a particular centrosomal marker under the experimental conditions tested.
2. PBSTB should be prepared fresh for each immunostaining. Since BSA easily contaminates, store the PBSTB solution at 4 °C if the primary antibodies are incubated overnight.
3. It is possible to fix several coverslips for each condition and store them after fixation (before step E7) at 4 °C with sodium azide 0.01%. When required, these coverslips can be used for other immunofluorescence assays.
4. To address centrosome stability, specific antibodies recognizing different centriolar and PCM components should be used. The number of “foci” in each cell is a readout for the number of centrosomes per cell, with the analysis of at least 100 cells per condition (Figure 1).
Table 2. Antibodies that can be used to mark different parts of the centrosome
| Antibody | Targeted Centrosome Region | Dilution |
|---|---|---|
| Chicken anti-D-PLP | Pericentriolar material | 1:500 [27] |
| Rabbit anti-BLD10 | Centriole wall | 1:2,000 [29] |
| Rabbit anti-CP110 | Centriole distal tip | 1:10,000 [30] |
| Rat anti-ANA1 | Centriole wall | 1:500 [31] |
| Rabbit anti-SAS4 | Centriole wall | 1:500 [18] |
F. Imaging
The centriole number in the cell population of each condition was analyzed using a Nikon Ti-E motorized microscope equipped with a Zyla 4.2 Mpx sCMOS camera (Andor) and 100× 1.4 NA objective lens. Z-stacks spanning 10μm were acquired at 0.2μm intervals.
Data analysis
Acquired images are processed using the maximum intensity projection function in Fiji to generate a single Z-projected plane. The number of distinct, focused dots recognized by each antibody targeting a centrosomal protein is manually quantified per cell, representing the presence of individual centrosomal components. Additionally, the number of colocalizing dots across all centrosomal antibodies used allows the assessment of both the presence of specific centrosomal proteins and the overall centriole count.
Drosophila cultured cells arrested in S phase typically contain 2–4 centrioles [18]. In control cells (mCherry RNAi), 50%–70% of the total cell population contains 2–4 centrioles, while 20%–40% have 0–1 centrioles, and a small fraction exhibits more than 4 centrioles (Figure 4). While some variability may occur between replicates, these proportions remain stable. Moreover, these percentages are comparable to interphase centriole numbers in cycling cells [27,32].
To investigate the effects of different experimental conditions on centrosome stability, the percentage of cells with 0–1 centrioles should be quantified using antibodies that recognize centrosomal proteins (see note 1 in Section E and Figures 1 and 4). The number of cells with 2–4 centrioles and those with more than 4 centrioles should also be counted to assess how the percentage of the different categories varies within the different experimental conditions. A minimum of 100 cells per condition should be analyzed for each biological replicate, with at least three biological replicates per condition. Centriole integrity loss is determined by comparing the proportion of cells with 0–1 centrioles between experimental conditions and controls (Figure 4).
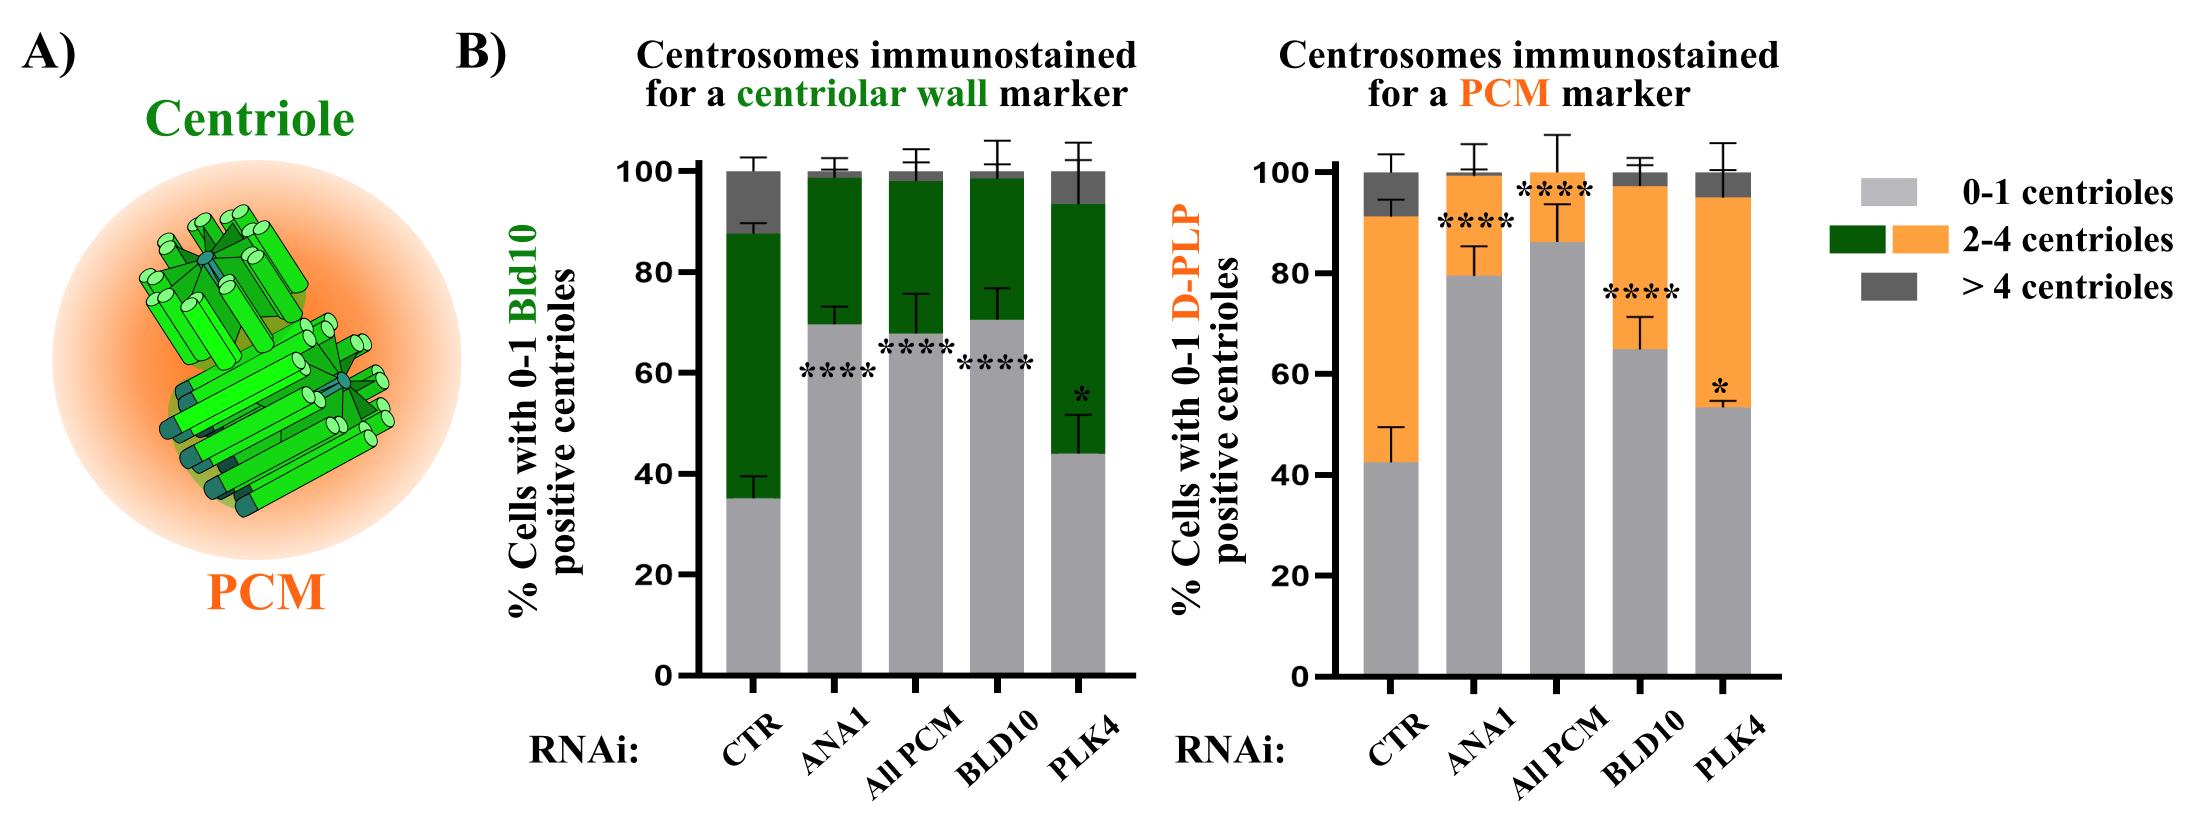
Figure 4. Quantification of centriole numbers in S phase arrested cells and depletion of different proteins of interest. (A) Schematic representation of both centrioles (green) surrounded by the pericentriolar material (PCM) (orange). (B) Centriole numbers were quantified by independently counting the number of focused dots labeled with the centriole marker (BLD10) and the PCM marker (D-PLP). Centrioles may also be quantified based on the colocalization of both markers. Depletion of either ANA1 or the PCM (“All PCM;” ASL, CNN, D-PLP, and SPD2) leads to an increased percentage of cells with an abnormally low number of centrioles (0–1), as identified by each respective marker in comparison with the control (mCherry RNAi). Notably, RNAi for PLK4, a master regulator of centriole biogenesis, does not result in a substantial loss of centrioles. This contrasts sharply with the depletion or inhibition of PLK4 in cycling cells, which prevents centriole duplication and leads to centriole loss [27,33,34]. These results demonstrate the reliability of the centriole stability assay for investigating mechanisms that regulate the integrity of centrosomes. Note that a condition in which BLD10 is depleted was also included to validate the BLD10 antibody as a good centrosomal marker. Data are the mean ± SEM of three independent experiments (for each biological replicate in each experimental condition, n ≥ 100 cells). Statistical significance was determined by performing a bimodal regression test. The impact of the different RNAi treatments on the number of cells with 0–1 centrioles was estimated based on the number of cells that present a reduced number of centrioles with the different markers. Estimates indicate the log odds ratio that the indicated treatment increases the number of cells with 0–1 centrioles. *p < 0.05; ***p < 0.001; ****p < 0.0001; ns, not significant. Adapted from Pimenta-Marques et al. [18].
Validation of protocol
This protocol has been used and validated in the following research articles:
• Pimenta-Marques et al. [17]. A mechanism for the elimination of the female gamete centrosome in Drosophila melanogaster. Science (Figure 3 and Supplementary Figures 2 and 7).
• Pimenta-Marques et al. [18]. Ana1/CEP295 is an essential player in the centrosome maintenance program regulated by Polo kinase and the PCM. EMBO Reports (Figures 1, 3, and 6).
General notes and troubleshooting
General notes
When culturing Drosophila cells, it is crucial to maintain aseptic conditions. Always work within a tissue culture hood when handling cells and preparing solutions. Clean the workspace and pipettes with 70% ethanol before starting. Regularly inspect the cells under a microscope to ensure they appear healthy and free from contamination.
When handling certain chemicals used in this assay, such as paraformaldehyde (PFA), methanol, aphidicolin, and hydroxyurea, it is essential to take safety precautions. PFA is both toxic and carcinogenic, while methanol is toxic. Therefore, these substances must be handled in a fume hood. To minimize the risk of exposure, all solutions should be prepared with appropriate safety measures, including wearing a lab coat, gloves, safety glasses, and other protective equipment.
Troubleshooting
Problem 1: Increased cell death.
Possible cause: The depletion of some proteins by RNAi may result in increased cell death.
Solution: Prior to harvesting cells in step C7, the culture medium should be replaced with fresh medium to remove floating dead cells. Cells should then be resuspended in fresh medium and counted to ensure that a sufficient number of viable cells is collected for further analysis. If cell death is substantial, it may be necessary to increase the number of wells used for RNAi depletion to obtain an adequate number of cells for further analysis. Additionally, it is important to consider that the surviving cell population is likely to consist of cells in which RNAi-mediated depletion was less efficient. Therefore, conclusions regarding centrosome stability should be interpreted with caution. For example, in such cases, the absence of an observable phenotype does not necessarily indicate that the targeted protein is not involved in centrosome stability. Instead, it may suggest that its depletion leads to such a severe disruption that affected cells do not survive. This possibility should be considered when drawing conclusions, and alternative approaches, such as milder depletion strategies, may be required to assess the role of the protein in centrosome integrity.
Problem 2: Reduced efficiency in protein depletion by RNAi.
Possible cause: Reduced RNAi efficiency can be identified when western blot analysis reveals little or no reduction in protein levels, despite effective mRNA knockdown confirmed by RT-PCR. This suggests that the protein under study is highly stable, making siRNA-based approaches less effective for its depletion.
Solution: Alternative methods, such as proteasome-targeting strategies (DegradFP or auxin-mediated degradation), can be explored to achieve more effective protein depletion. However, integrating these approaches would require additional optimization and validation to ensure compatibility with the assay and reliable assessment of centrosome stability under these conditions.
Acknowledgments
This protocol was originally published in two research manuscripts by Pimenta-Marques et al. [17,18]. This work was supported by a grant from the Portuguese Research Council (FCT) awarded to APM (PTDC/BIA-BID/32225/2017).
Competing interests
The authors declare no competing interests.
References
- Bettencourt-Dias, M. and Glover, D. M. (2007). Centrosome biogenesis and function: centrosomics brings new understanding. Nat Rev Mol Cell Biol. 8(6): 451–463. https://doi.org/10.1038/nrm2180
- Gönczy, P. and Hatzopoulos, G. N. (2019). Centriole assembly at a glance. J Cell Sci. 132(4): e228833. https://doi.org/10.1242/jcs.228833
- Pimenta-Marques, A. and Bettencourt-Dias, M. (2020). Pericentriolar material. Curr Biol. 30(12): R687–R689. https://doi.org/10.1016/j.cub.2020.04.064
- Vasquez-Limeta, A. and Loncarek, J. (2021). Human centrosome organization and function in interphase and mitosis. Semin Cell Dev Biol. 117: 30–41. https://doi.org/10.1016/j.semcdb.2021.03.020
- Balestra, F. R., von Tobel, L. and Gönczy, P. (2015). Paternally contributed centrioles exhibit exceptional persistence in C. elegans embryos. Cell Res. 25(5): 642–644. https://doi.org/10.1038/cr.2015.49
- Kochanski, R. S. and Borisy, G. G. (1990). Mode of centriole duplication and distribution. J Cell Biol. 110(5): 1599–1605. https://doi.org/10.1083/jcb.110.5.1599
- Akhmanova, A. and Kapitein, L. C. (2022). Mechanisms of microtubule organization in differentiated animal cells. Nat Rev Mol Cell Biol. 23(8): 541–558. https://doi.org/10.1038/s41580-022-00473-y
- Sanchez, A. D. and Feldman, J. L. (2017). Microtubule-organizing centers: from the centrosome to non-centrosomal sites. Curr Opin Cell Biol. 44: 93–101. https://doi.org/10.1016/j.ceb.2016.09.003
- Muroyama, A. and Lechler, T. (2017). Microtubule organization, dynamics and functions in differentiated cells. Development. 144(17): 3012–3021. https://doi.org/10.1242/dev.153171
- Werner, S., Pimenta-Marques, A. and Bettencourt-Dias, M. (2017). Maintaining centrosomes and cilia. J Cell Sci. 130(22): 3789–3800. https://doi.org/10.1242/jcs.203505
- Salisbury, J. L., Lingle, W. L., White, R. A., Cordes, L. E. and Barrett, S. (1999). Microtubule Nucleating Capacity of Centrosomes in Tissue Sections. J Histochem Cytochem. 47(10): 1265–1273. https://doi.org/10.1177/002215549904701006
- Lingle, W. L. and Salisbury, J. L. (1999). Altered Centrosome Structure Is Associated with Abnormal Mitoses in Human Breast Tumors. Am J Pathol. 155(6): 1941–1951. https://doi.org/10.1016/s0002-9440(10)65513-7
- Pihan, G. A., Purohit, A., Wallace, J., Knecht, H., Woda, B., Quesenberry, P. and Doxsey, S. J. (1998). Centrosome defects and genetic instability in malignant tumors. Cancer Res. 58(17): 3974–3985. https://pubmed.ncbi.nlm.nih.gov/9731511/
- Pihan, G. A., Purohit, A., Wallace, J., Malhotra, R., Liotta, L. and Doxsey, S. J. (2001). Centrosome defects can account for cellular and genetic changes that characterize prostate cancer progression. Cancer Res. 61(5): 2212–2219. https://pubmed.ncbi.nlm.nih.gov/11280789/
- Godinho, S. A., Picone, R., Burute, M., Dagher, R., Su, Y., Leung, C. T., Polyak, K., Brugge, J. S., Théry, M., Pellman, D., et al. (2014). Oncogene-like induction of cellular invasion from centrosome amplification. Nature. 510(7503): 167–171. https://doi.org/10.1038/nature13277
- Sabino, D., Gogendeau, D., Gambarotto, D., Nano, M., Pennetier, C., Dingli, F., Arras, G., Loew, D. and Basto, R. (2015). Moesin Is a Major Regulator of Centrosome Behavior in Epithelial Cells with Extra Centrosomes. Curr Biol. 25(7): 879–889. https://doi.org/10.1016/j.cub.2015.01.066
- Pimenta-Marques, A., Bento, I., Lopes, C. A. M., Duarte, P., Jana, S. C. and Bettencourt-Dias, M. (2016). A mechanism for the elimination of the female gamete centrosome in Drosophila melanogaster. Science. 353(6294): eaaf4866. https://doi.org/10.1126/science.aaf4866
- Pimenta-Marques, A., Perestrelo, T., Reis-Rodrigues, P., Duarte, P., Ferreira-Silva, A., Lince-Faria, M. and Bettencourt-Dias, M. (2024). Ana1/CEP295 is an essential player in the centrosome maintenance program regulated by Polo kinase and the PCM. EMBO Rep. 25(1): 102–127. https://doi.org/10.1038/s44319-023-00020-6
- Balczon, R., Bao, L., Zimmer, W. E., Brown, K., Zinkowski, R. P. and Brinkley, B. R. (1995). Dissociation of centrosome replication events from cycles of DNA synthesis and mitotic division in hydroxyurea-arrested Chinese hamster ovary cells. J Cell Biol. 130(1): 105–115. https://doi.org/10.1083/jcb.130.1.105
- Stucke, V. M. (2002). Human Mps1 kinase is required for the spindle assembly checkpoint but not for centrosome duplication. EMBO J. 21(7): 1723–1732. https://doi.org/10.1093/emboj/21.7.1723
- Meraldi, P., Lukas, J., Fry, A. M., Bartek, J. and Nigg, E. A. (1999). Centrosome duplication in mammalian somatic cells requires E2F and Cdk2–Cyclin A. Nat Cell Biol. 1(2): 88–93. https://doi.org/10.1038/10054
- Schindelin, J., Arganda-Carreras, I., Frise, E., Kaynig, V., Longair, M., Pietzsch, T., Preibisch, S., Rueden, C., Saalfeld, S., Schmid, B., et al. (2012). Fiji: an open-source platform for biological-image analysis. Nat Methods. 9(7): 676–682. https://doi.org/10.1038/nmeth.2019
- Bettencourt-Dias, M. and Goshima, G. (2009). RNAi in Drosophila S2 Cells as a Tool for Studying Cell Cycle Progression. Methods Mol Biol. 545: 39–62. https://doi.org/10.1007/978-1-60327-993-2_3
- Kao, L. R. and Megraw, T. L. (2004). RNAi in Cultured Drosophila Cells. Methods Mol Biol. 247: 443–458. https://doi.org/10.1385/1-59259-665-7:443
- Dzhindzhev, N. S., Yu, Q. D., Weiskopf, K., Tzolovsky, G., Cunha-Ferreira, I., Riparbelli, M., Rodrigues-Martins, A., Bettencourt-Dias, M., Callaini, G., Glover, D. M., et al. (2010). Asterless is a scaffold for the onset of centriole assembly. Nature. 467(7316): 714–718. https://doi.org/10.1038/nature09445
- Fu, J. and Glover, D. M. (2012). Structured illumination of the interface between centriole and peri-centriolar material. Open Biol. 2(8): 120104. https://doi.org/10.1098/rsob.120104
- Bettencourt-Dias, M., Rodrigues-Martins, A., Carpenter, L., Riparbelli, M., Lehmann, L., Gatt, M., Carmo, N., Balloux, F., Callaini, G., Glover, D., et al. (2005). SAK/PLK4 Is Required for Centriole Duplication and Flagella Development. Curr Biol. 15(24): 2199–2207. https://doi.org/10.1016/j.cub.2005.11.042
- Rodrigues-Martins, A., Riparbelli, M., Callaini, G., Glover, D. M. and Bettencourt-Dias, M. (2007). Revisiting the Role of the Mother Centriole in Centriole Biogenesis. Science. 316(5827): 1046–1050. https://doi.org/10.1126/science.1142950
- Mottier-Pavie, V. and Megraw, T. L. (2009). DrosophilaBld10 Is a Centriolar Protein That Regulates Centriole, Basal Body, and Motile Cilium Assembly. Mol Biol Cell. 20(10): 2605–2614. https://doi.org/10.1091/mbc.e08-11-1115
- Nabais, C., Pessoa, D., de-Carvalho, J., van Zanten, T., Duarte, P., Mayor, S., Carneiro, J., Telley, I. A. and Bettencourt-Dias, M. (2021). Plk4 triggers autonomous de novo centriole biogenesis and maturation. J Cell Biol. 220: e068650. https://doi.org/10.1101/2020.04.29.068650
- Saurya, S., Roque, H., Novak, Z. A., Wainman, A., Aydogan, M. G., Volanakis, A., Sieber, B., Pinto, D. M. S. and Raff, J. W. (2016). Drosophila Ana1 is required for centrosome assembly and centriole elongation. J Cell Sci. 129(13): 2514–2525. https://doi.org/10.1242/jcs.186460
- Ito, D., Zitouni, S., Jana, S. C., Duarte, P., Surkont, J., Carvalho-Santos, Z., Pereira-Leal, J. B., Ferreira, M. G. and Bettencourt-Dias, M. (2019). Pericentrin-mediated SAS-6 recruitment promotes centriole assembly. eLife. 8: e41418. https://doi.org/10.7554/elife.41418
- Habedanck, R., Stierhof, Y. D., Wilkinson, C. J. and Nigg, E. A. (2005). The Polo kinase Plk4 functions in centriole duplication. Nat Cell Biol. 7(11): 1140–1146. https://doi.org/10.1038/ncb1320
- Wong, Y. L., Anzola, J. V., Davis, R. L., Yoon, M., Motamedi, A., Kroll, A., Seo, C. P., Hsia, J. E., Kim, S. K., Mitchell, J. W., et al. (2015). Reversible centriole depletion with an inhibitor of Polo-like kinase 4. Science. 348(6239): 1155–1160. https://doi.org/10.1126/science.aaa5111
Article Information
Publication history
Received: Aug 26, 2024
Accepted: Apr 11, 2025
Available online: May 16, 2025
Published: Jun 5, 2025
Copyright
© 2025 The Author(s); This is an open access article under the CC BY-NC license (https://creativecommons.org/licenses/by-nc/4.0/).
How to cite
Lince-Faria, M., Ferreira-Silva, A. and Pimenta-Marques, A. (2025). The Centriole Stability Assay: A Method to Investigate Mechanisms Involved in the Maintenance of the Centrosome Structure in Drosophila Cultured Cells. Bio-protocol 15(11): e5330. DOI: 10.21769/BioProtoc.5330.
Category
Developmental Biology > Cell growth and fate > Differentiation
Cell Biology > Cell structure > Microtubule
Cell Biology > Cell isolation and culture
Do you have any questions about this protocol?
Post your question to gather feedback from the community. We will also invite the authors of this article to respond.