- Protocols

- Articles and Issues
- For Authors
- About
- Become a Reviewer

Mito Stress Assay of PBMCs With Seahorse XFe96 Flux Analyzer and Comparison of Poly-D-Lysine and Poly-L-Lysine for Cell Affinity
Published: Vol 15, Iss 11, Jun 5, 2025 DOI: 10.21769/BioProtoc.5327 Views: 2043
Reviewed by: Komuraiah MyakalaRudian ZhangAnonymous reviewer(s)
Advertisement


Protocol Collections
Comprehensive collections of detailed, peer-reviewed protocols focusing on specific topics


Related protocols
Abstract
The Seahorse 96 XF Analyzer (Agilent Technologies, Santa Clara, CA, USA) has been an effective tool in non-invasively measuring mitochondrial function for the past decade. It is a high-throughput respirometer that is considered the “gold standard” for quantifying mitochondrial function and bioenergetics in cells. Peripheral blood mononuclear cells (PBMCs) play a selective role in immune system responses and are key components of human immunity. Recent studies have suggested that these cell populations provide an overview of systemic changes within the body and therefore provide a source of sensitive biomarkers. Assessing mitochondrial function in PBMCs has been shown to provide an indication of metabolic stress associated with diseases such as diabetes and neurodegenerative conditions such as Alzheimer’s disease. In this protocol, we use two adhesive compounds, Poly-D-Lysine (PDL) and Poly-L-Lysine (PLL), at 50 μg/mL each per well, to immobilize PBMCs to a specialized Seahorse microplate to perform mitochondrial stress assay using the Seahorse Analyzer. We compared six cell densities of PBMCs to identify the optimal cell density for use in Seahorse Mito Stress analysis. This protocol includes the immobilization of freshly isolated PBM cells into a Seahorse microplate, hydration and calibration of the sensor cartridge, cell seeding, running the Seahorse Analyzer for the Mito Stress test, and simple data analysis to compare the effectiveness of PLL and PDL as the coating agent for PBMCs. The data analysis indicates that there is no statistical difference between PLL and PDL.
Key features
• Designed for Seahorse 96-XF Analyzer, allowing it to work with lower cell densities and accommodate a greater number of replicates with high-throughput capabilities.
• Two widely used cell adhesive compounds, Poly-D-Lysine and Poly-L-Lysine, are compared for their effectiveness in immobilizing PBMCs onto specialized Seahorse microplates.
• The protocol takes two days to complete.
Keywords: Seahorse 96 XF AnalyzerBackground
The mitochondria, the powerhouse of the cell, contain a double membrane, termed the outer and inner mitochondrial membranes. Cellular health and function depend largely on mitochondrial function. Mitochondria not only produce energy through oxidative phosphorylation but are also involved in the metabolism of amino acids, lipids, and nucleotides, diverse signaling and redox processes, and quality control and degradation mechanisms, including mitophagy and apoptosis [1]. They can be disrupted in many common diseases, including psychiatric and neurodegenerative disorders, persistent systemic inflammation, cardiac disease, cancer, and diabetes [2]. Oxidative stress and mitochondrial damage have also been implicated in the pathogenesis of several neurodegenerative diseases, including Alzheimer's disease [3].
The Seahorse 96 XF Analyzer (Agilent Technologies, Santa Clara, CA, USA) has been an effective tool in non-invasively measuring mitochondrial function for the past decade [4]. It is a high-throughput respirometer that is considered the “gold standard” for quantifying mitochondrial function and bioenergetics in cells [5–7]. It measures two key outcomes simultaneously—oxygen consumption rate (OCR) and extracellular acidification rate (ECAR)—and includes assays specifically designed to stress cells and measure metabolic potential (Agilent). The Mitochondrial Stress Test kit, designed by Agilent Technologies, offers three modulators that are introduced into the cell system to produce distinct measurements by shutting down each of the complexes in the electron transport chain in reverse order [8].
Initial addition of oligomycin blocks ATP synthase in the mitochondrial inner membrane and inhibits its function in chemiosmosis. Then, carbonyl cyanide-p-trifluoromethoxyphenylhydrazone (FCCP), an uncoupler, is added to the system, selectively removing the regulation of the proton gradient. This allows the maximum respiration rate to be determined. Finally, rotenone and antimycin A are added, which will inhibit complex I and III, respectively, of the electron transport chain [9]. The generated curve for the oxygen consumption rate can be used to obtain various measurements, including basal respiration, ATP turnover, proton leak, maximal respiration, spare respiratory capacity, and non-mitochondrial respiration.
Peripheral blood mononuclear cells (PBMCs) provide selective responses to the immune system and are major cells in the human body’s immunity. They are a heterogeneous cell population consisting of several cell types, including monocytes, T cells, and natural killer cells [10,11]. Assessing OCR and ECAR values in PBMCs has been shown to indicate metabolic stress associated with conditions such as diabetes and neurodegenerative diseases such as Alzheimer’s disease [12–14].
When using PBMCs in Seahorse analysis, it is important to choose an appropriate adhesive compound to immobilize the cells in the Seahorse microplate. Poly-D-Lysine (PDL) is widely used with PBMCs, but limited literature is available on the use of Poly-L-Lysine (PLL). PDL and PLL are the two enantiomers of a synthetic, positively charged polymer called polylysine. Cellular proteases do not degrade PDL, making it the preferred choice in many cases. Both PDL and PLL are useful in promoting cell adhesion to solid substrates and enhancing electrostatic interactions between negatively charged ions of the cell membrane and positively charged surface ions of attachment factors on the culture surface. When adsorbed to the polystyrene surface, poly-D (or L)-lysine increases the number of positively charged sites available for cell binding. Certain cell types prefer this uniform net positive charge, which can subsequently enhance their cell attachment, growth, and differentiation, especially under serum-free and/or low serum conditions. An array of transfected cell lines, glial cells, primary neurons, and neuroblastomas all frequently exhibit improved adhesion and development on surfaces coated with PDL or PLL [15].
Conducting molecular analysis and assays on PBMCs can be challenging, as they are known to be associated with challenges in maintaining cell viability with multiple handling steps throughout the workflow. Many small-scale laboratories are having difficulty finding protocols that allow them to utilize their limited resources to successfully conduct analysis on PBMCs with improved cell viability and feasible consumables. Many small-scale laboratories like ours that conduct Seahorse Flux Analyzer assays using neuronal cell lines utilize PLL as the primary cell coating agent, which is readily available in the laboratory [8,16–18]. Our objective is to compare PDL (primarily recommended for PBMCs in the literature) and our lab’s available PLL to see if it would be a suitable substitute for PDL. If confirmed, additional purchasing of a coating agent could be avoided for laboratories that utilize a wide range of cell types, including PBMCs, in the Seahorse Flux Analyzer. Therefore, in this protocol paper, our primary goal is to present a simple protocol for conducting Mito Stress assay on PBMCs using the Seahorse 96 XF Analyzer, using two commonly available adhesive compounds, PDL and PLL, and compare their effectiveness in the immobilization of freshly isolated PBMCs.
Materials and reagents
Reagents
1. Seahorse XF RPMI Assay Medium pack, pH 7.4; includes one of each of the following products: XF RPMI medium pH 7.4, 500 mL (103576-100), XF 1.0 M glucose solution, 50 mL (103577-100), XF 100 mM pyruvate solution, 50 mL (103578-100), and XF 200 mM glutamine solution, 50 mL (103579-100) (Agilent Technologies, catalog number: 103681-100)
2. Seahorse XF Cell Mito Stress Test kit; each kit contains six single-use pouches. Each pouch contains one vial of oligomycin, FCCP, and rotenone/antimycin A (Agilent Technologies, catalog number: 103015-100)
3. RPMI 1640 medium (Thermo Fisher Scientific, catalog number: 11875093)
4. Penicillin-streptomycin (10,000 U/mL-10,000 μg/mL) (Thermo Fisher Scientific, catalog number: 15140122)
5. FBS stock, heat inactivated (Thermo Fisher Scientific, catalog number: 10082147)
6. Distilled water, 1,000 mL (Thermo Fisher Scientific, catalog number: 15230147)
7. Trypan blue solution 0.4% (Thermo Fisher Scientific, catalog number: 15250061)
8. Poly-D-Lysine (PDL) solution, 1.0 mg/mL, 20 mL (Sigma-Aldrich, catalog number: A-003-E)
9. Poly-L-lysine (PLL) solution, 0.01% (w/v), 50 mL (Sigma-Aldrich, catalog number: P4832-50ML)
Laboratory supplies
1. Seahorse XFe96/XF Pro FluxPak Mini; includes six XFe96/XF Pro sensor cartridges, six XFe96/XF Pro cell culture microplates, and one bottle of Seahorse XF calibrant solution, 500 mL (Agilent Technologies, catalog number: 103793-100)
2. NuncTM 15 mL conical sterile polypropylene centrifuge tubes (Thermo Fisher Scientific, catalog number: 339650)
3. Microcentrifuge tubes, 1.5 and 5 mL (USA Scientific, catalog numbers: 4043-1021 and 4011-9401)
4. Micropipette tips, 10, 20, 200, and 1,000 μL (USA Scientific, catalog numbers: 1181-3810, 1180-1810, 1180-8810, and 1182-1830)
Equipment
1. Seahorse 96 XF Analyzer (Agilent Technologies, Santa Clara, CA, USA)
2. Zeiss Invertoskop microscope (Carl Zeiss, catalog number: 3826000125)
3. Water bath (Thermo Fisher Scientific, model: TSGP10)
4. Incubator without CO2 (Benchmark Scientific, model: H2200-GROUP)
5. Centrifuge (Thermo Fisher, catalog number: 75004538)
6. Micropipettes: 10, 20, 200, and 1,000 μL (Denville Scientific, catalog numbers: P3950-10A, P3950-20A, P3950-200A, and P3950-1000A)
7. Hemocytometer (Nikon, model: TMS No. 215441)
Software and datasets
1. Wave Controller Software (Agilent Technologies, version 2.6.3)
Procedure
A. Day 1
1. Aliquot at least 20 mL of XF calibrant into a 50 mL conical tube.
2. Place the aliquot in a non-CO2 37 °C incubator overnight.
3. Open the Seahorse XFe96 FluxPak and remove the contents.
4. Place the sensor cartridge upside down next to the utility plate.
5. Fill each well of the utility plate with 200 μL of sterile, tissue culture–grade water.
6. Lower the sensor cartridge onto the utility plate, submerging the sensors in the water.
7. Verify if the water level is high enough to keep the sensors submerged.
8. Place in a non-CO2 37 °C incubator overnight. To prevent evaporation of the water, completely wrap the cartridge with a cling wrap (wrap the entire cartridge with all the pieces in it) and verify that the incubator is properly humidified.
B. Day 2
1. Place PDL and other frozen consumables (RPMI culture medium, assay medium, and glutamine) in a non-CO2 37 °C water bath for thawing.
2. Prepare the sensor cartridge for calibration.
a. Remove the conical tube of the calibrant and the assembled sensor cartridge with the utility plate from the incubator.
b. Place the sensor cartridge upside down next to the utility plate.
c. Remove and discard the water from the utility plate.
d. Fill each well of the utility plate with 200 μL of prewarmed XF calibrant.
e. Lower the sensor cartridge onto the utility plate, submerging the sensors in calibrant.
f. Place the assembled sensor cartridge with the utility plate in a non-CO2 37 °C incubator for 45–60 min prior to loading the injection ports of the sensor cartridge.
3. Coat the XF cell culture microplate with PDL and PLL.
a. Add 30 μL of PDL working solution (50 μg/mL) into each well and incubate the plate for 1 h at room temperature.
b. Add 50 μL of PLL from the original bottle (1.0 mg/mL) and incubate the plate for 1 h at room temperature.
c. Discard the supernatant (make sure not to disturb the bottom of the well).
d. Wash each well with 300 μL of distilled water and let the plate air-dry under sterile conditions (approximately 30 min).
Note: In the steps that follow, critical steps associated with cell viability are marked as “Critical step.” Choosing appropriate cell seeding density, the timing prior to assay setup, the pre-assay media change and incubation conditions, temperature, and CO2 equilibration period before sensor cartridge calibration are critical in maintaining cell viability.
4. Transfer isolated PBMCs to 10 mL of prewarmed (37 °C) culture medium (RPMI with 10% FBS, 100 U/mL penicillin, and 100 μg/mL streptomycin). Critical step.
5. Centrifuge PBMCs at 200× g for 5 min and remove the supernatant. Critical step.
6. Resuspend the cells in fresh culture medium (~1 mL). Critical step.
7. Count the freshly isolated PBMCs in a hemocytometer using trypan blue.
8. Based on the cell count, adjust the volume of cells to obtain the needed working cell densities. Critical step.
9. Resuspend cells in warmed assay medium (Seahorse XF RPMI assay medium) to the desired concentration of cells per well in 50 μL of assay medium (e.g., for 1.5 × 10⁵ cells per well, resuspend cells in a volume that results in 1.5 × 10⁵ cells/50 μL or 3.0 × 10⁶ cells/mL). Critical step.
10. Seed the cells in the coated microplate.
a. Transfer the cell suspension to a sterile tissue culture reservoir or pipette from the conical tube.
b. Pipette 50 μL of the cell suspension along the side of each well, except for background/control wells.
c. Centrifuge the cells at 200× g (zero braking) for 1 min. Ensure that the centrifuge is properly balanced.
d. Transfer plates to a 37 °C, non-CO2 incubator for 25–30 min to ensure the cells have completely attached. Critical step.
e. Visually confirm cell adhesion to the culture surface.
Critical step: This step should be performed quickly to minimize the time cells are out of optimal conditions. Prolonged exposure outside the incubator can compromise cell viability.
f. Start sensor cartridge calibration at this point.
g. Slowly and gently, add 130 μL of warm assay medium along the side of each well, avoiding disturbing the cells.
h. Observe the cells under the microscope to check for any cell detachment.
i. Return the cell plates to the 37 °C, non-CO2 incubator for 15–25 min. Critical step.
11. Prepare Seahorse XF Cell Mito Stress Test kit compound stock solutions and working solutions according to the manufacturer’s instructions.
Caution: Oligomycin and FCCP are toxic compounds. Use gloves, lab coat, and eye protection when handling them. Perform all steps involving these reagents in a chemical fume hood.
12. Add 20 μL of 15 μM oligomycin working solution to port A to get the final concentration of 1.5 μM.
13. Add 22 μL of 10 μM FCCP working solution to port B to get the final concentration of 1.0 μM.
14. Add 25 μL of 5 μM rotenone/antimycin A working solution to port C to get the final concentration of 0.5 μM (Figure 1).
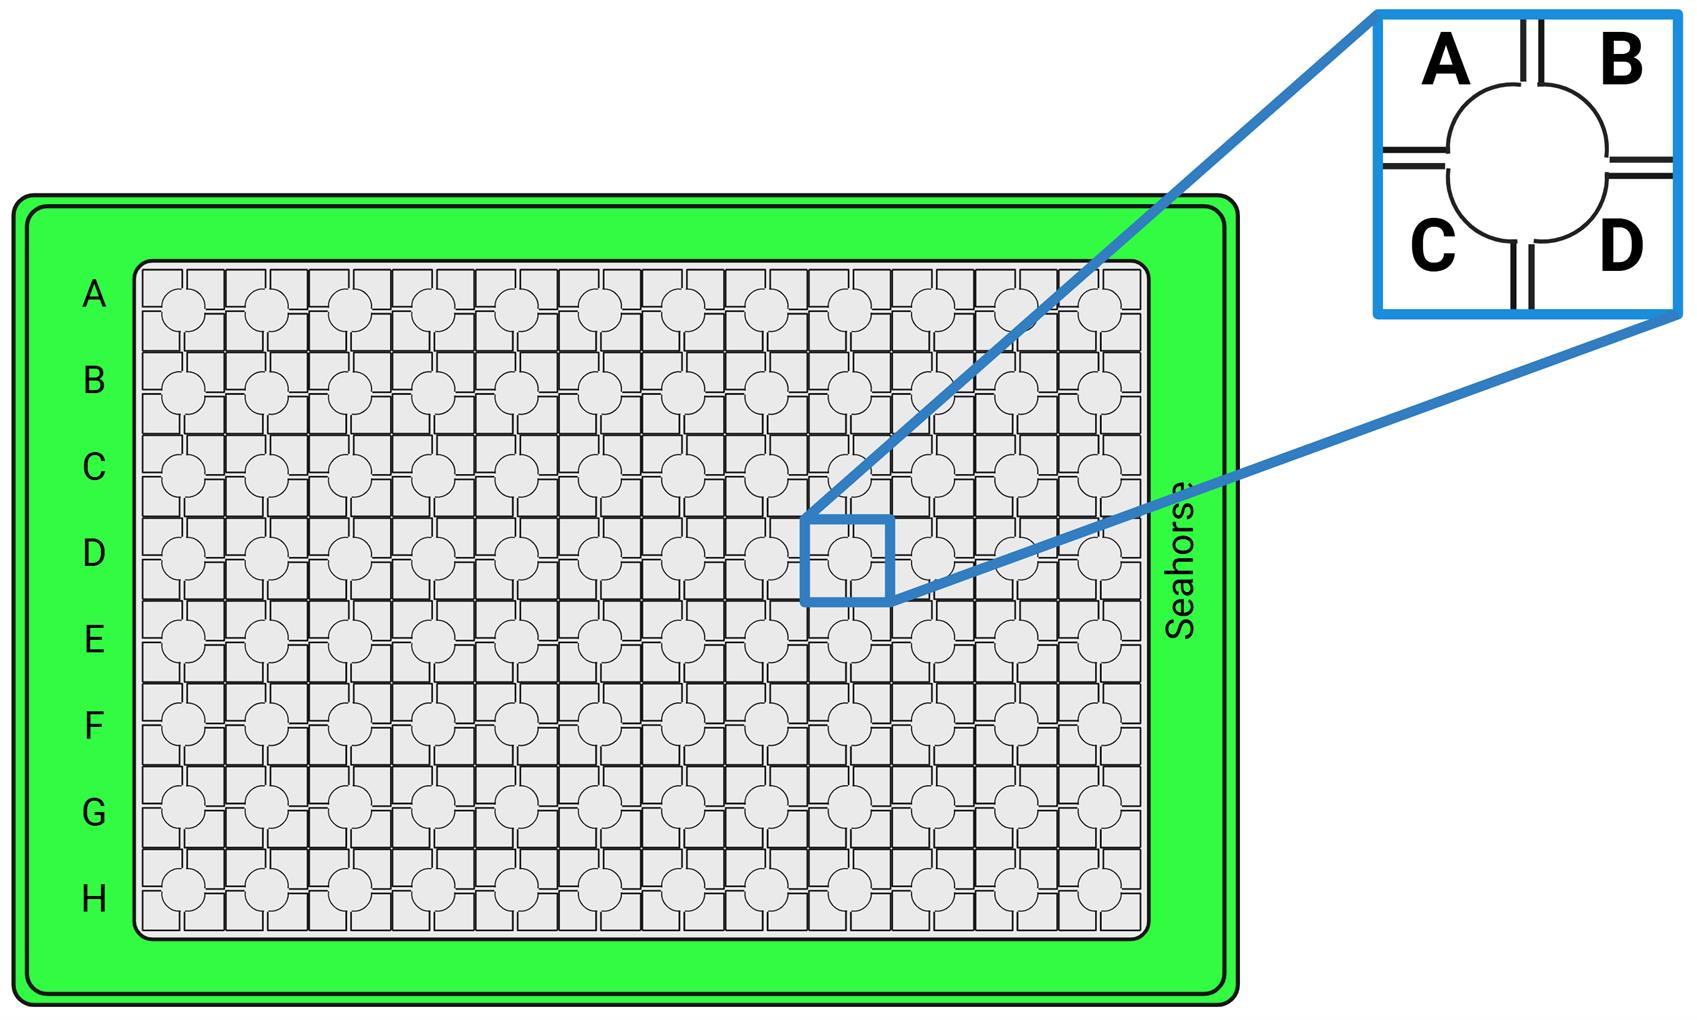
Figure 1. Sensor cartridge with the depiction of the four main ports: ports A, B, C, and D
Note: In this protocol, only three of the four ports were used for the three modulators (oligomycin, FCCP, rotenone/antimycin A). However, in a custom assay, users can add their own compounds, tailored to their experimental goals. In that case, the Mito Stress assay modulators will be added to ports B, C, and D.
15. Run the cartridge for calibration in the Seahorse Analyzer.
16. Once calibration is completed, insert the cell-coated microplate into the Seahorse Analyzer.
17. Run the following program in the Seahorse XF96 Analyzer:
a. Equilibration: 30 min
b. Measurement period 1:
i. Mixing: 2 min
ii. Waiting: 1 min
iii. Measuring: 3 min
(Repeat 3 times)
c. Injection of port A (20 μL of 15 μM oligomycin; final concentration: 1.5 μM)
d. Measurement period 2:
i. Mixing: 2 min
ii. Waiting: 1 min
iii. Measuring: 3 min
(Repeat 3 times)
e. Injection of port B (22 μL of 10 μM FCCP; final concentration: 1 μM)
f. Measurement period 3:
i. Mixing: 2 min
ii. Waiting: 1 min
iii. Measuring: 3 min
(Repeat 3 times)
g. Injection of port C (25 μL of 5 μM rotenone/antimycin A; final concentration: 0.5 μM)
h. Measurement period 4:
i. Mixing: 2 min
ii. Waiting: 1 min
iii. Measuring: 3 min
(Repeat 3 times)
Data analysis
After the run is complete, the following panel (Figure 2) from Wave Controller Software can be used to retrieve data, modify functions, and normalize the data.
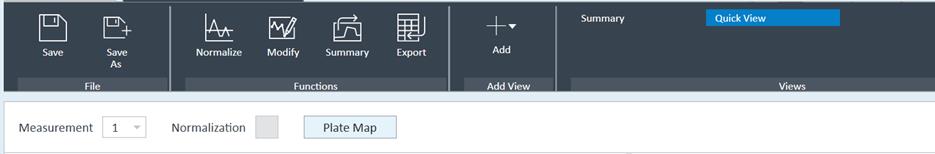
Figure 2. Wave software panel
Normalization
Normalization is required if each replicate and/or test groups have different cell numbers.
Visualization and exporting results
Wave Desktop and Controller 2.6 Software can be downloaded onto any personal computer at no cost.
After completing the assay, oxygen consumption rate (OCR) plots can be visualized in Wave software as in Figure 3.
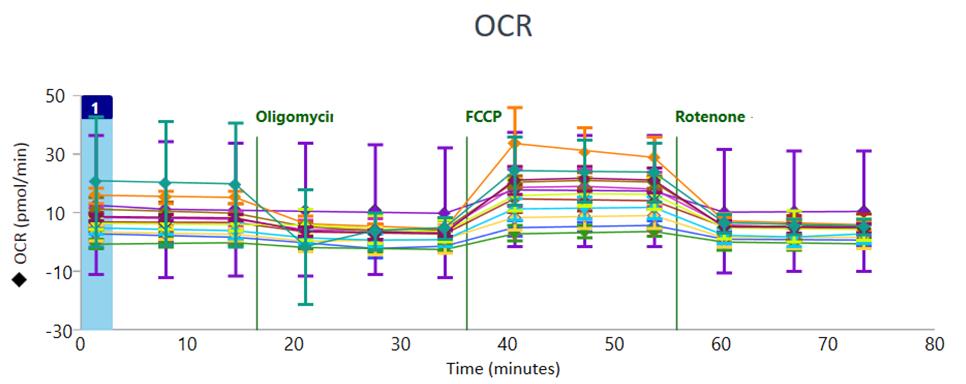
Figure 3. Oxygen consumption rate (OCR) profiles shown in Wave software, after completing the assay. The error bars indicate the Standard Deviation as it is selected as the default Error Bar type in Wave.
Further statistical analysis can be conducted by exporting the assay data by choosing Export from the Wave software panel (Figure 4). Several export options are available. The data can also be directly exported to GraphPad Prism.
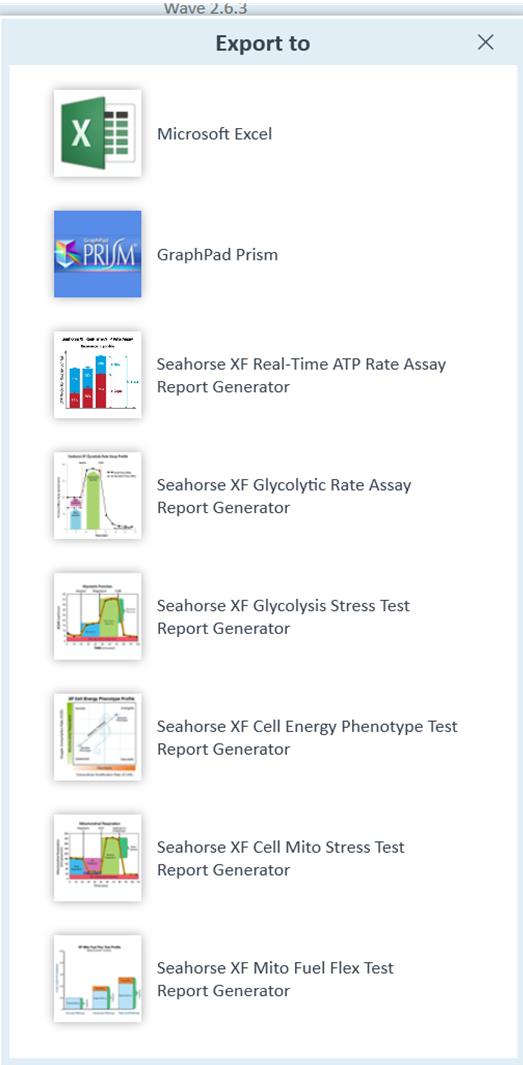
Figure 4. Wave 2.6.3 export options
Expected outcome
Once the results are exported to the Seahorse XF Cell Mito Stress Test Report Generator, it will provide both OCR and ECAR values for individual wells. OCR and ECAR plots will also be generated for individual treatment groups. Seahorse XF Cell Mito Stress Test Report Generator can be directly imported into GraphPad Prism. Figures 5–7 show examples of data available in the Seahorse XF Cell Mito Stress Test Report Generator.
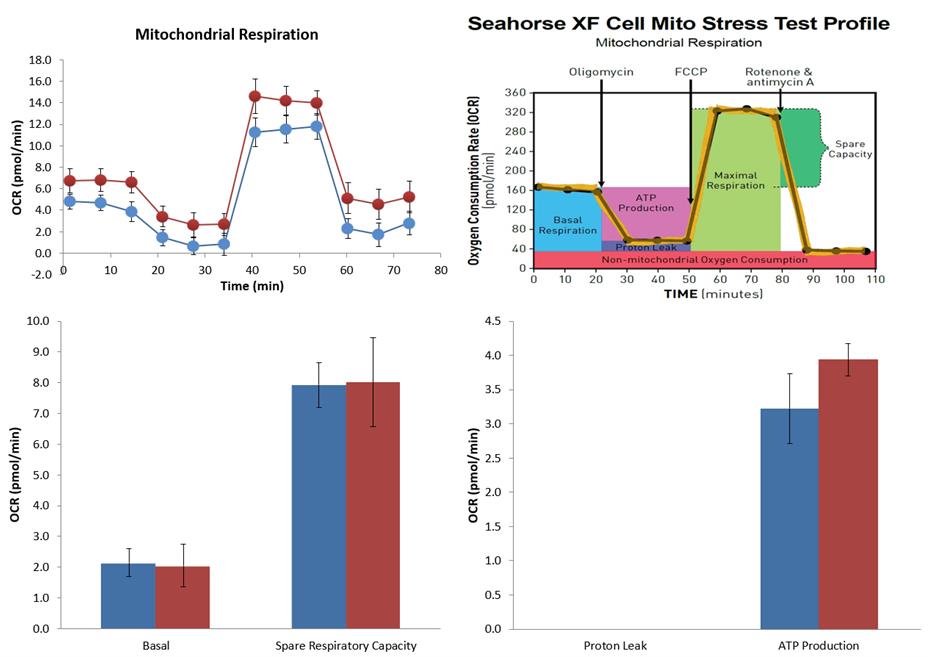
Figure 5. Summary report from Seahorse XF Cell Mito Stress Test Report Generator. Seahorse XF Cell Mito Stress Test profile indicates how an optimal oxygen consumption rate (OCR) profile should look. The top left OCR plots and bar graphs indicate your own assay outcome. The error bars indicate the Standard Error of the Mean (SEM).
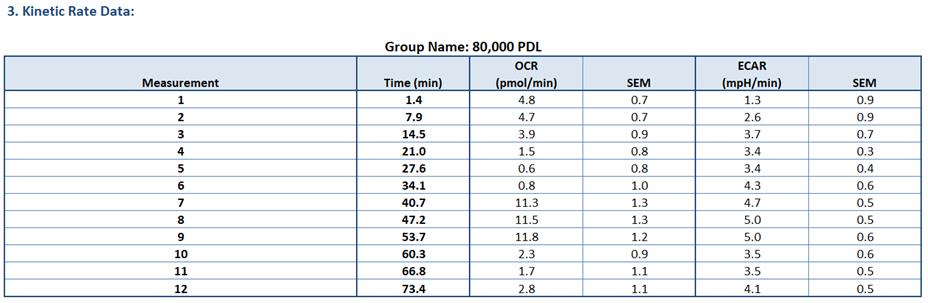
Figure 6. Example of kinetic rate data [oxygen consumption rate (OCR) and extracellular acidification rate (ECAR) values] for each measurement point for the selected experimental group from Seahorse XF Cell Mito Stress Test Report Generator
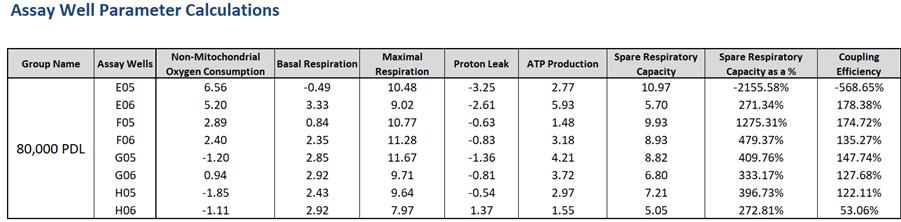
Figure 7. Example of the calculated assay parameters shown in the Seahorse XF Cell Mito Stress Test Report Generator
Statistical analysis
1. Statistical analysis can be conducted using GraphPad Prism software.
2. The results can either be directly exported to GraphPad Prism or saved in an Excel file and later imported to GraphPad Prism.
3. Multiple data analysis and data visualization options are available in GraphPad Prism.
4. An unpaired two-tailed Student’s t-test is a suitable analysis option when comparing two independent groups of data to determine if there is a statistically significant difference in their means.
Validation of protocol
PLL vs. PDL
1. Six cell densities (40,000, 60,000, 80,000, 100,000, 120,000, and 140,000 cells/well) were initially chosen to perform the Mito Stress assay.
2. Cells were seeded with 6–8 replicates for each cell density in both PDL and PLL-treated wells (minimum of 6 replicates per cell density per coating agent) (Figure 8).
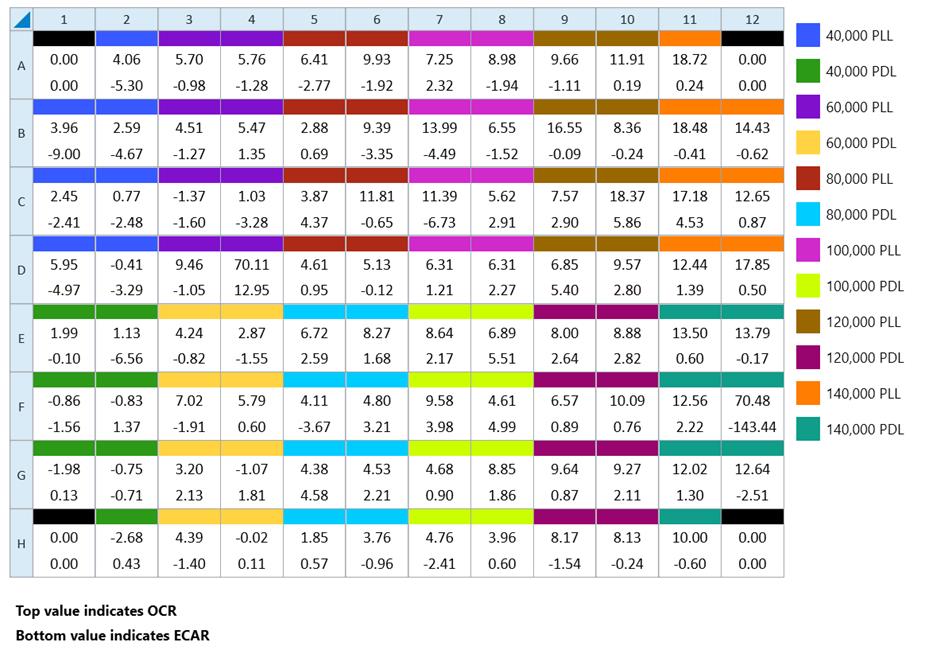
Figure 8. Plate map in Wave software
3. The experiment was repeated with three of the cell densities selected from the first experiment (40,000, 60,000, and 80,000 cells/well).
4. Data generated from Wave was exported to GraphPad Prism software (V.10.0.1).
5. Unpaired two-tailed Student’s t-test was performed to compare PDL and PLL OCR values.
Results
The unpaired two-tailed Student’s t-test showed p-values > 0.05 for all cell densities, indicating that PDL and PLL were not significantly different as coating agents for PBMCs (Table 1). The cell density of 60,000 cells/well in experiment 1 showed a lower p-value; we assume that this is due to a discrepancy in cell seeding between PLL and PDL groups. However, the repeated experiment shows a higher p-value for the same cell density category. Figure 9 shows the OCR plots for PBMC cell density of 80,000 cells/well with PLL and PDL in the repeated experiment.
Table 1. P-values from unpaired two-tailed Student’s t-test for different cell densities
| Experiment | 40,000 cells/well | 60,000 cells/well | 80,000 cells/well | 100,000 cells/well | 120,000 cells/well | 140,000 cells/well |
|---|---|---|---|---|---|---|
| 1 | 0.1589 | <0.0001 | 0.1925 | 0.7226 | 0.8161 | 0.7267 |
| 2 | 0.0829 | 0.7205 | 0.9714 | N/A | N/A | N/A |
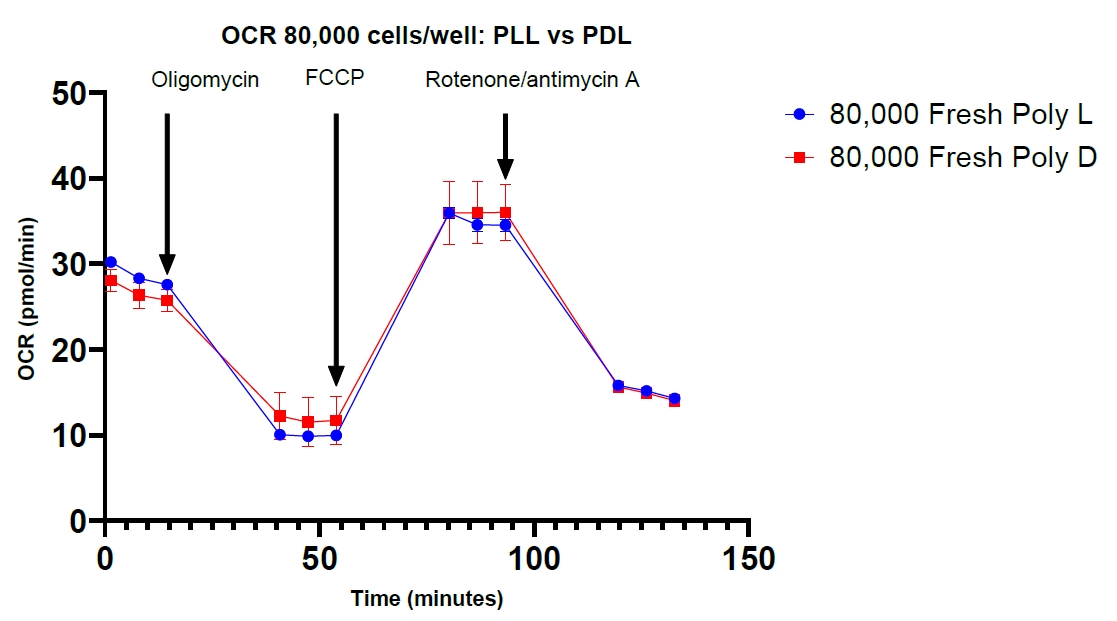
Figure 9. Mitochondrial respiration. Seahorse XF Cell Mito Stress Test profile for oxygen consumption rate (OCR) values of fresh peripheral blood mononuclear cells (PBMCs) at a cell density of 80,000 cells/well with poly-L-lysine and Poly-D-lysine adhesive compounds. Error bars represent mean ± SEM.
Conclusion
The unpaired t-test indicates that there are no significant statistical differences between PLL and PDL as the coating agent for PBMCs in Seahorse XF Cell Mito Stress analysis.
General notes and troubleshooting
Troubleshooting
| Problem | Possible cause | Solution |
|---|---|---|
Low signal in OCR measurement | • Cells are not adherent or unhealthy • Insufficient cell number | • Check cell health before seeding; ensure even seeding and proper incubation conditions • Optimize cell seeding density to ensure ~80% confluence |
| High variability between wells | • Uneven compound mixing • May be overconfluent or contaminated | • Mix compounds thoroughly; avoid introducing bubbles when injecting into the plate • Verify if cells are in a monolayer and have proper cell morphology. |
| Cell detachment after drug injection | • FCCP concentration is too high • Inadequate coating of adhesive | • Titrate FCCP concentration for your cell type before running the full assay • Gently wash/exchange media and let cells adhere fully before assay |
Acknowledgments
Conceptualization, N.P.; Investigation, K.H., M.R., R.B., A.W.; Writing—Original Draft, K.S.; Writing—Review & Editing, K.H., M.R., R.B., A.W., N.P., S.Y.; Funding acquisition, N.P.; Supervision, N.P., and S.Y.
This project was supported by the Texas Alzheimer’s Research and Care Consortium under the direction of the Texas Council on AD and Related Disorders, Neurobiology of Aging and Alzheimer's Disease Training Grant (NIH–T32 AG 020494), and The Health & Aging Brain Study- Health Disparities (U19AG078109).
Competing interests
The authors declare that they have no competing interests.
Ethical considerations
Human participants were not recruited, nor were human participants’ data collected in this protocol.
References
- Scholler-Mann, A., Matt, K., Hochecker, B. and Bergemann, J. (2021). Ex vivo Assessment of Mitochondrial Function in Human Peripheral Blood Mononuclear Cells Using XF Analyzer. Bio Protoc. 11(7): e3980. https://doi.org/10.21769/BioProtoc.3980
- Werner, B. A., McCarty, P. J., Lane, A. L., Singh, I., Karim, M. A., Rose, S. and Frye, R. E. (2022). Time dependent changes in the bioenergetics of peripheral blood mononuclear cells: processing time, collection tubes and cryopreservation effects. Am J Transl Res. 14(3): 1628–1639. https://pubmed.ncbi.nlm.nih.gov/35422946/
- Guo, C., Sun, L., Chen, X. and Zhang, D. (2013). Oxidative stress, mitochondrial damage and neurodegenerative diseases. Neural Regen Res. 8(21): 2003–2014. https://doi.org/10.3969/j.issn.1673-5374.2013.21.009
- Wang, L., Chaudhari, K., Winters, A., Sun, Y., Liu, R. and Yang, S. H. (2022). Characterizing region-specific glucose metabolic profile of the rodent brain using Seahorse XFe96 analyzer. J Cereb Blood Flow Metab. 42(7): 1259–1271. https://doi.org/10.1177/0271678X221077341
- Acin-Perez, R., Beninca, C., Shabane, B., Shirihai, O. S. and Stiles, L. (2021). Utilization of Human Samples for Assessment of Mitochondrial Bioenergetics: Gold Standards, Limitations, and Future Perspectives. Life (Basel). 11(9). https://doi.org/10.3390/life11090949
- Stork, B. A., Dean, A. and York, B. (2022). Methodology for measuring oxidative capacity of isolated peroxisomes in the Seahorse assay. J Biol Methods 9(2): e160. https://doi.org/10.14440/jbm.2022.374
- Roy Choudhury, G., Winters, A., Rich, R. M., Ryou, M.-G., Gryczynski, Z., Yuan, F., Yang, S.-H. and Liu, R. (2015). Methylene Blue Protects Astrocytes against Glucose Oxygen Deprivation by Improving Cellular Respiration. PLoS One. 10(4): e0123096. https://doi.org/10.1371/journal.pone.0123096
- Sun, Y., Winters, A., Wang, L., Chaudhari, K., Berry, R., Tang, C., Liu, R. and Yang, S. (2023). Metabolic Heterogeneity of Cerebral Cortical and Cerebellar Astrocytes. Life (Basel). 13(1). https://doi.org/10.3390/life13010184
- Jones, N., Piasecka, J., Bryant, A. H., Jones, R. H., Skibinski, D. O., Francis, N. J. and Thornton, C. A. (2015). Bioenergetic analysis of human peripheral blood mononuclear cells. Clin Exp Immunol. 182(1): 69–80. https://doi.org/10.1111/cei.12662
- Verhoeckx, K., Cotter, P., Lopez-Exposito, I., Kleiveland, C., Lea, T., Mackie, A., Requena, T., Swiatecka, D. and Wichers, H. (2015). In: The Impact of Food Bioactives on Health: in vitro and ex vivo models. Cham (CH): Springer.
- Liu, J., Gao, H., Li, C., Zhu, F., Wang, M., Xu, Y. and Wu, B. (2022). Expression and regulatory characteristics of peripheral blood immune cells in primary Sjogren's syndrome patients using single-cell transcriptomic. iScience. 25(12): 105509. https://doi.org/10.1016/j.isci.2022.105509
- Altintas, M. M., DiBartolo, S., Tadros, L., Samelko, B. and Wasse, H. (2021). Metabolic Changes in Peripheral Blood Mononuclear Cells Isolated From Patients With End Stage Renal Disease. Front Endocrinol (Lausanne) 12: 629239. https://doi.org/10.3389/fendo.2021.629239
- Tessema, B., Riemer, J., Sack, U. and Konig, B. (2022). Cellular Stress Assay in Peripheral Blood Mononuclear Cells: Factors Influencing Its Results. Int J Mol Sci. 23(21): 13118. https://doi.org/10.3390/ijms232113118
- Fernandez Zapata, C., Giacomello, G., Spruth, E. J., Middeldorp, J., Gallaccio, G., Dehlinger, A., Dames, C., Leman, J. K. H., van Dijk, R. E., Meisel, A., et al. (2022). Differential compartmentalization of myeloid cell phenotypes and responses towards the CNS in Alzheimer's disease. Nat Commun. 13(1): 7210. https://doi.org/10.1038/s41467-022-34719-2
- Lu, H., Guo, L., Kawazoe, N., Tateishi, T. and Chen, G. (2009). Effects of poly(L-lysine), poly(acrylic acid) and poly(ethylene glycol) on the adhesion, proliferation and chondrogenic differentiation of human mesenchymal stem cells. J Biomater Sci Polym Ed. 20(5–6): 577-589. https://doi.org/10.1163/156856209X426402
- Yu, C., Zhao, W., Duan, C., Xie, J. and Yin, W. (2022). Poly-l-lysine-caused cell adhesion induces pyroptosis in THP-1 monocytes. Open Life Sciences. 17(1): 279–283. https://doi.org/10.1515/biol-2022-0028
- Chen, S., Huang, S., Li, Y. and Zhou, C. (2021). Recent Advances in Epsilon-Poly-L-Lysine and L-Lysine-Based Dendrimer Synthesis, Modification, and Biomedical Applications. Front Chem. 9. https://doi.org/10.3389/fchem.2021.659304
- Jády, A. G., Nagy, Á. M., Kőhidi, T., Ferenczi, S., Tretter, L. and Madarász, E. (2016). Differentiation-Dependent Energy Production and Metabolite Utilization: A Comparative Study on Neural Stem Cells, Neurons, and Astrocytes. Stem Cells Dev. 25(13): 995–1005. https://doi.org/10.1089/scd.2015.0388
Article Information
Publication history
Received: Feb 26, 2025
Accepted: Apr 28, 2025
Available online: May 20, 2025
Published: Jun 5, 2025
Copyright
© 2025 The Author(s); This is an open access article under the CC BY-NC license (https://creativecommons.org/licenses/by-nc/4.0/).
How to cite
Subasinghe, K., Berry III, R., Rowe, M., Winters, A., Yang, S. and Phillips, N. (2025). Mito Stress Assay of PBMCs With Seahorse XFe96 Flux Analyzer and Comparison of Poly-D-Lysine and Poly-L-Lysine for Cell Affinity. Bio-protocol 15(11): e5327. DOI: 10.21769/BioProtoc.5327.
Category
Cell Biology > Cell metabolism > Respirometry
Cell Biology > Cell-based analysis
Do you have any questions about this protocol?
Post your question to gather feedback from the community. We will also invite the authors of this article to respond.