- Submit a Protocol
- Receive Our Alerts
- Log in
- /
- Sign up
- My Bio Page
- Edit My Profile
- Change Password
- Log Out
- EN
- EN - English
- CN - 中文
- Protocols
- Articles and Issues
- For Authors
- About
- Become a Reviewer
- EN - English
- CN - 中文
- Home
- Protocols
- Articles and Issues
- For Authors
- About
- Become a Reviewer
Stable 13C-glutamine Tracing Resolved Metabolomics for Cancer Metabolism Study
(*contributed equally to this work) Published: Vol 15, Iss 10, May 20, 2025 DOI: 10.21769/BioProtoc.5322 Views: 3195
Reviewed by: Elena A. OstrakhovitchTing MiaoAnonymous reviewer(s)

Protocol Collections
Comprehensive collections of detailed, peer-reviewed protocols focusing on specific topics
Related protocols
Analysis of Leukemia Cell Metabolism through Stable Isotope Tracing in Mice
Nick van Gastel [...] David T. Scadden
Oct 5, 2021 5226 Views
ATAC Sequencing Protocol For Cryopreserved Mammalian Cells
Juan Manuel Caravaca [...] Bao Tran
Jan 20, 2022 5216 Views
A Protocol for Laser-Assisted Microdissection and tRF & tiRNA Sequencing in Lung Adenocarcinoma
Zi Wang [...] Feng Jiang
Apr 5, 2025 2992 Views
Abstract
Stable isotopes have frequently been used to study metabolic processes in live cells both in vitro and in vivo. Glutamine, the most abundant amino acid in human blood, plays multiple roles in cellular metabolism by contributing to the production of nucleotides, lipids, glutathione, and other amino acids. It also supports energy production via anaplerosis of tricarboxylic acid cycle intermediates. While 13C-glutamine has been extensively employed to study glutamine metabolism in various cell types, detailed analyses of specific lipids derived from 13C-glutamine via the reductive carboxylation pathway are limited. In this protocol, we present a detailed procedure to investigate glutamine metabolism in human glioblastoma (GBM) cells by conducting 13C-glutamine tracing coupled with untargeted metabolomics analysis using liquid chromatography–mass spectrometry (LC–MS/MS). The method includes step-by-step instructions for the extraction and detection of polar metabolites and long-chain fatty acids (LCFAs) derived from 13C-glutamine in GBM cells. Notably, this approach enables the distinction between isomers of two monounsaturated FAs with identical masses: palmitoleic acid (16:1n-7) (cis-9-hexadecenoic acid) and palmitelaidic acid (16:1n-7) (trans-9-hexadecenoic acid) derived from 13C-glutamine through the reductive carboxylation process. In addition, using this protocol, we also unveil previously unknown metabolic alterations in GBM cells following lysosome inhibition by the antipsychotic drug pimozide.
Key features
• Methods for analyzing the flux of the stable isotope 13C-glutamine in cancer cells and identifying its derived polar metabolites and long-chain fatty acids (LCFAs).
• Distinguishes isomers of long-chain fatty acids, such as palmitoleic acid (16:1n-7) (cis-9-Hexadecenoic acid) and palmitelaidic acid (16:1n-7) (trans-9-Hexadecenoic acid), which share the exact same mass.
• The method is utilized to investigate glutamine metabolism reprogramming in cancer cells following lysosome inhibition.
Keywords: 13C-glutamineGraphical overview
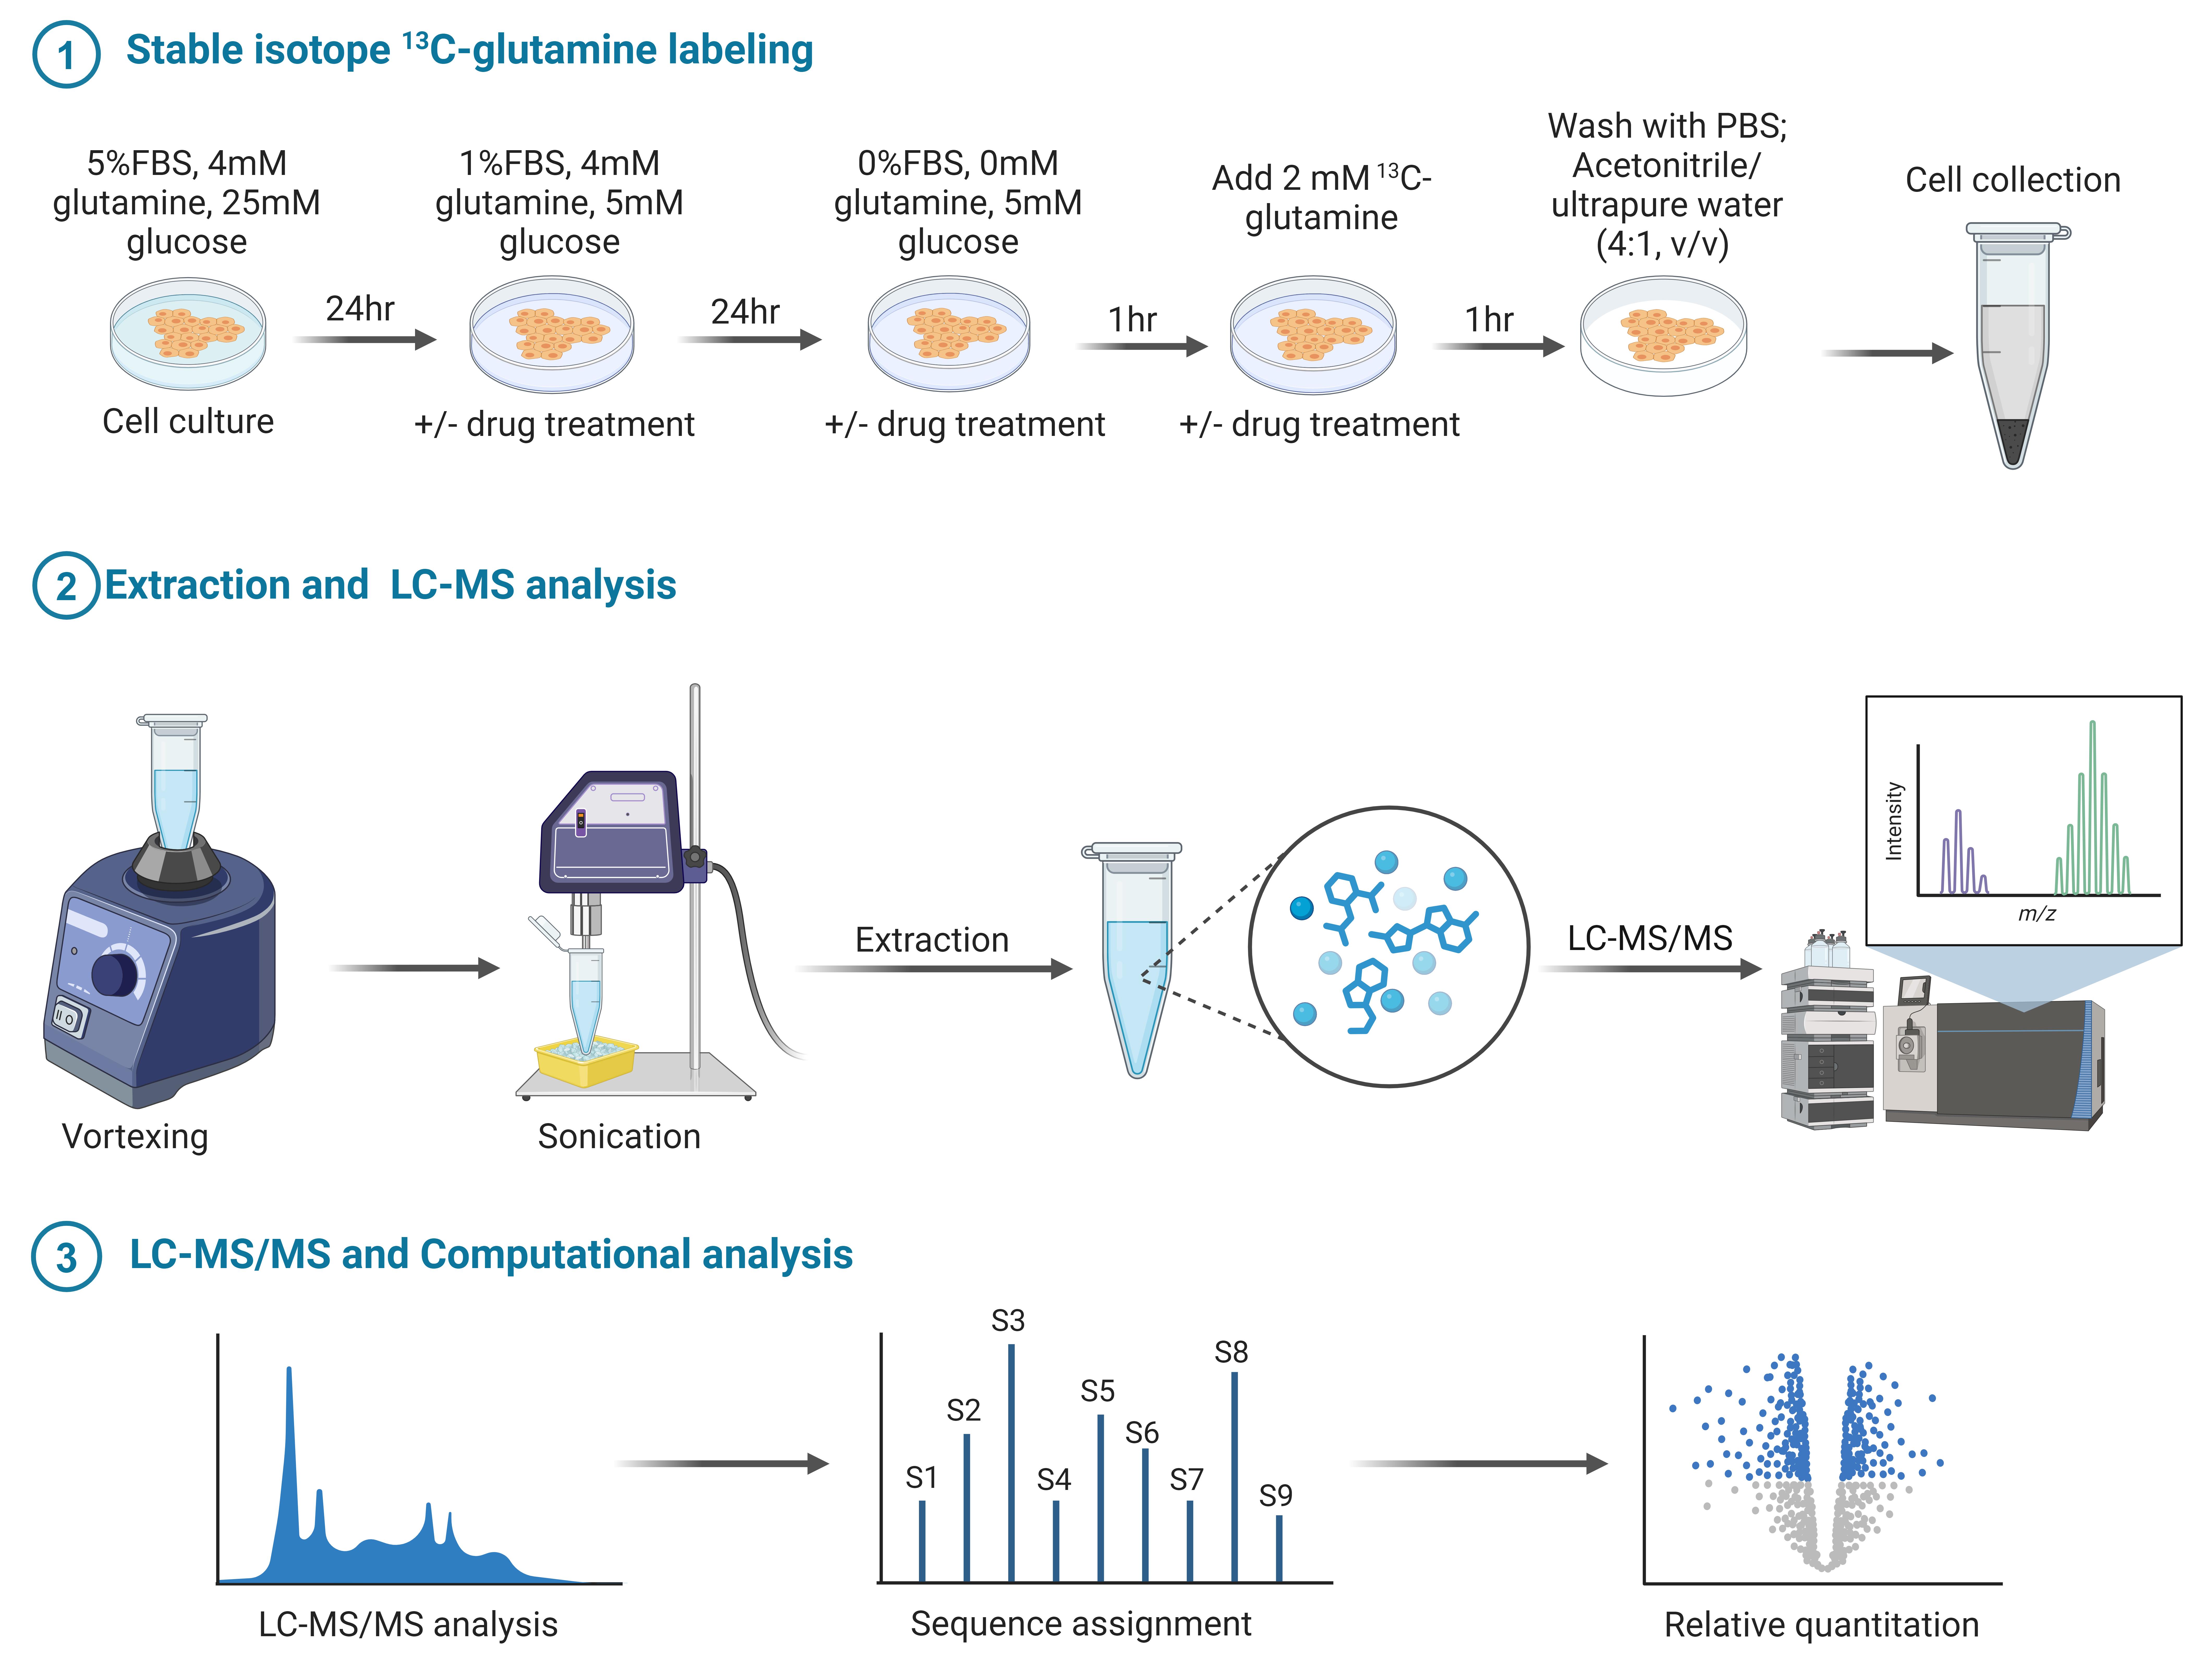
Metabolomic profiling of stable isotope 13C-glutamine labeling: Sample preparation and detection for polar metabolite and long-chain fatty acid (LCFA). Created with BioRender.com.
Background
Metabolism in live cells and tissues is a highly dynamic process, constantly changing in response to varying environmental conditions [1]. Conventional metabolomics studies, which measure metabolite levels at specific time points under defined conditions, fail to capture the dynamic nature of metabolic profiles, such as the active glucose and glutamine metabolism in different cell types [2–4]. In contrast, stable isotope 13C-labeling coupled with untargeted metabolomics analysis is a powerful tool for unveiling the comprehensive metabolic pathways originating from individual nutrients. For instance, 13C-glucose and 13C-glutamine are commonly used to study cellular metabolism both in vitro and in vivo. This approach has significantly advanced our understanding of metabolic processes in both physiological and pathological conditions [5–7]. However, most studies focus on water-soluble small molecular metabolites. The complexity of lipid structures has posed significant challenges for studying lipids derived from 13C-glucose or 13C-glutamine. There have been relatively few studies tracing long-chain fatty acids (LCFAs), such as palmitate (C:16), monounsaturated fatty acids including palmitoleic acid (16:1n-7) (cis-9-hexadecenoic acid), palmitelaidic acid (16:1n-7) (trans-9-hexadecenoic acid), and oleic acid (C:18:1), and polyunsaturated fatty acids like pinolenic acid (18:3) derived from 13C-glucose and 13C-glutamine, particularly in cancer cells. To bridge this research gap, we have developed a robust method to analyze the metabolic flux of 13C-glutamine into LCFAs in human glioblastoma (GBM) cells, the most lethal primary brain tumor cells [8].
Metabolic reprogramming is a hallmark of aggressive cancers, including GBM [9–13]. Recent studies have demonstrated that both glutamine metabolism and de novo lipid synthesis are highly upregulated in various cancers [9]. However, the underlying connection between these two crucial metabolic pathways remains poorly understood. Our recent studies, published in Nature Metabolism (2022) [9] and Cell Reports Medicine (2024) [8], revealed that glutamine, through its released ammonia, directly activates lipid synthesis to promote GBM growth. Furthermore, we successfully developed a protocol to examine the flux of glutamine conversion into LCFAs [8]. Using 13C-glutamine tracing studies, we uncovered metabolic responses of GBM cells to lysosome inhibition [8]. Specifically, we identified that the antipsychotic drug pimozide enters lysosomes and inhibits their function, revealing new therapeutic possibilities [8]. This method is not limited to GBM cells; it can be applied to various other cell types to investigate glutamine metabolism, particularly for determining the extent of LCFA synthesis derived from glutamine. These findings provide a valuable platform for understanding and targeting metabolic pathways in cancer.
Materials and reagents
Biological materials
1. Human GBM cell line U251 (Sigma-Aldrich, catalog number: 09063001) [8,11,12]
Reagents
1. Dulbecco’s modified Eagle’s medium (DMEM), no glutamine (Corning, catalog number: 15-0312CV) (for regular cell culture)
2. Dulbecco’s modified Eagle’s medium (DMEM), no glucose, no glutamine, no phenol red (Gibco, catalog number: A14430-01) (used during drug treatment)
3. L-glutamine (12C-Glutamine) (Gibco, catalog number: A2916801); prepare at 200 mM, aliquot, and store at -80°C until use
4. 13C-glutamine (Sigma, catalog number: 184161-19-1); dissolve in PBS to a final concentration of 200 mM, aliquot, and store at -80°C until use
5. Glucose (Sigma, catalog number: G8644)
6. Sodium pyruvate (Gibco, catalog number: 11360070)
7. Fetal bovine serum (FBS) (Cytiva, catalog number: SH30071.03)
8. Cell culture phosphate buffered saline (PBS) (Corning, catalog number: 21-040); store in a 4 °C refrigerator overnight before use
9. Dimethyl sulfoxide (DMSO) (Sigma, catalog number: D2650)
10. Trypan blue (Sigma, catalog number: T8154) (for cell counting)
11. HyCloneTM HyPure water, molecular biology grade (Cytiva, catalog number: SH30538.02); store in a 4 °C refrigerator overnight before use
12. Acetonitrile (CH3CN or ACN) (Fisher Chemical, catalog number: A955); place a bottle of 100% CH3CN (HPLC grade) in a -20 °C freezer overnight prior to use
13. Chloroform (CHCl3) (Sigma, catalog number: C2432)
14. Methanol (Fisher Chemical, catalog number: A412)
15. Ethanol (Sigma, catalog number: E7023)
16. Acetic acid (Sigma, catalog number: 695092)
17. Pimozide (Sigma, catalog number: P1793); dissolve in DMSO to a final concentration of 10 mM, aliquot, and store at -80°C until use
18. Deionized water (diH2O) (VION Biosciences, catalog number: DH2O-10).
Laboratory supplies
1. Cell culture dish, 100 mm (Alkali Scientific, catalog number: TDN0101)
2. Cell culture dish, 150 mm (Alkali Scientific, catalog number: TDN0150)
3. 1,250 μL pipette tips (Alkali Scientific, catalog number: RT1250)
4. 200 μL pipette tips (Alkali Scientific, catalog number: RT1200)
5. 10 μL pipette tips (Alkali Scientific, catalog number: RT1010)
6. 1.5 mL Eppendorf tubes (Alkali Scientific, catalog number: C3016-S)
7. Cell scraper (Fisher brand, catalog number: 08100242)
8. 15 mL screw-cap conical tube (Alkali Scientific, catalog number: CN5600)
9. Liquid nitrogen
10. Tube rack
11. Ice
12. Ice box
13. SureSTART LC autosampler vial (Thermo Fisher, catalog number: 03-452-235)
14. OASIS HLB cartridge (Waters Corp., catalog number: WAT094225)
15. Leap PAL brand cap (Fisher Scientific, catalog number: 50-125-0992)
Equipment
1. CellDrop FL cell counter (DeNovix, USA)
2. Cell culture incubator (VWR International, USA)
3. Inverted microscope (Fisher Scientific, USA)
4. P1000 pipette (Gilson Incorporated, USA)
5. P200 pipette (Gilson Incorporated, USA)
6. P10 pipette (Gilson Incorporated, USA)
7. P2 pipette (Gilson Incorporated, USA)
8. Vortex (Fisher Scientific, USA)
9. Sonic Dismembrator (Fisher Scientific, USA)
10. Thermo Q Exactive HF Hybrid Quadrupole-Orbitrap Mass Spectrometer (Thermo Fisher Scientific, Waltham, MA, USA)
11. Thermo DIONEX UltiMate 3000 UHPLC system (Thermo Fisher Scientific, Waltham, MA, USA)
12. Centrifuge 5804 R (Eppendorf, Enfield, CT, USA)
13. Microfuge 22R centrifuge (Beckman Coulter, Brea, CA, USA)
14. FreeZone 2.5 plus (LABCONCO, Kansas, MO, USA)
Software and datasets
1. XCMS software (https://xcmsonline.scripps.edu/landing_page.php?pgcontent=mainPage) for LC–MS data deconvolution
2. MetSign software for metabolite cross-sample peak list alignment and normalization
3. Compound Discoverer software (v 2.0, Thermo Fisher Scientific, Germany) for metabolite identification from both the in-house database and public database
4. BioRender.com was used for the graphical overview
5. National Metabolomics Data Repository (NMDR), the Metabolomics Workbench (https://www.metabolomicsworkbench.org/) (access date, 12-12-2024)
6. All data and code have been deposited to NMDR: https://www.metabolomicsworkbench.org/ (access date, 12-12-2024)
Procedure
A. Cell culture and drug treatment
1. Cell culture: Seed 3 × 10⁶ U251 cells in a 15 cm dish with full DMEM medium containing 5% FBS with 4 mM glutamine, 25 mM glucose, and 1 mM pyruvate. Incubate for 24 h.
2. Drug treatment
a. Wash the cells twice with PBS, then treat with/without pimozide (3 μM) in fresh DMEM medium containing 1% FBS, 5 mM glucose, 4 mM glutamine, and 1 mM pyruvate for an additional 24 h.
b. Wash the cells twice with PBS and then deprive them for 1 h with serum-free medium containing 5 mM glucose, 0 mM glutamine, and 1 mM pyruvate, with pimozide (3 μM) or DMSO treatment (vehicle control).
c. Add 2 mM 13C-glutamine or 2 mM normal 12C-glutamine as a negative control to the medium and incubate for 1 h.
Notes:
1. Ensure that cell density reaches 80%–95% confluence in a 15 cm cell culture plate prior to starting the procedure.
2. Wash cells twice with PBS both before and after drug treatment to thoroughly remove residual medium and treatment agents.
3. For drug treatment, after PBS washing, add fresh medium containing the same drug concentration to maintain consistent exposure.
4. The duration of deprivation and 13C-glutamine incubation can be adjusted based on the specific objective. For different cell lines, glutamine deprivation conditions, 13C-glutamine concentration, and incubation time could be adjusted to achieve the best experimental outcome.
B. Cell sample collection
1. Medium removal
a. Add 5 mL of cold non-sterile PBS buffer onto the plate and gently rotate the plate to ensure the entire surface is thoroughly washed.
b. Remove the PBS using a vacuum-suction device.
c. Repeat steps B1a–b twice for a total of three washes.
d. After the third wash, tilt the plate on ice to allow excess PBS to collect at the edge. Remove as much residual PBS as possible using vacuum suction to minimize salt contamination.
Notes:
1. Ensure that all reagents and materials used for cell collection are kept in an ice box to maintain a low temperature throughout the procedure.
2. Polar metabolites and LCFA extraction are extracted separately through parallel experiments.
3. Unlabeled cells are collected to serve as controls for metabolite identification and to aid in the accurate assignment of labeled compounds.
2. Quenching cell metabolism and cell harvest
a. Add 1 mL of cold acetonitrile (CH3CN) to the plate under a chemical fume hood. The following procedures should also be conducted under a chemical fume hood.
b. Immediately before scraping, add 250 μL of HyPure water to the plate.
c. Scrap and collect cells.
i. Use a cell scraper to thoroughly scrape the entire plate surface, ensuring the edges are not overlooked.
ii. Allow the plate to rest on ice briefly, then use the scraper to push all cells and liquid into one corner of the plate.
iii. Use a transfer pipette to collect the cells and the liquid into a 1.5 or 2 mL tube.
d. Repeat steps B2a–c, ensuring maximum cell collection.
Note: All steps should be performed on ice to preserve metabolite integrity.
C. Polar metabolite extraction
1. Homogenize the cells collected in section B for 1 min using a Sonic Dismembrator.
2. Vortex the mixture for 3 min and centrifuge it at 18,000× g for 20 min at 4 °C.
3. Transfer the supernatant into a microcentrifuge tube and lyophilize overnight.
4. Reconstitute the dried sample in 50% acetonitrile and vigorously vortex the mixture for 3 min.
5. Centrifuge the mixture at 18,000× g for 20 min at 4 °C.
6. Transfer the supernatant into an LC autosampler vial for two-dimensional liquid chromatography–mass spectrometry (2D-LC–MS) analysis.
D. Long-chain fatty acid extraction
1. Homogenize the cells collected in section B for 1 min using a Sonic Dismembrator.
2. Vortex the mixture for 3 min and centrifuge it at 18,000× g for 20 min at 4 °C.
3. Transfer the supernatant into a microcentrifuge tube and lyophilize overnight.
4. Reconstitute the dried sample in 200 μL of 50% ethanol.
5. Activate the OASIS HLB cartridge with 1 mL of pure methanol and then equilibrate with 1 mL of deionized water (diH2O).
6. Upload the reconstituted sample onto the OASIS HLB cartridge and wash with 1 mL of 5% methanol.
7. Elute the LCFAs using 200 μL of acetonitrile/methanol (9:1, v/v), repeating the elution process three times.
8. Dry the eluate under the nitrogen gas flow.
9. Reconstitute the dried sample into 25 μL of 75% ethanol, then transfer the sample to an LC autosampler vial for LC–MS analysis.
Notes:
1. For different cell lines, it is important to compare and select the most suitable extraction method for polar metabolites and long-chain fatty acids, such as acetonitrile-based (current protocol), methanol-based, or chloroform/methanol-based protocols.
2. For fatty acid analysis, include a cell-free sample (blank control) to account for background signals from the culture dish, cell scraper, Eppendorf tube, and other materials.
E. LC–MS analysis
All samples are analyzed on a Thermo Q Exactive HF Hybrid Quadrupole-Orbitrap Mass Spectrometer coupled with a Thermo DIONEX UltiMate 3000 UHPLC system.
E1. For polar metabolite profiling
1. LC system setup: the LC system is equipped with a reversed-phase chromatography column (RPC, a Waters Acquity UPLC HSS T3 column, 2.1 × 150 mm, 1.8 μm) and a hydrophilic interaction chromatography column (HILIC) (Millipore SeQuant ZIC-cHILIC column, 2.1 × 150 mm, 3 μm). The two chromatographic columns are configured to form a parallel 2D-LC–MS system [14]. Each column is connected to a 2 μL sample loop.
2. Mass spectrometer setup: the electrospray ionization probe is fixed at level C; sheath gas = 55 arbitrary units, auxiliary gas = 15 arbitrary units, sweep gas = 3 arbitrary units, spray voltage = 3.5 kV, capillary temperature = 320 °C, S-lens RF level = 65.0, and auxiliary gas heater temperature = 450 °C; scan range from 60 to 900 (m/z); maximum injection time 50 ms; resolution 30,000; automatic gain control (AGC) = 106 ions.
3. Mobile phases: For RPC, mobile phase A is diH2O with 0.1% formic acid, and mobile phase B is 100% acetonitrile with 0.1% formic acid. For HILIC, mobile phase A is 10 mM ammonium acetate (pH 3.25), and mobile phase B is 100% acetonitrile.
4. LC gradient and flow rate: For RPC separation, the gradient is set to 0–6 min at 0% B, 6–14 min increasing from 0% to 28% B, 14–16 min increasing from 28% to 50% B, 16–20 min increasing from 50% to 100% B, 21 min back to 0% B, and keeping at 0% B for 12 min. Flow rate is 0.35 mL/min. For HILIC separation, the gradient is set to 0–1.3 min at 95% B, 1.3–8.3 min decreasing from 95% to 0% B, 8.3–11 min keeping at 0% B, 11.5 min back to 95% B, and keeping at 95% B for 21.5 min. Flow rate is 0.30 mL/min.
5. Column temperature is set to 40 °C, and autosampler is set to 10 °C.
6. Collecting LC–MS data for metabolite quantification: All samples (including an unlabeled sample) are analyzed in a random order in positive (+) and negative (-) modes to obtain full MS data for metabolite quantification.
7. Collecting LC–MS/MS data for metabolite identification: A pooled sample of each group is analyzed by 2D-LC–MS/MS in positive and negative modes at three collision energies: 20, 40, and 60 eV.
E2. For analysis of long-chain fatty acids
1. The LC system is equipped with an RPC (Waters Acquity UPLC BEH C8 column, 2.1 × 100 mm, and 1.7 μm); the column is connected to a 15 μL sample loop.
2. Mass spectrometer is the same as above, except the scan range is set from 180 to 800 (m/z).
3. Mobile phases: Water with 0.1% acetic acid is used as mobile phase A, and acetonitrile with 0.1% acetic acid as mobile phase B.
4. The flow rate is 0.4 mL/min.
5. The gradient starts at 30% B, is held for 3 min, then increases to 99% B at 20 min, and is held for 5 min. It then returns to 30% B at 25.1 min and is held until 28 min.
6. The column temperature is set to 40 °C, and the autosampler is set to 10 °C.
7. Collecting LC–MS data for metabolite quantification: All samples were analyzed in negative (-) modes to obtain full MS data for metabolite quantification.
8. Collecting LC–MS/MS data for metabolite identification: A pooled sample of each group is analyzed by LC–MS/MS in negative modes at three collision energies: 20, 40, and 50 eV.
F. Data processing
1. Deconvolute the 2D-LC–MS for polar metabolites and LC–MS for LCFAs data using XCMS software [15–17].
2. In-house database setup:
• Analyze metabolite or LCFA standards using 2D-LC–MS/MS for polar metabolites and LC–MS/MS for LCFAs, applying the same methods as described above. For polar metabolites, perform analyses in both positive and negative ion modes; for LCFAs, use negative mode only.
• Upload the MS/MS spectra of the metabolite standards into mzVault, a part of Compound Discover software.
• Record the precursor ion m/z, MS/MS spectra, and retention time of the metabolite standards in the in-house database.
3. Compound identification:
• Match 2D-LC–MS/MS and LC–MS/MS spectra data in the in-house database with the threshold for spectral similarity ≥0.4, retention time difference ≤0.15 min, and m/z variation ≤5 ppm.
• Analyze 2D-LC–MS/MS and LC–MS/MS data without a match with the metabolites in the in-house database using Compound Discoverer software (v 2.0) with the threshold of MS/MS spectra similarity score ≥40 (the maximum score is 100).
4. Use MetSign software for metabolite assignment, cross-sample peak list alignment, normalization, and statistical analysis [15].
Notes:
1. Unlabeled metabolites are identified by matching experimental data to the corresponding data of metabolite standards recorded in the in-house database and public data, as described in step F3. Isotopologues of a metabolite are recognized during cross-sample peak list alignment by comparing their retention times and monoisotopic peak m/z values to the corresponding information of the metabolites in the in-house and public databases.
2. Original metabolomics data are included in the National Metabolomics Data Repository (NMDR), Metabolomics Workbench [18].
3. We compared the peak intensity/106 cells for each metabolite between treated and untreated groups (n = 3/group). Statistical significance was determined by Student’s t-test, and metabolites with a fold change ≥ 2 and P < 0.05 were considered significantly altered.
Data analysis
Results
1. Small molecular polar metabolite identification
We purchased 363 polar metabolite standards and analyzed them using LC–MS or 2D-LC–MS in both positive and negative modes at varying collision energies of 20, 40, and 60 eV. The retention time, precursor ion m/z, and MS/MS spectra for each standard were recorded in our in-house database (mzVault). To identify a polar metabolite in the cell samples, we matched its precursor ion m/z, retention time, and MS/MS spectrum, as recorded in the in-house database, to the corresponding data obtained from the biological sample, using the thresholds defined in section F (Figure 1A, B). The isotope peaks of each metabolite are identified by their m/z values, located under the retention time of their corresponding unlabeled peaks (M0) (Figure 1C).
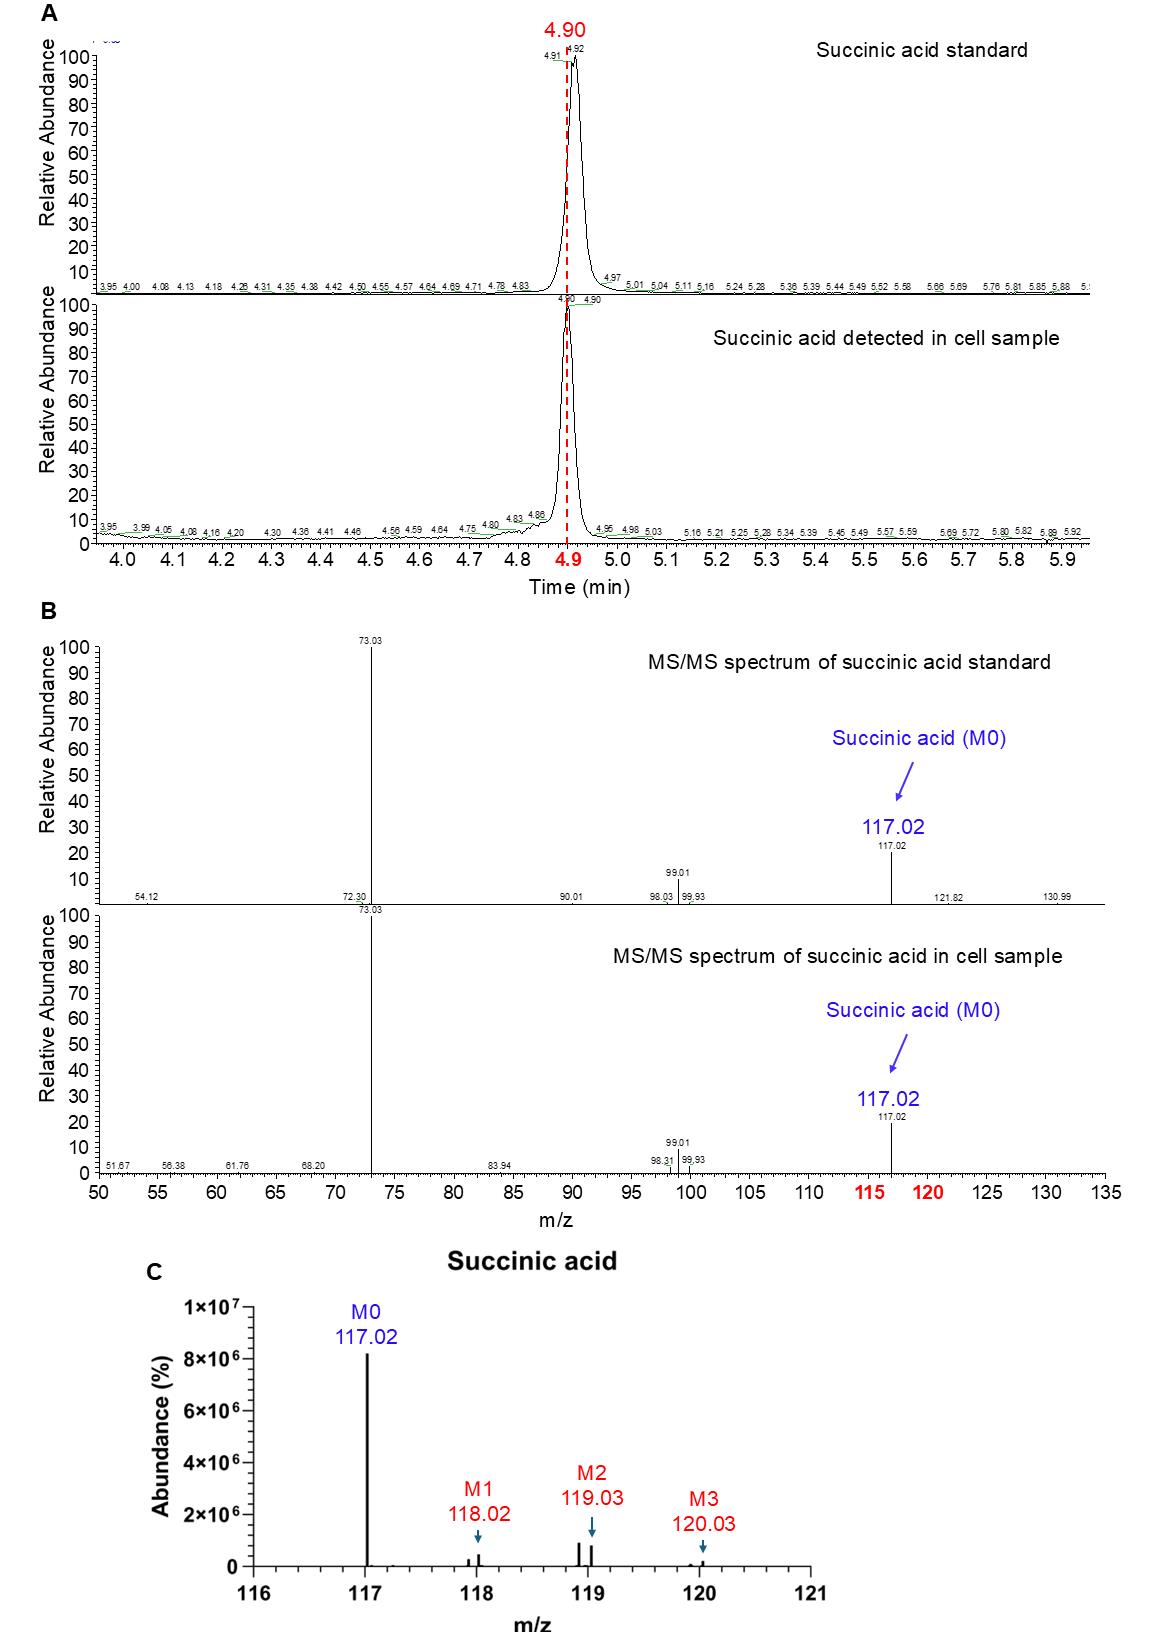
Figure 1. Identification of small molecular polar metabolites (i.e., succinic acid). (A) The precursor ion retention time of succinic acid is detected by 2D-LC–MS. (B) MS/MS spectrum of succinic acid without 13C-labeling from standard (top) and unlabeled cell samples. (C) Isotope peaks of succinic acid from 13C-glutamine-labeled cell samples. M0, M1, M2, and M3 represent isotopologues of succinic acid, indicating the number of 13C atoms incorporated.
2. LCFA identification
We purchased 58 long-chain fatty acid standards and analyzed them using LC–MS in negative mode at varying collision energies of 20, 40, 50, and 60 eV. The retention time, precursor ion m/z, and MS/MS spectrum for each standard were recorded in our in-house database (mzVault). Figure 2A shows an example MS/MS spectrum of LCFAs. LCFA detected in the cell samples is identified by matching its precursor ion m/z, retention time, and MS/MS spectrum recorded in the in-house database to the corresponding data obtained from the biological sample, using the thresholds defined in section F (Figure 2B). The isotope peaks of each FA are identified by their m/z values, located under the retention time of their corresponding unlabeled peaks (M0) (Figure 2C).
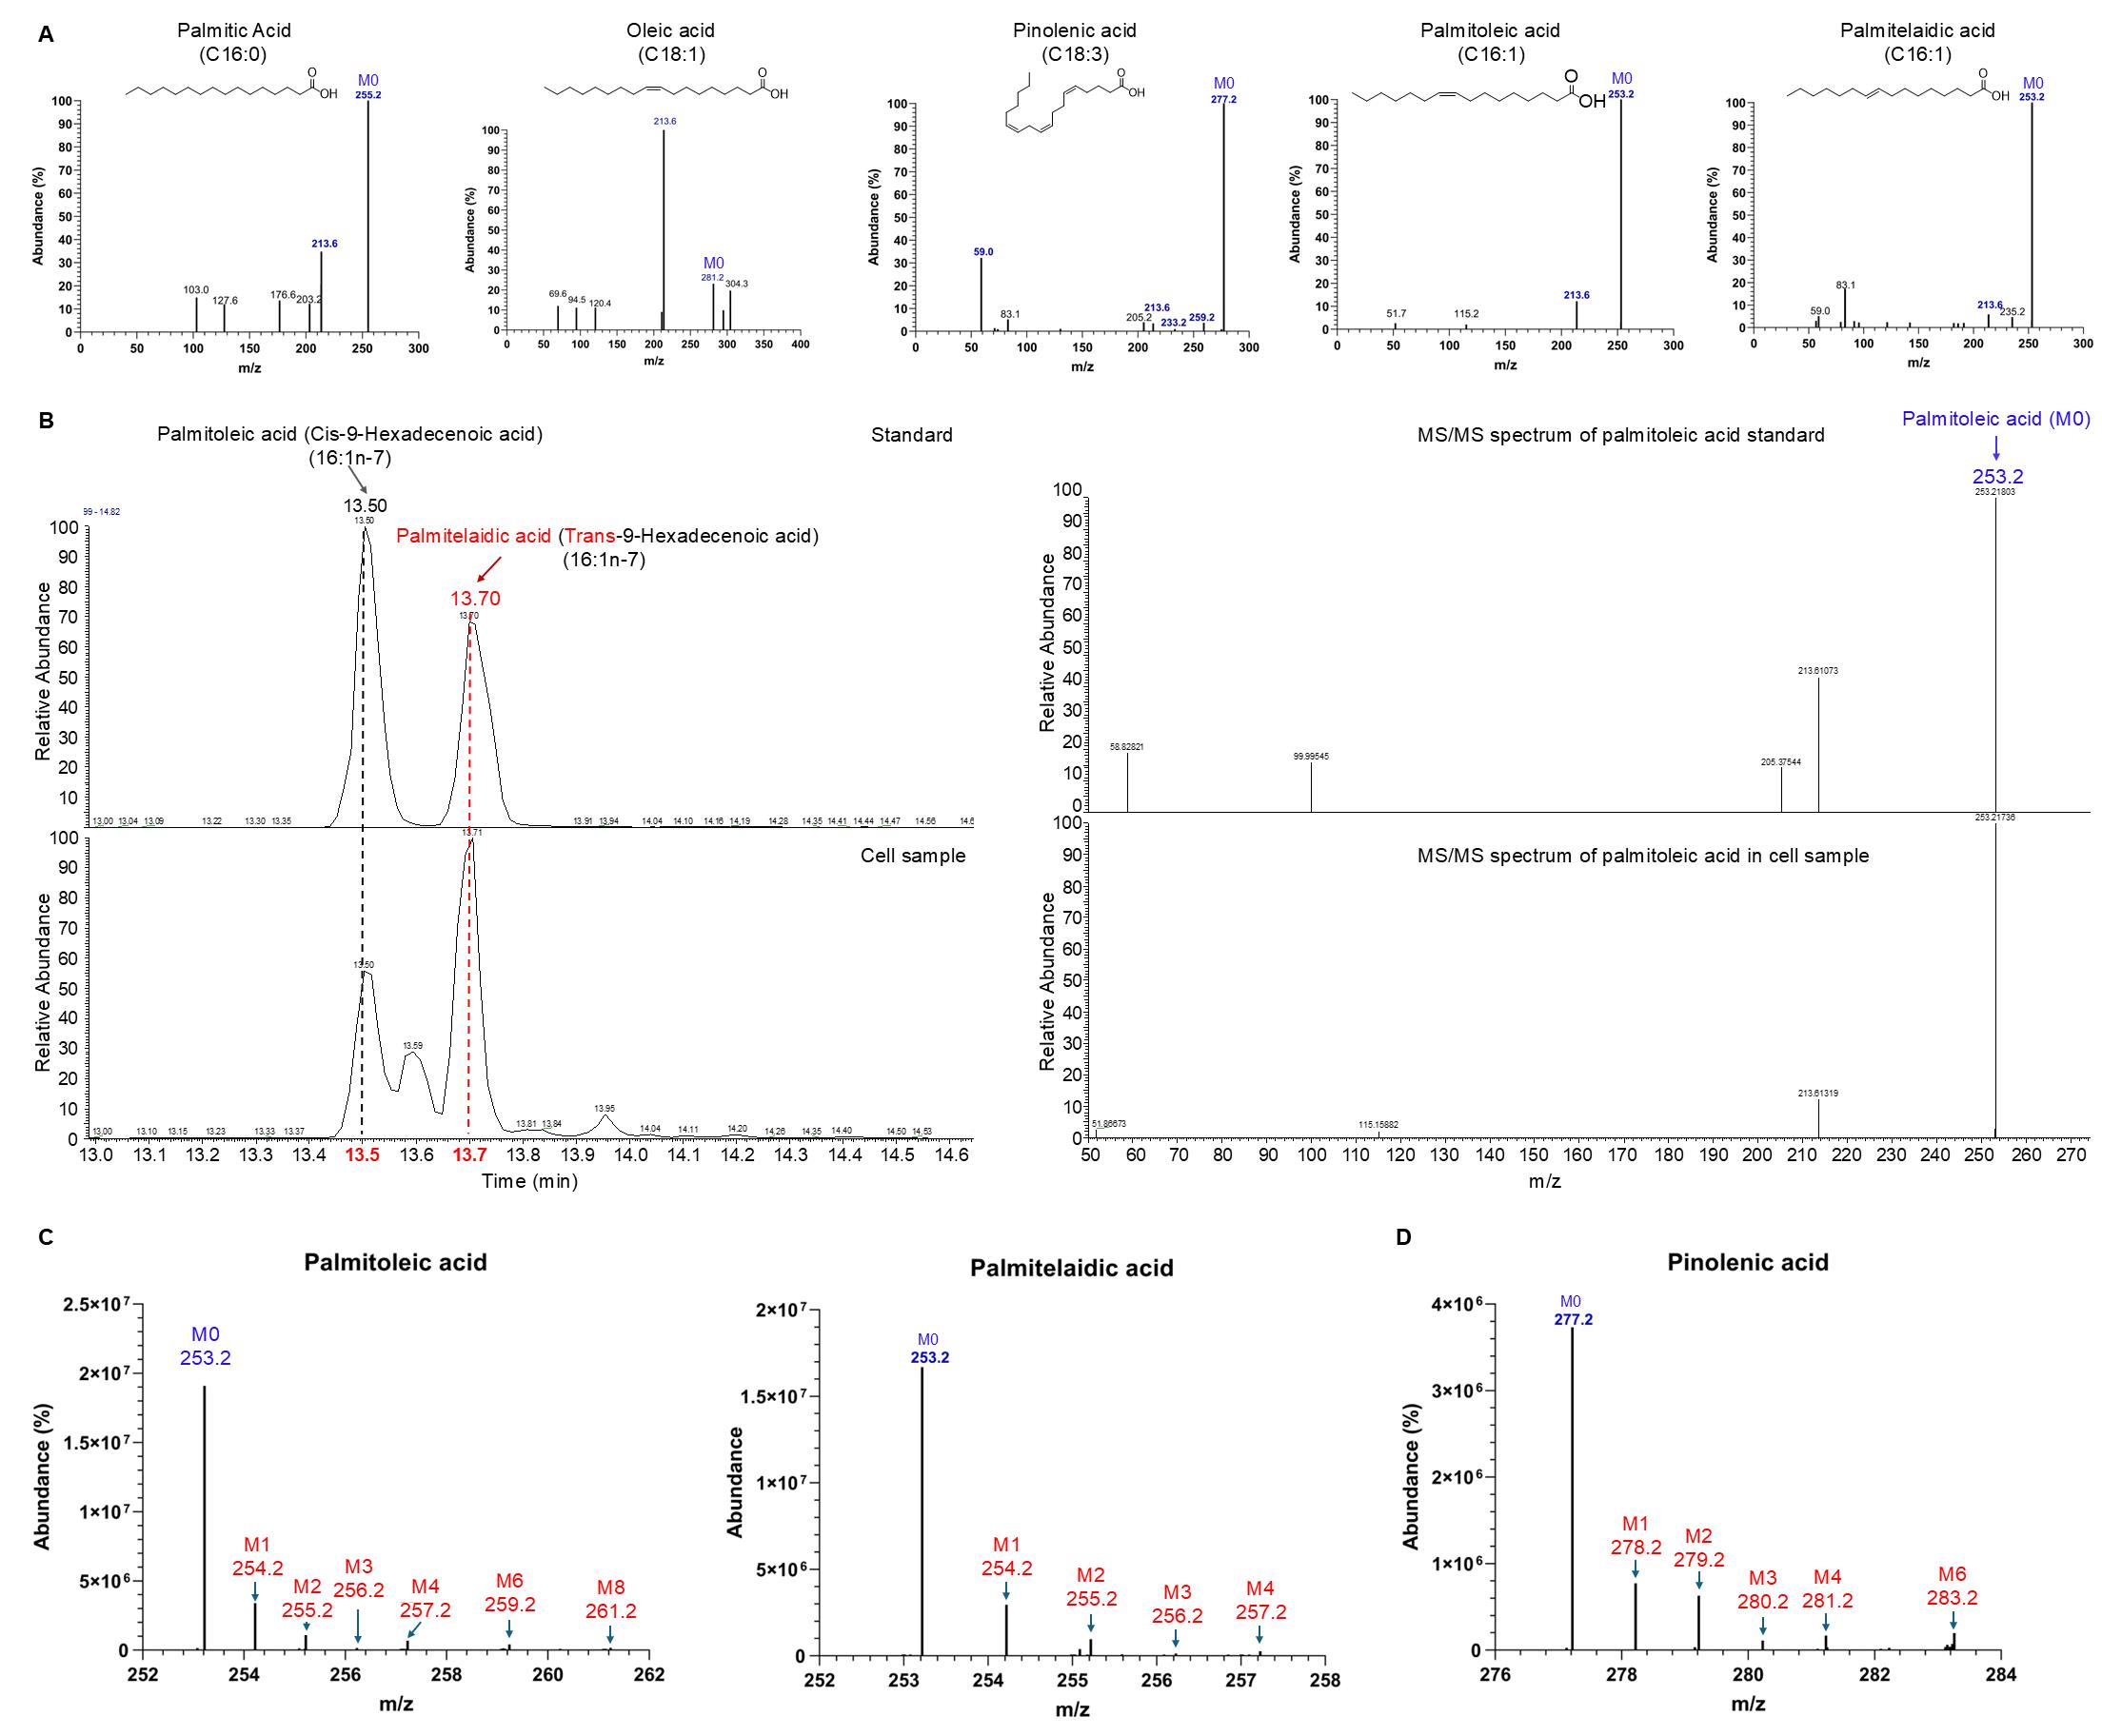
Figure 2. Identification of long-chain fatty acids (LCFAs). (A) MS/MS spectrum and chemical structure of various LCFAs without 13C labeling, obtained from standard samples. (B) Differentiating palmitoleic acid (16:1n-7) (cis-9-hexadecenoic acid) and palmitelaidic acid (16:1n-7) (trans-9-hexadecenoic acid) by different retention times from LC–MS (left) with the same m/z values and MS/MS spectra (right). (C and D) Isotope peak profiles of palmitoleic acid (C, left), palmitelaidic acid (C, right), and pinolenic acid (D), derived from 13C-glutamine-labeled cell samples. M0, M1, M2, M3, etc., represent isotopologues of each fatty acid, indicating the number of 13C atoms incorporated.
3. Lysosome inhibition by pimozide promotes glutamine consumption and reductive carboxylation-mediated FA synthesis
In our recent publication [8], we conducted a 13C-glutamine flux assay coupled with untargeted metabolomics analysis using LC–MS to investigate metabolic alterations in the GBM cell line U251 following lysosome inhibition by pimozide (PMZ) treatment. Principal component analysis revealed that the combined variance of PC1 and PC2, approaching 80%, indicates significant differences in identified metabolites between the PMZ-treated and control groups (Figure 3A). Pimozide treatment resulted in a substantial increase across multiple aspects of glutamine metabolism, including glutamine uptake, glutaminolysis, anaplerosis of the tricarboxylic acid cycle, and enhanced synthesis of glutathione, nucleotides, amino acids (Figure 3B), and fatty acids (Figure 3C).
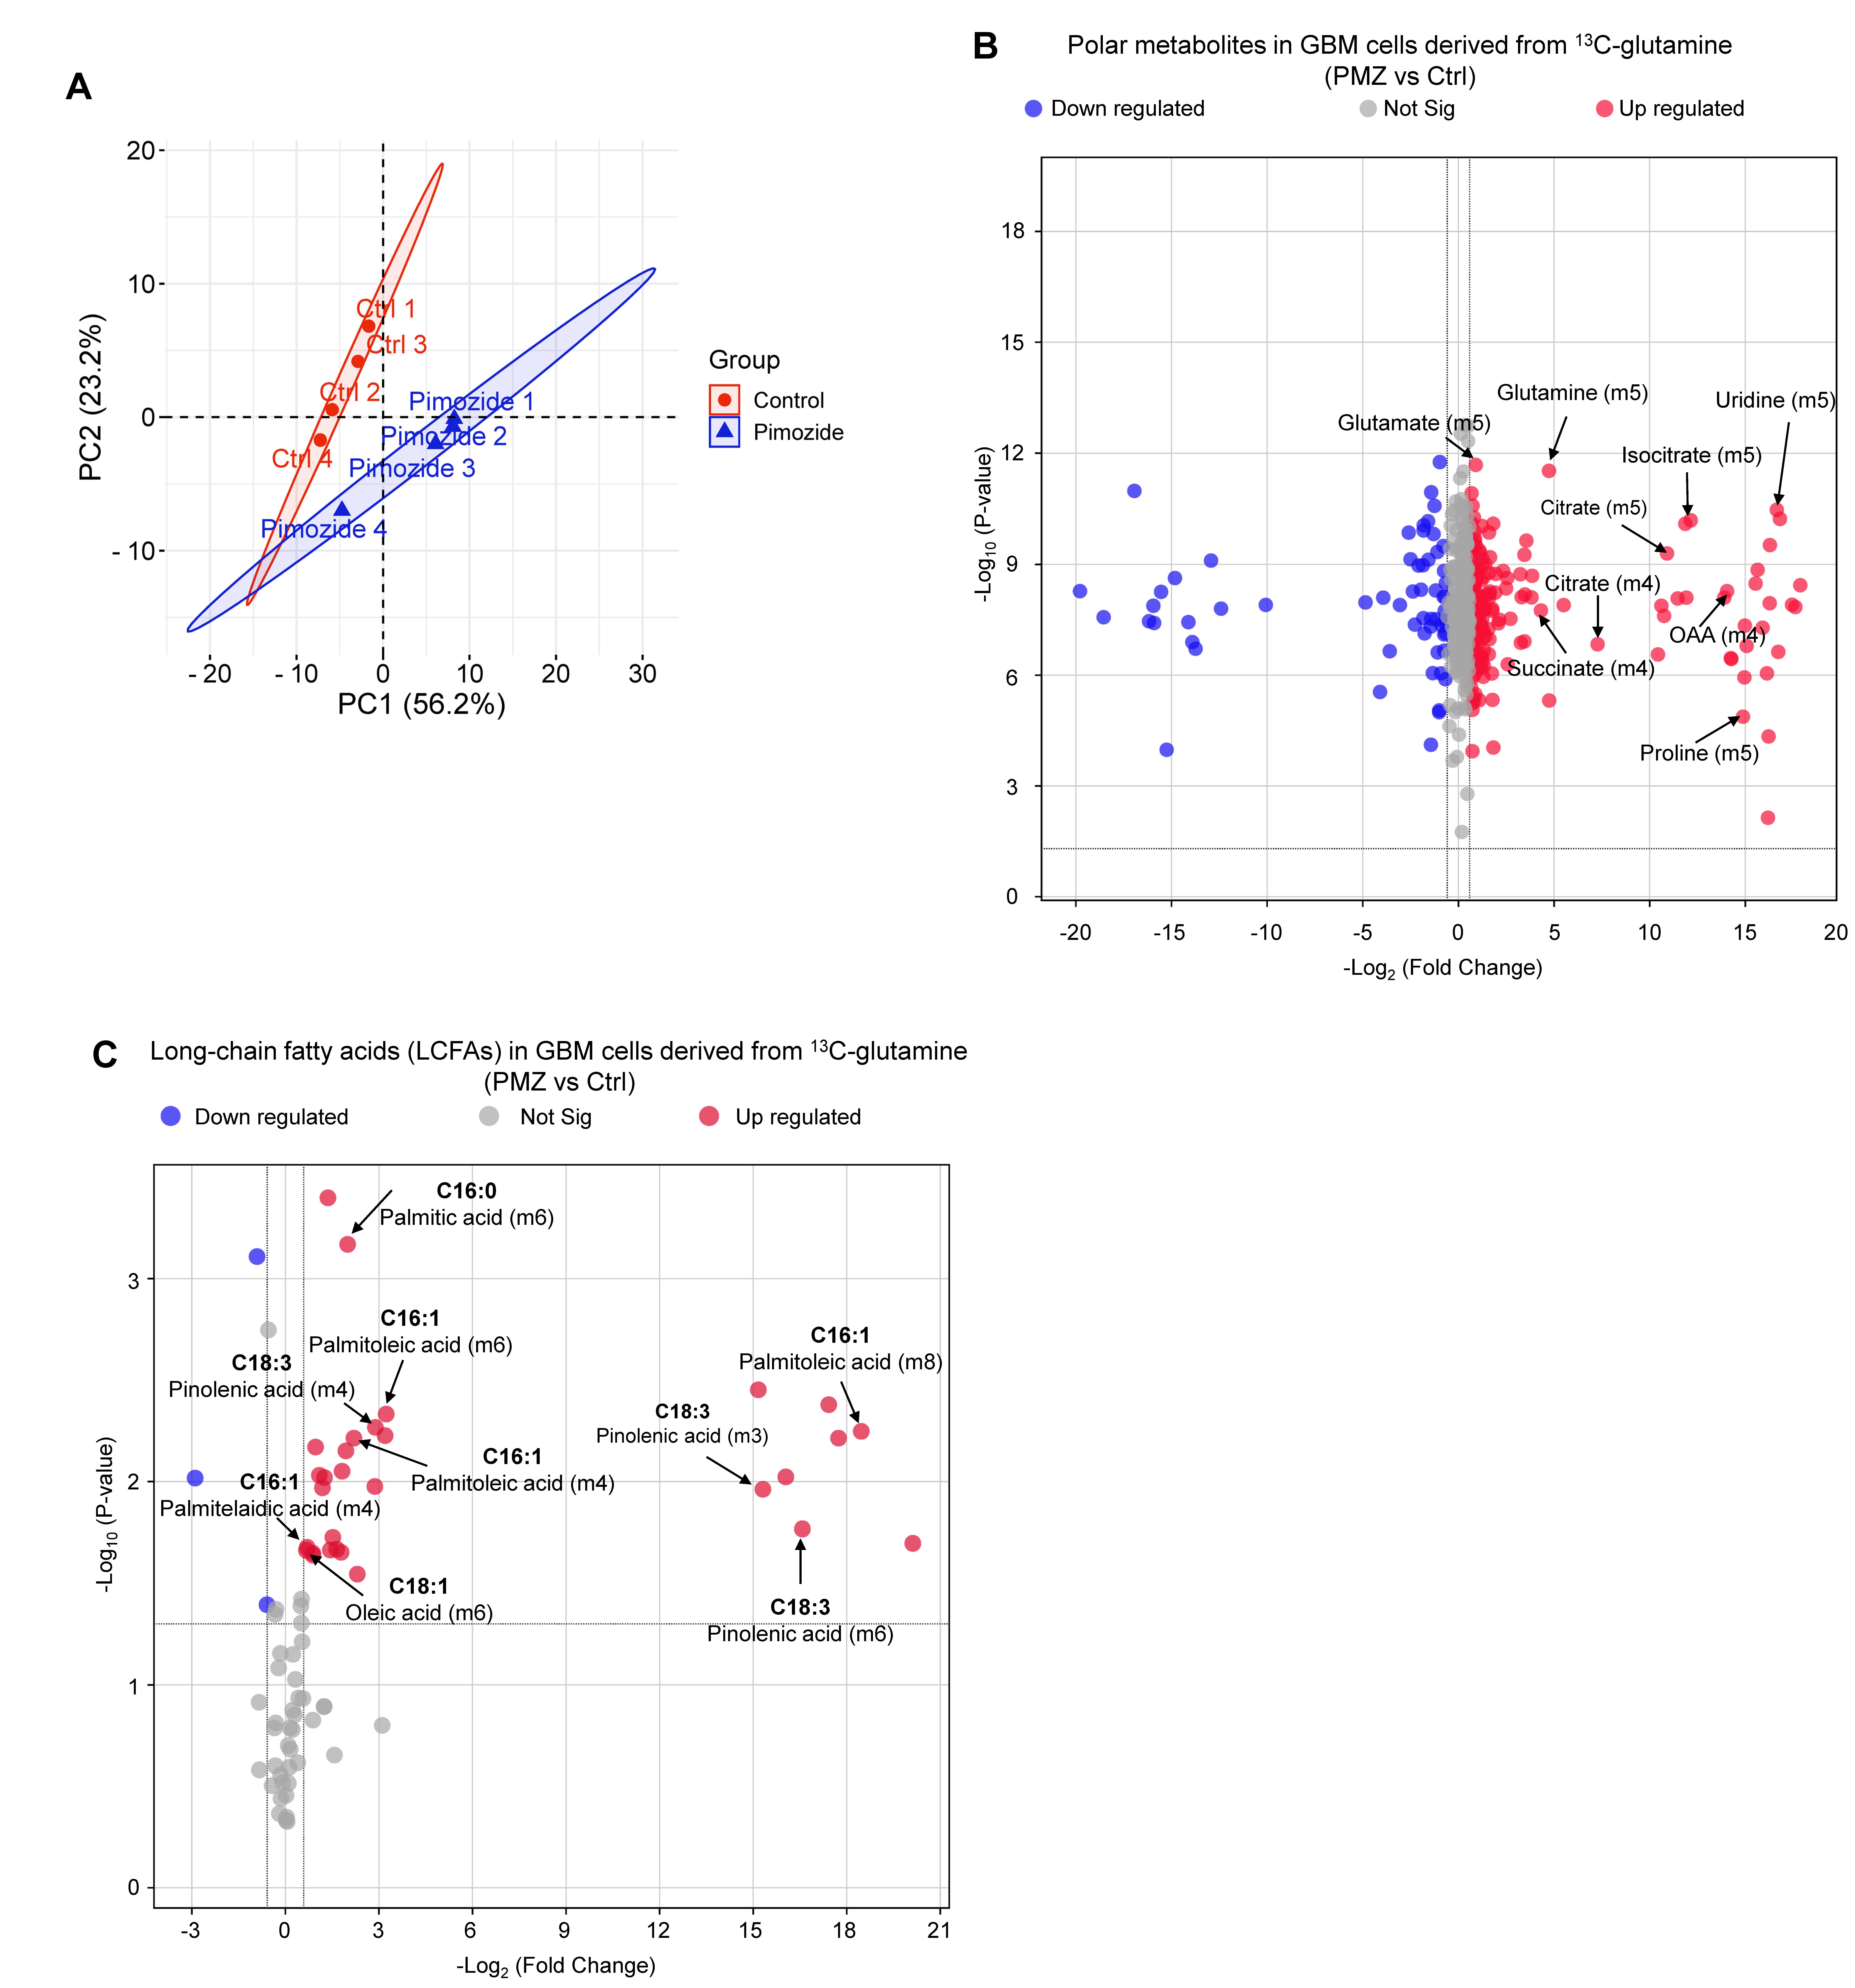
Figure 3. Lysosome inhibition by pimozide treatment significantly upregulates glutamine consumption and de novo fatty acid synthesis in glioblastoma (GBM) cells. (A) Principal component analysis of metabolites derived from 13C-glutamine (1 h) in GBM U251 cells treated with pimozide (PMZ, 3 µM) for 24 h. (B and C) Volcano plot showing changes in representative small molecular polar metabolites (B) and LCFAs (C) derived from 13C-glutamine in PMZ treatment cells compared to untreated controls. Statistical significance was determined by Student’s t-test in metabolites with fold change ≥ 2.0 and P < 0.05.
Validation of protocol
This protocol has been used and validated in the following research article:
• Zhong et al. [8]. Combinatorial targeting of glutamine metabolism and lysosomal-based lipid metabolism effectively suppresses glioblastoma. Cell Rep Med. 2024.
General notes and troubleshooting
General notes
1. Most general notes are provided after each relevant step to guide optimal execution.
2. A limitation of this protocol is that it does not cover the analysis of other lipid classes, such as phospholipids and cholesterol derived from 13C-glutamine.
3. Temperature is critical for the success of this protocol. Ensure that all steps are performed at the recommended temperatures, as indicated in the corresponding notes.
Troubleshooting
To aid in troubleshooting, we recommend including standard metabolites for the analysis of 13C-labeled polar metabolites and LCFAs. This will help identify the specific issues outlined below.
Problem 1: Some metabolites derived from 13C-glutamine are too low to be detected.
Possible cause 1: Excessive cell passaging. Cells that have undergone too many passages often exhibit reduced metabolic activity, impairing 13C-glutamine utilization.
Solution: Use low-passage, freshly cultured cells.
Possible cause 2: Low cell density. Insufficient cell density can lead to inadequate metabolite production.
Solution: Ensure cells reach approximately 80% confluence before labeling.
Possible cause 3: Insufficient incubation time. Short labeling periods may not allow sufficient accumulation of 13C-labeled metabolites.
Solution: Extend 13C-glutamine incubation time, optimizing based on the specific cell line.
Possible cause 4: Instrument sensitivity. Detection may be limited by sub-optimal LC–MS settings.
Solution: Optimize instrument parameters, including LC column selection, ionization mode, and MS/MS settings.
Problem 2: Nonspecific peaks in chromatograms.
Possible cause 1: Reagent or system contamination. Contaminants from reagents or LC components can cause nonspecific signals.
Solution: If due to reagent contamination, replace it with freshly prepared reagents. If due to LC system contamination, flush the system using methanol:isopropanol:acetonitrile:diH2O in a 1:1:1:1 ratio. If issues persist, contact technical support for system maintenance.
Problem 3: Retention time shift.
Possible cause 1: Incorrect mobile phase pH of the LC column. pH fluctuations can alter metabolite retention behavior.
Solution: Adjust acid concentration and mobile phase pH accordingly.
Possible cause 2: Carryover of strong elution solvent (mobile phase B). Residual high-concentration solvent can affect column performance.
Solution: Increase column re-equilibration time between runs.
Possible cause 3: Buffer strength and composition inconsistency.
Solution: Use freshly prepared mobile phases and maintain strict control over buffer composition and pH.
Possible cause 4: Fluctuating column temperature.
Solution: Ensure consistent column temperature throughout the run.
Acknowledgments
This protocol has been used and validated in the following research article: Zhong et al. [8], Combinatorial targeting of glutamine metabolism and lysosomal-based lipid metabolism effectively suppresses glioblastoma. Cell Rep Med. 2024, 5(9):101706. doi: 10.1016/j.xcrm.2024.101706. This work was supported by NINDS and NCI (USA) grants NS104332, NS112935, NS141312, and CA240726 to D.G., and CA227874 to D.G./A.C. We also appreciate the support from OSUCCC-Pelotonia Idea grant and Urban & Shelly Meyer Fund for Cancer Research to D.G., and NIH grant S10OD020106 to X.Z.
Competing interests
The authors declare that there is no conflict of interest.
Ethical considerations
No ethical considerations were required to carry out these extraction protocols.
References
- Currie, E., Schulze, A., Zechner, R., Walther, T. C. and Farese, R. V. (2013). Cellular Fatty Acid Metabolism and Cancer. Cell Metab. 18(2): 153–161. https://doi.org/10.1016/j.cmet.2013.05.017
- Zhang, Y., Li, Q., Huang, Z., Li, B., Nice, E. C., Huang, C., Wei, L. and Zou, B. (2022). Targeting Glucose Metabolism Enzymes in Cancer Treatment: Current and Emerging Strategies. Cancers. 14(19): 4568. https://doi.org/10.3390/cancers14194568
- Jin, J., Byun, J. K., Choi, Y. K. and Park, K. G. (2023). Targeting glutamine metabolism as a therapeutic strategy for cancer. Exp Mol Med. 55(4): 706–715. https://doi.org/10.1038/s12276-023-00971-9
- Zhu, T. and Wang, G. (2022). The interaction between end-metabolites and immune escape. Oncolo Transl Med. 8(2): 57–73. https://doi.org/10.1007/s10330-022-0573-3
- Evershed, R. P., Crossman, Z. M., Bull, I. D., Mottram, H., Dungait, J. A., Maxfield, P. J. and Brennand, E. L. (2006). 13C-Labelling of lipids to investigate microbial communities in the environment. Curr Opin Biotechnol. 17(1): 72–82. https://doi.org/10.1016/j.copbio.2006.01.003
- Antoniewicz, M. R. (2018). A guide to 13C metabolic flux analysis for the cancer biologist. Exp Mol Med. 50(4): 1–13. https://doi.org/10.1038/s12276-018-0060-y
- Liao, Y., Chen, Q., Liu, L., Huang, H., Sun, J., Bai, X., Jin, C., Li, H., Sun, F., Xiao, X., et al. (2024). Amino acid is a major carbon source for hepatic lipogenesis. Cell Metab. 36(11): 2437–2448.e8. https://doi.org/10.1016/j.cmet.2024.10.001
- Zhong, Y., Geng, F., Mazik, L., Yin, X., Becker, A. P., Mohammed, S., Su, H., Xing, E., Kou, Y., Chiang, C. Y., et al. (2024). Combinatorial targeting of glutamine metabolism and lysosomal-based lipid metabolism effectively suppresses glioblastoma. Cell Rep Med. 5(9): 101706. https://doi.org/10.1016/j.xcrm.2024.101706
- Cheng, C., Geng, F., Li, Z., Zhong, Y., Wang, H., Cheng, X., Zhao, Y., Mo, X., Horbinski, C., Duan, W., et al. (2022). Ammonia stimulates SCAP/Insig dissociation and SREBP-1 activation to promote lipogenesis and tumour growth. Nat Metab. 4(5): 575–588. https://doi.org/10.1038/s42255-022-00568-y
- Geng, F., Zhong, Y., Su, H., Lefai, E., Magaki, S., Cloughesy, T. F., Yong, W. H., Chakravarti, A. and Guo, D. (2023). SREBP-1 upregulates lipophagy to maintain cholesterol homeostasis in brain tumor cells. Cell Rep. 42(7): 112790. https://doi.org/10.1016/j.celrep.2023.112790
- Cheng, X., Geng, F., Pan, M., Wu, X., Zhong, Y., Wang, C., Tian, Z., Cheng, C., Zhang, R., Puduvalli, V., et al. (2020). Targeting DGAT1 Ameliorates Glioblastoma by Increasing Fat Catabolism and Oxidative Stress. Cell Metab. 32(2): 229–242.e8. https://doi.org/10.1016/j.cmet.2020.06.002
- Wu, X., Geng, F., Cheng, X., Guo, Q., Zhong, Y., Cloughesy, T. F., Yong, W. H., Chakravarti, A. and Guo, D. (2020). Lipid Droplets Maintain Energy Homeostasis and Glioblastoma Growth via Autophagic Release of Stored Fatty Acids. iScience. 23(10): 101569. https://doi.org/10.1016/j.isci.2020.101569
- Fan, Y., Zhang, R., Wang, C., Pan, M., Geng, F., Zhong, Y., Su, H., Kou, Y., Mo, X., Lefai, E., et al. (2024). STAT3 activation of SCAP-SREBP-1 signaling upregulates fatty acid synthesis to promote tumor growth. J Biol Chem. 300(6): 107351. https://doi.org/10.1016/j.jbc.2024.107351
- Klavins, K., Drexler, H., Hann, S. and Koellensperger, G. (2014). Quantitative Metabolite Profiling Utilizing Parallel Column Analysis for Simultaneous Reversed-Phase and Hydrophilic Interaction Liquid Chromatography Separations Combined with Tandem Mass Spectrometry. Anal Chem. 86(9): 4145–4150. https://doi.org/10.1021/ac5003454
- He, L., Li, F., Yin, X., Bohman, P., Kim, S., McClain, C. J., Feng, W. and Zhang, X. (2019). Profiling of Polar Metabolites in Mouse Feces Using Four Analytical Platforms to Study the Effects Of Cathelicidin-Related Antimicrobial Peptide in Alcoholic Liver Disease. J Proteome Res. 18(7): 2875–2884. https://doi.org/10.1021/acs.jproteome.9b00181
- Wei, X., Shi, X., Kim, S., Patrick, J. S., Binkley, J., Kong, M., McClain, C. and Zhang, X. (2014). Data Dependent Peak Model Based Spectrum Deconvolution for Analysis of High Resolution LC-MS Data. Anal Chem. 86(4): 2156–2165. https://doi.org/10.1021/ac403803a
- Tautenhahn, R., Patti, G. J., Rinehart, D. and Siuzdak, G. (2012). XCMS Online: A Web-Based Platform to Process Untargeted Metabolomic Data. Anal Chem. 84(11): 5035–5039. https://doi.org/10.1021/ac300698c
- Sud, M., Fahy, E., Cotter, D., Azam, K., Vadivelu, I., Burant, C., Edison, A., Fiehn, O., Higashi, R., Nair, K. S., et al. (2016). Metabolomics Workbench: An international repository for metabolomics data and metadata, metabolite standards, protocols, tutorials and training, and analysis tools. Nucleic Acids Res. 44: D463–D470. https://doi.org/10.1093/nar/gkv1042
Article Information
Publication history
Received: Jan 3, 2025
Accepted: Apr 26, 2025
Available online: May 8, 2025
Published: May 20, 2025
Copyright
© 2025 The Author(s); This is an open access article under the CC BY license (https://creativecommons.org/licenses/by/4.0/).
How to cite
Zhong, Y., He, L., Yin, X., Mazik, L., Zhang, X. and Guo, D. (2025). Stable 13C-glutamine Tracing Resolved Metabolomics for Cancer Metabolism Study. Bio-protocol 15(10): e5322. DOI: 10.21769/BioProtoc.5322.
Category
Cancer Biology > Cancer biochemistry > Cancer metabolism
Systems Biology > Metabolomics > Tissue
Biochemistry > Lipid
Do you have any questions about this protocol?
Post your question to gather feedback from the community. We will also invite the authors of this article to respond.
Share
Bluesky
X
Copy link


