- Protocols

- Articles and Issues
- For Authors
- About
- Become a Reviewer

Quantifying Thrombogenicity: A Bioanalytical Protocol for the Absorbance-Based Assessment of Vascular Implants with Plasma
(*contributed equally to this work) Published: Vol 15, Iss 10, May 20, 2025 DOI: 10.21769/BioProtoc.5316 Views: 1737
Reviewed by: Elena A. OstrakhovitchEVANGELOS THEODOROU
Original research article
The authors used this protocol in:
May 2024
Advertisement


Protocol Collections
Comprehensive collections of detailed, peer-reviewed protocols focusing on specific topics


Abstract
Assessing thrombogenicity is crucial for evaluating biomaterials, especially those that interface with flowing blood, such as cardiovascular implants, including vascular stents, grafts, and stent-grafts. To standardize thrombogenicity assessments, we use human plasma and quantify the light absorbance associated with the biomaterial. For this evaluation, various tubular vascular implants from leading brands—such as bare-metal stents, drug-eluting stents, vascular grafts, and stent-grafts—are longitudinally sectioned into small pieces and placed in a low-adhesion 96-well plate. Using either platelet-rich plasma (PRP) or platelet-poor plasma (PPP), we measure the absorbance of light passing through the plate over an hour and plot the resulting curve. This method quantifies the thrombogenicity of a biomaterial under controlled conditions. Key factors examined include anticoagulants, platelet presence, and surface-coating molecules to assess their impact on thrombogenicity. Using this simple, reproducible protocol, we demonstrated (a) the relative efficacy of various anticoagulants in thrombogenicity assessments, and (b) the effectiveness of vascular coating molecules in reducing thrombogenicity on stents. This streamlined approach offers valuable insights for optimizing biomaterial performance in vascular implants. Unlike conventional clotting assays, which focus on standardized blood clotting mechanisms, this assay is tailored to evaluate biomaterials and external parameters influencing thrombogenicity.
Key features
• This protocol is a static, in vitro, quantitative assessment of thrombogenicity for both novel and commercial vascular biomaterials with flat or tubular geometries.
• Thrombogenicity is assessed by evaluating the opaqueness of platelet-rich or platelet-poor plasma over time to measure fibrin formation.
• Various anticoagulants such as sodium citrate, sodium ethylenediaminetetraacetic acid, and sodium heparin are compared to evaluate the efficacy of the protocol.
• This protocol compares the thrombogenicity of various commercial stents, grafts, and stent-graft hybrids, as well as novel molecular coatings.
Keywords: Platelet-rich plasma (PRP)Graphical overview
Overview of the mechanisms and steps performed in this protocol
Background
Cardiovascular diseases are the leading cause of death worldwide, with coronary artery disease, cerebrovascular disease, and peripheral vascular disease being the most prevalent. These conditions are often managed using vascular stents or grafts, but thrombosis remains a significant challenge, contributing to the failure of these devices. As a result, patients with stents or grafts typically require blood thinners, which can cause serious side effects. Therefore, minimizing thrombogenicity is a critical focus for both commercially available stents and grafts and the development of new vascular biomaterials.
The surfaces of vascular biomaterials interact with blood components to initiate coagulation through the intrinsic clotting cascade. To help minimize the risk of thrombogenesis, anticoagulants such as sodium citrate, sodium ethylenediaminetetraacetic acid (EDTA), and sodium heparin are often used. These anticoagulants are capable of chelating calcium ions, reducing the concentration of free calcium in the blood, and thus inhibiting multiple clotting factors such as factors II, IX, X, XI, and XII, which depend on calcium for their activation. Blood coagulation factor XII (FXII) activates when it binds to artificial, negatively charged surfaces such as biomaterials. This activation transforms FXII into the enzyme factor XIIa, which activates FXI, leading to the generation of thrombin [1]. FXII activation can occur in vitro and has been shown to have a role in intravascular thrombus formation, which makes it ideal for our research.
The surfaces of vascular biomaterials interact with blood components, triggering coagulation through the intrinsic clotting cascade. To reduce the risk of thrombogenesis, anticoagulants such as sodium citrate, sodium ethylenediaminetetraacetic acid (EDTA), and sodium heparin are commonly employed. These anticoagulants chelate calcium ions, thereby lowering the concentration of free calcium in the blood and inhibiting calcium-dependent clotting factors, including factors II, IX, X, XI, and XII. Blood coagulation factor XII (FXII) is particularly relevant, as it is activated upon binding to artificial, negatively charged surfaces, such as those of vascular stents or grafts, leading to the generation of thrombin [1]. In addition to FXII activation, soluble fibrinogen is converted into insoluble fibrin during thrombin generation. This conversion can be detected through changes in light absorbance within a blood plasma sample. The formation of fibrin also promotes platelet aggregation, further contributing to the development of a hemostatic clot [2].
This protocol monitors the production of fibrin by measuring the change in opacity of PPP or PRP over time, using the absorbance measured at a wavelength of 405 nm. This method provides insights into the thrombogenicity of various biomaterials and evaluates the influence of biological factors such as anticoagulants on blood plasma.
The use of platelet-rich plasma (PRP) vs. platelet-poor plasma (PPP) relies on the type of information being tested. PRP has a higher-than-normal amount of platelets, whereas PPP has barely any platelets at all. PRP contains several growth factors that support tissue regeneration, such as epidermal growth factor (EGF), transforming growth factor-beta (TGF-b), platelet-derived growth factor (PDGF), and insulin-like growth factor 1 (IGF-1) [3]. PRP also contains more calcium-binding proteins and clotting factors, whereas PPP contains more fibrinogen and lacks platelet-specific components. PRP may be more helpful in regenerative studies, while PPP may be useful in studies where platelets complicate the analysis of results. PRP clots faster than PRP due to the presence of platelets.
Sodium citrate, EDTA, and heparin are all capable of chelating calcium ions; however, they are not equally effective in this method. While heparin inhibits blood coagulation factor IV (calcium ions), it also inhibits other clotting factors that will not be reactivated by the recalcification of blood. As such, we expect this protocol to be less effective when using heparin vs. other anticoagulants. Other similar methods [4] include a partial thromboplastin time (PTT) test, which is used clinically to evaluate blood disorders based on recalcifying blood and measuring the time it takes to clot. Our protocol can be used for clinical applications as well; however, it is targeted toward the evaluation and improvement of biomaterials. Because it evaluates various anticoagulants for their efficacy in creating a thrombus after recalcification, our protocol could also be used to evaluate the efficacy of various anticoagulants in calcium chelation. In addition, this protocol can be used to evaluate the activation of FXII on various biomaterials.
Materials and reagents
Biological materials
1. Pooled human plasma (blood-derived, anticoagulant: Na heparin) (Innovative Research)
2. Pooled human plasma (blood-derived, anticoagulant: Na citrate) (Innovative Research)
3. Pooled human plasma (blood-derived, anticoagulant: Na EDTA) (Innovative Research)
4. Whole donor blood (anticoagulant: Na Citrate) (Zen-Bio)
5. Collagen from rat tail, Bornstein and Traub Type 1, powder (Sigma-Aldrich)
Reagents
1. Calcium chloride dihydrate, 99%, for analysis by the American Chemical Society (ACS) (Acros Organics, catalog number: 423525000)
2. 2× (50 mM) 4-(2-hydroxylethyl)-1-piperazineethanesulfonic acid (HEPES) buffered saline, diluted to 1× (25 mM) (Boston Bioproducts, catalog number: BM-165-250ml), storage temperature 4 °C
3. Ethanol (50%, 75%, 95%, 100%) diluted with DI water
4. Dulbecco’s phosphate-buffered saline (PBS) 10×, diluted to 1× (Corning, catalog number: 20-031-CV)
5. Deionized (DI) or reverse osmosis (RO) water
6. 0.02 N acetic acid (Fischer Scientific, catalog number: LC103902)
7. Heprasil, 1% wt (Biomatrix, catalog number: GS215)
8. Heparin thiol, MW 27K (Creative PEG Works, catalog number: HP-211)
9. Glutaraldehyde, 25%, diluted to 2.5% (Fischer Scientific, catalog number: O2957-1)
Biomaterials
1. Medtronic Integrity bare metal coronary stent (4 mm × 15 mm)*
2. Medtronic Zotarolimus eluting coronary stent (4 mm × 15 mm)*
3. Abbott Graftmaster coronary stent graft (4 mm × 15 mm)*
4. GORE® Viabahn 4–6 mm vascular graft (Gore Medical)*
5. Coverslips mini 5 mm diameter (World Precision Instruments)
*Note: Any length works, but 4 mm diameter tubular implants fit 96-well plates the best.
Solutions
1. 25 mM calcium chloride (see Recipes)
2. Collagen coating solution (see Recipes)
3. 1% heparin thiol (see Recipes)
Recipes
1. 25 mM calcium chloride
| Reagent | Final concentration | Amount |
|---|---|---|
| Calcium chloride dihydrate | 25 mM | 13.4 mg |
| DI/RO H2O | n/a | 5 mL |
| Total | 25 mM | 5 mL |
2. Collagen coating solution
| Reagent | Final concentration | Amount |
|---|---|---|
| Collagen from rat tail | 50 μg/mL | 1.5 mg |
| Acetic acid, 0.02 N | 0.02 N | 30 mL |
| Total | n/a | 30 mL |
3. 1% heparin thiol solution
| Reagent | Final concentration | Amount |
|---|---|---|
| Heparin thiol, MW 27K | 1% | 0.1 mL |
| DI/RO H2O | n/a | 2.6 mL |
| Total | n/a | 2.7 mL |
Laboratory supplies
1. Low adhesion 96-well plate (SPL 3DTM Cell Floater Plate, 96 well, flat bottom, catalog number: 39796)
2. Eppendorf tubes (Flex Tube, catalog number: 022364120)
3. Tweezers (from any commercial source)
4. Stereomicroscope (Amscope, 10× magnification); any low-magnification microscope will work
5. Wire cutters (Xuron 410 Micro-shear); any sharp shear wire cutters will work
6. Warm water bath (bucket, warm water, thermometer to check temperature) or water bath (see Equipment)
7. Glass jar round vacuum desiccator (any brand)
Equipment
1. Flat plate orbital shaker (Lab Fish, model: OS-20F)
2. Centrifuge (Eppendorf, model: 5804)
3. Plate reader (Molecular Devices, model: SpectraMax iD3)
4. Scanning electron microscope (JEOL, model: JSM 6480LV)
5. Pipette and pipette tips, 20–200 μL and 200–1,000 μL (Eppendorf Pipettemaster); a multi-pipette is recommended but not required
6. Water bath (Fisher Scientific, model: Isotemp Digital Water Bath)
7. Stryker inflator with stopcock
8. UV cross-linker (OmniCure, model: Series 1500)
Software and datasets
1. Excel (Version 16.7); requires license: Microsoft 365 subscription
2. MATLAB (version R2023b, 11/28/2023); other graphics software, such as Python and matplotlib, can be used instead
Procedure
A. Plasma preparation
1. Collect fresh blood from a donor or thaw the pooled human plasma by placing it in a 37.5 °C water bath and shaking it vigorously until the plasma is entirely thawed at room temperature.
2. If using the whole blood, centrifuge the blood at 197× g for 15 min and decant the top plasma layer into a new, clean Eppendorf tube. Discard the remaining red blood cell layer [5].
3. Centrifuge the plasma at 1,118× g for 25 min to obtain platelet concentrate.
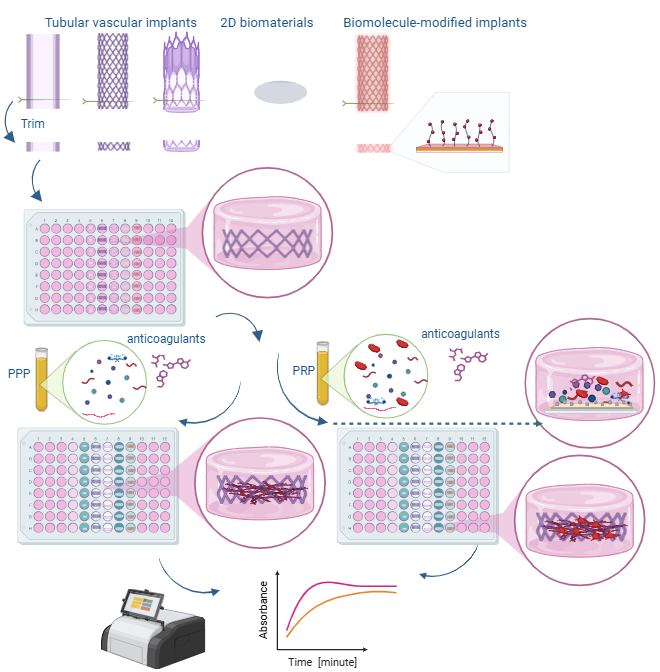
4. The lower third is platelet-rich plasma (PRP), and the upper two-thirds are platelet-poor plasma (PPP). At the bottom of the tube, platelet pellets are formed (see Figure 1).
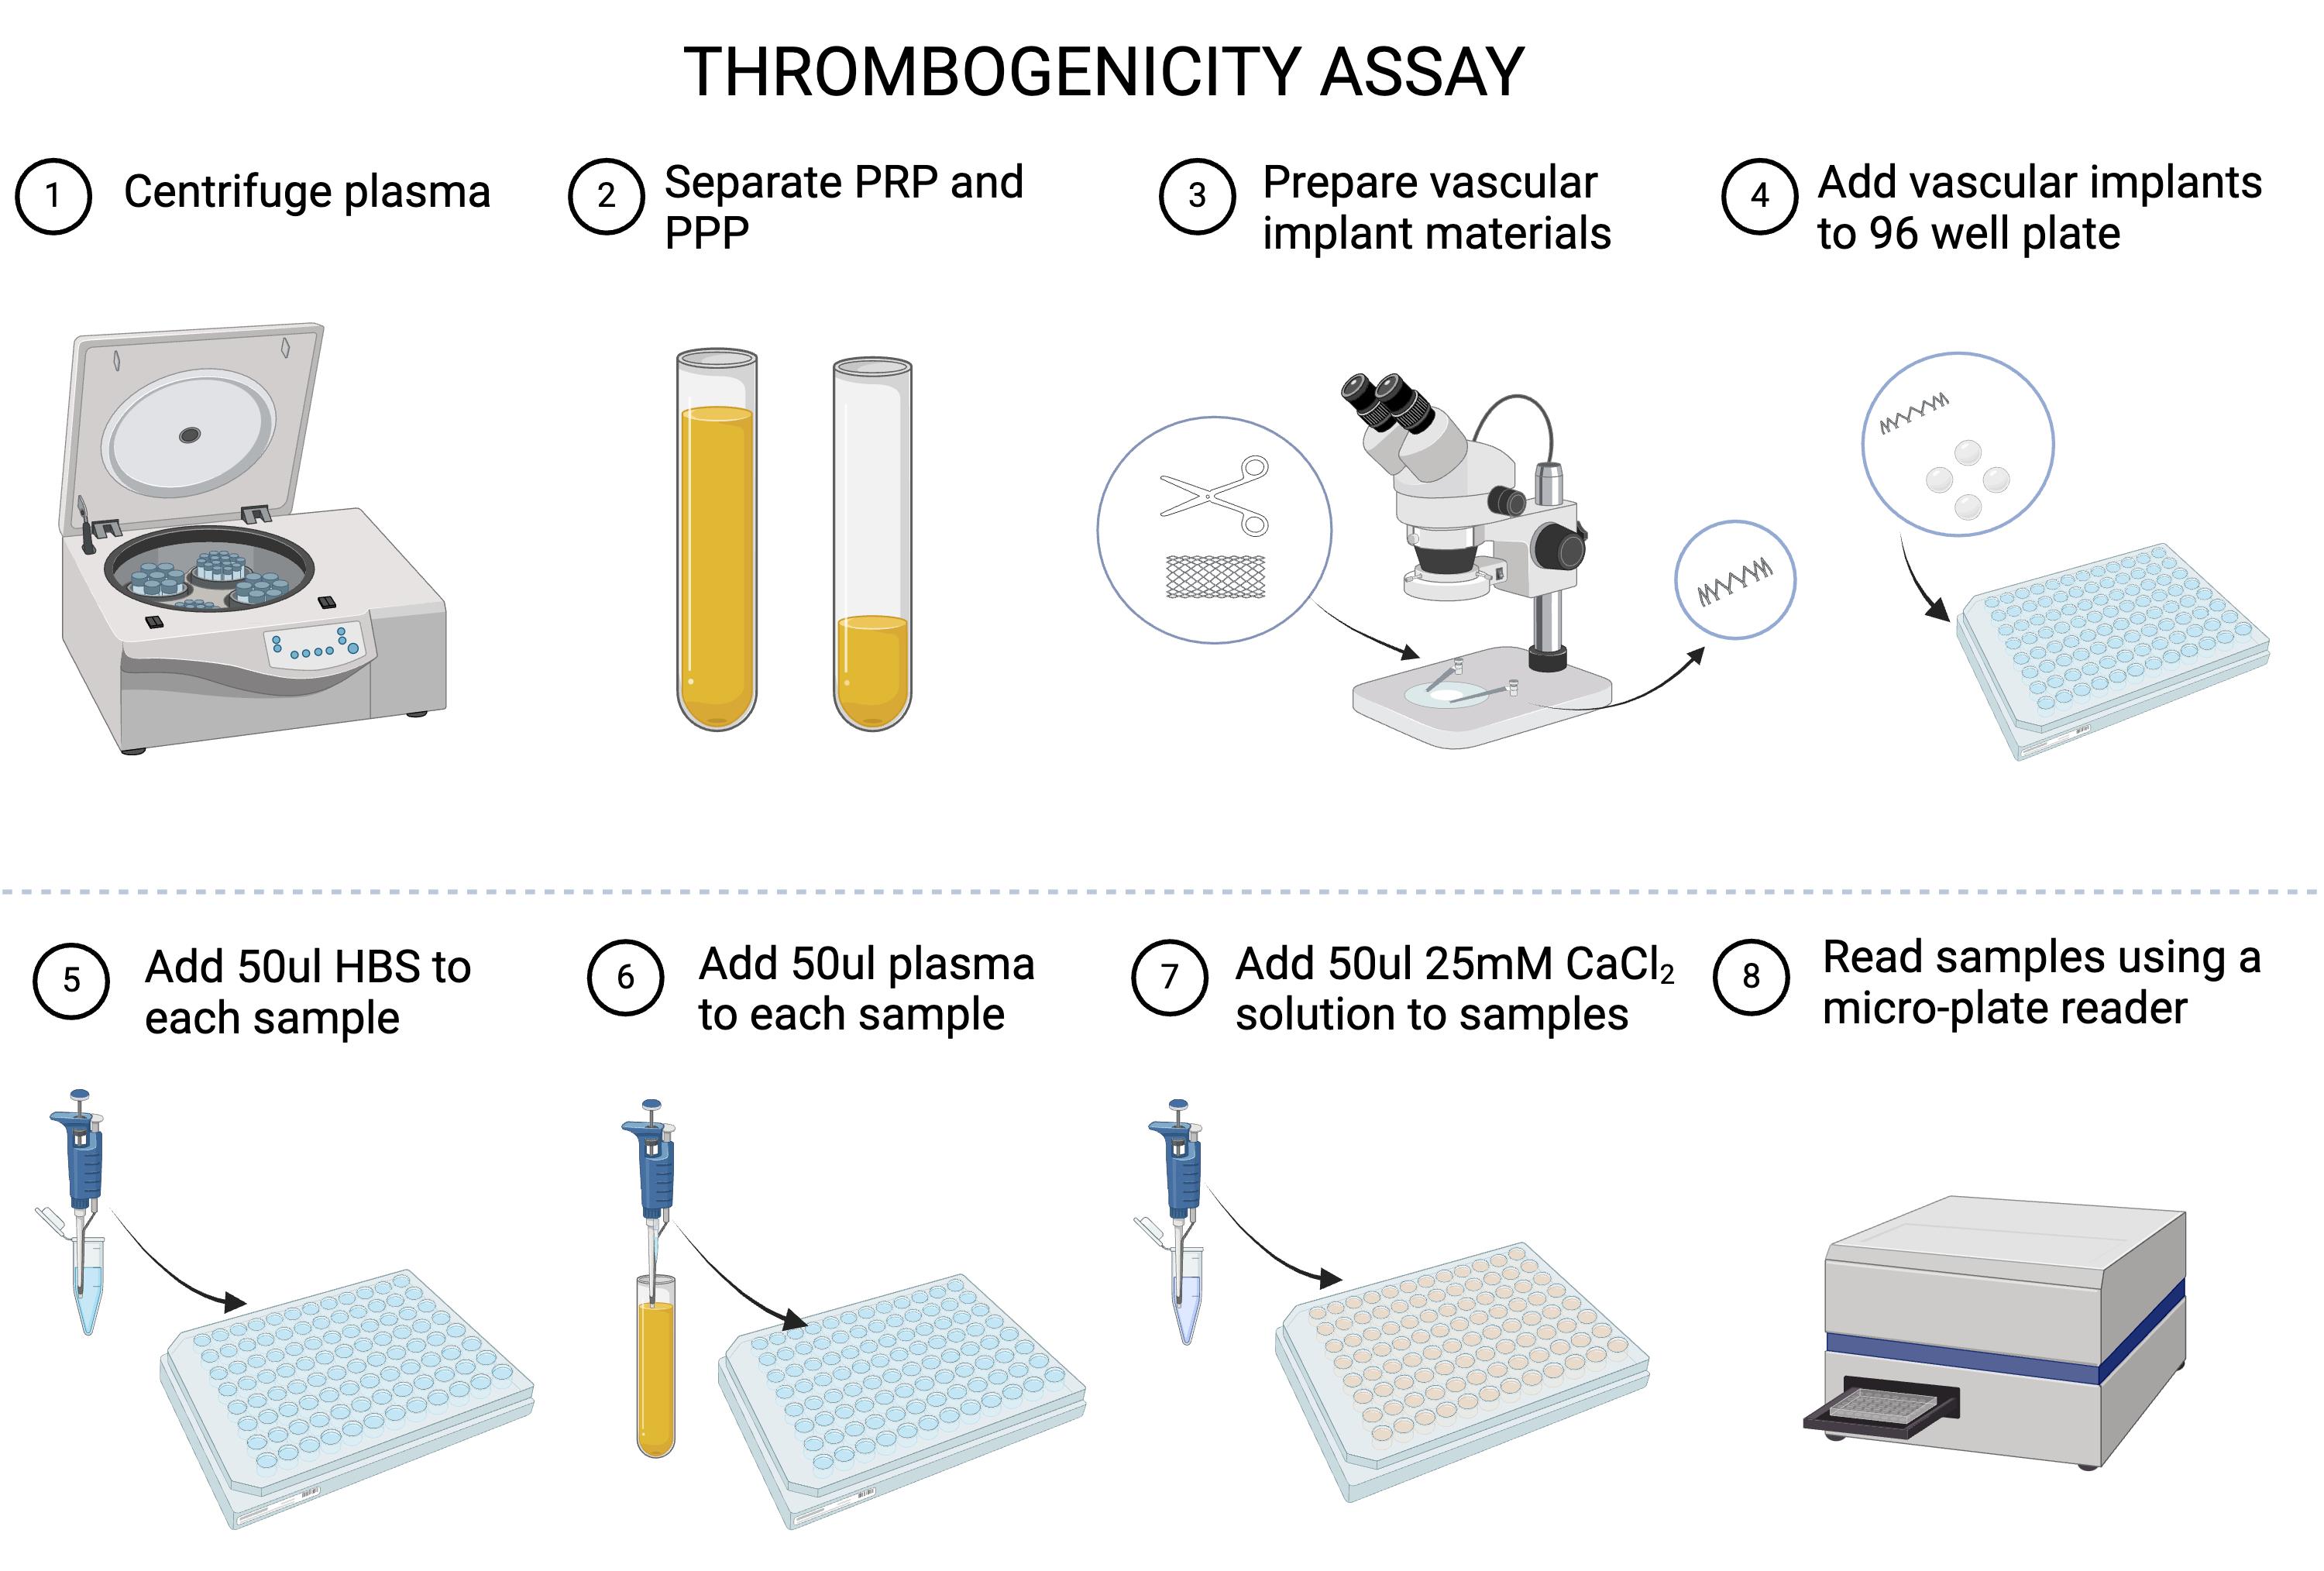
Figure 1. Thrombogenicity flowchart. Graphical overview of the thrombogenicity analysis procedure.
5. Remove PPP and resuspend the platelet pellets by gently shaking the tube. Aliquot the PRP and PPP into 1 mL vials with appropriate labeling.
Pause point #1: Plasma can be frozen at -20 °C; however, thawing and re-freezing will cause platelet exhaustion. Otherwise, plasma can be stored for up to 5 days at 4 °C [6]. See the Troubleshooting section below.
B. Sample preparation
1. Expand vascular stents and stent grafts using the inflator to the pressure as specified on the packaging.
2. Using the stereomicroscope, carefully trim stents to one ring (Figure 2). To maintain a similar surface area between samples, aim to get the cutters as flush as possible with the side of the ring.
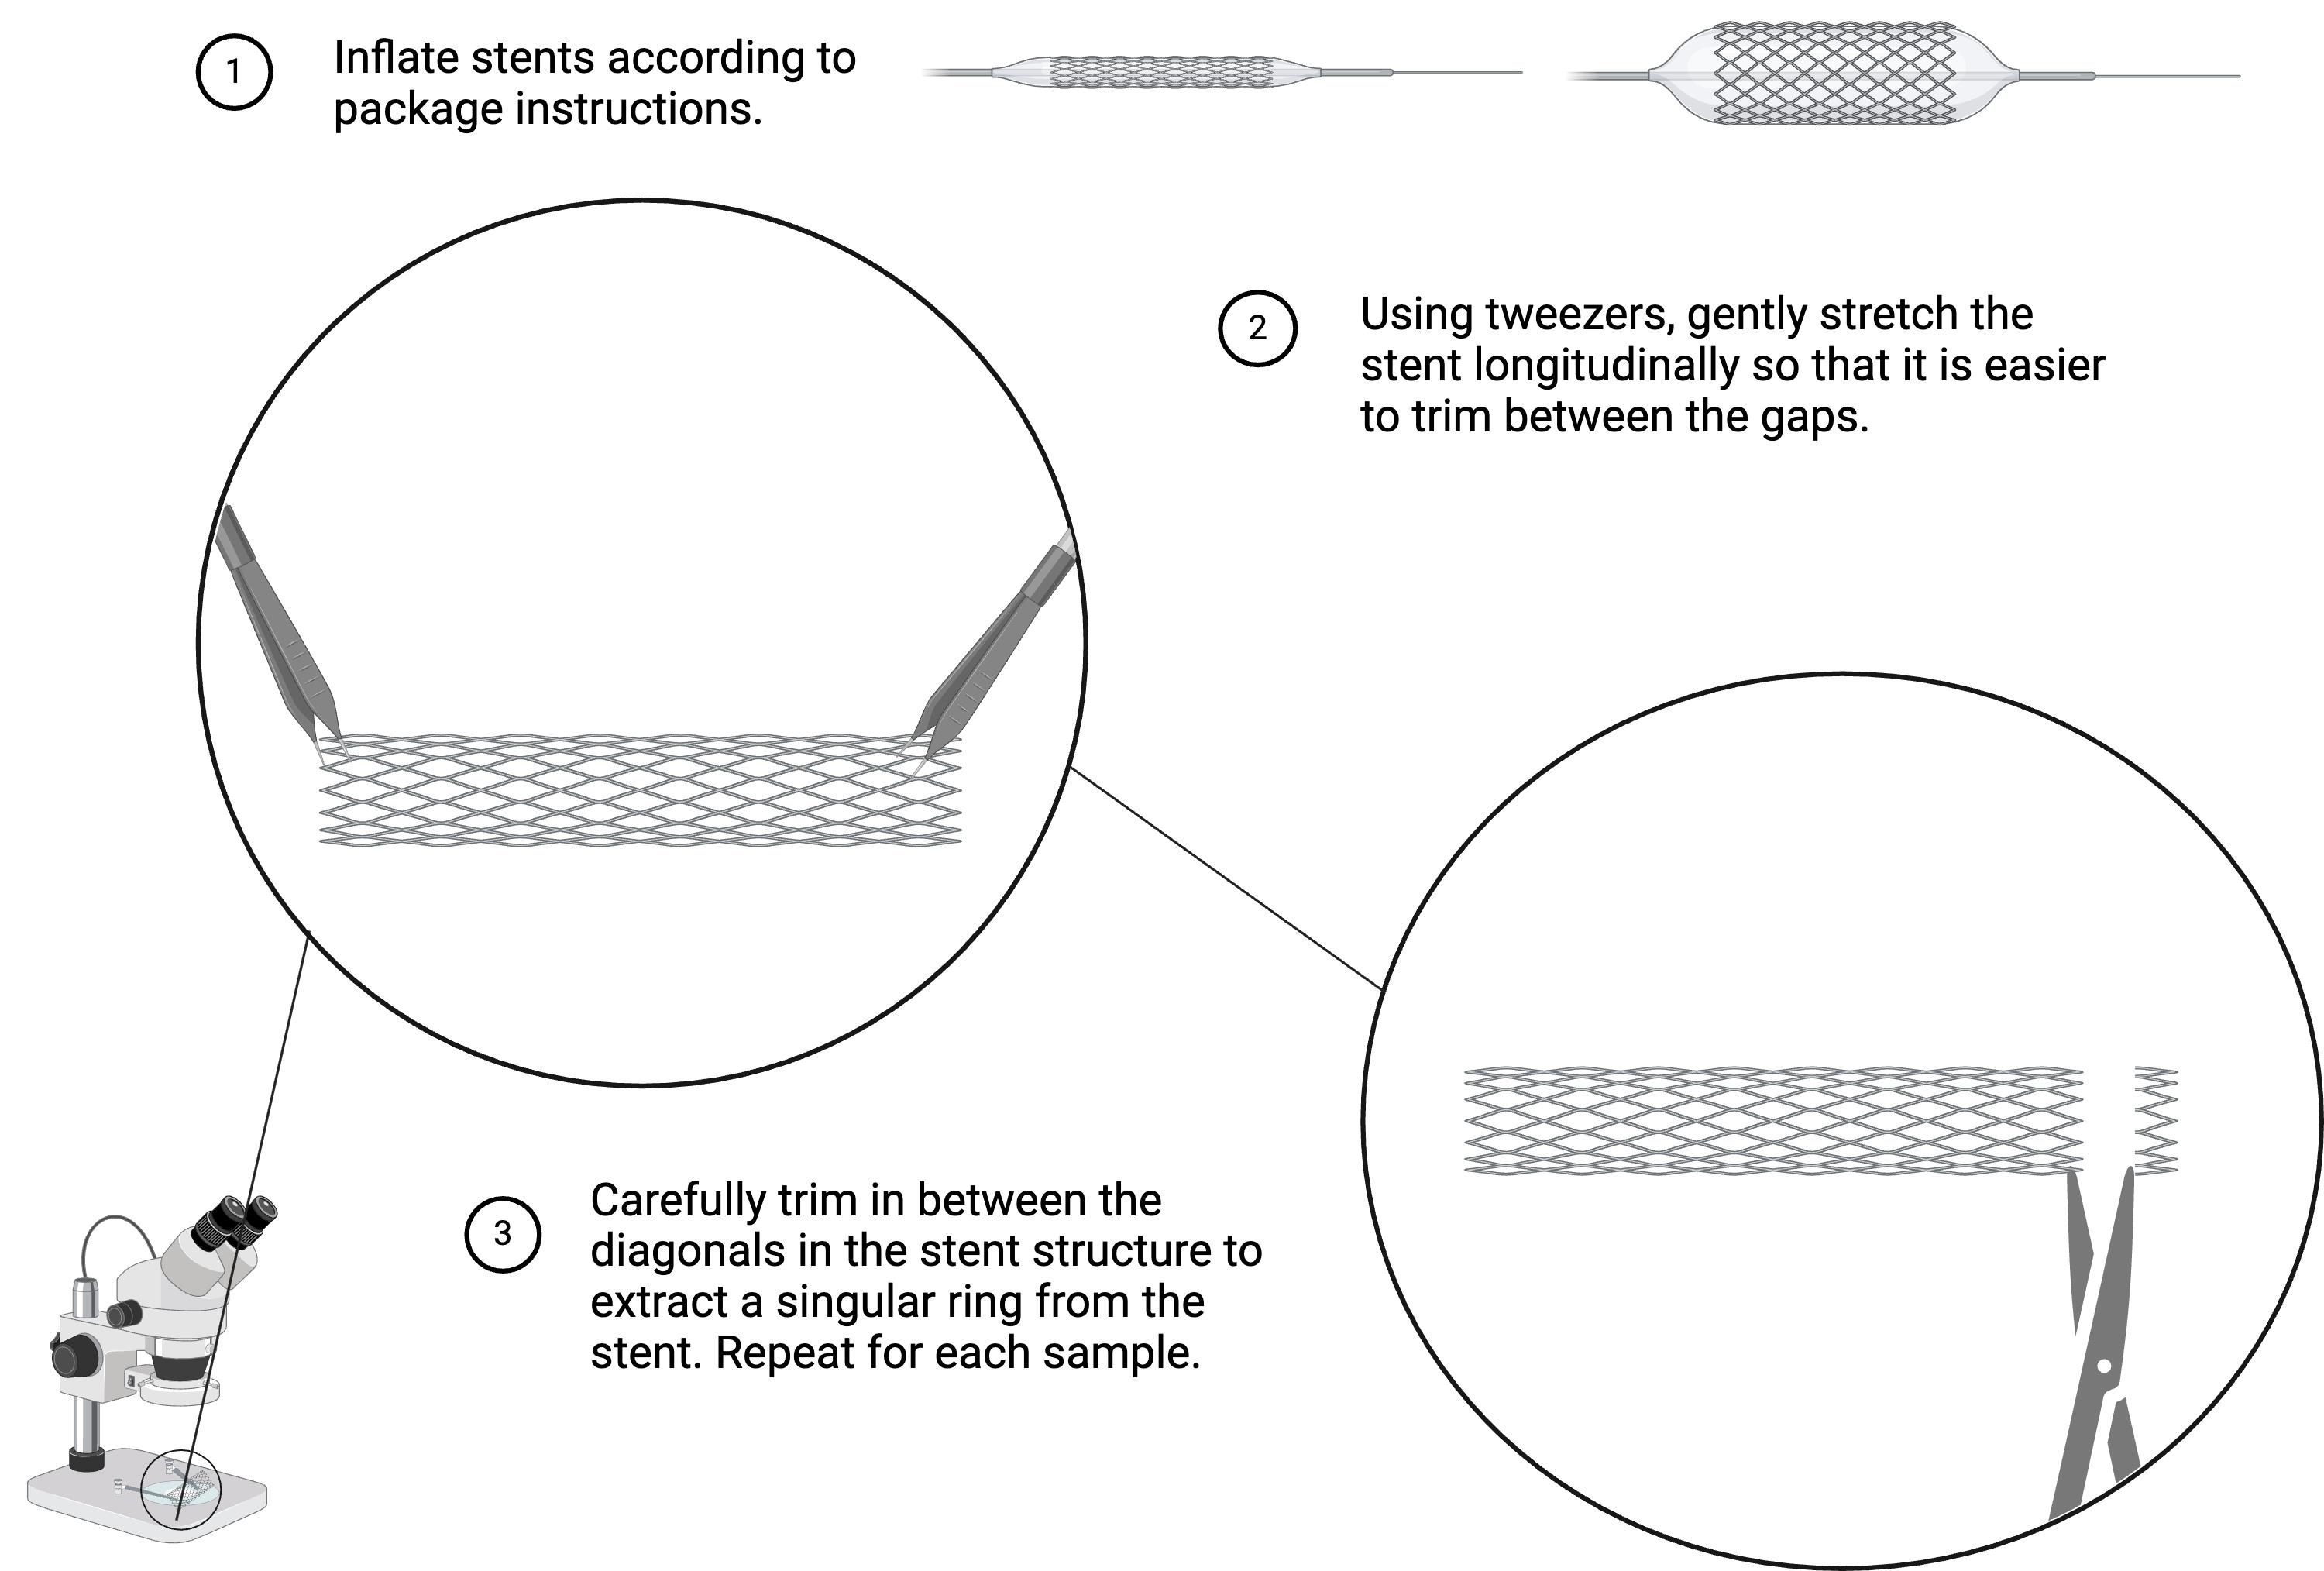
Figure 2. Trimming vascular biomaterials. Preparation of vascular stents and stent-grafts for thrombogenicity analysis. For vascular grafts, carefully trim them laterally into 1 mm thick sections, so that they are roughly the same size as each stent ring.
3. To compare the effects of a molecular coating, prepare the biomaterials as desired, using methods such as dipping and electrospinning to coat the materials. Ensure that the center of each material is hollow, and light can pass through it.
a. Collagen coating:
i. Submerge prepared stents in collagen coating solution for 1 h and then aspirate the remaining solution.
ii. Rinse the prepared stents two times in PBS and dry for 30 min in the desiccator.
iii. Use the collagen-coated stents immediately or store at 2–8 °C for up to one week.
b. Heprasil/heparin thiol coating:
i. Dip the coated stent pieces [7] into 1% solutions of heparin thiol or heprasil for 30 min.
ii. UV cross-link the stent pieces for 1 h.
iii. Use immediately or store the prepared stents at 2–8 °C for up to a week.
4. Add the vascular biomaterial samples to the 96-well plate, placing one sample in each well.
Pause point #2: Samples can be stored for several weeks in a cool, dry, enclosed space.
C. Solution preparation and evaluation at physiological temperature
1. Prepare a warm water bath or digital water bath at 37 °C to thaw the materials.
a. Prepare the calcium chloride solution and warm to 37 °C in the warm water bath.
b. Thaw HEPES buffered saline and PRP/PPP (unless already thawed) in the warm water bath.
2. Make sure the temperature in the plate reader is set to 37 °C. Set the plate reader to a wavelength of 405 nm, reading continuously over 1 h at 50 s intervals (see Figure 1).
D. Absorbance reading
1. Add 50 μL of HEPES buffered saline to each sample in the 96-well plate.
2. Add 50 μL of plasma (PRP or PPP) to each sample in the 96-well plate.
3. Add 50 μL of the 25 mM calcium chloride solution and then immediately place in the plate reader. Read continuously for 1 h at a wavelength of 405 nm.
Critical: Absorbance readings should begin immediately after adding the 25 mM calcium chloride solution. The calcium chloride solution will counteract the anticoagulant in the plasma, initiating clotting.
4. Export the data from the plate reader into Excel.
E. For PRP samples only: data validation
1. Incubate samples with PRP at 37 °C on a shaker for 5 h, shaking at 50 rpm.
2. Wash samples two times with PBS to remove unattached platelets.
3. Fix samples in 2.5 wt.% glutaraldehyde (200 μL per sample) at 4 °C for 8 h.
4. Rinse samples three times with DI/RO water.
5. Dehydrate specimens with 50%, 70%, 95%, and 100% ethanol.
6. Air-dry samples in the desiccator at room temperature.
7. Examine the platelet-adhered surfaces by scanning electron microscopy (SEM).
Data analysis
To illustrate the application of this protocol for thrombogenicity evaluations of biomaterials, we collected and analyzed absorbance data for four types of commercially available vascular implant materials: bare metal stent, drug-eluting stent, vascular graft, and coronary stent graft, all sourced from leading industry manufacturers. The glass coverslip and plasma-only with no materials in the well were used as positive and negative controls, respectively.
To demonstrate the anticoagulant influence on the assessment of biomaterial thrombogenicity, we used PPP with different anticoagulants: Na citrate, Na EDTA, and Na heparin (Figure 3). To demonstrate the platelet influence on the thrombogenicity assessment, Na citrate–containing PRP was also used to assess all six groups of the biomaterials (Figure 4). The results show that clotting occurs more rapidly in platelet-rich plasma. To further illustrate the potential use of this protocol in the development of new biomaterials or implant surfaces, bare metal stents coated with molecules including collagen, heparin thiol, and heprasil were tested in Na citrate–containing PPP along with bare metal stents and positive and negative controls (Figures 5, 6). The results demonstrate that the protocol enables comparison of the efficacy of various functional groups in reducing thrombosis tendency.
For each experiment, we included biological replicates of at least two batches of pooled plasma for each anticoagulant type and technical replicates of 12 samples for each vascular implant. A minimum of 12 samples is suggested for significant results. The continuous absorbance changes over time for biomaterials in PPP or PRP were plotted as averages of all replicates, either combined for group comparisons or shown separately with associated uncertainty (Figures 3A, 4A, and 5A). Absorbance data and analysis graphs were plotted using MATLAB. These scripts are included in the supplementary information. To determine the time for each individual sample to begin clotting, we calculated the time for the absorbance to reach 110% of the baseline value. This value was chosen because it was high enough over the baseline to remove any unnecessary noise and show significant clotting differences. Results of average clotting start times for all groups were compared using box plots to illustrate the dataset distribution (Figures 3B, 4B, and 5B) and bar plots to display the mean values with datasets (see Supplementary information). One-way ANOVA tests, followed by Tukey and Bonferroni multiple comparison post-hoc analyses, were conducted to assess the differences in clotting start time among all six groups in each experiment.
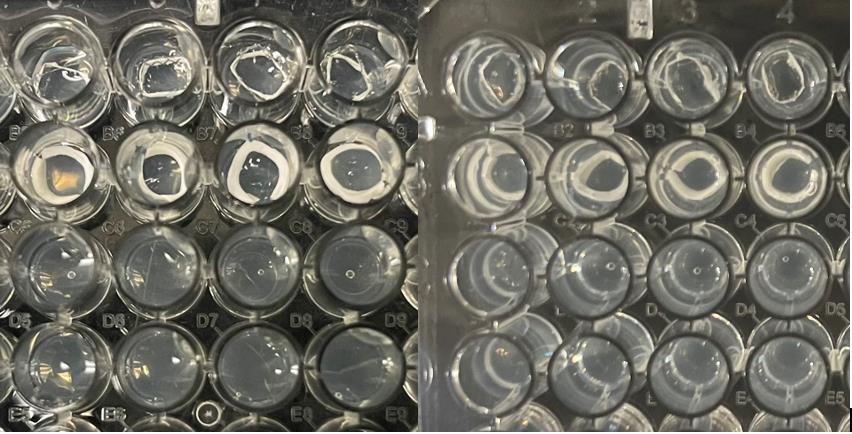
Figure 3. Samples before (left) and after (right) clotting initiation. Stent-graft (row A), graft (row B), positive control (row C), and negative control (row D) were submerged in plasma, and clotting was initiated and evaluated for 1 h.
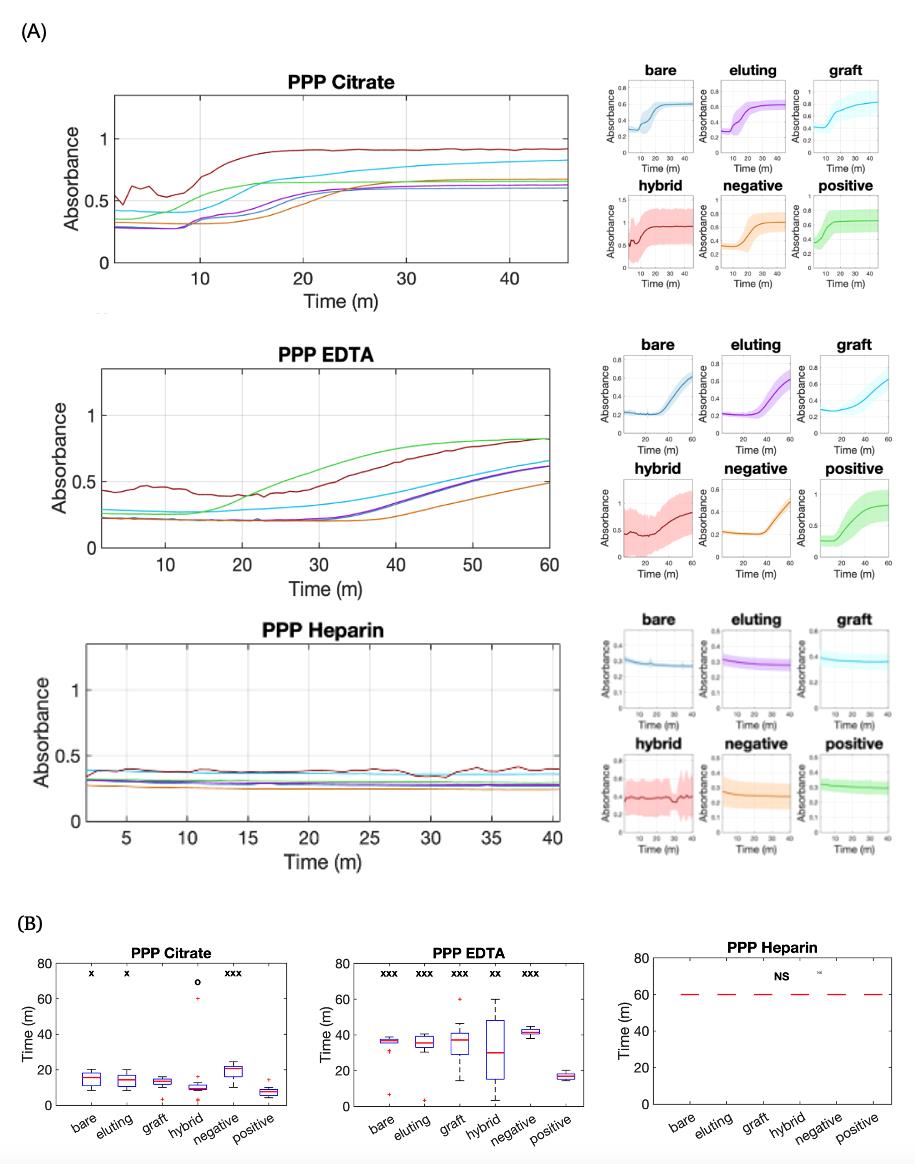
Figure 4. Analysis of plasma absorbance curves for thrombogenicity comparisons of vascular materials in platelet-poor plasma (PPP) with different anticoagulants. (A) Continuous absorbance change over time for bare metal stent (bare), Zotarolimus-eluting stent (eluting), vascular graft (graft), stent graft (hybrid), glass coverslip (positive), and no materials (negative) in PPP with Na Citrate, Na EDTA, and Na Heparin. The left panels present overlapping curves representing the average values for material conditions, while the right panels plot data for each material individually, with continuous lines indicating the average values and shaded regions representing the standard deviation. (B) Box plots of clotting start times for all six groups. x: p < 0.05, xx: p < 0.01, xxx: p < 0.001 when compared to the positive control. o: p < 0.05 when compared to the negative control. NS: No significant clotting.
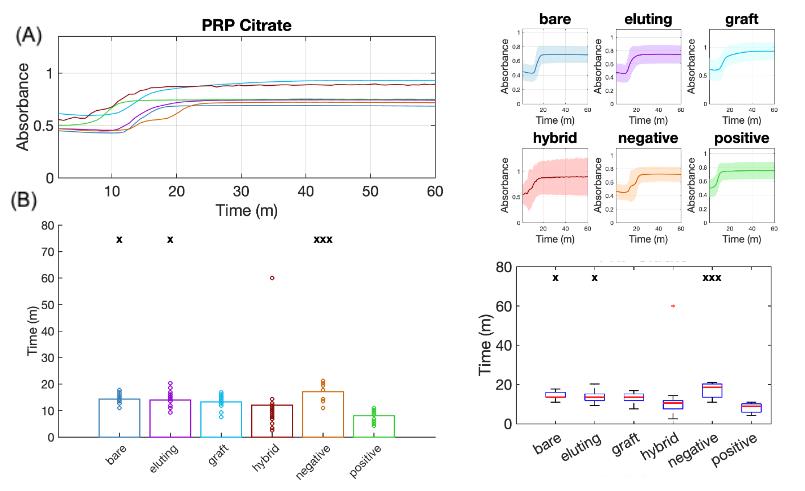
Figure 5. Analysis of plasma absorbance curves for thrombogenicity comparisons of vascular materials in platelet-rich plasma (PRP) illustrating platelet effects. (A) Continuous absorbance change over time for all six material groups, using sodium citrate as the anticoagulant in PRP. (B) Bar plots (left) and box plots (right) showing comparisons of clotting start times among groups. x: p < 0.05, xx: p< 0.01, xxx: p < 0.001 when compared to the positive control.
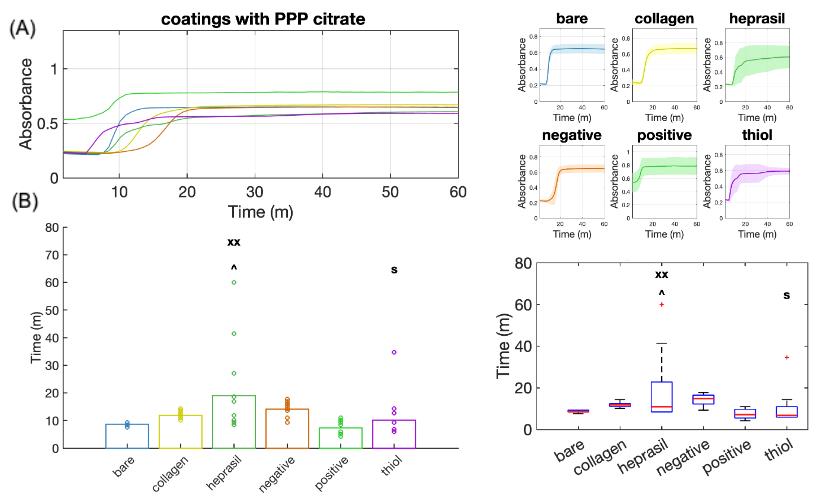
Figure 6. Analysis of plasma absorbance curves for thrombogenicity comparisons of vascular stents with different molecular coatings. (A) Continuous absorbance changes over time for all six material groups, using sodium citrate as the anticoagulant in platelet-poor plasma (PPP). (B) Bar plots (left) and box plots (right) showing comparisons of clotting start times among groups. xx: p < 0.01 when compared to the negative control. ^: p < 0.05 when compared to the thiol group. $: p < 0.05 when compared to the heprasil group.
Validation of protocol
The sample size for each group is n = 16–18. ANOVA data analysis and Tukey and Bonferroni multiple comparison post hoc tests were performed to determine significance between test groups. Significant differences occur with a p-value of p < 0.05. The positive control was glass, the negative control was plasma, and the clinical control was a bare stent.
This protocol was used in:
• Bates et al. [2]. Evaluation of the Effect of Crosslinking Method of Poly(Vinyl Alcohol) Hydrogels on Thrombogenicity. Cardiovasc Eng Technol. 11(4):448–455. doi: 10.1007/s13239-020-00474-y.
• Keeling et al. [8]. Pharmacologic targeting of coagulation factors XII and XI by monoclonal antibodies reduces thrombosis in nitinol stents under flow. J Thromb Haemost. 22(5):1433–1446. doi: 10.1016/j.jtha.2024.01.023.
• Bates et al. [9]. Bioconjugation of a Collagen-Mimicking Peptide Onto Poly(vinyl alcohol) Encourages Endothelialization While Minimizing Thrombosis. Front Bioeng Biotechnol. 8: 621768. doi: 10.3389/fbioe.2020.621768.
General notes and troubleshooting
General notes
1. One may argue that the trimming of various biomaterials changes their thrombogenicity; however, the thrombogenicity will be changed for all vascular materials in this procedure equally.
2. This thrombogenicity analysis is highly dependent on the surface area of the sample. Ensure samples have a similar surface area.
3. Trimming the biomaterials unevenly can lead to variance among samples in the same group, as seen in Figure 3, where the hybrid group shows more of a standard deviation due to the difficulty level of trimming the sample.
4. To process data from the plate reader into the MATLAB script, see Figure 7 and File S1.
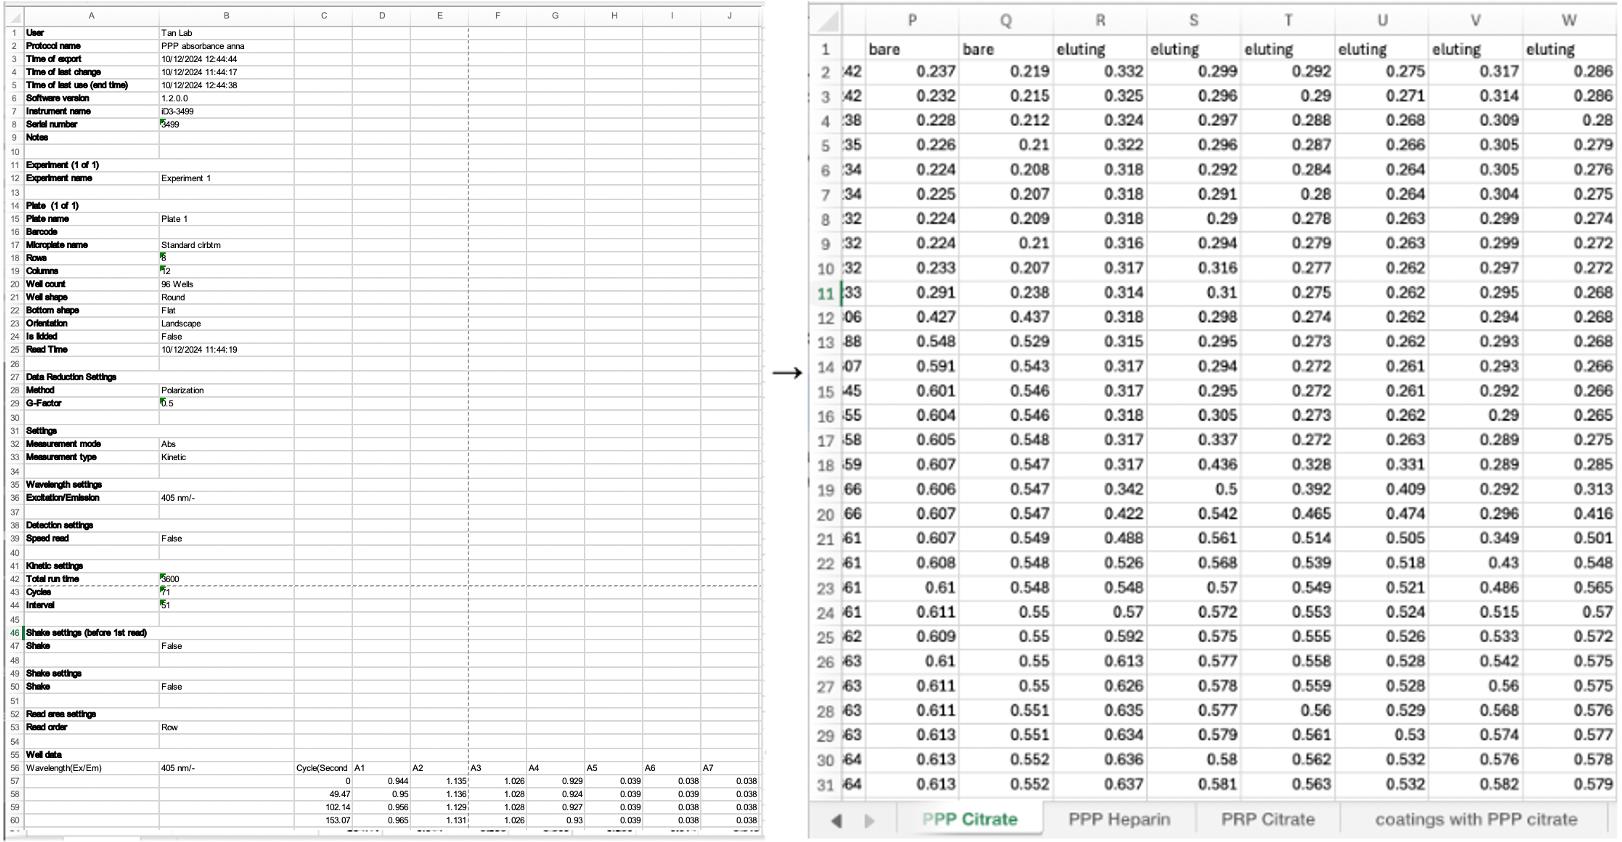
Figure 7. When transferring data from the plate reader to excel, organize the rows by sample type and name the sheet number by the anticoagulant
Troubleshooting
| Problem | Solution |
|---|---|
| 1. Platelet scarcity, noticeable increases in clotting time, or no clotting at all. | If not properly handled, the platelets may lyse and/or have minimal activation [10]. Prepare a new batch of plasma and do not thaw more than once. Use PPP if the plasma is frozen and thawed multiple times. |
| 2. No clotting of any test group, when clotting is expected to occur. | Ensure that the temperature in the plate reader is accurate and that the solutions are warmed to 37.5 °C. The absence of clotting could also be due to platelet scarcity; see troubleshooting 1. |
| 3. Variability within sample groups. | Ensure that samples are trimmed to the same size and have similar surface area. Use materials of the same or similar radius. Any stents or grafts that did not fall into the correct size or surface area should be removed. |
Supplementary information
The following supporting information can be downloaded here:
1. File S1. MATLAB Code
Acknowledgments
Specific contributions of each author: Conceptualization: W.T., N.M.K.; Investigation, W.T., N.M.K., A.S., A.D., A.B., R.J. Writing—Original Draft, A.S.; Writing—Review & Editing, A.S., W.T., N.M.K.; Funding acquisition, W.T.; Supervision, W.T., N.M.K.
Funding sources that supported the work: NHLBI R01HL119371
This protocol was adapted for biomaterial use by N.M.K. and used previously in [7].
This protocol was modified from methods reported in [8] and [11].
The supplementary MATLAB code was edited with the help of ChatGPT.
Competing interests
The authors declare no conflicts of interest.
Ethical considerations
Plasma was collected by donation, and informed consent was obtained for all individuals.
References
- Stavrou, E. and Schmaier, A. H. (2010). Factor XII: What does it contribute to our understanding of the physiology and pathophysiology of hemostasis & thrombosis. Thromb Res. 125(3): 210–215. https://doi.org/10.1016/j.thromres.2009.11.028
- Bates, N. M., Puy, C., Jurney, P. L., McCarty, O. J. T. and Hinds, M. T. (2020). Evaluation of the Effect of Crosslinking Method of Poly(Vinyl Alcohol) Hydrogels on Thrombogenicity. Cardiovasc Eng Technol. 11(4): 448–455. https://doi.org/10.1007/s13239-020-00474-y
- Zhang, J., Zhang, J., Zhang, N., Li, T., Zhou, X., Jia, J., Liang, Y., Sun, X. and Chen, H. (2020). The Effects of Platelet-Rich and Platelet-Poor Plasma on Biological Characteristics of BM-MSCs In Vitro. Anal Cell Pathol. 2020: 1–11. https://doi.org/10.1155/2020/8546231
- Barbosa, A. C. N., Montalvão, S. A. L., Barbosa, K. G. N., Colella, M. P., Annichino-Bizzacchi, J. M., Ozelo, M. C. and De Paula, E. V. (2019). Prolonged APTT of unknown etiology: A systematic evaluation of causes and laboratory resource use in an outpatient hemostasis academic unit. Res Pract Thromb Haemost. 3(4): 749–757. https://doi.org/10.1002/rth2.12252
- Dhurat, R. and Sukesh, M. (2014). Principles and methods of preparation of platelet-rich plasma: A review and author’s perspective. J Cutan Aesthet Surg. 7(4): 189. https://doi.org/10.4103/0974-2077.150734
- A Guide to Plasma Thawing & Storage: Boekel. (2024). Boekelsci, https://www.boekelsci.com/news/plasma-thawing-guide.html, Accessed Dec 7, 2024
- Iglesias-Echevarria, M., Johnson, R., Rafuse, M., Ding, Y. and Tan, W. (2020). Vascular Grafts with Tailored Stiffness and a Ligand Environment via Multiarmed Polymer Sheath for Expeditious Regeneration. ACS Appl Bio Mater. 4(1): 545–558. https://doi.org/10.1021/acsabm.0c01114
- Keeling, N. M., Wallisch, M., Johnson, J., Le, H. H., Vu, H. H., Jordan, K. R., Puy, C., Tucker, E. I., Nguyen, K. P., McCarty, O. J., et al. (2024). Pharmacologic targeting of coagulation factors XII and XI by monoclonal antibodies reduces thrombosis in nitinol stents under flow. J Thromb Haemost. 22(5): 1433–1446. https://doi.org/10.1016/j.jtha.2024.01.023
- Bates, N. M., Heidenreich, H. E., Fallon, M. E., Yao, Y., Yim, E. K. F., Hinds, M. T. and Anderson, D. E. J. (2020). Bioconjugation of a Collagen-Mimicking Peptide Onto Poly(vinyl alcohol) Encourages Endothelialization While Minimizing Thrombosis. Front Bioeng Biotechnol. 8: e621768. https://doi.org/10.3389/fbioe.2020.621768
- Reitsma, S. E., Pang, J., Raghunathan, V., Shatzel, J. J., Lorentz, C. U., Tucker, E. I., Gruber, A., Gailani, D., McCarty, O. J. T., Puy, C., et al. (2021). Role of platelets in regulating activated coagulation factor XI activity. Am J Physiol, Cell Physiol. 320(3): C365–C374. https://doi.org/10.1152/ajpcell.00056.2020
- Sylman, J. L., Daalkhaijav, U., Zhang, Y., Gray, E. M., Farhang, P. A., Chu, T. T., Zilberman-Rudenko, J., Puy, C., Tucker, E. I., Smith, S. A., et al. (2017). Differential Roles for the Coagulation Factors XI and XII in Regulating the Physical Biology of Fibrin. Ann Biomed Eng. 45(5): 1328–1340. https://doi.org/10.1007/s10439-016-1771-7
Article Information
Publication history
Received: Dec 20, 2024
Accepted: Apr 8, 2025
Available online: May 8, 2025
Published: May 20, 2025
Copyright
© 2025 The Author(s); This is an open access article under the CC BY-NC license (https://creativecommons.org/licenses/by-nc/4.0/).
How to cite
Sallee, A., Battistella, A., Johnson, R., Duong, A., Tan, W. and Keeling, N. M. (2025). Quantifying Thrombogenicity: A Bioanalytical Protocol for the Absorbance-Based Assessment of Vascular Implants with Plasma. Bio-protocol 15(10): e5316. DOI: 10.21769/BioProtoc.5316.
Category
Medicine > Cardiovascular system
Biological Engineering > Biomedical engineering
Do you have any questions about this protocol?
Post your question to gather feedback from the community. We will also invite the authors of this article to respond.