- Protocols

- Articles and Issues
- For Authors
- About
- Become a Reviewer

Standardized Flow Cytometry Method for Absolute Counting of Intraepithelial Lymphocytes in the Intestinal Mucosa Using TruCountTM Beads
(*contributed equally to this work) Published: Vol 15, Iss 9, May 5, 2025 DOI: 10.21769/BioProtoc.5307 Views: 2234
Reviewed by: Pilar Villacampa AlcubierreMinal EngavaleAnonymous reviewer(s)

Protocol Collections
Comprehensive collections of detailed, peer-reviewed protocols focusing on specific topics


Abstract
In the intestinal epithelium, intraepithelial lymphocytes (IELs) coexist with intestinal epithelial cells (IECs). The IELs have an important role in defending the intestinal tract against pathogens and eliminating tumor cells. Anomalies in the absolute IEL count have been reported in various digestive diseases. IELs are typically counted using histologic techniques or under light microscopy after isolation of the epithelium. However, these techniques can introduce bias, which might account for the discrepancies in counts from one study to another. Here, we describe a flow cytometry assay for determining the absolute IEL count and the IEL/IEC ratio. We combined a conventional epithelial isolation method with a BD TruCountTM bead-based absolute counting technique to quantify IELs (CD45+ CD326/EpCAM- CD103+CD3+) and IECs (CD45- CD326/EpCAM+) in a C57BL/6 mouse model.
Key features
• Intraepithelial lymphocytes (IELs) play a crucial role in maintaining mucosal integrity and defending against pathogens.
• Conventional manual counting of IELs using a hemocytometer relies heavily on the operator's expertise.
• Flow cytometry offers a more standardized approach to cell counting.
• Using TruCountTM beads to quantify IELs and intraepithelial cells (IECs) by flow cytometry and assess their ratio ensures reproducibility and comparison with immunohistochemical methods.
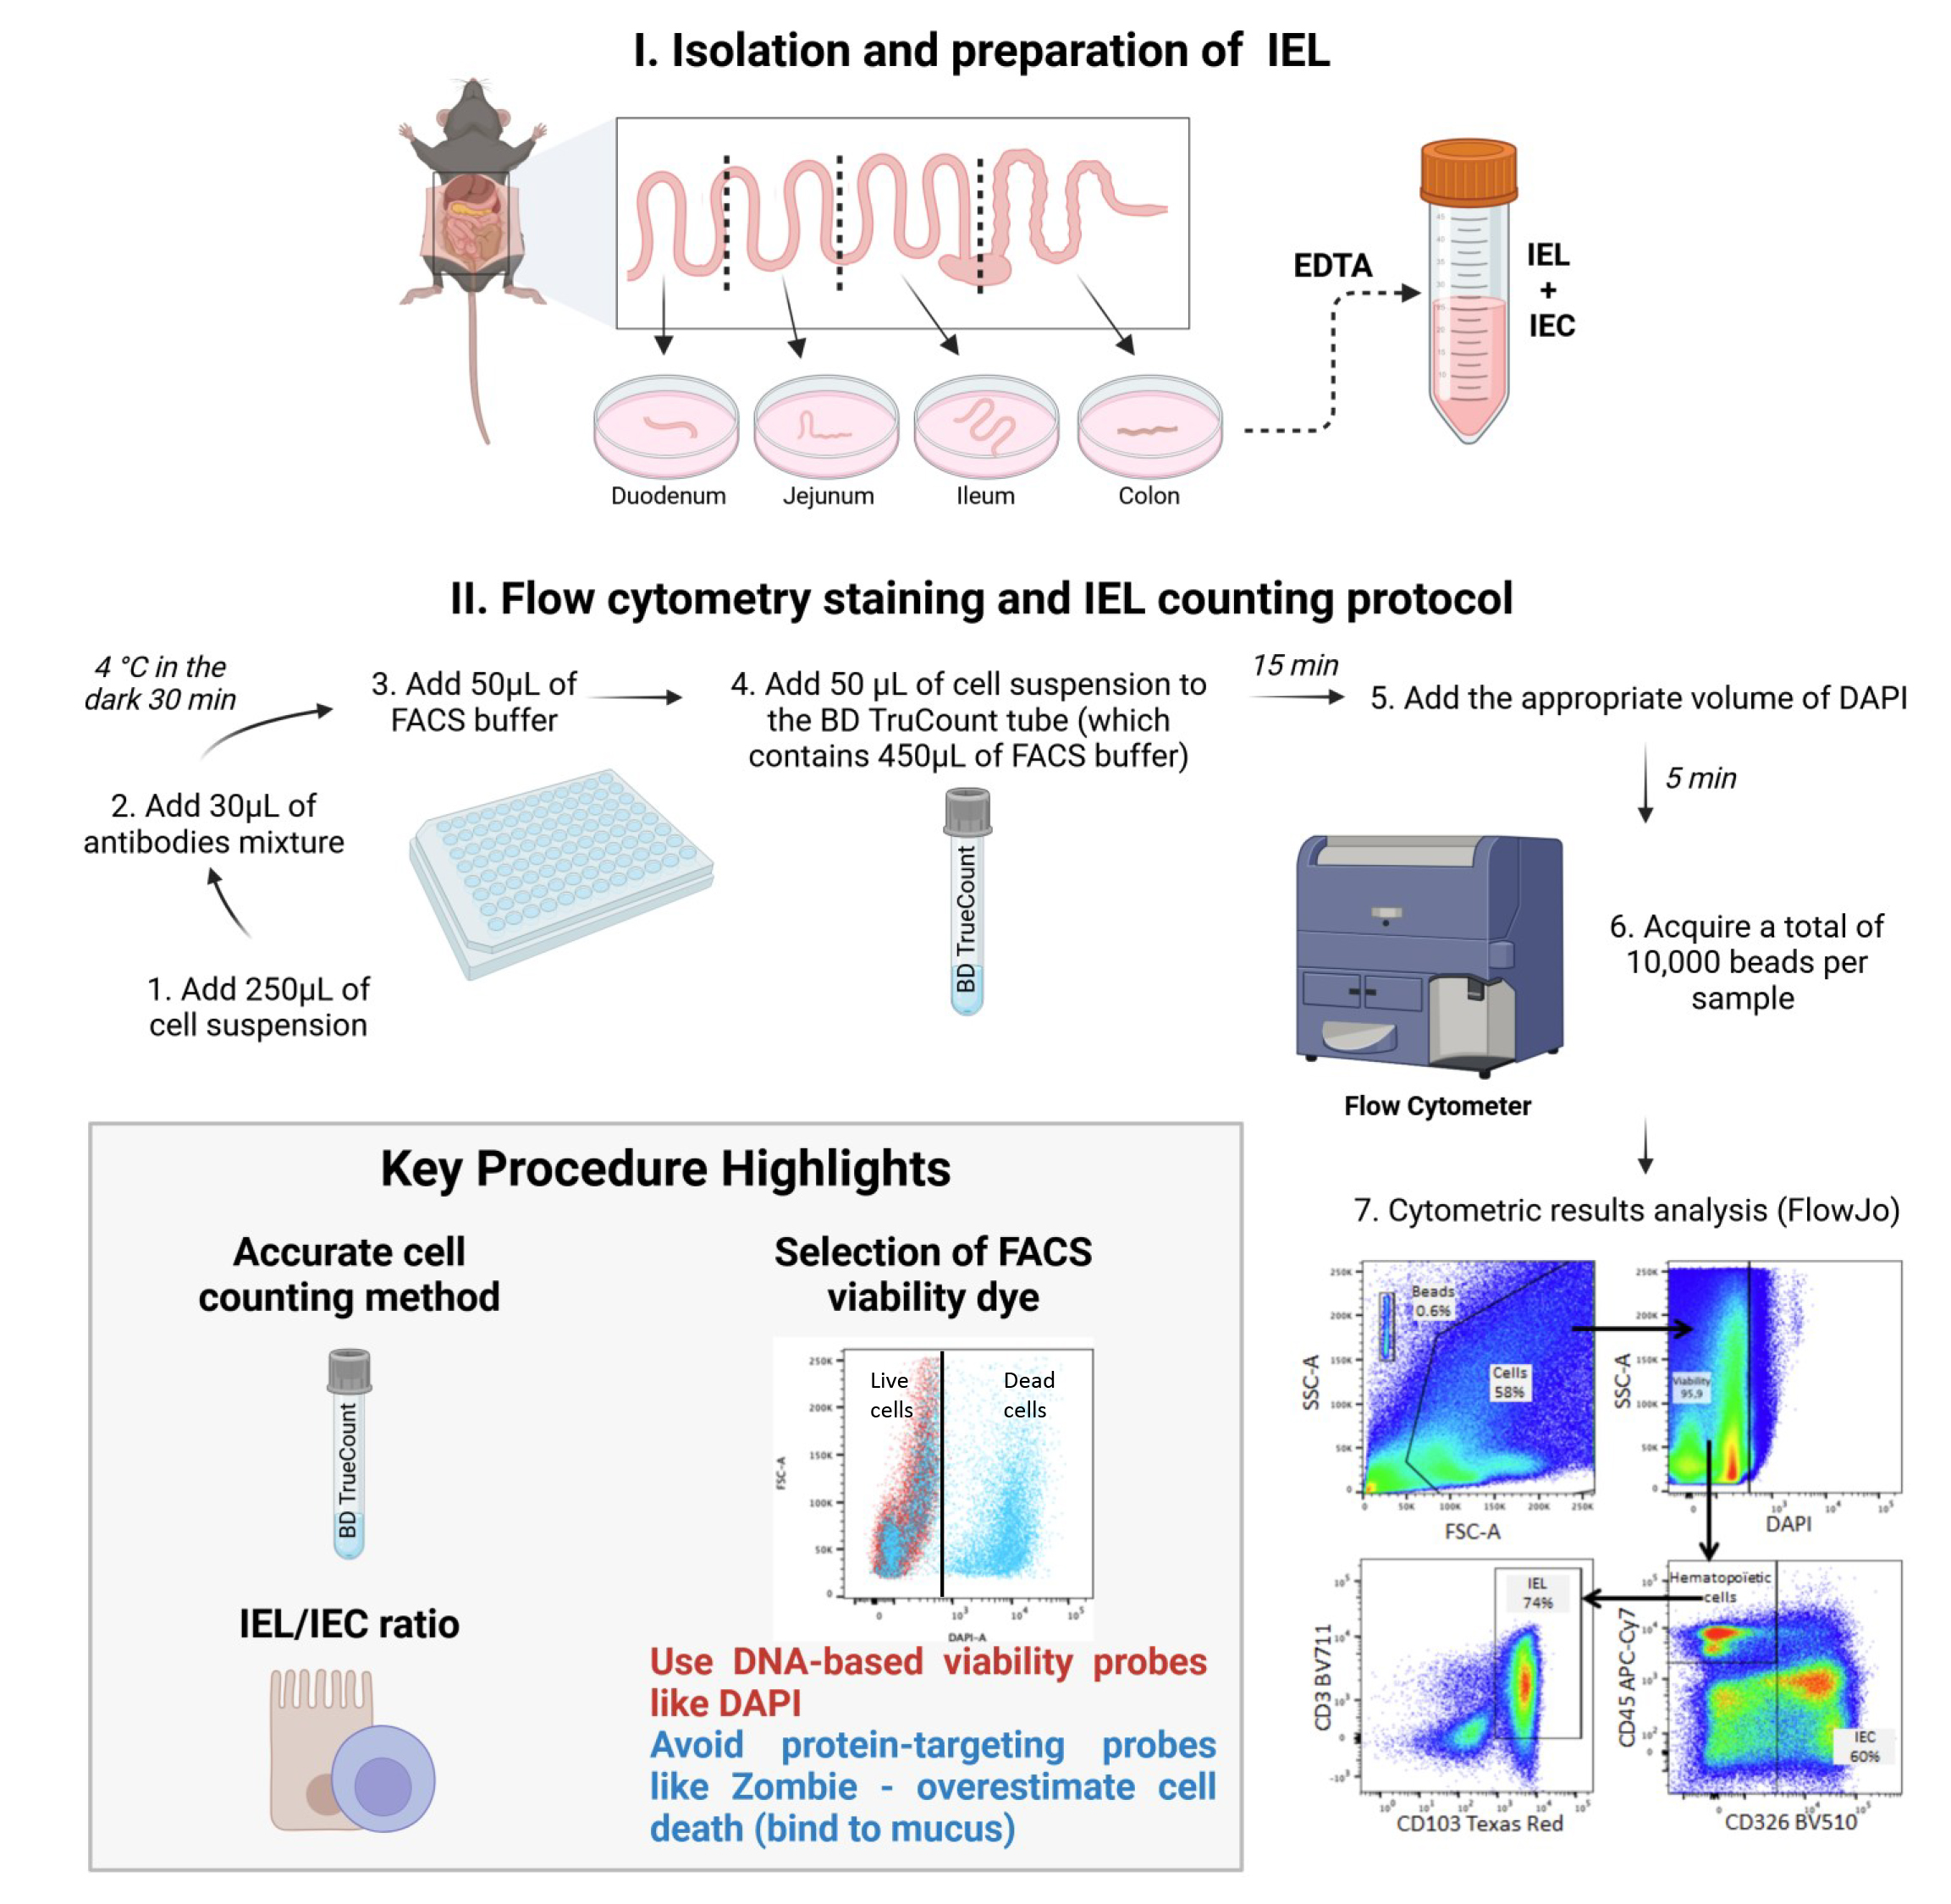
Keywords: Intraepithelial lymphocytesGraphical overview
Background
Intestinal intraepithelial lymphocytes (IELs) are located between the epithelial cells of the digestive tract and can be divided into two main subpopulations: natural IELs and induced IELs. Natural IELs are mainly composed of γδT lymphocytes that develop and reside in the intestinal epithelium. In contrast, induced IELs are conventional CD4 and CD8 peripheral αβ T cells that migrate into the epithelium in response to antigens. Furthermore, small numbers of lymphocytes that do not express the T-cell receptor (TCR), such as intracytoplasmic (i)CD8 and iCD3 cells and type 1 innate lymphoid cells, are present in the epithelium.
IELs serve as the first line of defense against enteric pathogens and are vital for maintaining intestinal homeostasis [1]. Once activated, IELs are able to eliminate pathogens through the secretion of pro-inflammatory cytokines [e.g., interferon gamma (IFNγ)] and cytotoxic molecules (e.g., granzyme and perforin). These cells also have a regulatory role in the epithelium through the secretion of anti-inflammatory cytokines like interleukin (IL)-10 and transforming growth factor beta (TGF-β).
An imbalance in IEL inflammatory responses can significantly affect intestinal mucosa integrity. In celiac disease, for example, the unchecked expansion of IELs leads to the destruction of intestinal epithelial cells (IECs) and the atrophy of villi [2]. In patients with colorectal cancer, a greater number of TCRγδ IELs with a strong cytotoxic profile in the area around the tumor is associated with a lower risk of metastasis [3]. Although the specific role of this population in tumor cell regulation and elimination is not fully understood, one can hypothesize that deficiencies in this population substantially affect the patient’s response to treatments in general and to immunotherapy more specifically. Furthermore, many studies have documented anomalies in the total IEL count in various digestive pathologies [4].
Thus, an accurate assessment of the absolute IEL count is of great importance. A widely used approach for counting IELs involves analyzing histological sections. This multi-step process, including tissue fixation, paraffin embedding, block sectioning, slide mounting, and antibody labeling, extends experiment time compared to cytometric methods. Additionally, cell counting requires independent double readings by trained operators, similar to conventional hemocytometer counting of cell suspensions obtained after the epithelium has been detached from the rest of the mucosa, which also demands multiple readings by experienced personnel. So, a standardized procedure for counting IELs is lacking. Some experts express the IEL count with regard to the weight of the tissue, while others normalize it against the IEC count in the same sample. This lack of methodological consensus might explain the great disparities observed from one publication to another.
Recently, Lockhart et al. [5] employed flow cytometry to phenotype IELs and used BD TruCountTM beads to yield the absolute IEL count in murine intestinal mucosa. The high-precision BD TruCountTM procedure described below goes a step further by counting not only IELs but also IECs as an internal control in each sample, to ensure the assay’s reproducibility. Indeed, our flow cytometry technique is the first to have used BD TruCountTM beads to provide the absolute IEL account and the IEL/IEC ratio. The IEL population is phenotypically identified by the expression of CD3 and CD103, while the epithelial population is characterized by the expression of CD326/EpCAM+. Moreover, unlike cells of hematopoietic origin such as IELs, IECs do not express the CD45 marker. During the development of this protocol, we observed that protein-based viability probes, such as Zombie dye, resulted in an overestimation of the percentage of dead cells compared to nuclear viability probes like DAPI. Indeed, mucus that remains adherent to epithelial cells nonspecifically catches protein-based viability probes and is therefore responsible for off-target binding. This overestimation subsequently biased the IEL count when compared to conventional microscopic counting. This finding underscores the importance of carefully selecting the viability probe when using this type of assay. We believe that our assay protocol will help to advance research in this field by providing a new tool for studying IEL density in the intestinal epithelium and, potentially, in other mucosal tissues. Through its use of commercially available reagents and antibodies, this flow cytometry–based protocol offers the advantages of (i) standardization, ensuring reproducibility and, therefore, the reliability of results, (ii) time efficiency, as it reduces the overall duration of the process, (iii) reduced workforce requirements, as it minimizes the need for multiple operators, and (iv) improved practicality, as it simplifies implementation while maintaining accuracy. This method is applicable to all rodent models used in the laboratory, with the main limitation being the availability of suitable antibodies for cytometry, which may not exist for all species. The protocol can also be adapted for human samples, though adjustments in reagent quantities will be necessary due to variations in specimen size.
Materials and reagents
Biological materials
1. Female, 8-week-old C57BL/6 mice (Envigo, bred and maintained at the Faculté de Pharmacie de Paris, Université Paris Cité, Paris, France) (the results of 10 mice were compiled for the study)
Reagents
1. RPMI-GlutaMAX medium (Gibco, catalog number: 22400089)
2. HBSS (Gibco, catalog number: 14170088)
3. DPBS (Gibco, catalog number: 14190144)
4. Fetal bovine serum (FBS) (Eurobioscientific, catalog number: CVFSVF0601)
5. Gentamicin (Gibco, catalog number: 15710064)
6. Penicillin-streptomycin (Gibco, catalog number: 15140122)
7. DTT (Sigma-Aldrich, catalog number: D55455G)
8. EDTA (Invitrogen, catalog number: AM9260G)
9. BD TruCountTM tubes (BD Bioscience, catalog number: 48000)
10. Antibodies (see Table 1)
11. DAPI viability probe (Thermo Fischer, catalog number: D1306)
Caution: In this procedure, it is essential to use a viability probe that specifically binds to DNA, rather than protein-targeting probes like Zombie dye, to prevent overestimation of cell death.
Table 1. List and preparation of antibodies and reagents used in the staining protocol
| Name | Target | Fluoro-chrome | Clone | Isotype | Species | Reference | Supplier | Initial concentration (mg/mL) | Final concentration (μg/mL) | Dilution |
| Anti mouse CD103 PE/Dazzel 594 | CD103 | PE/Dazzel 594 | 2 E7 | IgG | Armenian Hamster | BLE121414 | Biolegend | 0.2 | 2 | 1/100 |
| Anti mouse CD45 APC Cy7 | CD45 | APC Cy7 | 30-F11 | IgG2b kappa | Rat | 103116 | Biolegend | 0.2 | 2 | 1/100 |
| Anti mouse Epcam Brillant Violet 510 | EpCam CD326 | BV510 | G8.8 | IgG2a kappa | Rat | 560596 | BD | 0.2 | 2 | 1/100 |
| Anti mouse CD3 Brillant Violet 711 | CD3 | BV711 | 17A2 | IgG2b kappa | Rat | BLE100241 | Biolegend | 0.2 | 2 | 1/100 |
| BD Trucount TM | PercP-Cy5.5 | 340334 | BD | |||||||
| DAPI | UV | D1306 | Thermo Fisher | 1 | 1 | 1/1,000 |
Solutions
1. FACS buffer (see Recipes)
2. Complete medium (see Recipes)
3. Solution 1 (S1) (see Recipes)
4. Solution 2 (S2) (see Recipes)
Recipes
1. FACS Buffer
| Reagent | Final concentration | Quantity or Volume |
|---|---|---|
| DPBS | N/A | 500 mL |
| FBS | 10% | 50 mL |
| EDTA | 2 mM | 2 mL |
2. Complete medium
| Reagent | Final concentration | Quantity or Volume |
|---|---|---|
| RPMI-GlutaMAX | N/A | 500 mL |
| FBS | 10% | 50 mL |
| Penicillin-streptomycin | 50 U/mL | 5 mL |
| Gentamicin | 0.05 g/L | 1 mL |
3. Solution 1 (S1)
| Reagent | Final concentration | Quantity or Volume |
|---|---|---|
| HBSS | N/A | 500 mL |
| FBS | 2.5% | 12.5 mL |
| Penicillin-streptomycin | 50 U/mL | 5 mL |
| Gentamicin | 0.05 g/L | 1 mL |
| DTT | 5 mM |
4. Solution 2 (S2)
| Reagent | Final concentration | Quantity or Volume |
|---|---|---|
| HBSS | N/A | 500 mL |
| FBS | 2.5% | 12.5 mL |
| Penicillin-streptomycin | 50 U/mL | 5 mL |
| Gentamicin | 0.05 g/L | 1 mL |
| EDTA | 5 mM | 5 mL |
Laboratory supplies
1. 50 mL Falcon® conical centrifuge tubes (Corning, catalog number: 352070)
2. 96-well plates, V-bottom (Thermo ScientificTM, catalog number: 10192161)
3. 70 μm filters (Corning, catalog number: 22363548)
4. 100 μm filters (Corning, catalog number: 22363549)
Equipment
1. Surgical instruments (curved forceps, forceps, flat scissors, curved scissors, and scalpel)
2. 30 cm ruler
3. Scale (Ohaus Corporation, model: E12130)
4. Heated shaker for 50 mL tubes (VWR® Professional 3500, model: Orbital Shaker Incubator)
5. Benchtop vortexer (JANKE KUNKEL VF2)
6. Refrigerated Eppendorf centrifuge (Centrifuge, model: 5810R)
7. Microbiological safety station (Thermo Scientific, model: microbiological safety cabinet type 2 category 2)
8. BD Fortessa Cytometer (BD, model: LSRFortessa LSRII) equipped with the following 5 lasers:
a. UV laser (355 nm) (used for markers such as DAPI)
b. Violet laser (405 nm) (for the Abs CD3 Brilliant Violet 711 and CD326 Brilliant Violet 510)
c. Blue laser (488 nm) (for the BD TruCountTM beads)
d. Green laser (561 nm) (for the Abs CD103 PE/Dazzle 594)
e. Red laser (640 nm) (for the Abs CD45-APC-Cy7)
The configuration of the BD Fortessa Cytometer is shown in Table 2. Any other cytometer with the same configuration and characteristics can be used for our protocol.
Table 2. BD LSR Fortessa Cytometer optical configuration
| LASER | Detectors | Fluorochromes |
| BLUE LASER (488 nm) | Blue detector 515–545 | Alexa Fluor 488; FITC; GFP; CFSE; YFP |
| Blue detector 685–735 | PerCP; PerCP-Cy5.5 | |
| RED LASER (640 nm) | Red detector 663–677 | APC; Cy5; Alexa Fluor 647; eFluor 660 |
| Red detector 708–752 | Alexa 700; APC-Alexa 700 | |
| Red detector 750–810 | APC-Cy7; APC-H7 | |
| VIOLET LASER (405 nm) | Violet detector 430–470 | Cascade Blue; Pacific Blue; Alexa 430; V450; BV421 |
| Violet detector 500–550 | AmCyan; Pacific Orange; BV510; Qdot 525 | |
| Violet detector 600–620 | Qdot 605; BV 605 | |
| Violet detector 650–670 | Qdot 655; eFluor 650; BV 650 | |
| Violet detector 685–735 | BV 711 | |
| Violet detector 750–810 | Qdot 800; BV 786 | |
| GREEN LASER (561 nm) | Green detector 578–593 | PE; Cy3; Tomato |
| Green detector 600–620 | PE-Texas Red; PI; ECD; mCherry; RFP | |
| Green detector 655–685 | PE-Cy5; 7-AAD | |
| Green detector 685–735 | PE-Alexa 700; PE-Cy5.5 | |
| Green detector 750–800 | PE-Cy7; PE-Alexa 750 | |
| ULTRA VIOLET LASER (355 nm) | Ultra Violet detector 425–475 | DAPI; Hoechst Blue; Indo-1 (violet) |
| Ultra Violet detector 515–545 | Indo-1 (blue) |
Please see Supplementary materials and refer to the following publication for details related to flow cytometry: Flow cytometry sample acquisition using a BD LSR Fortessa flow cytometer running FACSDiva (DOI: 10.21769/BioProtoc.4679).
Software and datasets
1. FACSDiva (BD, version 6.1.3)
2. FlowJo (FlowJo, version 10.10.0)
Procedure
A. Recovery of the different parts of the intestine from the mouse abdomen (see Video 1)

1. Euthanize the mice by exposition to CO2 or by cervical dislocation in line with your institution's guidelines.
2. Place the mouse on its back on a dissection table and attach its four legs with syringe needles.
3. Spray the mouse's ventral side with 70% ethanol.
4. Using curved forceps, grab and cut the skin and peritoneum.
5. Free the viscera by opening the peritoneum until the lungs appear.
6. Extend the incision to the right and left groin to provide better access to the intestine.
7. Hook the peritoneum and the open skin on either side of the mouse with needles.
8. Locate the stomach, catch hold of the duodenum, and cut it at the base of the pylorus with flat scissors.
9. Pull progressively to unwind the whole intestine and do not hesitate to cut the mesenteries if they hang too much.
10. Once the whole digestive tract has been unwound, cut at the base of the colon (as close as possible to the anus).
11. Place the digestive tract on another dissection table.
12. Critical step: Spray the entire tissue using fresh complete medium. Do not let the tissue dry out for the rest of the protocol, and do not hesitate to moisten the intestinal tissue several times to avoid any cell stress that may influence cell viability or function.
13. Remove any mesenteries attached to the intestine, using curved tweezers.
14. Remove the Peyer's patches from the entire small intestine by using curved forceps to catch hold of them and then curved scissors to remove them from the digestive tract.
15. Using a scalpel, cut out the intestinal part of interest (duodenum, jejunum, ileum, and colon) (Figure 1).
16. Using a scalpel, cut each resected intestinal part into two (duodenum, jejunum, colon) or three (ileum) equal pieces.
17. Holding each resected intestinal part at one end with noncurved forceps, empty its contents by pressing it with curved forceps and gradually pushing the contents toward the other end of the tissue.
18. Critical step: Using a scalpel, carefully open the necessary sections of the intestinal tract lengthwise—either the entire tract or only the region of interest—to expose the inner lining for epithelial recovery.
19. Weigh the various tissues before depositing them in complete medium.
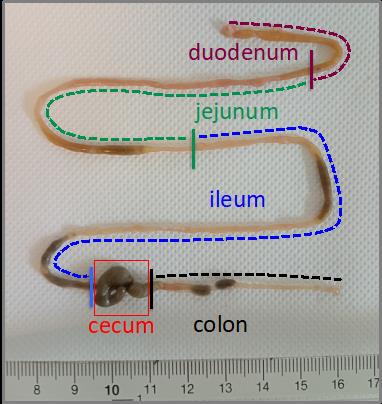
Figure 1. Representative picture of the different segments of the murine intestinal tract. The duodenum (purple segment) represents the first 5 cm of the intestine after the stomach. The jejunum (green segment) is the intestinal segment between the duodenum and the ileum. The ileum (blue segment) corresponds to the 18 cm preceding the cecum. The colon (black segment) corresponds to the intestinal segment that follows directly after the cecum to the anus.
B. Recovery of epithelium
1. Add the appropriate volume of S1 (5 mL for the duodenum, jejunum, and colon and 10 mL for the ileum) to a 50 ml Falcon tube containing that part of the intestine.
2. Shake at 180 rpm and 37 °C for 8 min.
3. Filter each portion through a 70 µm filter. Recover the tissue with a pair of tweezers and discard the filtrate.
4. Add the appropriate volume of S2 (5 mL for the duodenum, jejunum, and colon and 10 mL for the ileum) to each gut section.
5. Shake at 180 rpm and 37 °C for 8 min.
6. Vortex vigorously and collect the S2 filtered through a 100 µm filter and containing the epithelium in another 50 mL tube.
7. Repeat steps B4–6 twice on the same epithelium collection tube.
8. Keep the tubes containing the epithelium from the different parts of the intestine on ice and discard any remaining tissue.
C. Flow cytometry staining protocol
1. Pellet the cells by centrifugation at 800× g for 5 min at 4 °C.
2. Discard the supernatant (alternatively, the supernatant can be removed by inversion of the tube while taking care not to disperse the pellet) and suspend the whole cells in PBS (final volume 2 mL).
3. Aliquot 250 µL of cell suspension into a 96-well plate.
4. Centrifuge the plate at 800× g for 1 min at 4 °C.
5. Discard the supernatant and wash with 200 µL of FACS buffer using a multichannel pipette.
6. Centrifuge the plate at 800× g for 1 min at 4 °C.
7. Discard the supernatant and add 30 µL of antibodies mixture (Table 1) for extracellular labeling in FACS buffer.
8. Incubate at 4 °C in the dark for 30 min.
9. Centrifuge the plate at 800× g for 1 min at 4 °C.
10. Discard the supernatant and add 50 µL of FACS buffer using a multichannel pipette.
D. Setting up the FACS acquisition stage
1. Ensure that daily cytometer calibration is carried out by the instrument's technical manager. This calibration is carried out using SpheroTM Rainbow Calibration Particles (6 peaks) (BD bioscience). This quality control is generally under the responsibility of your flow cytometry core facility.
2. Make sure you have prepared the appropriate controls:
a. Unstained tube, which only contains the cells.
b. Single-stained tubes: for each fluorochrome used in the experiment (see Table 1), a single-stained cell sample must be prepared and used as compensation control. Indeed, in multicolor flow cytometry experiments, compensation controls are critical for the avoidance of spectral overlaps between fluorophores.
c. Fluorescence minus one (FMO) controls, which contain the cells stained with all but one of the antibodies/fluorochromes. In the case of this experiment, five FMO tubes are required. These controls are important when identifying a positive in a negative population and when the expression levels are low (see Figure 1).
3. Optimize acquisition parameters: FSC, SSC, fluorescence channels, and compensation (for more details, see Supplementary materials).
E. Flow cytometry data acquisition
1. Add 450 µL of FACS buffer to the BD TruCountTM tubes.
2. Resuspend stained cells in 50 µL and add them to the BD TruCountTM tubes.
Note: TruCountTM beads are microparticles of a known size, each containing a fluorescent dye. They are added to the cell sample in precise and uniform quantities. These beads, which have the same fluorescence characteristics as the cells, are counted simultaneously with the cells. As the sample flows through the cytometer, each particle (whether a cell or bead) is individually analyzed based on size, fluorescence, and other distinguishing features. The cytometer counts both cells and beads. By knowing the exact number of beads added and the total count of particles (cells + beads), the number of cells in the sample can be accurately calculated according to an established formula.
3. Vortex the tubes for 15 s and wait 15 min.
4. Add the appropriate volume of DAPI (Table 1) to achieve a dilution of 1:1,000. Wait 5 min before starting the acquisition.
5. Vortex the tubes just before the acquisition.
6. Acquire a total of 10,000 beads per sample in the flow cytometer.
Data analysis
Absolute IELs, IECs count, and IEL/IEC ratio
1. CD3+CD103+ count
First, calculate the number of CD3+CD103+ cells by dividing the number of positive cell events (Figure 2E, right panel) by the total number of viable cells (Figure 2C, right panel). Then, divide by the number of bead events (Figure 2A) and multiply by the BD TruCountTM bead concentration (N/V, where N is the number of beads per test and V is the test volume).
CD3+CD103+ / Beads × N/V = Value A
To obtain the total number of cells in a given tissue, multiply Value A by the volume of medium present in the initial collection tube containing the full epithelium (Section C).
2. CD326/EpCAM+ count
First, calculate the number of CD326/EpCAM+ cells by dividing the number of positive cell events (Figure 2D, right panel) by the total of viable cells (Figure 2C, right panel). Then, divide by the number of bead events (Figure 2A) and multiply by the BD TruCountTM bead concentration (N/V, where N is the number of beads per test and V is the test volume).
CD326/EpCAM+ / Beads × N/V = Value B.
To obtain the total number of cells in a given tissue, multiply Value B by the volume of medium present in the initial collection tube containing the full epithelium (Section C).
3. To obtain the IEL/IEC ratio, divide Value A by Value B.
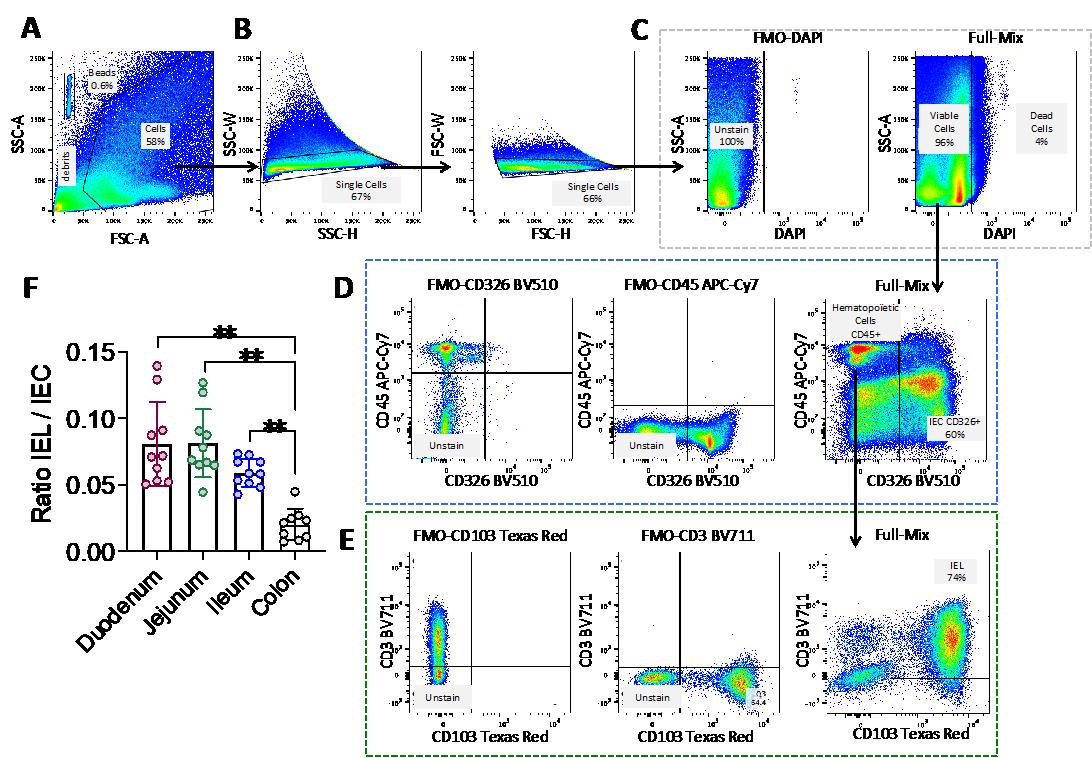
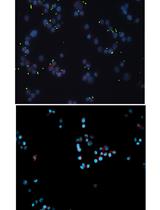
Figure 2. Gating strategy for the definition of intraepithelial lymphocyte (IEL) and intestinal epithelial cell (IEC) populations and example of the cell count data. (A) Selection of the population of interest by morphology, based on SSC-A and FSC-A, in order to eliminate cellular debris and identify the BD TruCountTM beads. Indeed, the light scattered by cells is measured by two optical detectors: forward scatter (FSC), which detects scatter along the path of the laser, and side scatter (SSC), which measures scatter at a 90° angle relative to the laser. FSC intensity is proportional to the diameter of the cell and is primarily due to light diffraction around the cell. FSC signal can be used for the discrimination of cells by size. SSC, on the other hand, is from the light refracted or reflected at the interface between the laser and intracellular structures, such as granules and nuclei. (A) SSC provides information about the internal complexity (i.e., granularity) of a cell. (B) Selection of single cells using SSC-W, SSC-H, FSC-W, and FSC-H parameters. (C) Selection of live cells using the DAPI viability marker. Dead, DAPI-positive cells (right panel) are selected using the FMO-DAPI control tube not containing the viability marker DAPI (left panel). (D) Selection of CD45+ cells (hematopoietic origin) and CD45- CD326/epithelial cell adhesion molecule (EPCAM) positive cells based on the FMO-CD326 and FMO-CD45 controls. (E) Final identification of IELs (CD3+ CD103+) based on the FMO-CD3 and FMO-CD103 controls. Arrows indicate the population selected for the next step in the gating strategy. The percentage of each selected population is shown in each graph. (F) Histograms depicting the IEL/IEC ratio derived from this flow cytometry analysis method for each part of the intestinal tract (duodenum, jejunum, ileum, and colon); n=10; each symbol corresponds to an individual mouse. The data are expressed as the mean ± SD. Wilcoxon test; ** p < 0.01.
Validation of protocol
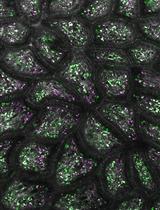
As stated in the introduction, we started our experiments by comparing two types of commonly used viability markers: the nuclear DNA probe DAPI and the cellular protein probe Zombie. We found that the Zombie probe gave false positives because it bounds to the mucus adhering to epithelial cells (Figure 3C, lower panel). Indeed, Zombie marker binds to the amino residues of mucin glycoproteins that constitute mucus. This led to an underestimation of the epithelial cell count (Figure 3D, lower panel) and thus to a significant overestimation of the IEL/IEC ratio, relative to the DAPI condition and conventional counting (the reference method) using a hemocytometer (Figure 3F). Hence, the use of DNA-based viability probes like DAPI as cell viability markers in this setting is a critical point in the present protocol.
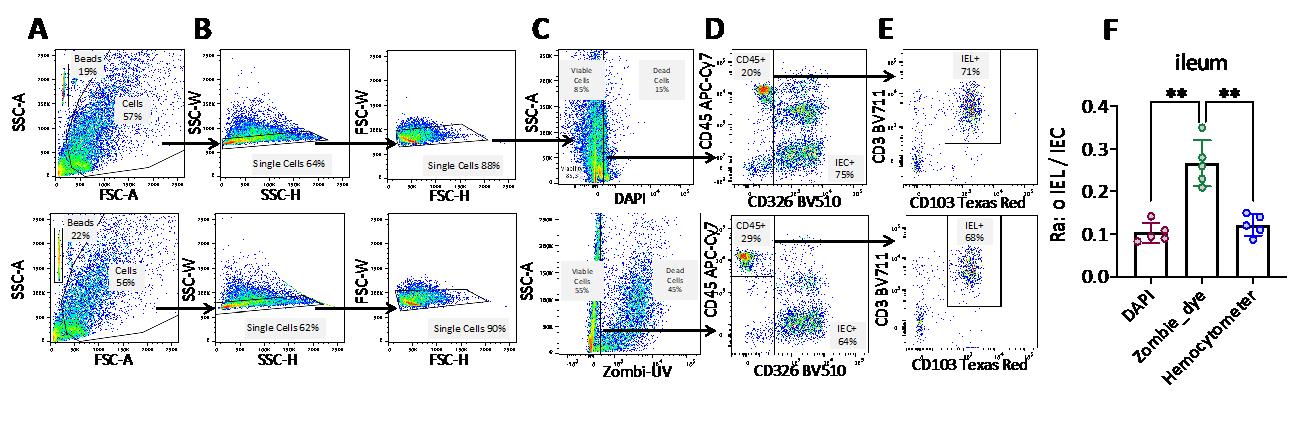
Figure 3. Comparison of intraepithelial lymphocyte (IEL) and intestinal epithelial cell (IEC) counts, using two different viability probes. (A–E) The gating strategy for IELs and IECs (see Figure 2 legend) used either the DAPI viability marker (upper panels) or the Zombie dye (lower panels). Arrows indicate the population selected for the next step in the gating strategy. The percentage of the selected population is shown in each graph. (F) Histograms depicting the IEL/IEC ratio were derived from the flow cytometry data (applied to the ileum) and from cell counting with a hemocytometer (the reference method). n=5; each symbol corresponds to an individual mouse. The data are expressed as the mean ± SD. Wilcoxon test; ** p < 0.01.
Supplementary information
The following supporting information can be downloaded here:
1. A brief overview of the steps required to set up the experiment and acquire samples using a BD LSR Fortessa flow cytometer running FACSDiva.
2. A brief overview of the steps for analyzing samples using FlowJo.
Acknowledgments
The present study was funded by the Adebiopharm and ADRPP nonprofit organizations. We sincerely thank Professors Dominique Bellet and Michel Plotkine for supporting this project. We also thank the staff at the animal facility at the Faculté de Pharmacie de Paris, Faculté de Santé, Université Paris Cité (Paris, France) for expert animal care and the staff at the Institute Curie cytometry facility (Paris, France). A heartfelt thanks to the team of ICTE/IT & Digital Support Department of the Faculté de Pharmacie de Paris, Faculté de Santé, Université Paris Cité, for producing the video associated with this manuscript. Lastly, we thank Dr. David Fraser (Biotech Communication SARL, Ploudalmézeau, France) for copy-editing assistance.
Competing interests
The authors declare no conflicts of interest.
Ethical considerations
All mice used in this study (C57BL/6 females) were bred and raised in the animal facility at the Faculté de Pharmacie de Paris, Université Paris Cité (Paris, France). The experimental protocol was approved by the Paris Descartes Animal Experimentation Ethics Committee n°034. The experiments complied with the applicable national and international guidelines and regulatory requirements.
References
- Lockhart, A., Mucida, D. and Bilate, A. M. (2024). Intraepithelial Lymphocytes of the Intestine. Annu Rev Immunol. 42(1): 289–316. https://doi.org/10.1146/annurev-immunol-090222-100246
- Soderquist, C. R. and Bhagat, G. (2021). Cellular and molecular bases of refractory celiac disease. Int Rev Cell Mol Biol. 358: 207–240. https://doi.org/10.1016/bs.ircmb.2020.12.001
- Reis, B. S., Darcy, P. W., Khan, I. Z., Moon, C. S., Kornberg, A. E., Schneider, V. S., Alvarez, Y., Eleso, O., Zhu, C., Schernthanner, M., et al. (2022). TCR-Vγδ usage distinguishes protumor from antitumor intestinal γδ T cell subsets. Science. 377(6603): 276–284. https://doi.org/10.1126/science.abj8695
- Nazmi, A., McClanahan, K. G. and Olivares-Villagomez, D. (2021). Unconventional Intestinal Intraepithelial Lymphocytes in Health and Disease. Crit Rev Immunol. 41(4): 23–38. https://doi.org/10.1615/critrevimmunol.2021039957
- Lockhart, A., Reed, A., Rezende de Castro, T., Herman, C., Campos Canesso, M. C. and Mucida, D. (2023). Dietary protein shapes the profile and repertoire of intestinal CD4+ T cells. J Exp Med. 220(8): e20221816. https://doi.org/10.1084/jem.20221816
Article Information
Publication history
Received: Jan 29, 2025
Accepted: Apr 8, 2025
Available online: Apr 29, 2025
Published: May 5, 2025
Copyright
© 2025 The Author(s); This is an open access article under the CC BY-NC license (https://creativecommons.org/licenses/by-nc/4.0/).
How to cite
Joulain, C., Bessoles, S., Chiron, A. S., Sarrabayrouse, G. and Hacein-Bey-Abina, S. (2025). Standardized Flow Cytometry Method for Absolute Counting of Intraepithelial Lymphocytes in the Intestinal Mucosa Using TruCountTM Beads. Bio-protocol 15(9): e5307. DOI: 10.21769/BioProtoc.5307.
Category
Immunology > Mucosal immunology > Epithelium
Cell Biology > Cell staining
Do you have any questions about this protocol?
Post your question to gather feedback from the community. We will also invite the authors of this article to respond.