- Protocols

- Articles and Issues
- For Authors
- About
- Become a Reviewer

Mapping the Simultaneously Accessible and ssDNA-Containing Genome With KAS-ATAC Sequencing
Published: Vol 15, Iss 9, May 5, 2025 DOI: 10.21769/BioProtoc.5306 Views: 1801
Reviewed by: Laxmi Narayan MishraAnonymous reviewer(s)
Original research article
The authors used this protocol in:

Nov 2024
Advertisement


Protocol Collections
Comprehensive collections of detailed, peer-reviewed protocols focusing on specific topics


Related protocols
Abstract
The KAS-ATAC assay provides a method to capture genomic DNA fragments that are simultaneously physically accessible and contain single-stranded DNA (ssDNA) bubbles. These are characteristic features of two of the key processes involved in regulating and expressing genes—on one hand, the activity of cis-regulatory elements (cREs), which are typically devoid of nucleosomes when active and occupied by transcription factors, and on the other, the association of RNA polymerases with DNA, which results in the presence of ssDNA structures. Here, we present a detailed protocol for carrying out KAS-ATAC as well as basic processing of KAS-ATAC datasets and discuss the key considerations for its successful application.
Key features
• Allows mapping of simultaneously accessible and ssDNA-containing DNA fragments.
• Describes the execution of N3-kethoxal labeling and transposition of native chromatin.
• Describes the pulldown of biotin-labeled DNA fragments and library generation.
• Describes basic KAS-ATAC data processing steps.
Keywords: KAS-seqGraphical overview
Background
In most eukaryotes, the major steps in the process of gene expression are the act of transcription itself and its activation/repression by the combined action of transcription factors (TFs) on cis-regulatory elements (cREs), i.e., promoters, enhancers, and insulators. The action of cREs can be highly complex, e.g., the input of on average ≥10 individual cREs per gene is integrated into the regulation of promoter activity in mammalian genomes [1,2]. Therefore, mapping the location and activation status of cREs genome-wide has been a key task for the comprehensive charting of regulatory networks.
To this end, a key property of active cREs—that they tend to be devoid of nucleosomes [3–5]—has been the basis for technological development, due to the fact that the absence of nucleosomal protection renders active cREs accessible to enzymatic action, whether cleavage (e.g., by DNase I [6–9]) or modification (e.g., by methyltransferases [10–12]). The enzyme with the most utility for mapping open chromatin genome-wide has turned out to be a hyperactive version of the Tn5 transposase [13,14], which allows both the labeling of accessible regions in the genome and their tagging with readily PCR-amplifiable sequencing adapters, thus greatly simplifying experimental protocols and minimizing input amount requirements, in the form of the ATAC-seq assay [14] (assay for transposase-accessible chromatin using sequencing) and its many variations.
ATAC-seq datasets also contain highly useful finer-grained information in addition to the mere location of open chromatin regions. They can be used to map nucleosome positioning around cREs [15] as well as the footprints of individual TFs associated with DNA, which also protect DNA from cleavage, even if to a lesser extent than nucleosomes [14].
The integrated action of cREs results in the modulation of transcriptional activity at promoters, with enhancers themselves also being transcribed [16]. Thus, mapping active transcription (as opposed to steady-state RNA levels, which are the result of both active transcription and the subsequent effects of intrinsic RNA stability and post-transcriptional regulation) has been another key tool for understanding the regulatory genome. To this end, multiple adaptations of nuclear run-on techniques, such as GRO-seq [17], PRO-seq [18], and others [19], have been developed. However, these are generally fairly complex protocols, and as they measure RNA rather than DNA molecules, they do not allow the simultaneous recording of both transcriptional activity and the physical state of the genome. A more recent alternative tool that does resolve these issues is the KAS-seq [20] assay (kethoxal-assisted ssDNA sequencing), based on the highly specific covalent labeling of unpaired guanine residues by N3-kethoxal. N3-kethoxal adducts can then be subjected to click chemistry–mediated biotinylation, and the DNA fragments containing ssDNA can be specifically enriched and amplified. As most ssDNA in the genome is the result of RNA polymerase bubbles, both elongating and paused (with the rest coming from active replication intermediates and some secondary structures), KAS-seq is a convenient tool for mapping polymerase engagement with the genome.
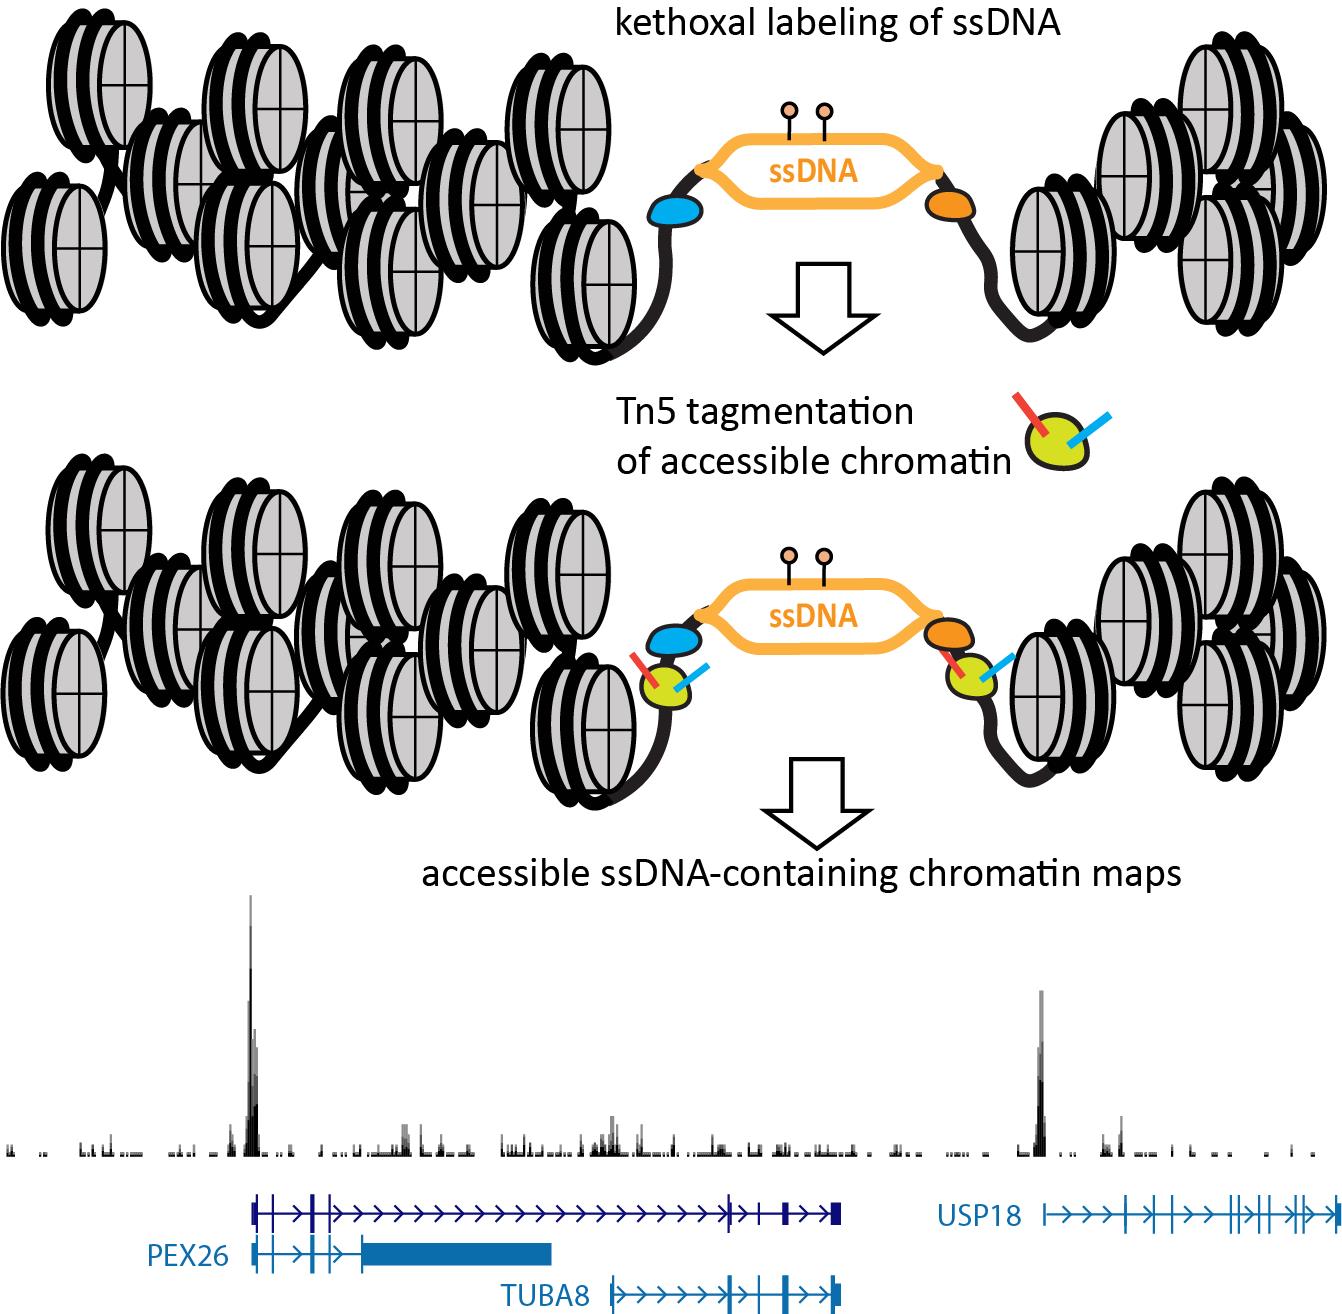
The nature of the KAS method—specifically, the fact that it labels ssDNA with permanent covalent tags—allows its extension to single-molecule multiomics readouts that capture additional modalities on the same genomic fragments. The KAS-ATAC method that we recently developed [21] enables the mapping of genomic fragments that are both physically accessible and contain ssDNA, together with nucleosome positions and TF footprints within them and their vicinity, by combining the ATAC-seq and KAS-seq assays into one (Figure 1). This is accomplished by first quickly incubating live cells with N3-kethoxal, then washing the kethoxal away, and proceeding immediately to the native chromatin transposition step of the ATAC-seq protocol. The resulting Tn5-tagged accessible DNA fragments are purified, kethoxal-labeled guanines are biotinylated via a click chemistry reaction, then ssDNA-containing fragments are specifically enriched using a streptavidin pull-down. Finally, PCR amplification is carried out on beads to generate final Illumina-compatible libraries.
This protocol describes the step-by-step execution of the KAS-ATAC assay and the basic computational processing of the resulting datasets.
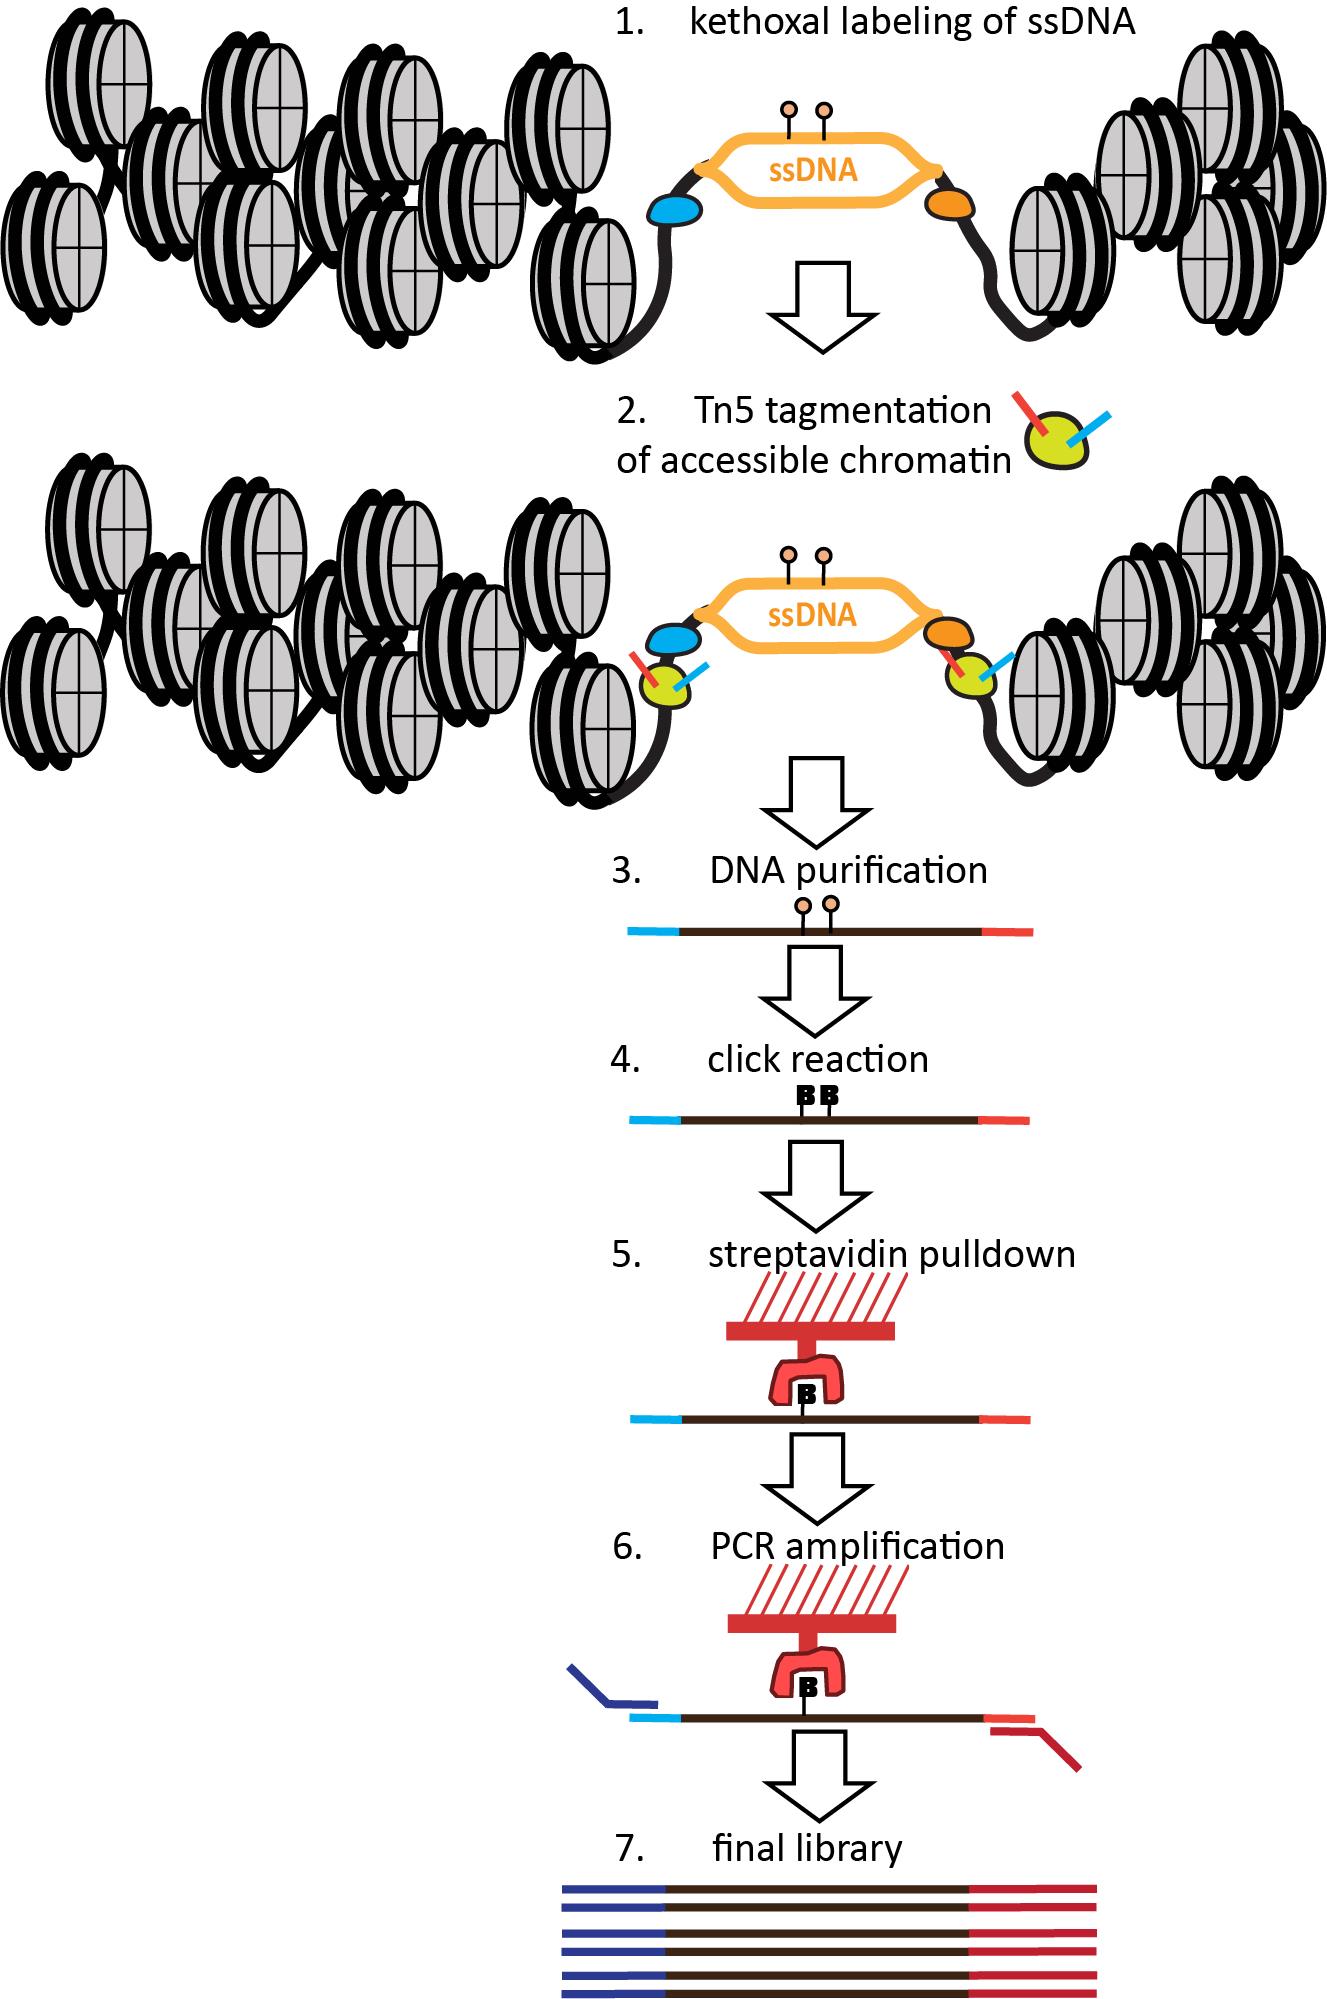
Figure 1. Outline of the KAS-ATAC assay. First, ssDNA is labeled using a quick treatment with N3-kethoxal. Next, the kethoxal is washed away, nuclei are isolated, and native transposition is carried out to label accessible chromatin. DNA is then isolated and subjected to a click reaction to attach biotin to kethoxal adducts. Biotin-labeled DNA fragments are then specifically pulled down using streptavidin and PCR-amplified on beads. Final libraries are sequenced on an Illumina instrument.
Materials and reagents
Reagents
1. Tn5 transposase; can be obtained from the Nextera XT DNA Library Preparation Kit offered by Illumina (catalog number: FC-131-1024), separately from Illumina (catalog number: 20034197 or 20034198), from Diagenode (catalog number: C01070012-30), and also from several other commercial vendors. It can also be made locally following previously published protocols [13], which is the most cost-effective approach, especially for large-scale projects. The oligo sequences needed for the transposome assembly are the following:
Tn5MErev: /5Phos/CTGTCTCTTATACACATCT
Tn5ME-A: TCGTCGGCAGCGTCAGATGTGTATAAGAGACAG
Tn5ME-B: GTCTCGTGGGCTCGGAGATGTGTATAAGAGACAG
If homemade Tn5 is used, its activity should be carefully characterized relative to standard enzymatic formulations before production-scale use (using ATAC-seq enrichment metrics as a criterion).
2. Sequencing primers/adapters: PCR and indexing primers/adapters can be obtained from the Nextera XT DNA Library Preparation Kit or equivalent kits. Alternatively, custom-designed and synthesized oligos can also be used.
The i7 primer sequence is: 5'-CAAGCAGAAGACGGCATACGAGAT[i7]GTCTCGTGGGCTCGG-3'
The i5 sequence is: 5'AATGATACGGCGACCACCGAGATCTACA
C[i5]TCGTCGGCAGCGTC-3’
Where [i7] and [i5] are the index sequences (typically 8-bp long). Typical [i7] and [i5] index sequences are the following:
For [i7]:
701. TAAGGCGA
702. CGTACTAG
703. AGGCAGAA
704. TCCTGAGC
705. GGACTCCT
706. TAGGCATG
707. CTCTCTAC
708. CAGAGAGG
709. GCTACGCT
710. CGAGGCTG
711. AAGAGGCA
712. GTAGAGGA
713. GTCGTGAT
714. ACCACTGT
715. TGGATCTG
716. CCGTTTGT
717. TGCTGGGT
718. GAGGGGTT
719. AGGTTGGG
720. GTGTGGTG
721. TGGGTTTC
722. TGGTCACA
723. TTGACCCT
724. CCACTCCT
For [i5]:
501. TAGATCGC
502. CTCTCTAT
503. TATCCTCT
504. AGAGTAGA
505. GTAAGGAG
506. ACTGCATA
507. AAGGAGTA
508. CTAAGCCT
Dissolve and dilute to 25 μM.
1. N3-kethoxal (ApexBio, catalog number: A8793)
2. Dimethyl formamide (Sigma, catalog number: 227056-100ML)
3. 1× PBS buffer solution pH 7.4 (Thermo Fisher Scientific, catalog number: 10010031)
4. 10× PBS buffer solution pH 7.4 (Thermo Fisher Scientific, catalog number: 70011044)
5. 1 M Tris-HCl pH 7.4 (Thermo Fisher Scientific, catalog number: J60202.K2)
6. 5 M NaCl (Thermo Fisher Scientific, catalog number: A57006)
7. 1 M MgCl2 (Thermo Fisher Scientific, catalog number: J61014.AK)
8. IGEPAL CA-630 detergent (Sigma, catalog number: 11332465001; supplied as a 10% solution)
9. Tween-20 detergent (Sigma, catalog number: 11332465001; supplied as a 10% solution); store at 4 °C
10. Digitonin detergent (Promega, catalog number: G9441; supplied as a 2% solution in DMSO); store at -20 °C
11. K3BO3 (Sigma, catalog number: B6768); prepare a carefully pH-adjusted pH 7.0 250 mM solution
12. 0.5 M EDTA, pH 8.0 (Thermo Fisher Scientific, catalog number: 15575020)
13. DBCO-PEG4-biotin (Sigma, catalog number: 760749); dissolve in DMSO to 20 mM
14. Dynabeads MyOne Streptavidin T1 beads (Thermo Fisher Scientific, catalog number: 65601)
15. NEBNext High-Fidelity 2× PCR Master Mix (NEB, catalog number: M0541S)
16. QuBit 1× dsDNA HS Assay kit (Thermo Fisher Scientific, catalog number: Q33231)
17. MinElute PCR Purification kit (Qiagen, catalog number: 28004/28006), Zymo DNA Clean and Concentrator kit (Zymo, catalog number: D4013/D4014), or equivalent
18. Nuclease-free H2O
Solutions
1. ATAC-RSB buffer (master stock) (see Recipes)
2. ATAC-RSB-lysis buffer (see Recipes)
3. Lysis wash buffer (ATAC-RSB-wash) (see Recipes)
4. 2× TD buffer (see Recipes)
5. Tween washing buffer (TWB) (see Recipes)
6. 2× binding buffer (see Recipes)
7. Transposition mix (see Recipes)
Recipes
1. ATAC-RSB buffer (master stock)
10 mM Tris-HCl pH 7.4
10 mM NaCl
3 mM MgCl2
Store at 4 °C.
2. ATAC-RSB-lysis buffer
10 mM Tris-HCl pH 7.4
10 mM NaCl
3 mM MgCl2
0.1% IGEPAL CA-630
0.1% Tween-20
0.01% Digitonin
Prepare immediately before use.
3. Lysis wash buffer (ATAC-RSB-wash)
10 mM Tris-HCl pH 7.4
10 mM NaCl
3 mM MgCl2
0.1% Tween-20
Prepare immediately before use.
4. 2× TD buffer
20 mM Tris-HCl pH 7.6
10 mM MgCl2
20% dimethyl formamide
Store at -20 °C.
It can also be obtained commercially, i.e., from Illumina (catalog number: 20034197/20034198) or Diagenode (catalog number: C01019043).
5. 1× tween washing buffer (TWB)
5 mM Tris-HCl pH 7.4
0.5 mM EDTA
1 M NaCl
0.05% Tween 20
Store at 4 °C.
6. 2× binding buffer
10 mM Tris-HCl pH 7.4
1 mM EDTA
2 M NaCl
Store at room temperature (RT).
7. Transposition mix (50 μL volume)
25 μL of 2× TD buffer
22.5 μL of H2O
2.5 μL of Tn5
Prepare immediately before use.
Laboratory supplies
1. 1.5-mL microcentrifuge tubes, preferably low protein and DNA binding (e.g., Eppendorf, catalog number: EP022431021)
2. 15 and 50 mL tubes
3. QuBit-compatible 200 μL PCR tubes/strips
4. TapeStation D1000 or HS D1000 tape and reagents (Agilent) or equivalent, e.g., BioAnalyzer (Agilent)
5. Pipette tips (1,000, 200, and 20 μL)
6. Micropipettes
Equipment
1. Incubator (37 °C) or thermomixer
2. Tabletop centrifuge
3. Thermal cycler
4. Qubit fluorometer or equivalent
5. TapeStation (Agilent) or equivalent, e.g., BioAnalyzer (Agilent)
6. Magnetic stand for 1.5 mL tubes
7. Magnetic stand for 200 μL PCR tubes/strips
8. Rotator for 1.5 mL tubes
Software and datasets
1. Bowtie [22] (http://bowtie-bio.sourceforge.net/index.shtml) or Bowtie2 [23] (http://bowtie-bio.sourceforge.net/bowtie2/index.shtml)
2. samtools [24]: http://www.htslib.org/
3. PicardTools https://broadinstitute.github.io/picard/
4. UCSC Genome Browser [25, 26] utilities: http://hgdownload.cse.ucsc.edu/admin/exe/
5. Python (version 2.7 or higher): https://www.python.org/
6. Custom Python scripts (https://github.com/georgimarinov/GeorgiScripts)
Procedure
Because the KAS-ATAC assay captures a relatively rare population of DNA molecules, i.e., the ones that are both physically accessible and contain ssDNA, it is necessary to start with more cells than used for regular ATAC-seq as input. The typical ATAC-seq protocol of mammalian cells uses 50,000 cells as input [14,27,28]; for KAS-ATAC, we recommend combining at least 10 × 50,000 cell reactions into each KAS-ATAC library, as described below.
For maximum capture efficiency, it is recommended that the whole procedure be completed up to the final library PCR amplification in a single day without freezing samples.
Also, note that one should always do regular ATAC-seq paired with KAS-ATAC. Refer to the ATAC-seq procedure as previously described [28] for more details.
A. Cell culture
Grow cells or generate cell suspensions following the appropriate protocols for the cell line/tissue system you are studying.
B. Kethoxal treatment
The first step in the KAS-ATAC protocol involves kethoxal-labeling of ssDNA. This step is done on live cells and should ideally be carried out as quickly as possible, in order to achieve as close coupling of the ssDNA and chromatin accessibility measurements on individual DNA molecules as possible. The kethoxal is immediately washed away, in order to avoid non-specific labeling throughout subsequent steps.
1. Pellet 500,000 to 1,000,000 cells at room temperature by centrifuging at 500× g for 5 min.
2. Resuspend cells in 500 μL of media supplemented with 5 mM N3-kethoxal (final concentration)
3. Incubate for 5 min at 37 °C shaking at 600 rpm in a thermomixer.
4. Pellet cells at room temperature by centrifuging at 500× g for 5 min.
5. Resuspend cells in 500 μL of 1× PBS.
6. Pellet cells at room temperature by centrifuging at 500× g for 5 min.
7. Proceed immediately to the ATAC step (Section C) of the protocol.
C. Cell lysis and nuclei isolation and transposition
Note: As mentioned above, the Zymo DNA Clean and Concentrator kit or other equivalent column-based kits can be used for DNA purification. Substitute the buffers and volumes accordingly if not using Qiagen MinElute.
1. Resuspend cells in 50 μL of ATAC-RSB-lysis buffer.
2. Incubate cells on ice for 3 min.
3. Add 1 mL of ATAC-RSB-wash buffer.
4. Centrifuge at 500× g for 5 min at 4 °C. Discard the supernatant.
5. Resuspend in 50 μL of transposition mix per 50,000 cells.
6. Redistribute into separate tubes so that each contains 50 μL of transposition reaction (i.e., 50,000 cells).
7. Incubate at 37 °C for 30 min in a thermomixer at 1000 rpm.
8. Stop each reaction by adding 250 μL of PB buffer from the Qiagen MinElute kit.
9. Pool the reactions and proceed to purify them using the Qiagen MinElute kit. Load 800 μL of the transposition reaction plus PB buffer mixture onto a MinElute column.
10. Centrifuge at ≥17,900× g (≥13,000 rpm in a conventional centrifuge) for 1 min and discard the flowthrough.
11. Repeat this step using the same column as many times as necessary until the full pooled volume has been loaded onto the column.
12. Add 750 μL of Qiagen MinElute PE wash buffer onto the column.
13. Centrifuge at ≥17,900× g for 1 min in a tabletop centrifuge and discard the flowthrough.
14. Centrifuge at ≥17,900× g for 1 min in a tabletop centrifuge to remove residual wash buffer.
15. Elute in 87.5 μL of 25 mM K3BO3 solution. Centrifuge at ≥17,900× g for 1 min. Note that incubating for a minute or two can improve yields.
16. Proceed immediately to the click reaction step (Section D).
D. Click reaction
Note: The click reaction product should not be purified using AMPure XP/SPRI beads as is done for the regular KAS-seq protocol as this will result in the loss of the critically important short subnucleosomal fragments corresponding to transcription factor footprints. Use column clean up to make sure those fragments are retained.
1. Mix 87.5 μL of transposed DNA with 2.5 μL of 20 mM DBCO-PEG4-biotin and 10 μL of 10× PBS for a final volume of 100 μL.
2. Incubate at 37 °C for 90 min in a thermomixer.
3. Add 500 μL of MinElute PB buffer to the reaction.
4. Load onto a MinElute column.
5. Centrifuge at ≥17,900× g for 1 min in a tabletop centrifuge and discard the flowthrough.
6. Add 750 μL of Qiagen MinElute PE wash buffer onto the column.
7. Centrifuge at ≥17,900× g for 1 min in a tabletop centrifuge and discard the flowthrough.
8. Centrifuge at ≥17,900× g for 1 min in a tabletop centrifuge to remove residual wash buffer.
9. Elute in 300 μL of 25 mM K3BO3 solution. Centrifuge at ≥17,900× g for 1 min.
E. Biotin pulldown
Note: In this step, biotinylated kethoxal-labeled transposition fragments are specifically pulled down using magnetic streptavidin beads.
1. Mix 10 μL of 10 mg/mL Dynabeads MyOne Streptavidin T1 beads with 300 μL of TWB.
2. Separate beads on a magnetic stand.
3. Resuspend beads in 300 μL of 2× binding buffer.
4. Add 300 μL of 25 mM K3BO3 solution.
5. Incubate at room temperature on a rotator for ≥15 min.
6. Separate beads on a magnetic stand.
7. Resuspend in 300 μL of 1× TWB.
8. Incubate at 55 °C in a thermomixer with shaking at 1,000 rpm for 2 min.
9. Separate beads on a magnetic stand.
10 Resuspend in 300 μL of 1× TWB again.
11. Incubate again at 55 °C in a thermomixer with shaking at 1,000 rpm for 2 min.
12. Separate beads on a magnetic stand.
13. Resuspend in 20 μL of Qiagen EB buffer (MinElute kit).
F. Library generation
Note: Final libraries are generated using beads with the KAS-ATAC DNA bound to them as input and otherwise typical ATAC-seq settings.
1. Set up a PCR reaction as follows:
20 μL of KAS-ATAC DNA-bound beads
2.5 μL of i5 PCR primer
2.5 μL of i7 PCR primer
25 μL of NEBNext High-Fidelity 2× PCR Master Mix
2. Amplify DNA for 10 cycles as follows:
72 °C for 3 min
98 °C for 30 s
10 cycles of:
98 °C for 10 s
63 °C for 30 s
72 °C for 30 s
Hold at 4 °C
3. Separate beads on a magnetic stand.
4. Transfer supernatant to new tubes. Add 250 μL of MinElute PB buffer to the supernatant.
5. Load onto a MinElute column.
6. Centrifuge at ≥17,900× g for 1 min in a tabletop centrifuge and discard the flowthrough.
7. Add 750 μL of Qiagen MinElute PE wash buffer onto the column.
8. Centrifuge at ≥17,900× g for 1 min in a tabletop centrifuge and discard the flowthrough.
9. Centrifuge at ≥17,900× g for 1 min in a tabletop centrifuge to remove residual wash buffer.
10. Elute in 25 μL of EB Buffer. Centrifuge at ≥17,900× g for 1 min.
11. Measure final library concentration using Qubit.
12. Evaluate fragment distribution in the final libraries using TapeStation (D1000 or HSD1000 kits).
G. Sequencing
Sequence KAS-ATAC libraries using any available Illumina instrument in a paired-end mode. Reads of length 2× 36 bp are generally sufficient given that ATAC-seq libraries are often dominated by subnucleosomal fragments ≤100 bp in length [28]. Aim for 20–30 million raw reads for an initial sequencing run; if exhaustive sequencing to saturation is needed, additional sequencing runs may be necessary.
Data analysis
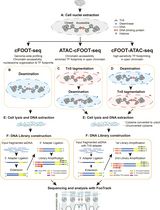
The processing of KAS-ATAC datasets does not differ much from that of standard ATAC-seq sequencing data. Readers are referred to our previous detailed description of the latter (Marinov and Shipony [29]) for all details regarding peak calling, differential accessibility analysis, transcription factor footprinting, and other downstream tasks. Here, we describe the basic processing steps from raw FASTQ files to alignment BAM files and genome browser tracks. A general outline of the basic computational processing procedure is shown in Figure 2.
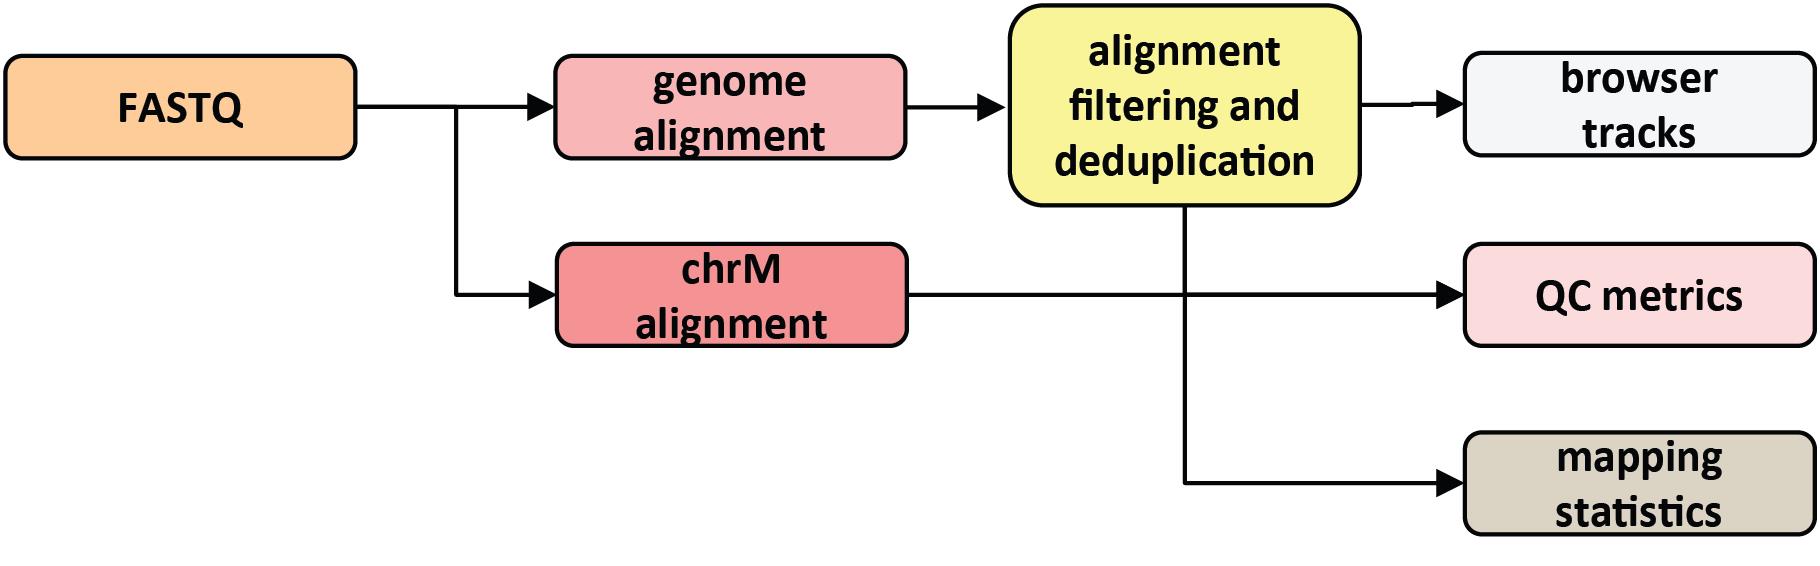
Figure 2. Outline of basic KAS-ATAC computational processing steps
Note that the procedure described here assumes working on a standard UNIX-based shared computing cluster.
A. Preparation of genomic files
Here, we describe the processing of human KAS-ATAC data against the hg38 version of the human genome assembly. The commands listed below are to be changed accordingly if other species are studied and/or genome assemblies are used.
1. Download and unzip genome reference files:
wget https://www.encodeproject.org/files/ GRCh38_no_alt_analysis_set_GCA_000001405.15/@@download/ GRCh38_no_alt_analysis_set_GCA_000001405.15.fasta.gz -O hg38_no_alt.fasta.gz
gunzip hg38_no_alt.fasta.gz
Note that it is important to use a version of the assembly that does not include alternative haplotypes. The presence of alternative haplotypes in the index makes the homologous sequences on the main chromosomes no longer uniquely mappable and thus artificially “invisible” to downstream analysis.
2. Generate a bowtie genome index file:
mkdir genomes/hg38/bowtie-indexes
cd genomes/hg38/bowtie-indexes
ln ../hg38_no_alt.fa
bowtie-build -f hg38_no_alt.fa hg38_no_alt
3. Generate a bowtie “chrM” index file using only the mitochondrial genome as input:
cd genomes/hg38/bowtie-indexes
ln ../chrM.fa
bowtie-build -f chrM.fa chrM
4. Generate a chromosome sizes info (chrom.sizes) file:
python makeChromSizesFromFasta.py hg38_no_alt.fa hg38_no_alt.chrom.sizes
Chromosome-size files identify the end points of chromosomes/contigs and are used at multiple steps in high-throughput sequencing data processing. They consist of one line per chromosome as follows:
chr
B. Read mapping and filtering
ATAC-seq sequencing data, and thus also KAS-ATAC data, is recommended to be processed in a 2 × 36mers format. This is because of the aforementioned abundance of short fragments and in order to maintain uniformity across all datasets we work with in terms of guarding against possible mappability and alignment biases.
For certain purposes (e.g., examining the effect of sequence variants), it can be beneficial to use the full length of fragments. In such cases, reads have to be trimmed of adapters, which can be done using Trimmomatic [30] or TrimGalore/Cutadapt [31].
For Bowtie mapping, use the following commands.
1. Map 2 × 36mer reads to whole genome:
python PEFastqToTabDelimited.py SAMPLE.end1.fastq.gz SAMPLE.end2.fastq.gz | bowtie hg38/bowtie-indexes/hg38_no_alt -p→16 -v 2 -k 2 -m 1→-t --best --strata -q→--sam-nh -X 1000 --sam --12 - | egrep -v chrM | samtools view -F 4 -bT hg38/sequence/hg38_no_alt.fa - | samtools sort - SAMPLE.2 × 36mers.unique.nochrM
This retains uniquely mapping read pairs with up to two mismatches relative to the reference and filters out unaligned reads as well as reads mapping to the mitochondrial genome. Alignments are stored in the BAM format (a binary version of the SAM format [24]).
Change the “egrep-v chrM” part if the name of the mitochondrial contig is different, or other such highly accessible contigs (e.g., plastids if working with plants) are to be also filtered out. It is important to remove these alignments from the final BAM files because the fraction of mitochondrial reads can vary substantially between libraries and leaving these reads in can affect global normalization factors in undesirable ways.
2. Map 2 × 36mer reads to the mitochondrial genome. This step is necessary for the purpose of evaluating the fraction of mitochondrial reads present in the sequenced libraries and is a standard part of ATAC-seq processing. Note that calculating this fraction from an alignment against the joint nuclear and mitochondrial index does not estimate it accurately because the mitochondrial genome is not uniquely mappable in several stretches due to the presence of mitochondrial insertions in the nuclear genome (so called NUMTs [32]).
python PEFastqToTabDelimited.py SAMPLE.end1.fastq.gz SAMPLE.end2.fastq.gz | bowtie hg38/bowtie-indexes/chrM -p 16 -v 2 -a -t --best --strata -q – sam-nh -X 1000 –s am --12 - | samtools view -F 4 -bT hg38/sequence/hg38_no_alt.fa - | samtools sort – SAMPLE.2 × 36mers.chrM
3. Index BAM files with samtools:
samtools index SAMPLE.2 × 36mers.unique.bam
samtools index SAMPLE.2 × 36mers.chrM.bam
4. Remove duplicate alignments. Because both ATAC-seq and KAS-ATAC capture only a limited initial population of original molecules, and because they are sequenced in a paired-end format, fragments with exactly the same coordinates are likely to represent PCR duplicates. They are thus by default removed, using the MarkDuplicates program in the PicardTools suite, as follows:
java -Xmx4G -jar picard-tools-1.99/MarkDuplicates.jar INPUT=SAMPLE.2 × 36mers.unique.nochrM.bam OUTPUT=SAMPLE.2 × 36mers.unique.nochrM.dedup.bam METRICS_FILE=SAMPLE.2 × 36mers.unique.nochrM.dedup.metrics VALIDATION_STRINGENCY=LENIENT ASSUME_SORTED=true REMOVE_DUPLICATES=true
5. Index the resulting deduplicated BAM file:
samtools index SAMPLE.2 × 36mers.unique.nochrM.dedup.bam
C. Generating genome browser visualization tracks
Two types of tracks can be generated for ATAC-seq/KAS-ATAC data: a “coverage” track assigning a score for each base in the genome that a mapped fragment covers, and “5'” tracks, which only represent Tn5 insertion points. The latter are used for transcription factor footprinting analysis and need to be shifted by ±4 bp depending on which strand they map to as the transposase itself has a footprint of 8–9 base pairs [14,33].
It is optimal to normalize the tracks relative to the total set of mapped and deduped reads in RPM (reads per million mapped reads) units.
1. Generate RPM-normalized coverage tracks:
python makewigglefromBAM-NH.py track_title SAMPLE.2 × 36mers.unique.nochrM.dedup.bam hg38.chrom.sizes SAMPLE. 2 × 36mers.unique.nochrM.dedup.bam.wig -uniqueBAM -notitle -RPM
2. Generate RPM-normalized “5'” tracks:
python make5primeWigglefromBAM-NH.py track_title SAMPLE.2 × 36mers.unique.nochrM.dedup.bam hg38.chrom.sizes SAMPLE.2 × 36mers.unique.nochrM.dedup.bam.5p.wig -uniqueBAM -notitle -RPM -shift 4
3. Convert bedGraph files to bigWig:
UCSC-utils/wigToBigWig SAMPLE.2 × 36mers.unique.nochrM.dedup.bam.wig hg38.chrom.sizes SAMPLE.2 × 36mers.unique.nochrM.dedup.bam.bigWig
UCSC-utils/wigToBigWig SAMPLE.2 × 36mers.unique.nochrM.dedup.bam.5p.wig hg38.chrom.sizes SAMPLE.2 × 36mers.unique.nochrM.dedup.bam.5p.bigWig
D. Calculating mapping statistics and evaluating enrichment
It is important to evaluate the extent of enrichment observed in sequenced libraries as well as to collect general mapping and library complexity statistics.
1. Count raw reads: zcat SAMPLE.fastq.gz | wc -l
Divide by 4 to get the number of reads (as each read is represented by 4 lines in a FASTQ file).
2. Calculate mapping statistics for the chrM-mapping BAM file:
python SAMstats.py SAMPLE.2 × 36mers.chrM.bam SAMstats-SAMPLE.2 × 36mers.chrM -bam hg38.chrom.sizes samtools -paired
The total number of reads mapping to the mitochondrion (|RM|) can be obtained from this step.
3. Calculate mapping statistics for the chrM-filtered pre-deduplication BAM file:
python SAMstats.py SAMPLE.2 × 36mers.unique.nochrM.bam SAMstats-SAMPLE2 × 36mers.unique.nochrM -bam hg38.chrom.sizes samtools -paired
The total number of reads mapping to the nuclear genome (|RN|) can be obtained from this file.
This step also provides the non-redundant read fraction (NRF) estimate of the library, defined as follows [34]:
NRF = UP/UR (1)
Where UP is the set of genomic positions to which 5' ends of reads map uniquely and UR is the total number of uniquely mapped reads.
4. Calculate mapping statistics for the chrM-filtered post-deduplication BAM file:
python SAMstats.py SAMPLE.2 × 36mers.unique.nochrM.dedup.bam SAMstats-SAMPLE.2 × 36mers.unique.nochrM.dedup -bam hg38.chrom.sizes samtools -paired
5. Calculate the extent of mitochondrial contamination.
The fraction of mitochondrial reads is calculated as follows:
(2)
Where RM and RN are as defined above.
6. Estimate the fragment length distribution based on the chrM-filtered post-deduplication BAM file. Note that including the chrM-mapping fragments can result in misleading results as mitochondria lack nucleosomes.
python PEInsertDistFromBAM.py SAMPLE.2 × 36mers.unique.nochrM.dedup.bam hg38.chrom.sizes SAMPLE.2 × 36mers.unique.nochrM.dedup.InsLen -uniqueBAM -normalize
7. Evaluate the degree of enrichment for open chromatin using the TSS (transcription start site) enrichment TSSE metric as described previously [29]. This metric is based on creating an aggregate-profile curve around transcription start sites of protein coding genes, then calculating the ratio of the average signal in small (e.g., 100 bp radius) windows around the TSS vs. the combined average signal in the two 100 bp long windows on the TSS flanks at a distance of 2 kbp:
(3)
8. As a one-time step, create a TSS 0-radius BED file using a genome annotation GTF file:
python TSS_bed_FromGTF.py annotation.gtf 0 0 annotation.TSS-0bp.bed
9. Generate an average profile around TSSs:
python signalAroundCoordinate-BW.py refSeq.TSS-0bp.bed 0 1 3 4000 SAMPLE.2 × 36mers.unique.nochrM.dedup.coverage.bigWig SAMPLE.2 × 36mers.unique.nochrM.dedup.coverage.TSS_profile -normalize
10. Then, calculate TSSE values:
python ATACTSSscore.py SAMPLE.2 × 36mers.unique.nochrM.dedup.coverage.TSS_profile 100 2000 >> ATACTSSscore.txt
Representative KAS-ATAC fragment length distributions, TSS metaprofiles, and genome browser coverage tracks are shown in Figure 3A, B, and C, respectively.
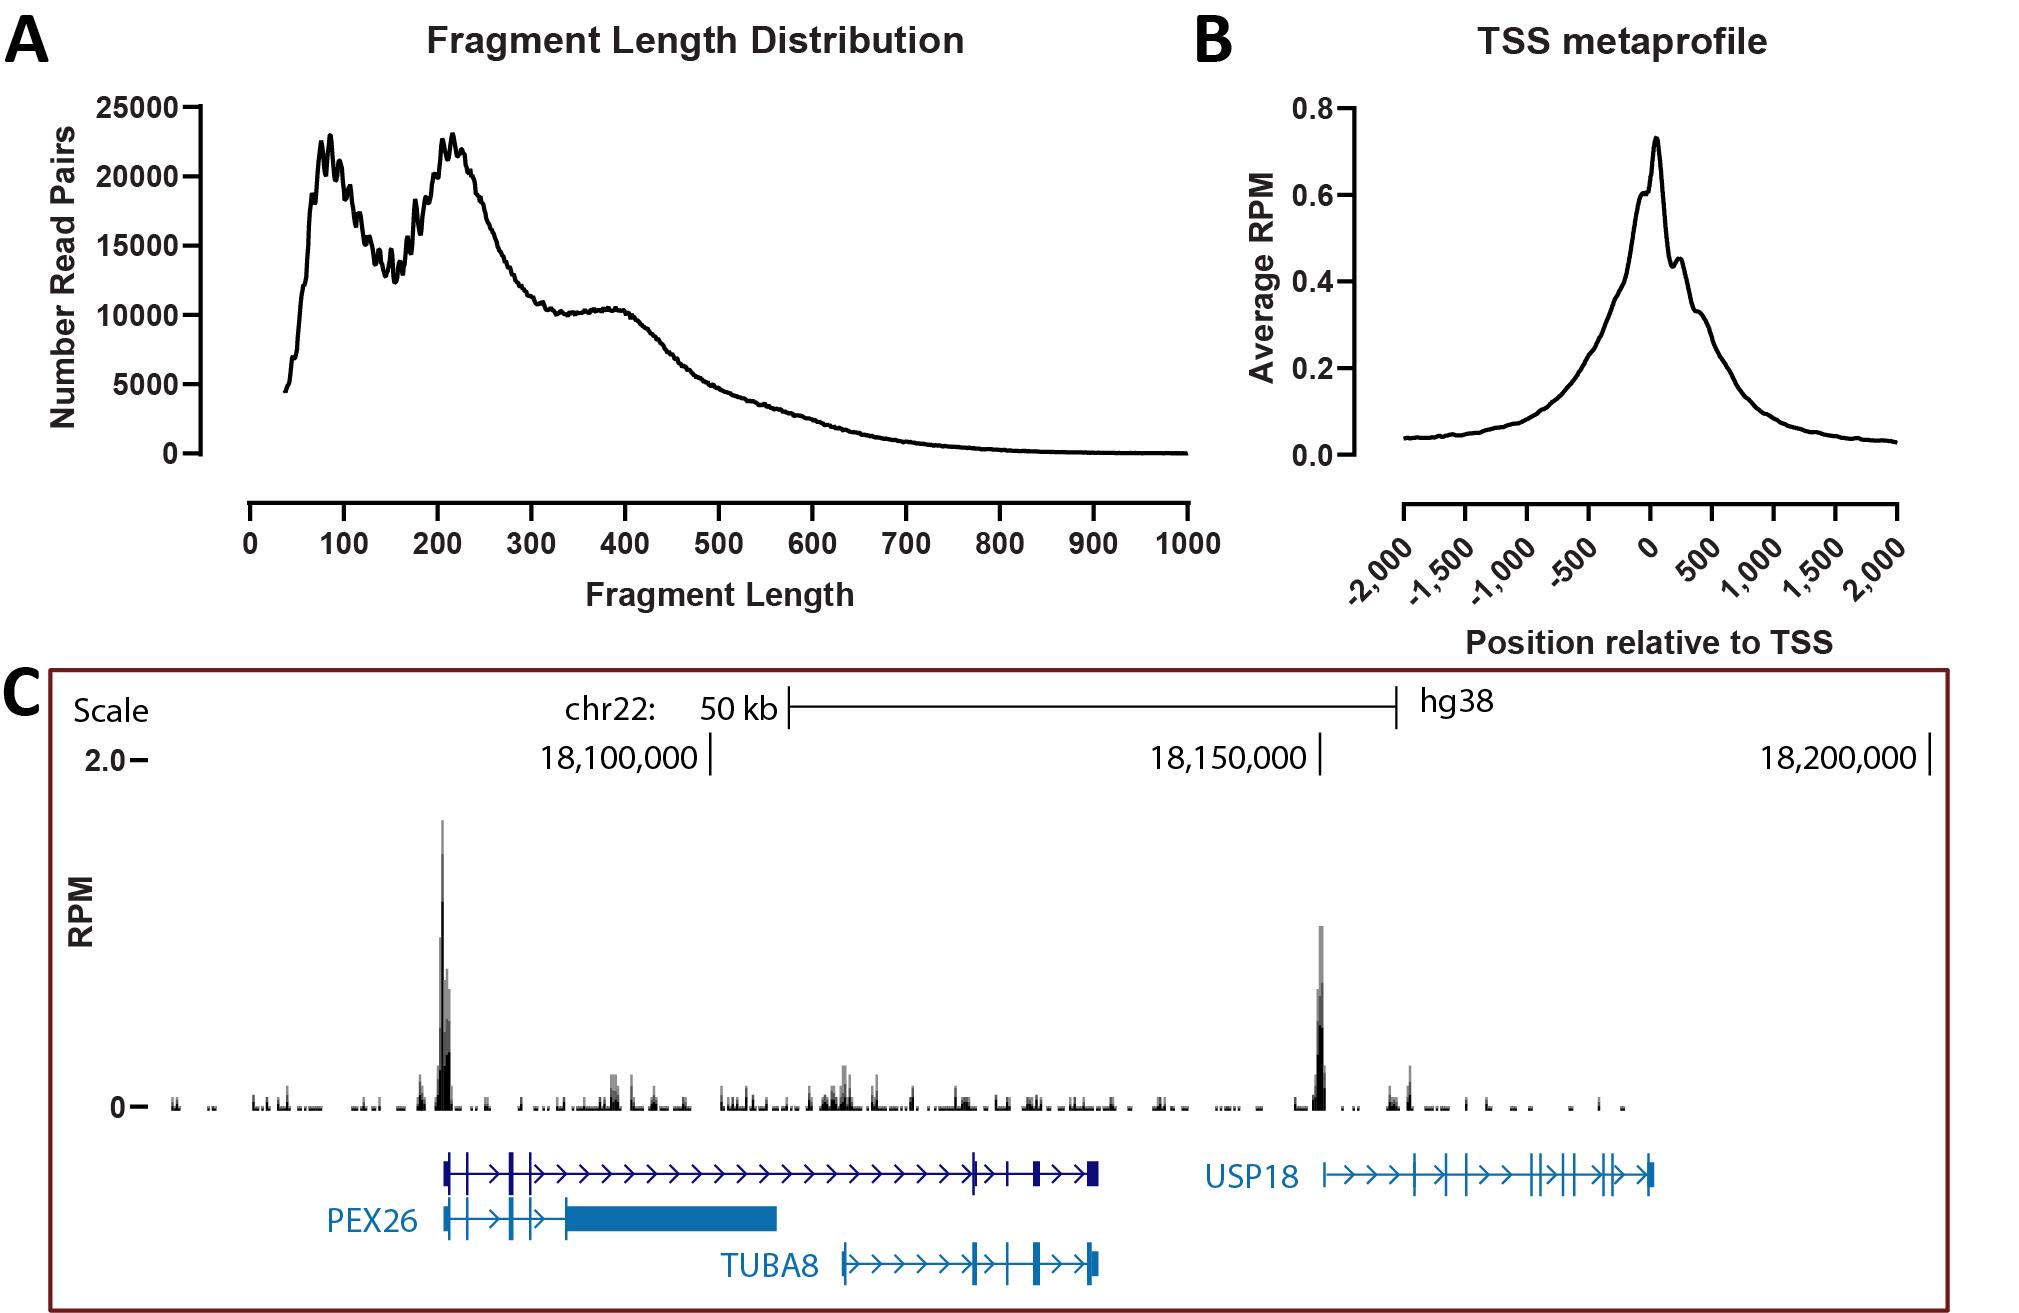
Figure 3. Typical KAS-ATAC results. (A) Fragment length distribution. (B) TSS metaprofile. (C) Representative genome browser snapshot.
Validation of protocol
This protocol was developed and used in the following research article:
Kim et al. [21]. KAS-ATAC reveals the genome-wide single-stranded accessible chromatin landscape of the human genome. Genome Res.
KAS-ATAC experiments were carried out on GM12878 and HEK293 cells in two replicates and benchmarked against matching ATAC-seq and KAS-seq datasets, as well as ATAC-seq datasets generated using a biotinylated Tn5 transposome and subsequent streptavidin pull down.
General notes and troubleshooting
General notes
1. If homemade, make sure the Tn5 you are using is well characterized for activity by carrying out ATAC-seq experiments on standard cell lines and calculating TSS enrichment QC metrics.
2. Also, make sure you are using non-degraded N3-kethoxal, i.e., preferably fresh, recently ordered (within 3–4 months) stocks.
3. Make sure the input material, whether nuclei isolated from tissues or cell lines, is in optimal condition, i.e., as few dead cells as possible (>80%–90% viable cells).
Troubleshooting
Problem 1: Low library complexity is observed (ideally at least 107 to 108 distinct fragments should be recovered for meaningful downstream analysis).
Possible cause A: Too few cells were used.
Solution A: Repeat the experiment with at least 10 × 50,000 cells as recommended above. It is, however, possible that in some other cell types and systems, the abundance of accessible and ssDNA-containing DNA regions is lower than in the human cell lines we have benchmarked KAS-ATAC on, and thus the size of the input needs to be increased.
Possible cause B: Inefficient kethoxal labeling.
Solution B: Redo experiments with a fresh N3-kethoxal batch.
Possible cause C: Inefficient click reaction and/or degradation of kethoxal adducts during storage.
Solution C: Redo experiments with fresh and carefully pH-calibrated K3BO3 stocks.
Problem 2: High abundance of mitochondrial fragments.
Possible cause: Poor separation of nuclei from cytoplasm.
Solution: Redo experiments while being extremely careful to remove all the supernatant after cell lysis.
Problem 3: Poor enrichment observed.
Possible cause A: Poor-quality Tn5.
Solution A: Redo experiments with freshly prepared and well-characterized Tn5 transposome stocks.
Possible cause B: Too many dead cells resulting in too much naked and broken up DNA present.
Solution B: Redo experiments with cells whose viability has been measured and assured to be high. A pretreatment with DNase I of cell culture as described in Corces et al. [27] might also help.
Acknowledgments
This work was supported by NIH grants (P50HG007735, RO1 HG008140, U19AI057266, UM1HG009442 and 1UM1HG009436) to W.J.G., the Rita Allen Foundation (to W.J.G.), the Baxter Foundation Faculty Scholar Grant, and the Human Frontiers Science Program grant RGY006S (to W.J.G). W.J.G. also acknowledges support by grants 2017-174468 and 2018-182817 from the Chan Zuckerberg Initiative.
The authors would like to thank Samuel Kim for his contributions during the development of the KAS-ATAC assay, and members of the Greenleaf and Kundaje labs for helpful discussions and suggestions.
Competing interests
The authors declare no competing interests.
References
- The ENCODE Project Consortium. (2012). An integrated encyclopedia of DNA elements in the human genome. Nature. 489(7414): 57–74. https://doi.org/10.1038/nature11247
- Wu, C. (1980). The 5′ ends of Drosophila heat shock genes in chromatin are hypersensitive to DNase I. Nature. 286(5776): 854–860. https://doi.org/10.1038/286854a0
- Keene, M. A., Corces, V., Lowenhaupt, K. and Elgin, S. C. (1981). DNase I hypersensitive sites in Drosophila chromatin occur at the 5' ends of regions of transcription. Proc Natl Acad Sci USA. 78(1): 143–146. https://doi.org/10.1073/pnas.78.1.143
- McGhee J. (1981). A 200 base pair region at the 5′ end of the chicken adult β-globin gene is accessible to nuclease digestion. Cell. 27(1): 45–55. https://doi.org/10.1016/0092-8674(81)90359-7
- Dorschner, M. O., Hawrylycz, M., Humbert, R., Wallace, J. C., Shafer, A., Kawamoto, J., Mack, J., Hall, R., Goldy, J., Sabo, P. J., et al. (2004). High-throughput localization of functional elements by quantitative chromatin profiling. Nat Methods. 1(3): 219–225. https://doi.org/10.1038/nmeth721
- Sabo, P. J., Kuehn, M. S., Thurman, R., Johnson, B. E., Johnson, E. M., Cao, H., Yu, M., Rosenzweig, E., Goldy, J., Haydock, A., et al. (2006). Genome-scale mapping of DNase I sensitivity in vivo using tiling DNA microarrays. Nat Methods. 3(7): 511–518. https://doi.org/10.1038/nmeth890
- Crawford, G. E., Holt, I. E., Whittle, J., Webb, B. D., Tai, D., Davis, S., Margulies, E. H., Chen, Y., Bernat, J. A., Ginsburg, D., et al. (2005). Genome-wide mapping of DNase hypersensitive sites using massively parallel signature sequencing (MPSS). Genome Res. 16(1): 123–131. https://doi.org/10.1101/gr.4074106
- Boyle, A. P., Davis, S., Shulha, H. P., Meltzer, P., Margulies, E. H., Weng, Z., Furey, T. S. and Crawford, G. E. (2008). High-Resolution Mapping and Characterization of Open Chromatin across the Genome. Cell. 132(2): 311–322. https://doi.org/10.1016/j.cell.2007.12.014
- Kelly, T. K., Liu, Y., Lay, F. D., Liang, G., Berman, B. P. and Jones, P. A. (2012). Genome-wide mapping of nucleosome positioning and DNA methylation within individual DNA molecules. Genome Res. 22(12): 2497–2506. https://doi.org/10.1101/gr.143008.112
- Krebs, A. R., Imanci, D., Hoerner, L., Gaidatzis, D., Burger, L. and Schübeler, D. (2017). Genome-wide Single-Molecule Footprinting Reveals High RNA Polymerase II Turnover at Paused Promoters. Mol Cell. 67(3): 411–422.e4. https://doi.org/10.1016/j.molcel.2017.06.027
- Shipony, Z., Marinov, G. K., Swaffer, M. P., Sinnott-Armstrong, N. A., Skotheim, J. M., Kundaje, A. and Greenleaf, W. J. (2020). Long-range single-molecule mapping of chromatin accessibility in eukaryotes. Nat Methods. 17(3): 319–327. https://doi.org/10.1038/s41592-019-0730-2
- Picelli, S., Björklund, Ã. K., Reinius, B., Sagasser, S., Winberg, G. and Sandberg, R. (2014). Tn5 transposase and tagmentation procedures for massively scaled sequencing projects. Genome Res. 24(12): 2033–2040. https://doi.org/10.1101/gr.177881.114
- Buenrostro, J. D., Giresi, P. G., Zaba, L. C., Chang, H. Y. and Greenleaf, W. J. (2013). Transposition of native chromatin for fast and sensitive epigenomic profiling of open chromatin, DNA-binding proteins and nucleosome position. Nat Methods. 10(12): 1213–1218. https://doi.org/10.1038/nmeth.2688
- Schep, A. N., Buenrostro, J. D., Denny, S. K., Schwartz, K., Sherlock, G. and Greenleaf, W. J. (2015). Structured nucleosome fingerprints enable high-resolution mapping of chromatin architecture within regulatory regions. Genome Res. 25(11): 1757–1770. https://doi.org/10.1101/gr.192294.115
- Kim, T. K., Hemberg, M., Gray, J. M., Costa, A. M., Bear, D. M., Wu, J., Harmin, D. A., Laptewicz, M., Barbara-Haley, K., Kuersten, S., et al. (2010). Widespread transcription at neuronal activity-regulated enhancers. Nature. 465(7295): 182–187. https://doi.org/10.1038/nature09033
- Core, L. J., Waterfall, J. J. and Lis, J. T. (2008). Nascent RNA Sequencing Reveals Widespread Pausing and Divergent Initiation at Human Promoters. Science. 322(5909): 1845–1848. https://doi.org/10.1126/science.1162228
- Kwak, H., Fuda, N. J., Core, L. J. and Lis, J. T. (2013). Precise Maps of RNA Polymerase Reveal How Promoters Direct Initiation and Pausing. Science. 339(6122): 950–953. https://doi.org/10.1126/science.1229386
- Tome, J. M., Tippens, N. D. and Lis, J. T. (2018). Single-molecule nascent RNA sequencing identifies regulatory domain architecture at promoters and enhancers. Nat Genet. 50(11): 1533–1541. https://doi.org/10.1038/s41588-018-0234-5
- Wu, T., Lyu, R., You, Q. and He, C. (2020). Kethoxal-assisted single-stranded DNA sequencing captures global transcription dynamics and enhancer activity in situ. Nat Methods. 17(5): 515–523. https://doi.org/10.1038/s41592-020-0797-9
- Kim, S. H., Marinov, G. K. and Greenleaf, W. J. (2024). KAS-ATAC reveals the genome-wide single-stranded accessible chromatin landscape of the human genome. Genome Res. 35(1): 124–134. https://doi.org/10.1101/gr.279621.124
- Langmead, B., Trapnell, C., Pop, M. and Salzberg, S. L. (2009). Ultrafast and memory-efficient alignment of short DNA sequences to the human genome. Genome Biol. 10(3): r25. https://doi.org/10.1186/gb-2009-10-3-r25
- Langmead, B. and Salzberg, S. L. (2012). Fast gapped-read alignment with Bowtie 2. Nat Methods. 9(4): 357–359. https://doi.org/10.1038/nmeth.1923
- Li, H., Handsaker, B., Wysoker, A., Fennell, T., Ruan, J., Homer, N., Marth, G., Abecasis, G., Durbin, R. et al. (2009). The Sequence Alignment/Map format and SAMtools. Bioinformatics. 25(16): 2078–2079. https://doi.org/10.1093/bioinformatics/btp352
- Kuhn, R. M., Haussler, D. and Kent, W. J. (2012). The UCSC genome browser and associated tools. Briefings Bioinf. 14(2): 144–161. https://doi.org/10.1093/bib/bbs038
- Kent, W. J., Zweig, A. S., Barber, G., Hinrichs, A. S. and Karolchik, D. (2010). BigWig and BigBed: enabling browsing of large distributed datasets. Bioinformatics. 26(17): 2204–2207. https://doi.org/10.1093/bioinformatics/btq351
- Corces, M. R., Trevino, A. E., Hamilton, E. G., Greenside, P. G., Sinnott-Armstrong, N. A., Vesuna, S., Satpathy, A. T., Rubin, A. J., Montine, K. S., Wu, B., et al. (2017). An improved ATAC-seq protocol reduces background and enables interrogation of frozen tissues. Nat Methods. 14(10): 959–962. https://doi.org/10.1038/nmeth.4396
- Marinov, G. K., Shipony, Z., Kundaje, A. and Greenleaf, W. J. (2022). Genome-Wide Mapping of Active Regulatory Elements Using ATAC-seq. Methods Mol Biol. 2611: 3–19. https://doi.org/10.1007/978-1-0716-2899-7_1
- Marinov, G. K. and Shipony, Z. (2021). Interrogating the Accessible Chromatin Landscape of Eukaryote Genomes Using ATAC-seq. Methods Mol Biol. 2243: 183–226. https://doi.org/10.1007/978-1-0716-1103-6_10
- Bolger, A. M., Lohse, M. and Usadel, B. (2014). Trimmomatic: a flexible trimmer for Illumina sequence data. Bioinformatics. 30(15): 2114–2120. https://doi.org/10.1093/bioinformatics/btu170
- Martin, M. (2011). Cutadapt removes adapter sequences from high-throughput sequencing reads. EMBnet J. 17(1): 10. https://doi.org/10.14806/ej.17.1.200
- Hazkani-Covo, E., Zeller, R. M. and Martin, W. (2010). Molecular Poltergeists: Mitochondrial DNA Copies (numts) in Sequenced Nuclear Genomes. PLos Genet. 6(2): e1000834. https://doi.org/10.1371/journal.pgen.1000834
- Pampari, A., Shcherbina, A., Kvon, E. Z., Kosicki, M., Nair, S., Kundu, S., Kathiria, A. S., Risca, V. I., Kuningas, K., Alasoo, K., et al. (2024). ChromBPNet: bias factorized, base-resolution deep learning models of chromatin accessibility reveal cis-regulatory sequence syntax, transcription factor footprints and regulatory variants. bioRxiv: e630221. https://doi.org/10.1101/2024.12.25.630221
- Landt, S. G., Marinov, G. K., Kundaje, A., Kheradpour, P., Pauli, F., Batzoglou, S., Bernstein, B. E., Bickel, P., Brown, J. B., Cayting, P., et al. (2012). ChIP-seq guidelines and practices of the ENCODE and modENCODE consortia. Genome Res. 22(9): 1813–1831. https://doi.org/10.1101/gr.136184.111
Article Information
Publication history
Received: Feb 1, 2025
Accepted: Apr 9, 2025
Available online: Apr 24, 2025
Published: May 5, 2025
Copyright
© 2025 The Author(s); This is an open access article under the CC BY-NC license (https://creativecommons.org/licenses/by-nc/4.0/).
How to cite
Marinov, G. K. and Greenleaf, W. J. (2025). Mapping the Simultaneously Accessible and ssDNA-Containing Genome With KAS-ATAC Sequencing. Bio-protocol 15(9): e5306. DOI: 10.21769/BioProtoc.5306.
Category
Bioinformatics and Computational Biology
Systems Biology > Genomics > Sequencing
Molecular Biology > DNA > Chromatin accessibility
Do you have any questions about this protocol?
Post your question to gather feedback from the community. We will also invite the authors of this article to respond.