- Protocols

- Articles and Issues
- For Authors
- About
- Become a Reviewer

Near-Infrared Autofluorescence Imaging of Nuclei in Living Plant Roots
Published: Vol 15, Iss 8, Apr 20, 2025 DOI: 10.21769/BioProtoc.5274 Views: 2187
Reviewed by: Kentaro TamuraAnonymous reviewer(s)
Original research article
The authors used this protocol in:
Mar 2024
Advertisement


Protocol Collections
Comprehensive collections of detailed, peer-reviewed protocols focusing on specific topics


Abstract
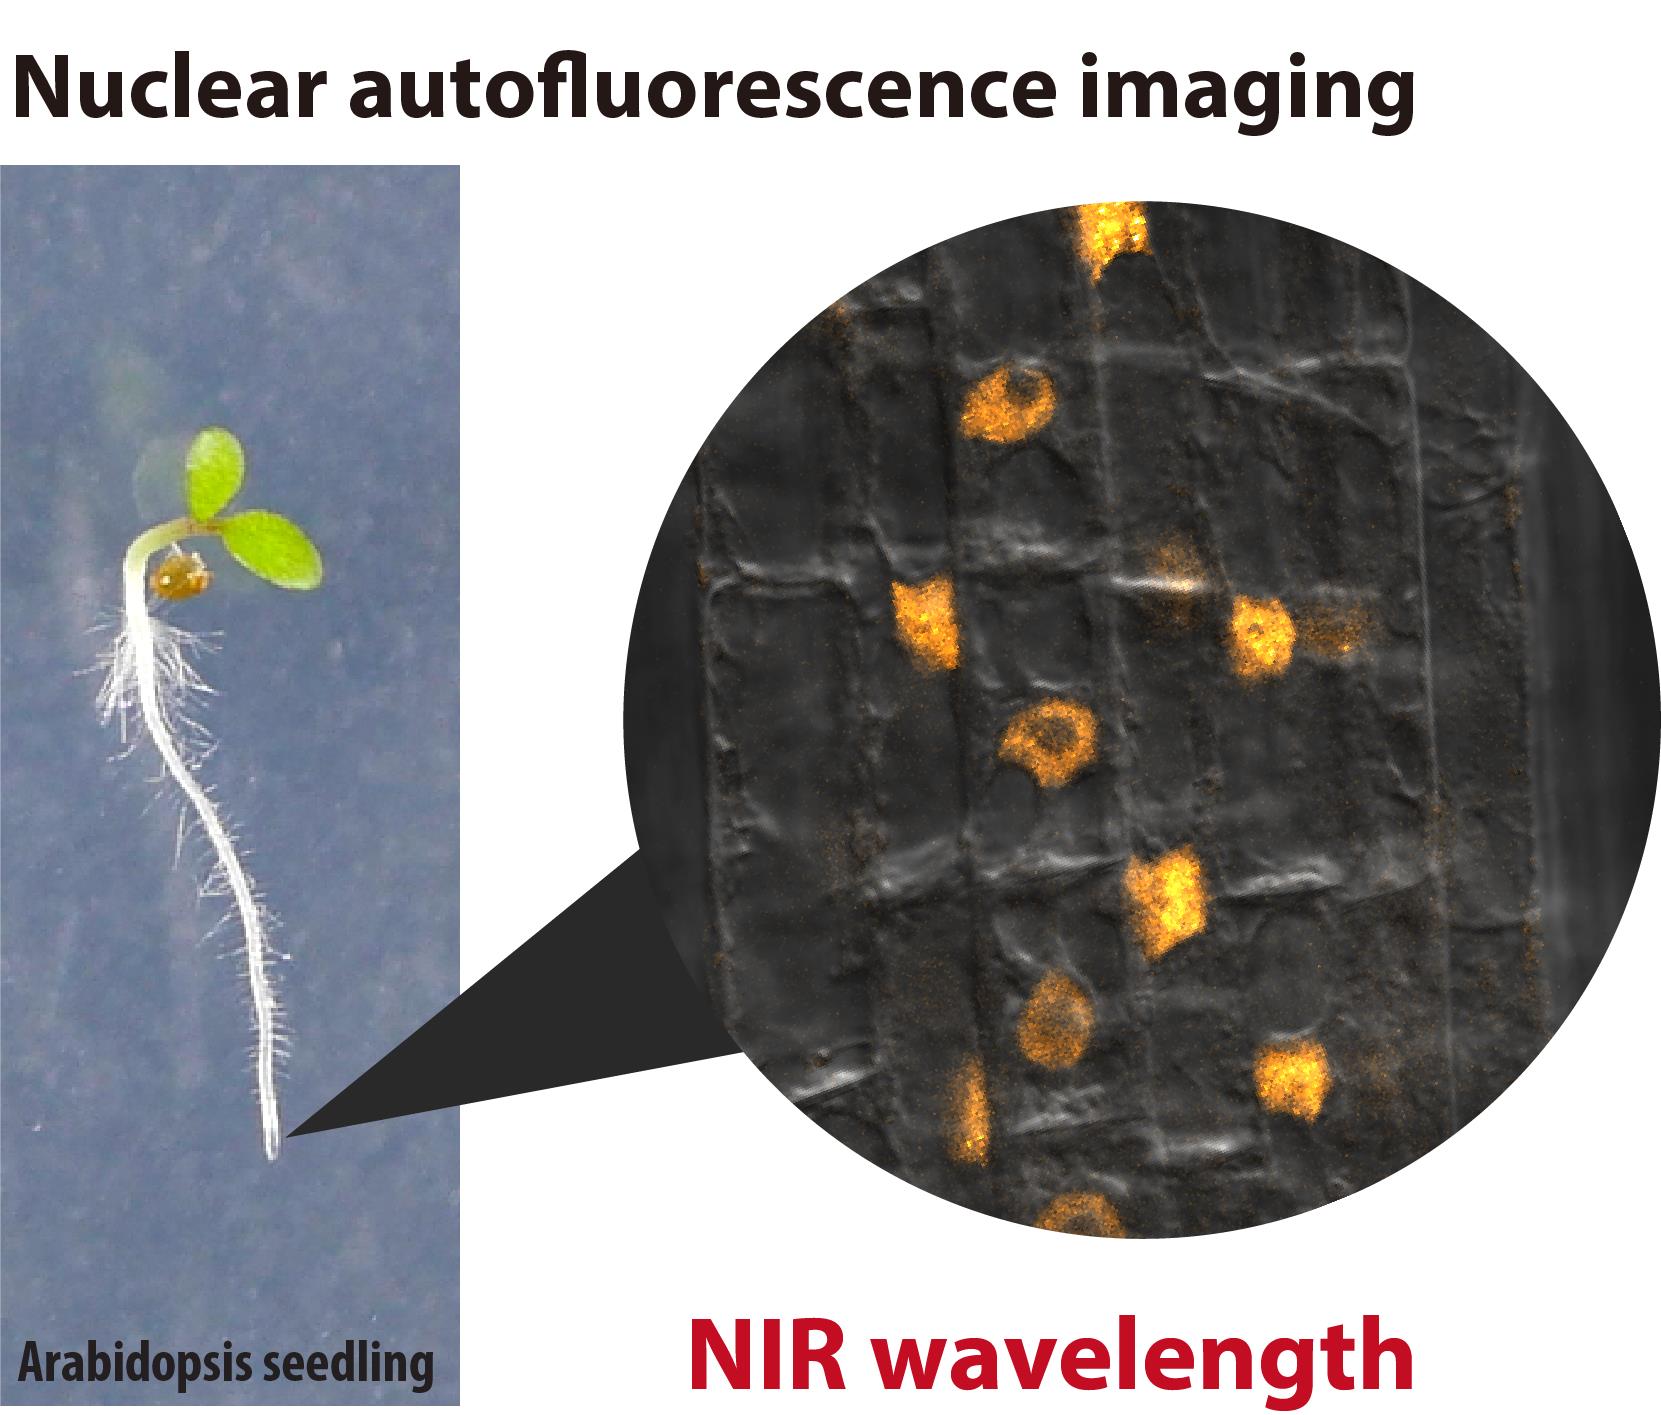
In live-cell imaging, autofluorescence is often regarded as a negative factor that interferes with the accurate visualization of target fluorescence due to a phenomenon known as crosstalk. However, autofluorescence has also been effectively utilized as an organellar marker. For instance, the intense autofluorescence of chlorophyll in the red wavelength is widely used to visualize chloroplasts, the photosynthetic organelle in plants. Recently, we demonstrated that nuclei in plant cells emit phytochrome-derived autofluorescence in the red to infrared wavelength range, which can be visualized by a conventional confocal microscope equipped with a 640 nm laser. Here, we present protocols for growing plants and conducting confocal imaging of the near-infrared autofluorescence of nuclei in Arabidopsis thaliana.
Key features
• Less invasive live-cell imaging of plant nuclei using near-infrared (NIR) autofluorescence derived from phytochrome, a photoreceptor in plants.
• Fluorescence live-cell imaging of non-model plants.
• Imaging of nuclei in root cells and pollen.
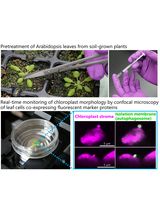
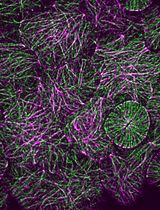
Keywords: Autofluorescence imagingGraphical overview
Background
Autofluorescence is extensively utilized as a fluorescence marker for specific compounds or organelles in plant science [1,2]. For instance, the phenolic polymer lignin, located in the cell wall, emits green fluorescence, which is used to visualize the xylem and Casparian strip [3]. Similarly, chlorophyll exhibits prominent autofluorescence in the red wavelength range (600–700 nm, peaking at 675–680 nm) [2]. This chlorophyll autofluorescence is frequently employed to determine the subcellular localization of plastids and chloroplasts [4]. However, the intense autofluorescence of chloroplasts poses a challenge for utilizing fluorescent dyes and proteins that emit in the red to near-infrared (NIR) range for imaging in shoot tissues. Recently, we discovered that plant nuclei emit fluorescence within the 650–720 nm range [5]. This autofluorescence is likely derived from phytochrome, a photoreceptor. The phytochrome-derived autofluorescence can be utilized in confocal imaging to visualize nuclei and intranuclear photobodies in living plant cells. Phytochrome B, a subclass of plant phytochromes, is also known as a temperature sensor that integrates light and temperature signals into plant photomorphogenesis and thermomorphogenesis [6]. Here, we describe methods for visualizing nuclei using the phytochrome-derived autofluorescence in the root of Arabidopsis thaliana.
Materials and reagents
Plant materials
1. Arabidopsis thaliana (L.) Heynh. ecotype: Col-0
2. Arabidopsis thaliana transgenic plant harboring BOR1pro:BOR1-GFP [7]
Reagents
1. Ethyl alcohol (Sigma-Aldrich, catalog number: 09-0770)
2. Gellan gum (Fujifilm Wako, catalog number: 073-03075)
3. 4’,6-diamidino-2-phenylindole dihydrochloride (DAPI) (Roche, catalog number: 10236276001)
4. NaH2PO4·2H2O (Fujifilm Wako, catalog number: 192-02815)
5. NaHPO4·12H2O (Fujifilm Wako, catalog number: 196-02835)
6. MgSO4·7H2O (Fujifilm Wako, catalog number: 131-00405)
7. Ca(NO3)2·4H2O (Fujifilm Wako, catalog number: 039-00735)
8. KNO3 (Fujifilm Wako, catalog number: 160-04035)
9. MnSO4·H2O (Sigma, catalog number: M7634)
10. ZnSO4·7H2O (Fujifilm Wako, catalog number: 264-00402)
11. CuSO4·5H2O (Fujifilm Wako, catalog number: 039-04412)
12. CoCl2·6H2O (Fujifilm Wako, catalog number: 036-03682)
13. (NH4)6Mo7O24·4H2O (Fujifilm Wako, catalog number: 016-06902)
14. FeSO4·7H2O (Fujifilm Wako, catalog number: 098-01085)
15. Na2EDTA·2H2O (Sigma, catalog number: 345-01865)
16. Boric acid (Fujifilm Wako, catalog number: 026-15715)
17. Sucrose (Fujifilm Wako, catalog number: 196-00015)
Solutions
1. 200× Pi stock solution (see Recipes)
2. 200× Mg stock solution (see Recipes)
3. 200× Ca-K-N stock solution (see Recipes)
4. 200× Micronutrient (-B, -Fe) stock solution (see Recipes)
5. 200× Fe stock solution (see Recipes)
6. DAPI stock and staining solution (see Recipes)
7. MGRL media (see Recipes)
8. MGRL liquid medium without sugar (see Recipes)
Recipes
1. 200× Pi stock solution (pH 5.8)
NaH2PO4·2H2O 47.2 g/L
Na2H PO4·12H2O 18.4 g/L
This stock solution should be prepared using Milli-Q ultrapure water. Store in plastic bottles at room temperature.
2. 200× Mg stock solution
MgSO4·7H2O 74.0 g/L
This stock solution should be prepared using Milli-Q ultrapure water. Store in plastic bottles at room temperature.
3. 200× Ca-K-N stock solution
Ca(NO3)2·4H2O 94.4 g/L
KNO3 60.7 g/L
This stock solution should be prepared using Milli-Q ultrapure water. Store in plastic bottles at room temperature.
4. 200× Micronutrient (-B, -Fe) stock solution
MnSO4·H2O 348 mg/L
ZnSO4·7H2O 57.5 mg/L
CuSO4·5H2O 50 mg/L
CoCl2·6H2O 6.2 mg/L
(NH4)6Mo7O24·4H2O 5.9 mg/L
This stock solution should be prepared using Milli-Q ultrapure water. Store in plastic bottles at room temperature.
5. 200× Fe stock solution
FeSO4·7H2O 2.78 g/L
Na2EDTA·2H2O 3.72 g/L
This stock solution should be prepared using Milli-Q ultrapure water. Store in plastic bottles at room temperature.
6. DAPI stock and staining solution
Dissolve DAPI in ethanol at a concentration of 5 mg/mL (stock solution). For the staining solution, dilute DAPI stock solution 1,000-fold using MGRL liquid medium without sugar (final concentration of DAPI: 5 μg/mL).
7. MGRL media
1. Add the following reagents into ~700 mL of Milli-Q ultrapure water:
a. 200× Pi stock solution 4 mL
b. 200× Mg stock solution 4 mL
c. 200× Ca-K-N stock solution 4 mL
d. 200× Micronutrient stock solution 4 mL
e. 200× Fe stock solution 4 mL
2. Add 1 mM or 500 mM boric acid solution: For low-B medium, add 400 μL of 1 mM boric acid solution (0.5 μM B, final concentration). For normal-B medium, add 48 μL of 500 mM boric acid solution (30 μM B, final concentration).
3. Adjust the volume to 800 mL with Milli-Q ultrapure water.
4. Transfer the solution into a 1,000 mL NalgeneTM wide-mouth PPCO bottle.
5. Add 8 g of sucrose.
6. Add 12 g of gellan gum.
7. Autoclave at 121 °C for 15 min.
8. MGRL liquid medium without sugar
1. Add the following reagents into ~40 mL of Milli-Q ultrapure water in a 50 mL plastic conical tube.
a. 200× Pi stock solution 250 μL
b. 200× Mg stock solution 250 μL
c. 200× Ca-K-N stock solution 250 μL
d. 200× Micronutrient stock solution 250 μL
e. 200× Fe stock solution 250 μL
2. Add 1 mM or 500 mM boric acid solution: For low-B medium, add 25 μL of 1 mM boric acid solution (0.5 μM B, final concentration). For normal-B medium, add 3 μL of 500 mM boric acid solution (30 μM B, final concentration).
3. Adjust the volume to 50 mL with Milli-Q ultrapure water.
Laboratory supplies
1. Cover glass, 22 × 40 mm No. 1, 0.13–0.17 mm thickness (Matsunami Glass Ind., Ltd., catalog number: C022401)
2. 1.5 mL test tube
3. 1,000 μL pipette tip (used with 1,000 μL micropipette for washing seeds)
4. 200 μL pipette tip (used with 200 μL micropipette for sample mounting on slide glass)
5. 10 μL pipette tip (used with 20 μL micropipette for sowing)
6. 50 mL plastic conical tube
7. Sterile 25 mL serological pipette
8. Surgical tape 21N No. 12, 12 mm × 9 m (Nichiban Co., Ltd.)
9. Rectangle plastic dish, 140 mm × 100 mm × 14.5 mm (Eiken Chemical Co., Ltd., catalog number: AW2000)
10. Aluminum foil
11. Scalpel blade or razor blade
Equipment
1. 1,000 mL NalgeneTM wide-mouth PPCO bottles with closure (Nalgene Nunc, Thermo Fisher Scientific, catalog number: 312105-0032)
2. Autoclave
3. Plant growth chamber (NK System, catalog number: LH-411PFPFDT-SP)
4. Confocal laser scanning microscope equipped with 640 nm laser (Zeiss, model: LSM800)
5. Microscope objective lens, 40× water-immersion (1.1 NA LD C-Apochromat, Zeiss, item number: 421867-9970-000)
6. Microscope objective lens, 63× oil-immersion (1.4 NA Plan-Apochromat, Zeiss, item number: 420782-9900-000)
7. Slide glass (Matsunami Glass Ind., Ltd., catalog number: S012260)
8. Clean bench
9. 1,000 μL micropipette
10. 200 μL micropipette
11. 20 μL micropipette
12. Electric automatic pipette
Software and datasets
1. Fiji/ImageJ (ImageJ2, ver2.9.0/1.53t) (see https://imagej.net/software/fiji/) [8]
Procedure
A. Preparation of plant growth media
1. Prepare the MGRL media.
2. Place sterile plastic rectangle plates, an electric automatic pipette, and a 25 mL serological pipette on a clean bench. Sterilize the surfaces by UV irradiation for 15 min.
3. Mix the medium by rotation.
Optional: Insert a magnetic stirrer bar into the bottle before autoclaving and mix the medium using a magnetic stirrer.
4. Place the bottle on a clean bench.
5. Dispense 75 mL of the medium into each plate using the electric automatic pipette.
6. Allow the medium to solidify on the clean bench for 20 min.
7. Store the prepared medium plates at room temperature for up to two weeks.
B. Growth of Arabidopsis thaliana plants
Sowing
1. Place A. thaliana seeds into a 1.5 mL test tube. Use 40–80 seeds per dish.
2. Add 700 μL of 70% (v/v) ethanol to the test tube.
3. Invert to mix the test tube for 1 min.
4. Transfer the test tube to a clean bench.
5. Remove the ethanol solution using a 1,000 μL micropipette.
6. Add 1 mL of sterilized MilliQ ultra-pure water to the tube and mix by gentle inversion.
7. Discard the water using the micropipette.
8. Repeat steps B6 and B7 five times and leave approximately 50 μL of water in the tube.
(Optional) Briefly centrifuge the tubes using a benchtop centrifuge (2,680× g for 5 s) to place the seeds at the bottom.
9. Use a 20 μL micropipette with a 10 μL pipette tip to transfer seeds. Typically, normally sized A. thaliana seeds stick to the tip of the pipette tip by aspirating ~2 μL.
10. Place the seeds on the surface of the prepared plant growth media.
11. Cover the plastic plates with lids and seal their edges using surgical tape.
12. Wrap the medium plates in aluminum foil.
13. Place the plates in a refrigerator or cold room at 4 °C for 2 days for stratification.
Growing
1. Remove the aluminum foil and place the medium plates vertically in a plant growth chamber.
2. Grow the plants under controlled conditions (23 °C, 16/8 h light/dark cycles, photon flux density of 40–90 μmol·m-2·s-1) for 4 days.
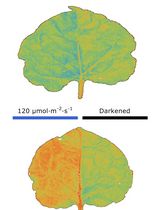
Critical: Nuclear autofluorescence is influenced by the light intensity of the growth environment. No significant variation in nuclear autofluorescence was observed within the 40–90 μmol·m-2·s-1 photon flux range, but significant reductions occurred under complete darkness [5].
Critical: Older A. thaliana plants (≥6 days old) often exhibit autofluorescence from organelles other than nuclei. Punctate autofluorescence patterns are often observed in the cells of the cortex of older roots. For optimal imaging, we recommend using seedlings aged ≤5 days.
C. Confocal imaging of nuclear autofluorescence
Optional: Fluorescent dyes that emit green fluorescence may complement NIR imaging. In this protocol, we stained the cell walls and nuclei with 5 μg/mL DAPI for 30 min before imaging.
1. Place 60 μL of MGRL liquid medium without sugar on the center of a slide glass using a micropipette.
2. Place a seedling on the slide glass and remove its shoots using a razor blade. Align three seedling roots similarly on the slide glass.
3. Gently cover the samples with a cover glass.
Critical: Avoid pressing the cover glass to prevent squashing the roots.
4. Capture fluorescence images using a confocal laser scanning microscope equipped with a 640 nm laser (Figure 1). Set the detection wavelength to 656–700 nm.
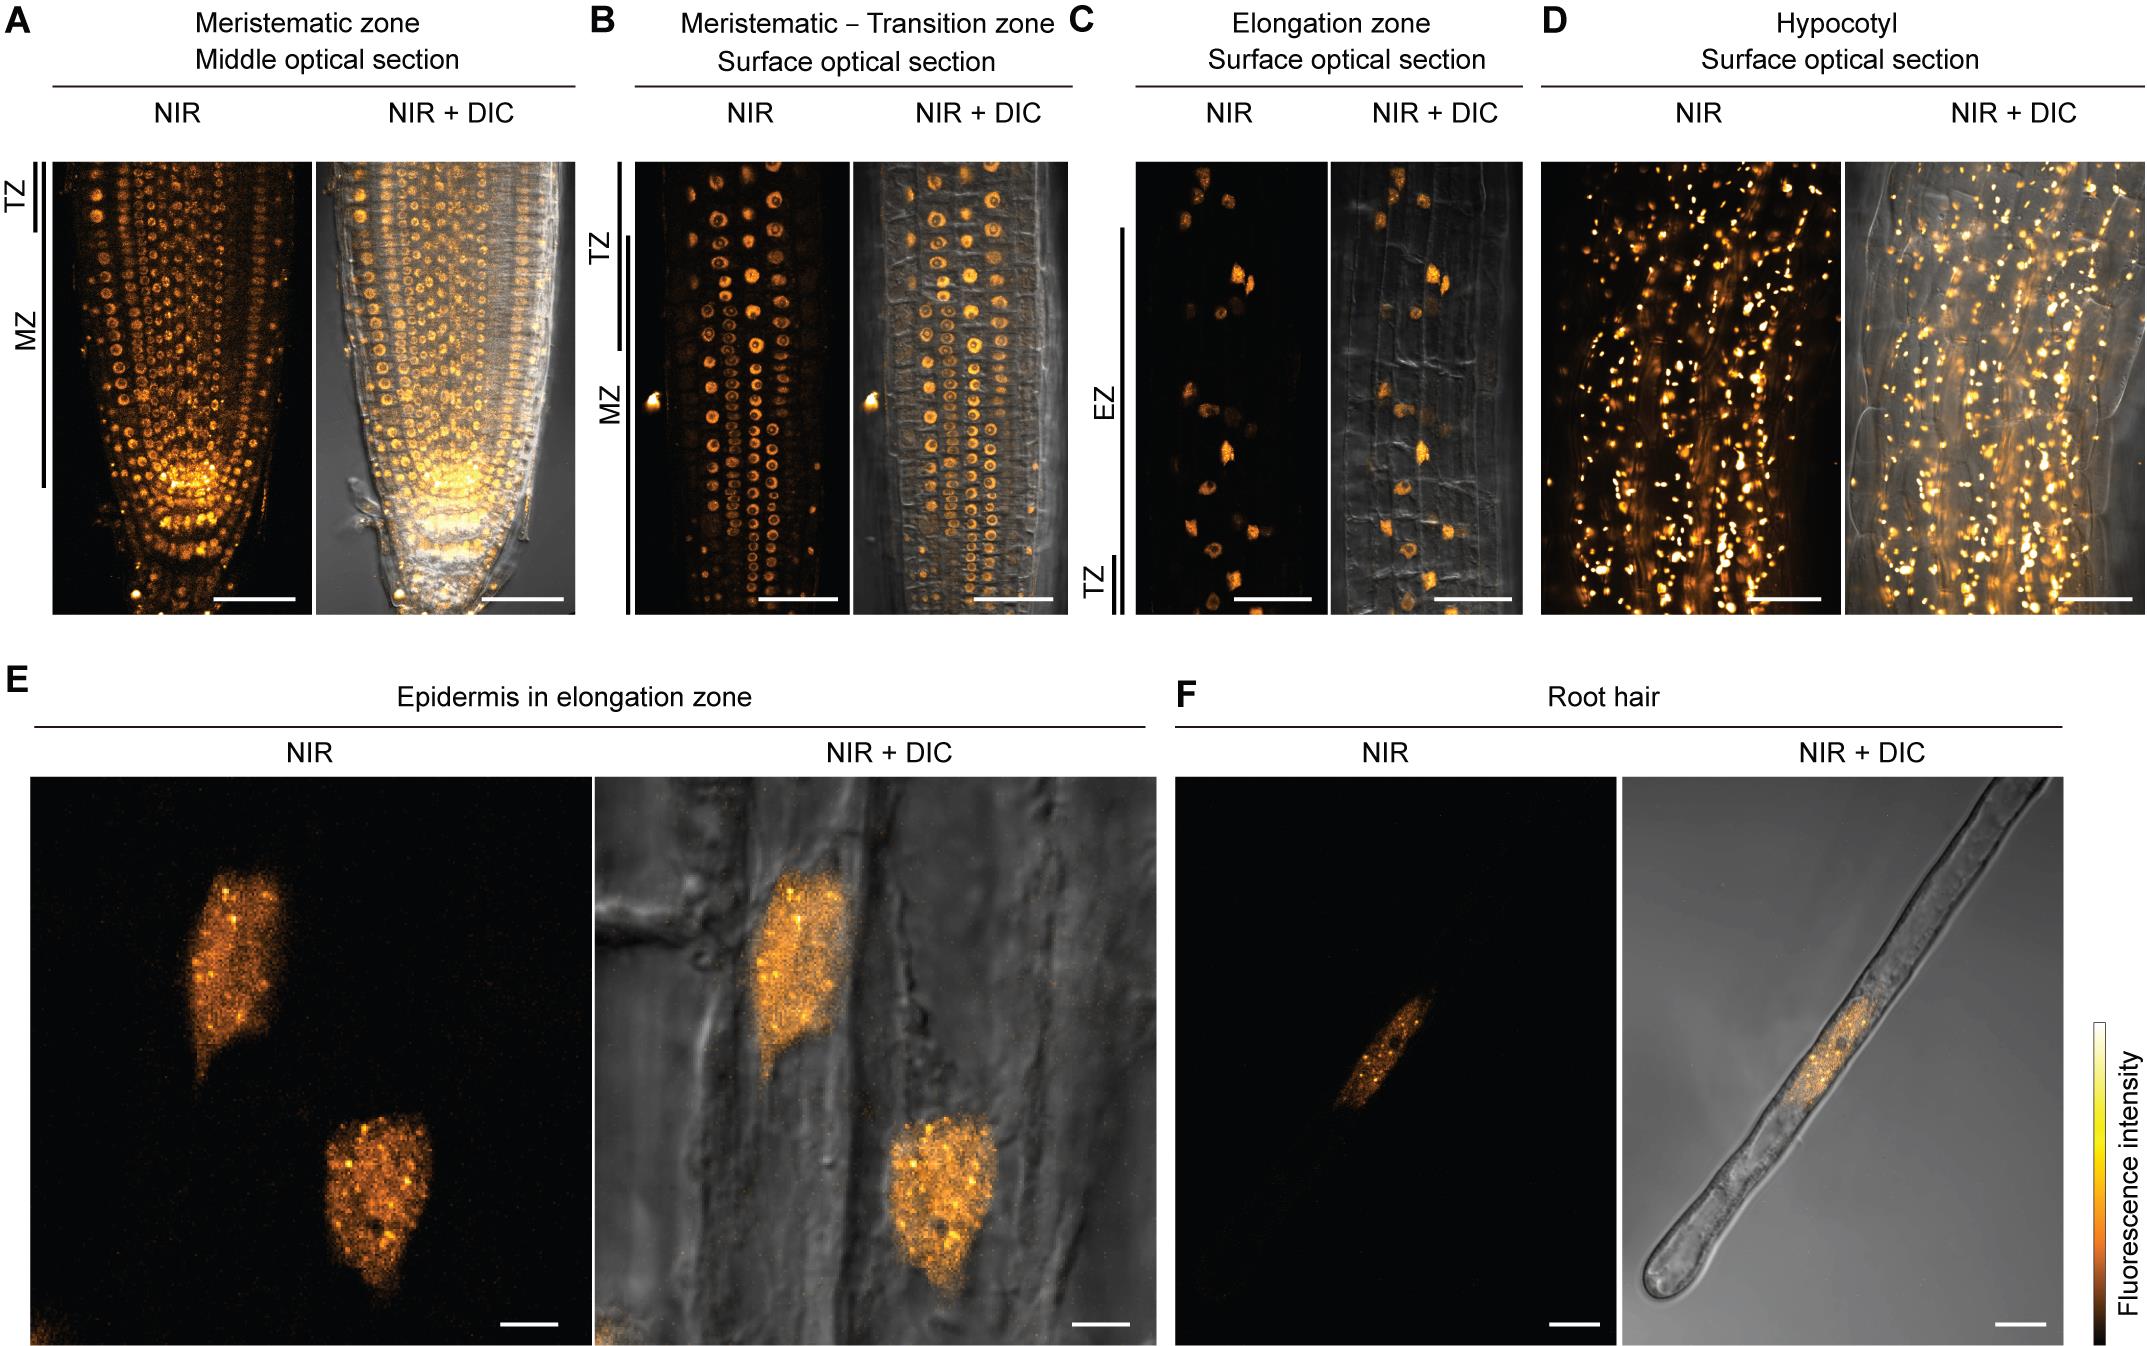
Figure 1. Nuclear autofluorescence imaging. Confocal images of near-infrared (NIR) fluorescence with differential interference contrast (DIC) images in Arabidopsis thaliana roots and hypocotyl. (A–D) Confocal images were taken with a 40× water-immersion lens. (A) Middle optical section of the primary root tip. (B) Surface optical section of meristematic to transition zone. (C) Surface optical section of the elongation zone. (D) Surface optical section of the hypocotyl. In this condition, nuclei were not properly observed due to the high intensity of chloroplast autofluorescence. Laser power was decreased to prevent damage to the detector by strong chloroplast autofluorescence. (E, F) Confocal images were taken with a 63× oil immersion lens. (E) Nuclei of epidermal cells in the elongation zone. (F) Nucleus in root hair cell. Scale bars represent 50 μm (A–D), 5 μm (E), and 10 μm (F). MZ, meristematic zone; TZ, transition zone; EZ, elongation zone.
Critical: Signal generation requires relatively high excitation energy compared to fluorescent protein, fluorescent probes, or chlorophyll imaging. For the imaging of NIR nuclear autofluorescence, we typically use 0.4 mW of laser power (measured at the objective back focal plane), which is significantly higher than the autofluorescence imaging of chloroplasts. We found the NIR autofluorescence of chloroplasts in the cotyledon to be ~9,500-fold higher than that of nuclei in the roots of Arabidopsis.
5. Multicolor imaging is possible with blue (e.g., CFP, DAPI) and green (e.g., GFP, YFP) fluorophores. Red fluorophores (e.g., mRFP, mCherry) may crosstalk in the NIR channel (656–700 nm) when expressed at high levels. Here, we observed nuclear autofluorescence together with the fluorescence of BOR1-GFP or DAPI. GFP was excited with a 488 nm laser, and the fluorescence signal was detected within the range of 495–545 nm (Figure 2). DAPI was excited with a 405 nm laser and detected within the range of 410–470 nm (Figure 3).
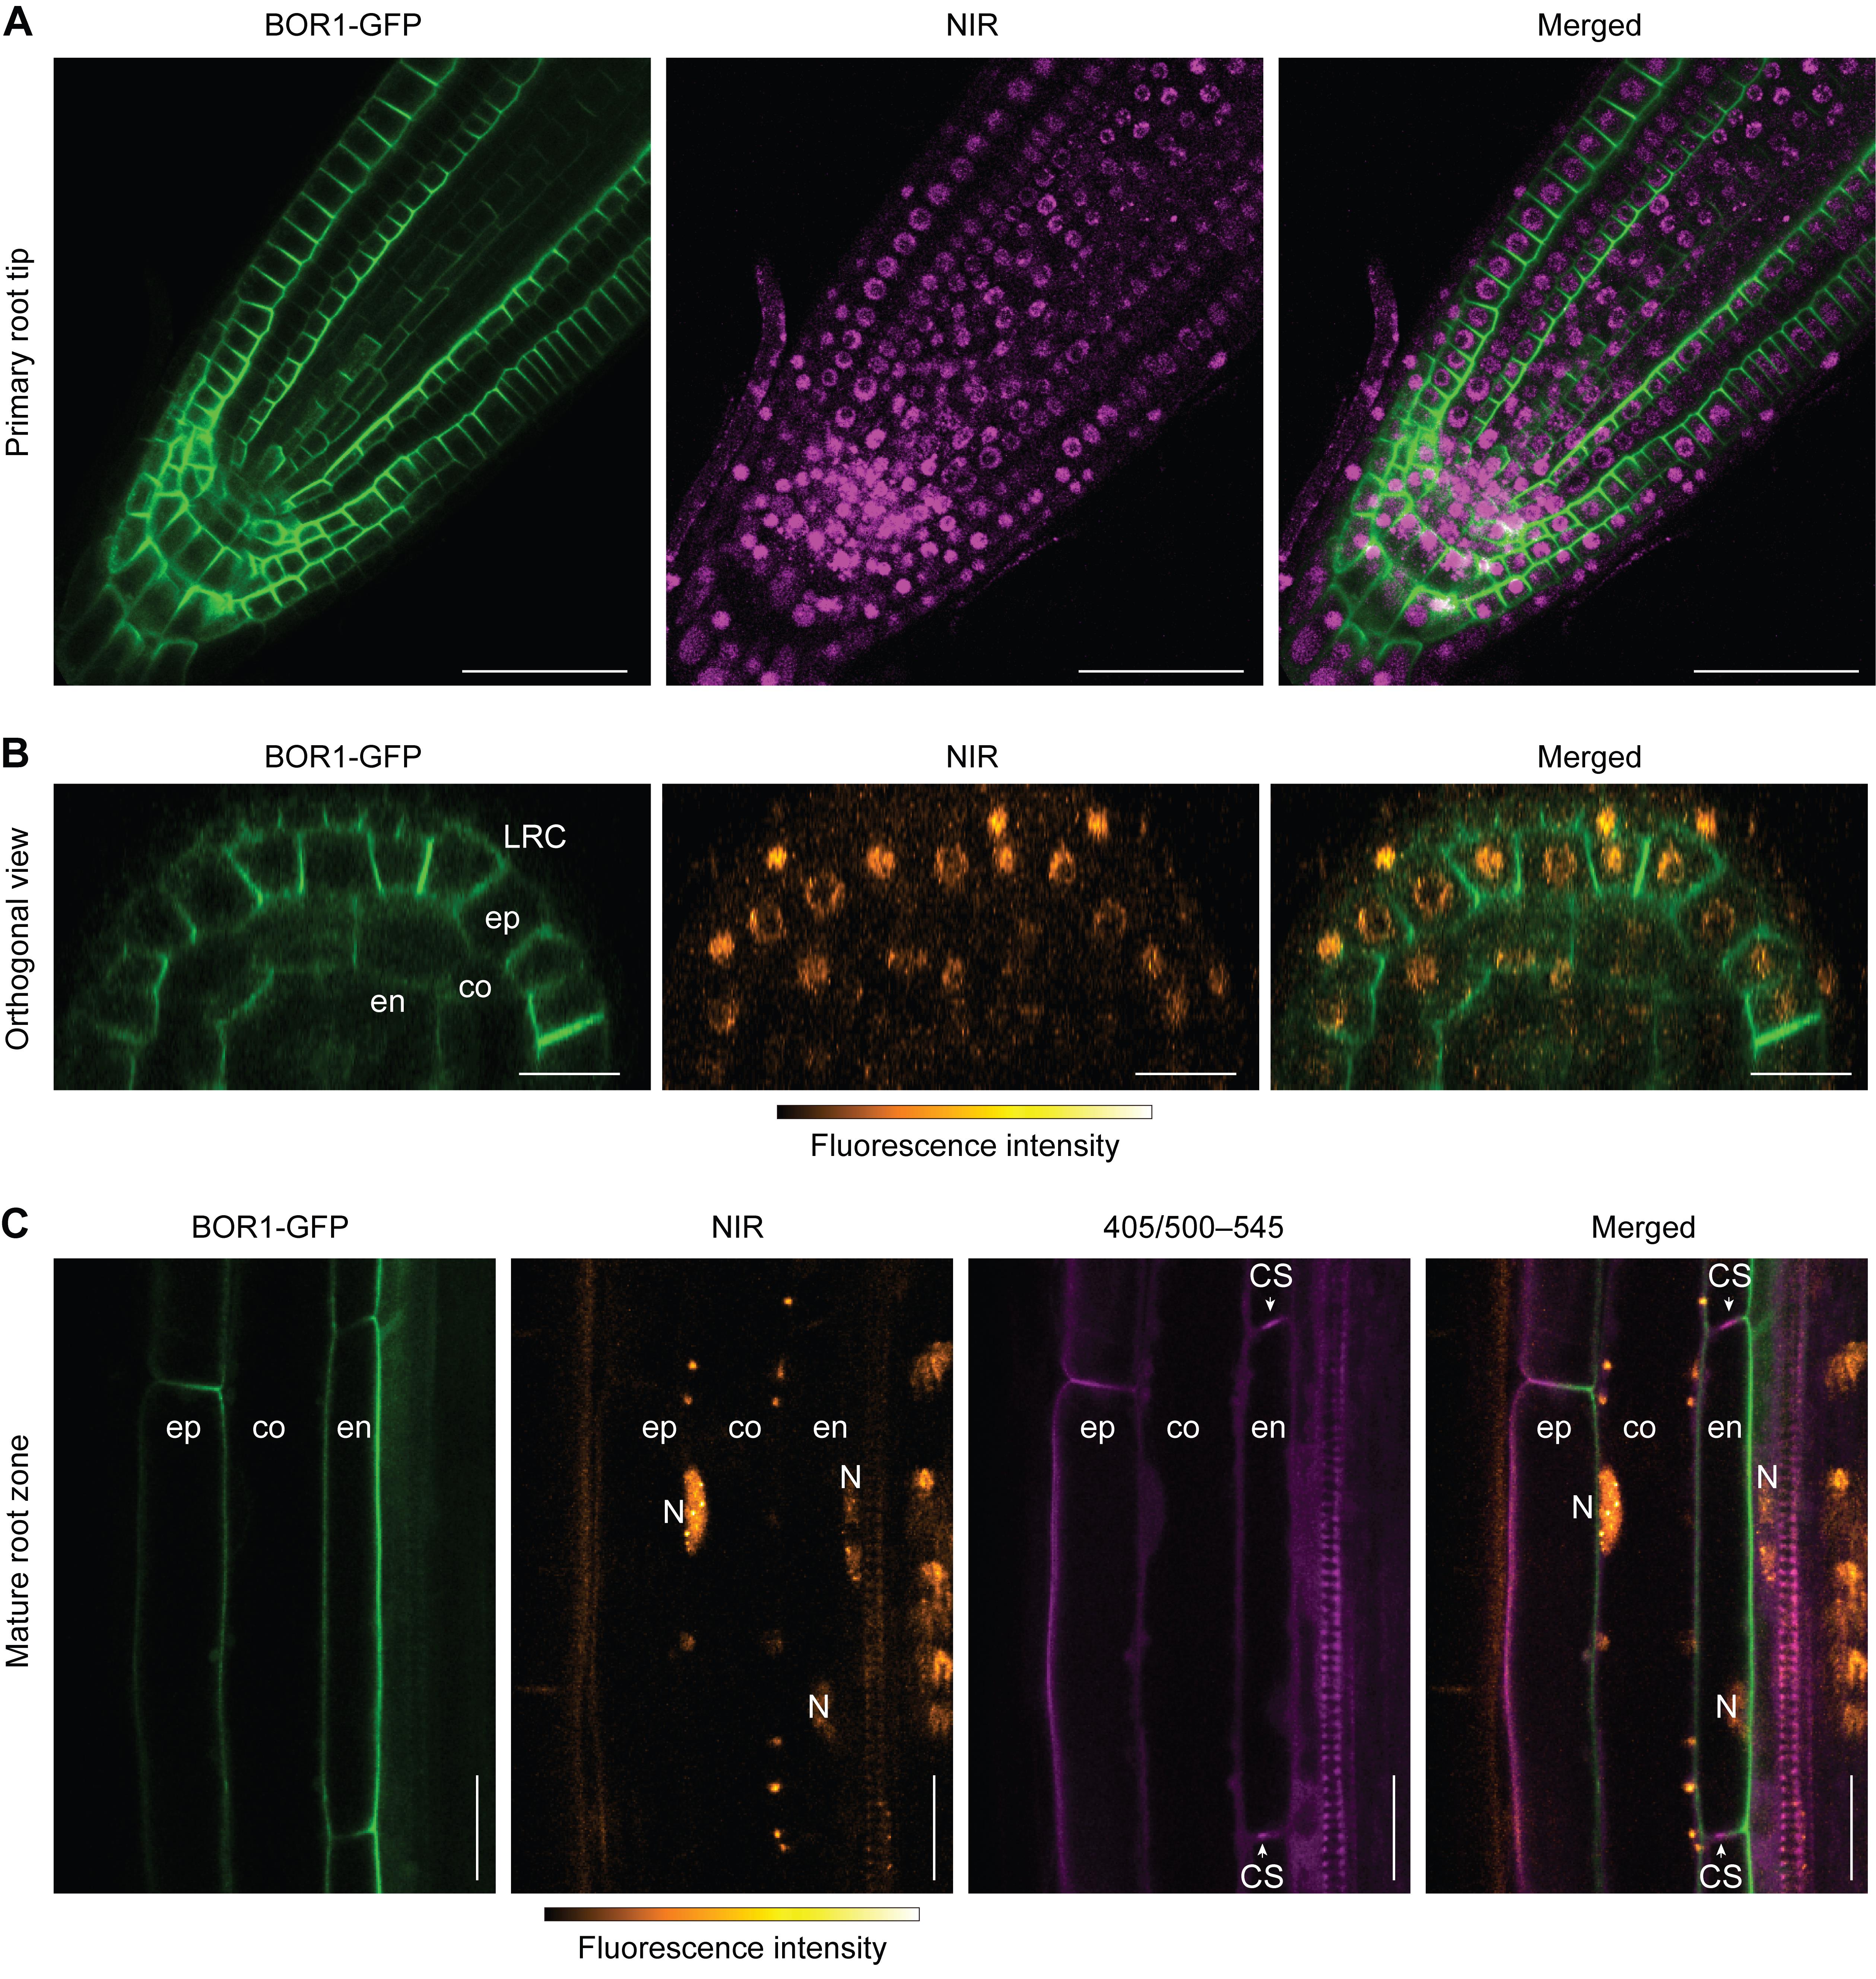
Figure 2. Multicolor imaging of nuclei with GFP. Confocal images of near-infrared (NIR) fluorescence and BOR1-GFP in Arabidopsis thaliana roots. (A) BOR1-GFP and NIR fluorescence in the primary root tip. Note that the region containing root stem cell niches and columella cells emits non-nuclear autofluorescence in the range of NIR wavelength. (B) Orthogonal reconstruction of z-stack images in the root meristematic zone. Images were taken with 1 μm z-steps and reconstructed orthogonally by ImageJ software. (C) Multicolor imaging of BOR1-GFP, NIR, and UV-excited green fluorescence (405/500–545 nm). Lignin, the phenolic polymer, emits a green fluorescence excited by UV range [1,3]. LRC, lateral root cap; ep, epidermis; co, cortex; en, endodermis; N, nucleus; CS, Casparian strip. Scale bars represent 50 μm (A) and 20 μm (B, C).
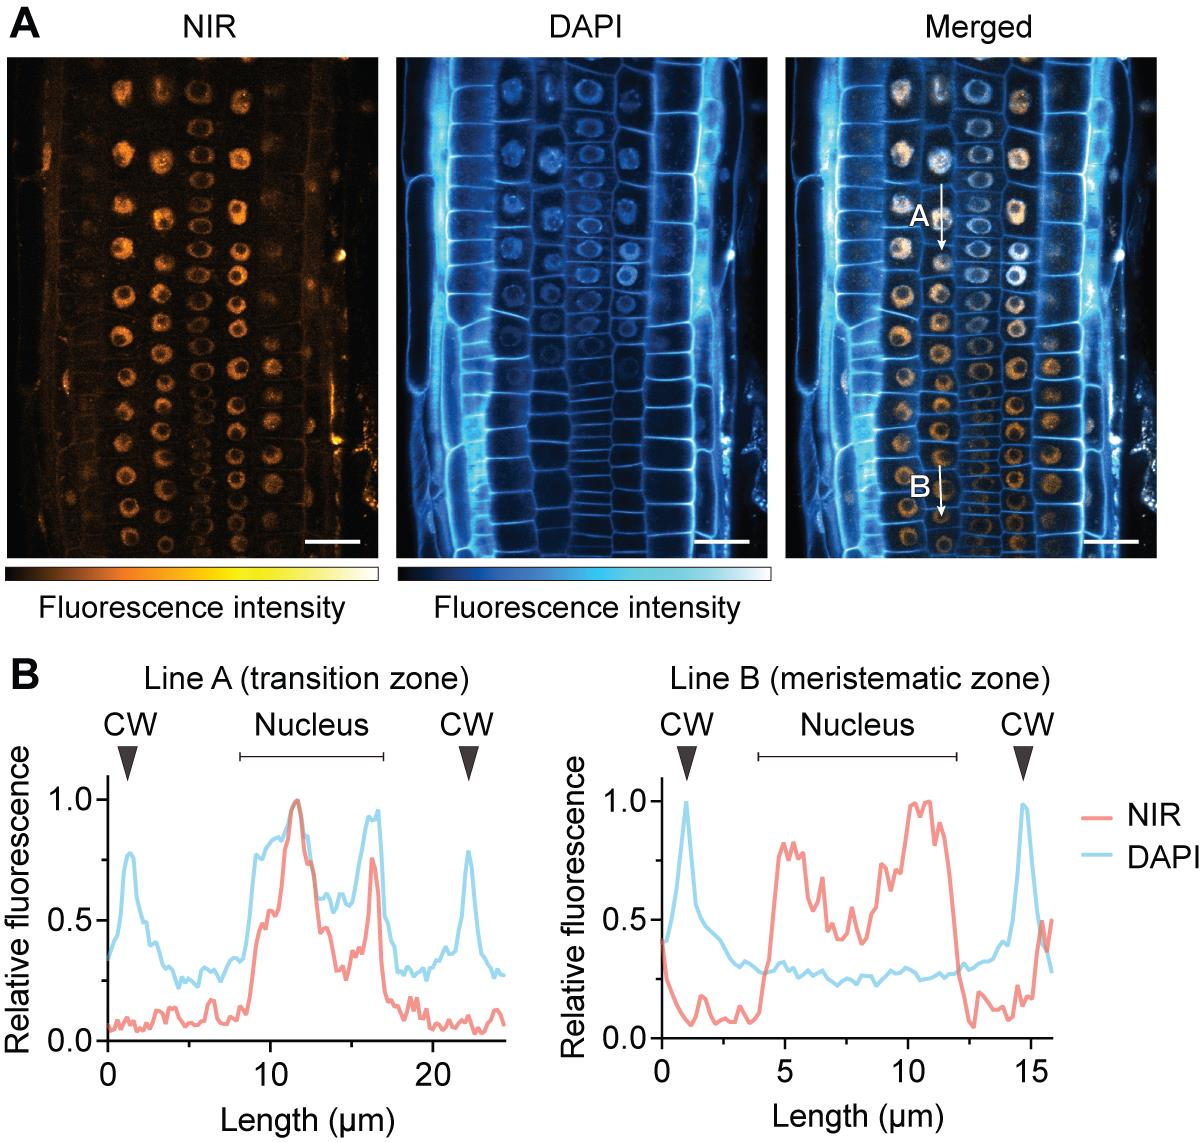
Figure 3. Comparison with DAPI staining. DAPI exhibits limited nuclear staining efficiency in living cells compared to fixed cells, preferentially staining the cell wall. (A) Confocal images of near-infrared (NIR) and DAPI fluorescence. Plants were stained with 5 μg/mL DAPI solution for 30 min. Samples were directly mounted on slide glasses without washout of DAPI. DAPI fluorescence was detected in the cell wall and nuclei in the transition to the elongation zone but not in the nuclei in the meristematic zone. (B) Relative fluorescence intensity of NIR and DAPI along the indicated lines: In the transition zone (line A), both DAPI and NIR were observed in the nucleus. In the meristematic zone (line B), only NIR fluorescence localized to the nucleus. CW, cell wall. Scale bars represent 20 μm.
Validation of protocol
Experiments were repeated independently three times with comparable results.
This protocol has been used and validated for reproducibility and robustness through multiple independent replicates in the following research article:
• Yoshinari et al. [5] Near-infrared imaging of phytochrome-derived autofluorescence in plant nuclei. Plant Journal (Figure 1a, b, c, e, and f; Figure 6a and c; and Supplementary Figures 1, 2, 5, 9, 10, 11, and 12).
General notes and troubleshooting
1. Chloroplasts exhibit strong autofluorescence in the NIR wavelength range, complicating the detection of nuclear autofluorescence. Nuclear autofluorescence is predominantly observed in regions devoid of chloroplasts, such as young root tips and pollen grains or tubes. In plant species with strong autofluorescence in the cell wall, it is challenging to detect nuclear autofluorescence.
2. Since nuclear autofluorescence originates from phytochromes, environmental conditions such as light and temperature potentially influence the quality of nuclear imaging. Notably, reduced fluorescence is observed in dark-grown seedlings [5].
3. Long-term timelapse imaging with short intervals may affect plant growth due to phototoxicity, as strong red light is necessary to excite phytochromes.
4. Root stem cell niches, columella cells, and mature tissues generally emit non-nuclear autofluorescence in the range of NIR wavelength. Consequently, nuclear autofluorescence imaging is most effective for cells in the meristematic zone, excluding stem cells, transition to the elongation zone, and root hairs (see Figure 2A–C).
5. Due to limited membrane permeability, DAPI preferentially stains cell walls rather than nuclei in live plant tissues. Efficient nuclear staining is observed in the transition zone compared to the meristematic zone [5]. A comparison of NIR autofluorescence and DAPI staining results is illustrated in Figure 3.
6. Illuminating nuclei with a 650 nm laser induces the conversion of phytochrome from the Pr (inactive) to the Pfr (active) form, potentially affecting cellular processes that respond to light.
7. Since this imaging technique utilizes a high-intensity laser, light toxicity that damages samples is unavoidable. Therefore, we recommend minimizing scanning time and monitoring the cytoplasmic streaming using the DIC or brightfield channel to ensure cell viability.
Acknowledgments
A.Y. and M.N. conceived the project. A.Y. performed experiments. A.Y. and M.N. wrote the paper. This work was supported by Japanese Society for the Promotion of Science (JSPS) grants 23H02473 to M.N. and 22K15139 to A.Y., a SUNBOR grant from Suntory Foundation of Life Sciences to M.N., and a JST PRESTO grant JPMJPR22D9 to A.Y. This work was also supported by the Program for Promoting the Enhancement of Research Universities as young researcher units for the advancement of new and undeveloped fields at Nagoya University. This work was described and validated in Yoshinari et al. [5].
Competing interests
The authors declare no conflicts of interest.
References
- Donaldson, L. (2020). Autofluorescence in Plants. Molecules. 25(10): 2393. https://doi.org/10.3390/molecules25102393
- Müller, S. M., Galliardt, H., Schneider, J., Barisas, B. G. and Seidel, T. (2013). Quantification of Förster resonance energy transfer by monitoring sensitized emission in living plant cells. Front Plant Sci. 4: 413. https://doi.org/10.3389/fpls.2013.00413
- Naseer, S., Lee, Y., Lapierre, C., Franke, R., Nawrath, C. and Geldner, N. (2012). Casparian strip diffusion barrier in Arabidopsis is made of a lignin polymer without suberin. Proc Natl Acad Sci USA. 109(25): 10101–10106. https://doi.org/10.1073/pnas.1205726109
- Izumi, M., Nakamura, S., Otomo, K., Ishida, H., Hidema, J., Nemoto, T. and Hagihara, S. (2024). Autophagosome development and chloroplast segmentation occur synchronously for piecemeal degradation of chloroplasts. eLife. 12: RP93232. https://doi.org/10.7554/elife.93232
- Yoshinari, A., Isoda, R., Yagi, N., Sato, Y., Lindeboom, J. J., Ehrhardt, D. W., Frommer, W. B. and Nakamura, M. (2024). Near‐infrared imaging of phytochrome‐derived autofluorescence in plant nuclei. Plant J. 118(5): 1699–1712. https://doi.org/10.1111/tpj.16699
- Legris, M., Klose, C., Burgie, E. S., Rojas, C. C. R., Neme, M., Hiltbrunner, A., Wigge, P. A., Schäfer, E., Vierstra, R. D. and Casal, J. J. (2016). Phytochrome B integrates light and temperature signals in Arabidopsis. Science. 354(6314): 897–900. https://doi.org/10.1126/science.aaf5656
- Yoshinari, A., Hosokawa, T., Amano, T., Beier, M. P., Kunieda, T., Shimada, T., Hara-Nishimura, I., Naito, S. and Takano, J. (2019). Polar Localization of the Borate Exporter BOR1 Requires AP2-Dependent Endocytosis. Plant Physiol. 179(4): 1569–1580. https://doi.org/10.1104/pp.18.01017
- Schneider, C. A., Rasband, W. S. and Eliceiri, K. W. (2012). NIH Image to ImageJ: 25 years of image analysis. Nat Methods. 9(7): 671–675. https://doi.org/10.1038/nmeth.2089
Article Information
Publication history
Received: Jan 6, 2025
Accepted: Mar 16, 2025
Available online: Mar 25, 2025
Published: Apr 20, 2025
Copyright
© 2025 The Author(s); This is an open access article under the CC BY-NC license (https://creativecommons.org/licenses/by-nc/4.0/).
How to cite
Yoshinari, A. and Nakamura, M. (2025). Near-Infrared Autofluorescence Imaging of Nuclei in Living Plant Roots. Bio-protocol 15(8): e5274. DOI: 10.21769/BioProtoc.5274.
Category
Plant Science > Plant cell biology > Cell imaging
Cell Biology > Cell imaging > Confocal microscopy
Do you have any questions about this protocol?
Post your question to gather feedback from the community. We will also invite the authors of this article to respond.