- Protocols

- Articles and Issues
- For Authors
- About
- Become a Reviewer

Detection and Analysis of S-Acylated Proteins via Acyl Resin–Assisted Capture (Acyl-RAC)
Published: Vol 15, Iss 7, Apr 5, 2025 DOI: 10.21769/BioProtoc.5268 Views: 1939
Reviewed by: Joyce ChiuMoua Yang
Original research article
The authors used this protocol in:

Nov 2023
Advertisement


Protocol Collections
Comprehensive collections of detailed, peer-reviewed protocols focusing on specific topics


Abstract
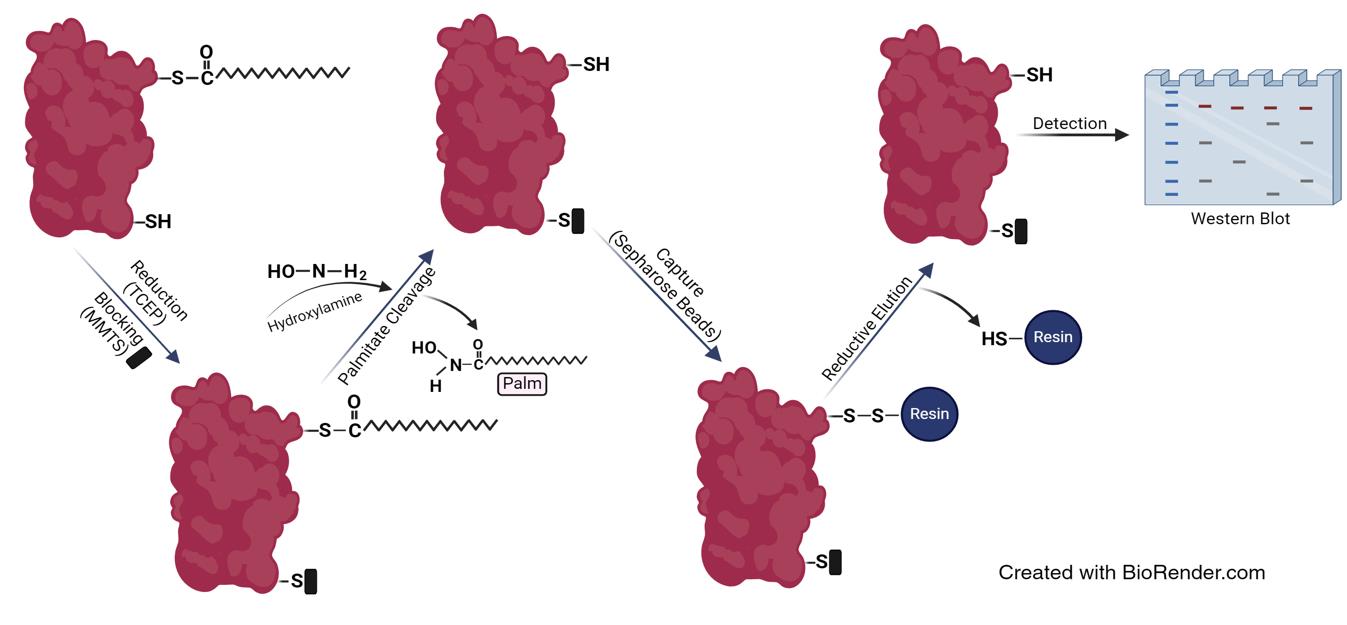
Protein palmitoylation is a lipid modification where a palmitoyl group is covalently attached via a thioester linkage to one or more cysteines on a substrate protein. This modification, catalyzed by a group of enzymes named DHHC enzymes after their conserved Asp-His-His-Cys motif, plays a significant role in regulating the localization, stability, and function of a wide range of cellular and viral proteins. By influencing how and where proteins interact within the cell, palmitoylation is essential for various cellular processes, including signaling pathways, membrane dynamics, and protein–protein interactions. Here, we describe the acyl-RAC assay, a biochemical technique designed to specifically enrich and analyze palmitoylated proteins from complex biological samples, such as cell lysates or tissue extracts. The assay begins by reducing and blocking free cysteine thiol groups on proteins, ensuring that only those thiols involved in thioester bonds with palmitates are accessible for downstream analysis. These thioester bonds are then cleaved to release the fatty acids from the cysteines, which are subsequently captured using thiopropyl Sepharose beads that bind to the newly exposed thiol groups. The captured proteins are eluted from the beads by breaking the bond between the thiol and the resin with reducing agents, and the proteins are then analyzed by SDS-PAGE followed by western blotting to identify and quantify them. The acyl-RAC assay's specificity for S-palmitoylated proteins makes it an invaluable tool for exploring this modification. It not only allows for the identification of previously unknown palmitoylated proteins, thereby deepening our understanding of palmitoylation in cellular processes and viral infections, but it also enables quantitative comparisons of protein palmitoylation under different experimental conditions or treatments.
Key features
• Allows identification of acylated proteins.
• Quantitative analysis of S-palmitoylation levels under various conditions by western blot.
• Requires at least seven days to complete.
Keywords: SARS-CoV-2Graphical overview
Background
Protein palmitoylation is a vital, reversible lipid modification that plays a key role in a wide range of cellular activities, such as membrane trafficking, cell signaling, and the formation of protein complexes [1]. This process extends beyond cellular proteins and also plays a significant role in the viral life cycle, aiding in the correct assembly and function of viral particles [2]. The study of protein palmitoylation can yield valuable insights into various diseases, including cancer, neurological disorders, and infectious diseases, where abnormal palmitoylation is frequently implicated [3]. Additionally, research in this field may contribute to the development of therapeutic strategies that target this critical modification [4].
The conventional and widely regarded "gold standard" approach for identifying acylated proteins is the utilization of radioactive palmitate, either labeled with [3H] or [14C], which incorporates into palmitoylation sites [5,6]. Nevertheless, this method is limited to studying S-acylation in cultured cells and cannot be employed for intact tissue. In addition to the safety concerns that arise due to radiation exposure, the technique's limited sensitivity in detecting low-abundance palmitoylated proteins and its low throughput make it less efficient for extensive studies [7]. Another approach for studying palmitoylation is a click chemistry–based method that involves labeling the substrate protein with an azide-linked fatty acid analog, 17-octadecynoic acid (17-ODYA), which attaches to palmitoylation sites and subsequently conjugates to a fluorescent tag with an azide group through a Cu (I)-catalyzed click chemistry reaction. SDS-PAGE is then used for in-gel fluorescence detection of the palmitoylated proteins using a Typhoon scanner. While this method is considered an effective tool for studying palmitoylation, it has several drawbacks, including the high cost of specialized tags and copper catalysts and inadequate sensitivity to detect low-abundance palmitoylated proteins [8,9].
The primary advantage of the acyl-RAC assay [10], along with the closely related acyl biotin exchange (ABE) assay [5], is their ability to detect palmitoylated proteins from both tissue and cultured cell samples. These assays utilize hydroxylamine to cleave thioester bonds, leveraging its nucleophilic properties to selectively target and break these bonds by attacking the carbonyl carbon. This specificity is due to the increased electrophilicity of thioesters, ensuring that amides, ester bonds, and non-palmitoylated cysteines remain intact. However, they cannot identify the specific type of bound fatty acid without mass spectrometry analysis. Additionally, if free cysteines are not adequately blocked, these methods may generate false palmitoylation signals. This issue can be mitigated by extending the reduction time and increasing the concentration of the blocking agent. The nonspecific detection of non-palmitoylated proteins can be investigated by processing an equal volume of the protein extract in parallel but without the hydroxylamine treatment step used to cleave thioester bonds. These negative control samples help confirm the protocol's specificity for detecting palmitoylated proteins [11].
Acyl-RAC has been employed to study the palmitoylation of various cellular and viral proteins [12,13]. In this protocol, we apply the acyl-RAC assay to investigate the role of certain amino acids of the SARS-CoV-2 spike protein in its palmitoylation, by comparing the palmitoylation levels of spike mutants with the wild type (WT). We selected the SARS-CoV-2 spike as a model since its palmitoylation is crucial for its membrane association, stability, and functionality [14,15]. Studying this modification provides valuable insights into this viral protein regulation and highlights potential therapeutic targets.
Materials and reagents
Biological materials
1. Human embryonic kidney (HEK) 293T cells (American Type Culture Collection, catalog number: ATCC CRL-11268)
2. pCAGGS plasmids with cloned codon-optimized sequence of WT or mutated spikes. The pCAGGS plasmid containing the WT spike sequence was kindly provided by Dr. Dusan Kunec, Free University of Berlin. Mutations in the spike were introduced using the QuickChangeTM site-directed mutagenesis protocol [16]
Reagents
Tissue culture
1. Dulbecco’s modified Eagle’s medium (DMEM) (PAN Biotech, catalog number: P04-05551)
2. Fetal bovine serum (FBS) (PAN Biotech, catalog number: P30-3306)
3. Penicillin/Streptomycin (10,000 U/mL) (PAN Biotech, catalog number: P06-07100)
4. Trypsin/EDTA (PAN Biotech, catalog number: P10-023100)
Transfection
1. Lipofectamine 3000 transfection reagent (Thermo Fisher, catalog number: L3000015)
2. Opti-MEMTM I reduced serum medium (Thermo Fisher, catalog number: 31985070)
Acyl-RAC
1. Thiopropyl agarose beads (Creative biomart, catalog number: Thio-001A)
2. Methyl methanethiosulfonate (MMTS) (Sigma-Aldrich, catalog number: 208795)
3. Tris (2-carboxyethyl) phosphine hydrochloride (TCEP) (Carl Roth, catalog number: HN95.2)
4. cOmpleteTM, EDTA-free protease inhibitor cocktail (Roche, catalog number: 11873580001)
5. Sodium dodecyl sulfate (SDS) (Carl Roth, catalog number: 2326.4)
6. Acetone (Carl Roth, catalog number: 20T0.1)
7. Hydroxylamine hydrochloride (HA) (Thermo Fisher, catalog number: 159417-100G)
8. Tris (Carl Roth, catalog number: 2449.2)
9. Hydrochloric acid (HCL) (Carl Roth, catalog number: 2607.1)
10. Sodium hydroxide (NaOH) (Carl Roth, catalog number: 9356.1)
11. HEPES (Carl Roth, catalog number: HN77.3)
12. NaCl (Carl Roth, catalog number: 3957.1)
13. EDTA (AppliChem, catalog number: A2937)
14. Triton X-100 (Merck, catalog number: 8603)
SDS-PAGE and western blot
1. Tetramethylethylenediamine (TEMED) (Carl Roth, catalog number: 2367.3)
2. Ammonium persulfate (APS) (Carl Roth, catalog number: 9592.2)
3. Sodium dodecyl sulfate (SDS) (Carl Roth, catalog number: 2326.4)
4. Bromophenol blue (Sigma-Aldrich, catalog number: 1081220005)
5. 30% acrylamide/bisacrylamide (37.5:1) (Carl Roth, catalog number: 3029.1)
6. Anti SARS-CoV-2 spike (S2 subunit) mouse monoclonal antibody (GeneTex, catalog number: GTX632604)
7. HRP-conjugated anti-mouse secondary antibody (Bio-Rad, catalog number: 1706516)
8. Anti flotillin-2 polyclonal mouse antibody (BD Biosciences, catalog number: 610383)
9. Goat anti-mouse IgG (H + L) antibody with horseradish peroxidase conjugate (Bio-Rad, catalog number: 1706516)
10. Pierce ECL Plus reagent (Thermo Fisher, catalog number: 32132)
11. Skimmed milk powder (Carl Roth, catalog number: T145.3)
12. Bovine serum albumin (BSA) (Sigma-Aldrich, catalog number: A7906)
13. Tween 20 (Carl Roth, catalog number: 9127.1)
14. Glycerol (Carl Roth, catalog number: 3783.1)
15. 1,4-Dithiothreitol (DTT) (Carl Roth, catalog number: 6908.2)
16. KCl (Carl Roth, catalog number: HN02.3)
17. Na2HPO4 (Carl Roth, catalog number: 4984.4)
18. KH2PO4 (AppliChem, catalog number: A3095)
19. Methanol (Sigma-Aldrich, catalog number: 106009)
Solutions
1. Phosphate buffer saline (PBS) (see Recipes)
2. Phosphate buffer saline-Tween (PBST) (see Recipes)
3. Protease inhibitor 25× (see Recipes)
4. Buffer A (lysis buffer) (see Recipes)
5. Blocking buffer (see Recipes)
6. Binding buffer (see Recipes)
7. 5× reducing SDS-PAGE sample buffer (see Recipes)
8. Stacking SDS-PAGE gel solution (see Recipes)
9. Separating SDS-PAGE gel solution (see Recipes)
10. Membrane blocking solution (see Recipes)
11. 3% BSA (see Recipes)
12. Growth medium (see Recipes)
Recipes
Note: The shelf life of buffers stored at room temperature is up to six months. The shelf life of buffers stored at 4 °C or -20 °C is up to one year.
1. 1× Phosphate buffer saline (PBS)
| Reagent | Final concentration | Quantity or Volume |
|---|---|---|
| NaCl | 137 mM | 8 g |
| KCl | 2.7 mM | 0.2 g |
| Na2HPO4 | 10 mM | 1.44 g |
| KH2PO4 | 1.8 mM | 0.24 g |
| dH2O | n/a | See note* |
| Total | n/a | 1 L |
*Note: Add water to 800 mL first, allow the solution to mix completely, and adjust the pH to 7.4 with HCl before topping up water to 1 L.
Autoclave and store at room temperature.
2. Phosphate buffer saline-Tween (PBST)
| Reagent | Final concentration | Quantity or Volume |
|---|---|---|
| PBS | 1× | 999 mL |
| Tween-20 | 0.1% | 1 mL |
| Total | n/a | 1,000 mL |
Store at room temperature.
3. Protease inhibitor 25×
| Reagent | Final concentration | Quantity or Volume |
|---|---|---|
| cOmpleteTM, EDTA-free protease inhibitor cocktail | n/a | 1 tablet |
| dH2O | n/a | 2 mL |
Store at -20 °C.
4. Buffer A (lysis buffer)
| Reagent | Final concentration | Quantity or Volume |
|---|---|---|
| HEPES | 25 mM | 5.96 g |
| NaCl | 25 mM | 1.46 g |
| EDTA | 1 mM | 0.37 g |
| Triton X-100 | 1.5% | 15 mL |
| dH2O | n/a | See note* |
| Protease inhibitor cocktail | 1× | Freshly added according to the volume needed of Buffer A |
| Total | n/a | 1 L |
*Note: Add water to 800 mL and allow the solution to mix completely before topping up water to 1 L.
Filter and store at 4 °C. pH should be 7.2–7.6.
5. Blocking buffer
| Reagent | Final concentration | Quantity or Volume |
|---|---|---|
| HEPES | 100 mM | 23.83 g |
| EDTA | 1 mM | 0.37 g |
| SDS | 87.5 mM | 25.23 g |
| dH2O | n/a | See note* |
| MMTS | 1.5% (v/v) | Freshly added according to the volume needed of blocking buffer |
| Total | n/a | 1,000 mL |
*Note: Add water to 800 mL and allow the solution to mix completely before topping up water to 1 L.
Filter and store at 4 °C. pH should be 7.2–7.6.
6. Binding buffer
| Reagent | Final concentration | Quantity or Volume |
|---|---|---|
| HEPES | 100 mM | 23.83 g |
| EDTA | 1 mM | 0.37 g |
| SDS | 35 mM | 10.09 g |
| dH2O | n/a | See note* |
| Total | n/a | 1,000 mL |
*Note: Add water to 800 mL first and allow the solution to mix completely before topping up water to 1 L.
Filter and store at 4 °C. pH should be 7.2–7.6.
7. 5× reducing SDS-PAGE sample buffer
| Reagent | Final concentration | Quantity or Volume |
|---|---|---|
| Tris-HCL (pH 6.5) | 300 mM | 1.5 mL (from 1 M stock) |
| SDS | 10% (w/v) | 1 g |
| Bromophenol blue | 0.05% (w/v) | 5 mg |
| Glycerol | 50% (v/v) | 5 mL |
| 1,4-Dithiothreitol (DTT) | 500 mM | 0.77 g |
| dH2O | n/a | To 10 mL |
For long-term use, aliquot and store at -20 °C. Avoid repeated freeze-thaw cycles if possible.
8. Stacking SDS-PAGE gel solution
| Reagent | Final concentration | Quantity or Volume for 2 gels |
|---|---|---|
| 30% Acrylamide/Bis solution (37.5:1) | 5% (w/v) | 1.66 mL |
| 1.0 M Tris-HCl (pH 6.8) | 0.5 M | 1.26 mL |
| 10% SDS | 0.1% (w/v) | 100 μL |
| 10% APS | 0.1% (v/v) | 100 μL |
| TEMED | 0.1% (v/v) | 10 μL |
| dH2O | n/a | 7 mL |
Prepare fresh.
9. Separating SDS-PAGE gel solution
| Reagent | Final concentration | Quantity or Volume for 2 gels |
|---|---|---|
| 30% Acrylamide/bisacrylamide | 12% (w/v) | 8 mL |
| 1.5 M Tris-HCl (pH 8.8) | 1.5 M | 5 mL |
| 10% SDS | 0.2% (w/v) | 200 μL |
| 10% APS | 0.2% (v/v) | 200 μL |
| TEMED | 0.2% (v/v) | 20 μL |
| dH2O | n/a | 6.6 mL |
Prepare fresh.
10. Membrane blocking solution
| Reagent | Final concentration | Quantity or Volume |
|---|---|---|
| Skimmed milk powder | 3% (w/v) | 0.3 g |
| PBST | n/a | 10 mL |
Prepare fresh.
11. 3% BSA
| Reagent | Final concentration | Quantity or Volume |
|---|---|---|
| BSA | 3% (w/v) | 0.3 g |
| PBST | n/a | 10 mL |
Prepare fresh.
12. Growth medium
| Reagent | Final concentration | Quantity or Volume |
|---|---|---|
| DMEM | n/a | 445 mL |
| FBS | 10% | 50 mL |
| Penicillin/Streptomycin | 100 U/L | 5 mL |
Store at 4 °C.
Laboratory supplies
1. Sterile Pipette tips (10, 200, 1000 μL) (Sarstedt, catalog numbers: 70.3010.205, 70.3030.200, 70.3050.205)
2. Pipettes (5, 10, 25 mL) (Sarstedt, catalog numbers: 86.1253.001, 86.1254.001, 86.1685.001)
3. 6-well cell culture dishes (Sarstedt, catalog number: 83.3920.005)
4. T75 flasks (Sarstedt, catalog number: 83.3911.002)
5. Conical tubes (Sarstedt, catalog number: 62.554.002)
6. 1.5 mL microcentrifuge tubes (Sarstedt, catalog number: 72.706)
7. Polyvinylidene difluoride (PVDF) blotting membrane, 0.2 μm (VWR, catalog number: 732-3200)
8. Rotilabo® blotting papers (Carl Roth, catalog number: CL75.1)
Equipment
1. Pipette controller (Hirschmann Laboratories, model: Pipetus)
2. Sterile laminar flow (Bleymehl, model: ScanLaf)
3. HeracellTM 240i CO2 incubator, 240 L (Thermo Fisher, catalog number: 51032875)
4. Inverted microscope (Motic, model: AE20)
5. Tabletop centrifuge (Eppendorf, model: 5424R)
6. Biofuge Stratos centrifuge (Heraeus, catalog number: 11727)
7. Vortex Genie 2TM (Bender&Hobein AG, model: K-550 GE)
8. Orbital shaker (Peqlab, model: 0S-10)
9. -20 °C freezer (Liebherr, catalog number: 9005382246719)
10. Ice machine (Ziegra, model: 174059)
11. pH meter (Knick, model: 761-Calimatic)
12. Tube rotator (Carl Roth, model: ATX1.1)
13. Water bath shaker (Brunswick Scientific, model: C76)
14. SDS-PAGE system (Biometra, model: Mini-Gel Twin)
15. ThermoMixer® C heat block (Eppendorf, catalog number: 5382000023)
16. PowerPacTM HC power supply (Bio-Rad, model: 1645052)
17. CriterionTM vertical electrophoresis cell (Bio-Rad, model: 1656001)
18. CriterionTM empty cassettes (Bio-Rad, model: 3459901)
19. Chemiluminescence imaging system (Vilber Lourmat, model: Fusion SL)
20. Nanodrop (PeqLab, model: ND 1000)
Software and datasets
1. Image J v1.54f (NIH, 6/29/2023)
2. Prism v8.0.2 (GraphPad Software Inc., 6/2/2019)
3. Fusion v15.11 (Vilber Lourmat, 16/9/2019)
4. Microsoft Excel v16.54 (Microsoft corporation, 10/5/2021)
5. ND-1000 v3.0.7 (PeqLab, 2/17/2009)
Procedure
A. Expression of WT and mutant spikes in 293T cells
1. Transfection of 293T cells with pCAGGS plasmids
a. Grow 293T cells in growth medium (see Recipes) and maintain them in an incubator at 37 °C in a humidified atmosphere with 5% CO2. Use trypsin/EDTA (0.05% trypsin and 0.02% EDTA) to detach the cells for subsequent passaging.
b. Plate 1 × 10 293T cells per well in 6-well plates 16–24 h prior to transfection, aiming for 70%–90% confluency when transfected.
c. Dilute 3 μg of plasmid (WT or mutant spike) (concentration measured by Nanodrop), in 125 μL of serum-free Opti-MEM containing 5 μL of P3000 reagent, the transfection enhancer. Separately, dilute 5 μL of lipofectamine 3000 in 125 μL of Opti-MEM. Mix the two solutions, but do not vortex, and incubate for 5–10 min at room temperature.
d. Remove the medium in the 6-well plate and replenish it by adding 2 mL of fresh growth medium per well gently to the sides to prevent cell detachment.
e. Add the transfection complex dropwise to the medium and gently rock the plate for even distribution.
f. Incubate at 37 °C for 48 h.
2. Cell collection and lysis
a. Detach the cells by pipetting up and down with growth media; then, transfer them into a conical tube. Confirm the complete detachment of cells under the inverted microscope.
b. Centrifuge at 300× g for 5 min at 4 °C to pellet the cells and discard the supernatant.
c. Wash the pellet in 2 mL of 1× PBS, centrifuge again, and discard the supernatant.
d. Lysis buffer preparation: Supplement the required volume of Buffer A (500 μL per sample, with an additional 10% volume to account for pipetting errors) with 1× protease inhibitor (see Recipes). Use 500 μL of this lysis buffer to resuspend the pellet.
e. Resuspend the pellet in 500 μL of the prepared lysis buffer and transfer it to a 1.5 mL microcentrifuge tube. Then incubate on ice for 1 h with shaking on an orbital shaker.
f. Centrifuge lysates at 16,000× g for 15 min at 4 °C. Collect the supernatant and store at -20 °C.
Pause point: You may pause the protocol here for up to several months. Store the samples at -20 °C during the pause.
B. Acyl-RAC assay
1. Reduction of disulfide bonds in non-acylated cysteines
a. Dissolve TCEP powder to 0.5 M in distilled water (i.e., 72 mg in 0.5 mL).
Note: TCEP should be freshly prepared for each use.
b. Add 55 μL of TCEP per 500 μL of sample to achieve a 50 mM final concentration.
c. Rotate the samples at room temperature for 1 h using a tube rotator.
2. Blocking free SH groups and protein precipitation
a. Add 1 mL of blocking buffer (see Recipes) and 23.7 μL of MMTS to each sample (final concentration: 1.5%, final molarity: 0.1208 M).
b. Vortex and incubate at 40 °C in a water bath shaker for 4 h. Vortex periodically.
c. Add 6 mL of ice-cold acetone (4× the sample volume), mix thoroughly, and store at -20 °C for 24–48 h until protein precipitates become visible.
d. Centrifuge samples at 5,000× g for 10 min at 4 °C, discard the supernatant, and wash pellets four times with 1 mL of 70% acetone. Ensure no residual MMTS smell remains.
e. Air dry pellets and resuspend in 500 μL of binding buffer (see Recipes). Rotate on a tube rotator at room temperature until completely dissolved.
Pause point: You may pause the protocol here for up to several months. Store the samples at -20 °C during the pause.
3. Spike proteins expression check
a. Mix 40 μL of each sample with 10 μL of 5× reducing SDS-PAGE sample buffer (see Recipes), heat at 95 °C for 5 min in a heat block, then centrifuge at 2,500× g for 5 min at room temperature in a tabletop centrifuge.
b. Gel electrophoresis: Load 40 μL of each sample into a 12% acrylamide SDS-PAGE gel in the gel cassettes. Run at 80 V for ~30 min (stacking SDS-PAGE gel) and 160 V for ~1 h (separating SDS-PAGE gel) using an SDS-PAGE system.
c. Protein transfer: Transfer proteins onto a PVDF membrane that has been activated by soaking in 5 mL of 100% methanol for 1 min, using wet transfer in a vertical electrophoresis cell adjusting the power supply at 100 mA.
Note: Adjust transfer time based on the molecular weight of the target protein.
d. Block the membrane in 10 mL of membrane blocking solution (see Recipes) for 1 h at room temperature. Wash twice with 10 mL of PBST (see Recipes), each wash step for 5 min, and incubate with 10 mL of mouse anti-S2 subunit antibody, diluted 1:1,000 in 3% BSA (see Recipes), overnight (12–16 h) at 4 °C on an orbital shaker.
e. Wash membrane four times with 10 mL of PBST, 5 min each, and then incubate with 10 mL of HRP-conjugated anti-mouse secondary antibody (1:3,000 in 3% BSA) for 1 h at room temperature on an orbital shaker.
f. Repeat washing as in step B3e, remove any remaining PBST, add 1 mL of the ECL Plus reagent to the membrane according to the manufacturer’s instructions, and incubate it for a few minutes to develop the chemiluminescent signal. Capture bands using the chemiluminescence imaging system.
4. Cleavage of thioester bonds and pulling down proteins with free-SH groups
a. HA preparation: Dissolve 1.38 g of HA in 5 mL of Tris-HCl (pH 7.4), slowly adjust pH using NaOH back to 7.4, and bring to 10 mL for a final concentration of 2 M.
Note: HA should be freshly prepared for each use.
b. Beads preparation: Prepare thiopropyl agarose beads (50–100 μL/sample) by washing with 10 mL of distilled water. Centrifuge at 2,500× g for 10 min, discard water, and resuspend in binding buffer (50 μL/sample).
c. Divide the remaining volume of the precipitated protein samples into two aliquots of 225 μL each. Incubate one aliquot with beads in 100 μL of Tris-HCl and the other aliquot with beads in 100 μL of HA (final concentration is 0.5 M). Rotate at room temperature overnight in the dark on a tube rotator.
d. Wash beads five times with binding buffer and centrifuge at 9,000× g for 5 min at room temperature between washes using a tabletop centrifuge.
e. Resuspend beads in 50 μL of 5× reducing SDS-PAGE buffer. Heat at 95 °C for 5 min in a heat block and centrifuge at 2,500× g for 5 min. Use supernatant for western blotting as described in step B3.
Pause point: You may store the supernatant at -20 °C for up to several months.
Data analysis
1. Protein expression confirmation
The expression levels of mutated spike proteins were verified to be comparable to WT based on the total extract blot (Figure 1A). The density of acylated spike bands for each mutant was quantified and normalized against corresponding WT band intensities.
Note: Before proceeding with analysis, it is essential to confirm the specificity of the procedure for acylated proteins. This can be verified by ensuring that sample aliquots treated with Tris-HCl instead of HA produce an empty blot, as shown in Figure 1C.
2. Analysis workflow using ImageJ
ImageJ software was used to measure the intensity of western blot bands. The detailed area under the curve (AUC) measurement workflow is illustrated in Figure 1D:
a. Alignment and noise reduction: Bands were aligned horizontally, and background noise was removed to ensure accurate measurements.
Note: If the bands are misaligned, the image can be adjusted to align them horizontally using the Rotate tool. To do this, navigate to the menu Image → Transform → Rotate. A dialog box will appear, prompting you to enter the rotation angle. For example, if the bands are slanted at 15°, enter 15 or -15 depending on the direction of rotation. Tick the preview option to see the change of rotation before approving it.
b. Lane selection and histogram plotting: The rectangle tool (Figure 1D.i.1) was used to draw lanes around the protein bands (Figure 1B), which were plotted into histograms representing AUC values.
c. Boundary definition and intensity measurement: Lines were drawn to seal histograms (Figure 1D.ii), and the magic wand tool (Figure 1D.i.2) measured the enclosed area, reflecting the band’s intensity. The results appeared in new windows, showing quantitative values for each band (Figure 1D.iii).
3. Normalization and interpretation of results
The raw AUC values were exported to Microsoft Excel for normalization and further analysis. Table 1 summarizes the measured areas for the protein fragments (S, S2, and S2') in both WT and mutant variants (M1–M5).
a. Normalization process: Each value was normalized to WT according to the formula Normalized Value = Mutant Value/ WT Value.
For example, mutant M1’s full-length spike area was 6,473.418; when compared to WT's 9,660.225, it yielded a normalized value of 0.67. The WT normalized value is always set to 1. The same process was applied to the S2 and S2' fragments.
b. Cumulative scores for acylation comparison: The sum column adds up normalized values across the three fragments (S, S2, and S2'), providing an overview of acylation levels. Mutant M3 showed the closest match to WT (Sum = 0.96), suggesting minimal acylation changes. Mutants M1 and M5 had the lowest sums (0.50 and 0.48), indicating reduced acylation (Figure 2).
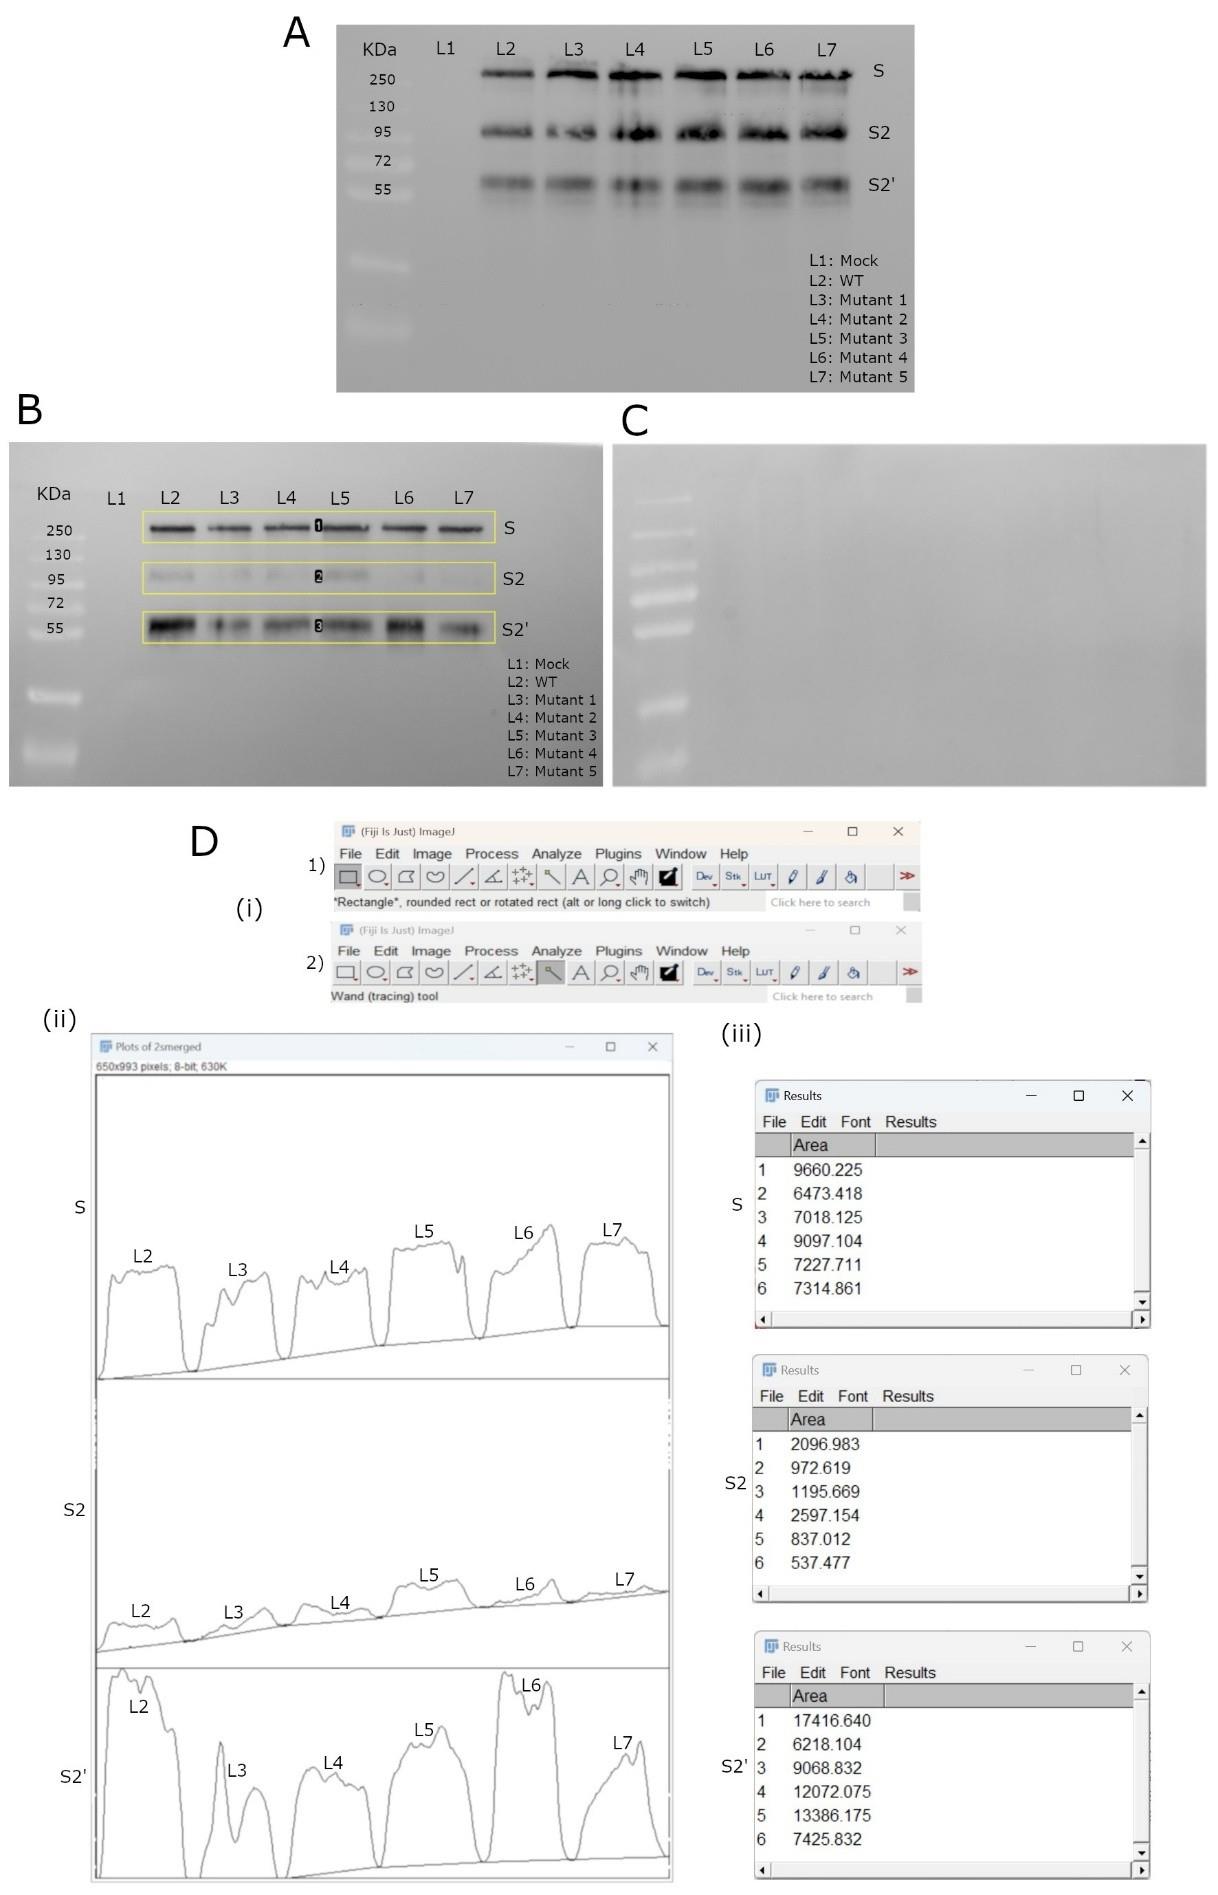
Figure 1. Western blot analysis and densitometric quantification of wild-type (WT) and mutant spikes acylation. (A) Western blot displaying protein bands for WT and mutant spike proteins. Samples include L1: Mock untransfected cells, L2: WT, and L3–L7: spike mutants. Molecular weight markers are indicated on the left. The protein bands of interest are labeled as S (full-length spike), S2, and S2' (spike cleavage products). (B) Western blot of HA-treated samples showing acylated WT spikes and its tested mutants, following the same sample order and target bands as in (A). Yellow lanes were drawn using ImageJ for subsequent densitometric analysis. (C) Western blot of Tris-HCl-treated samples, showing no detectable bands, confirming the specificity of the beads used and the validity of the experimental procedure. (D) Workflow for densitometric analysis in ImageJ. (i) ImageJ interface, showing the tools employed for analysis. (ii) Lane profile plots representing the band intensities from (B), with the area under each curve corresponding to the signal strength of individual protein bands. (iii) Results table showing the measured areas, which are used to determine the relative acylation levels of the proteins.
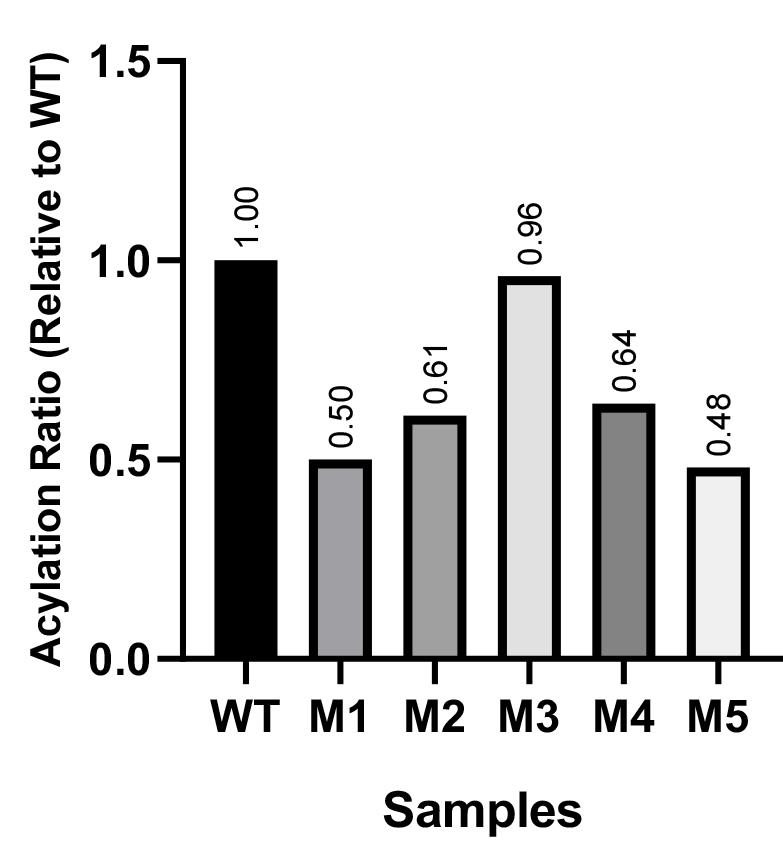
Figure 2. Acylation levels of the mutant spikes relative to the wild type (WT)
Table 1. Data processing to compare the acylation level of spike mutants with the wild type (WT)
| S (full length) | S2 | S2' | Sum | |||||
| Area | Ratio | Area | Ratio | Area | Ratio | Cumulative score | Ratio | |
| WT | 9,660.225 | 1.00 | 2,096.983 | 1.00 | 1,7416.640 | 1.00 | 3.00 | 1.00 |
| M1 | 6,473.418 | 0.67 | 972.619 | 0.46 | 6,218.104 | 0.36 | 1.49 | 0.50 |
| M2 | 7,018.125 | 0.73 | 1,195.669 | 0.57 | 9,068.832 | 0.52 | 1.82 | 0.61 |
| M3 | 9,097.104 | 0.94 | 2,597.154 | 1.24 | 12,072.075 | 0.69 | 2.87 | 0.96 |
| M4 | 7,227.711 | 0.75 | 837.012 | 0.40 | 13,386.175 | 0.77 | 1.92 | 0.64 |
| M5 | 7,314.861 | 0.76 | 537.477 | 0.26 | 7,425.832 | 0.43 | 1.44 | 0.48 |
Validation of protocol
This protocol was used to investigate the palmitoylation of the SARS-CoV-2 spike protein and the effect of selected mutations. Each experiment was conducted with at least three replicates, and statistical significance was determined using one-way ANOVA. The endogenous acylated protein Flotillin-2 served as positive control, and the wild-type protein was the reference for palmitoylation comparison. Additionally, HCl-treated samples were included to validate the assay’s specificity and reliability.
General notes and troubleshooting
General notes
1. For more detailed instructions on how to use ImageJ software, refer to Introduction (imagej.net).
2. When investigating protein acylation of the SARS-CoV-2 spike proteins, it is essential to account for the presence of multiple bands detected on the western blot: the full-length spike S and its proteolytic cleavage products S2 and S2'. Since each of these fragments is acylated, we measured the acylation levels individually for all three. This might differ in the case of other target acylated proteins, which may appear as a single band on the blot, requiring only one measurement and processing step.
3. The cumulative score was chosen to provide a comprehensive view of each mutant’s total contribution across all fragments (full-length, S2, and S2'). Unlike the average, which equalizes fragment influences, the cumulative score captures the aggregate effect, offering a more accurate representation of the mutant’s overall behavior.
4. If the introduced mutations impact protein expression levels in the cells, this must be considered during the quantification process. First, the total extract blot should be used to normalize the expression level of the mutant protein relative to that of the WT. Subsequently, the acylation ratio should be normalized to the corresponding expression level to ensure accurate comparisons.
5. Buffer A, which contains 1.5% Triton X-100, disrupts lipid bilayers, which allows for the solubilization and extraction of membrane-associated proteins. However, it may be less effective for high-stable cytoskeletal proteins. To isolate these, a subcellular protein fractionation kit, such as the Thermo Scientific™ Subcellular Protein Fractionation Kit for Cultured Cells, can be used to extract cytoskeletal proteins from the insoluble pellet. Following this, downstream analysis with the subsequent steps of acyl-RAC can be performed.
6. Some limitations of the acyl-RAC assay compared to other techniques include its semi-quantitative nature, which lacks precise stoichiometric data, and its potential to miss acylated proteins due to incomplete resin binding or cleavage. Additionally, it does not differentiate between types of acylation, whereas methods like mass spectrometry and click chemistry can identify specific acyl groups and provide more efficient tagging of acylated proteins.
7. MMTS was selected for its fast and efficient reactivity with thiol groups, which aligns well with the conditions of our assay. Its volatility facilitates easy removal, minimizing potential interference in downstream analyses. While MMTS is sensitive to reducing agents like TCEP, we optimized our reaction conditions by using a sufficiently high concentration of MMTS to outcompete any residual reducing agent and effectively block free thiols. However, we acknowledge that MMTS is a reversible thiol-blocking agent, which may be a limitation in certain experimental setups. Maleimide-based compounds, such as N-ethylmaleimide (NEM), and iodoacetamide offer irreversible thiol modifications and could serve as alternative reagents since they are also reported to have a short blocking time. Therefore, optimizing this protocol using maleimide-based compounds should also be considered by researchers investigating acylated proteins.
Troubleshooting
Problem 1: Insufficient target protein yield.
Possible causes: The expression plasmid used lacks a strong promoter or the number of transfected cells is low.
Solutions: Use an expression plasmid with a strong promoter (e.g., CMV and SV40) and increase the number of transfected cells to ensure sufficient protein concentration.
Problem 2: Insufficient protein precipitation.
Possible cause: Achieving sufficient protein concentration may take considerable time when using acetone for protein precipitation.
Solution: Extend the incubation time from overnight to 48 h to improve results.
Problem 3: Lack of specificity for acylated proteins.
Possible cause: The specificity of the procedure for acylated proteins needs validation, which may be compromised without proper controls.
Solution: Include negative controls where an equal volume of the sample is treated with Tris-HCl instead of HA to help assess the efficiency of the reduction, blocking, and washing steps and the specificity of the beads (Figure 1C). Additionally, to validate the procedure and ensure its functionality, blot the membranes of both HA+ and Tris-HCl-treated samples for an endogenous protein known to undergo acylation, such as Flotillin-2 or Caveolin-1, as a positive control.
Problem 4: Variability in experimental results.
Possible cause: The protocol has some inherent variability, which can lead to inconsistent results.
Solution: Repeat the experiment at least three times to validate the results and ensure reliability and reproducibility.
Acknowledgments
This work was supported by DFG project VE 141/18-1 (awarded to M.V.). D.A. is a recipient of a Ph.D. scholarship from the Central Department of Missions (Egyptian Ministry of Higher Education).
Competing interests
The authors declare no conflicts of interest.
References
- Conibear, E. and Davis, N. G. (2010). Palmitoylation and depalmitoylation dynamics at a glance. J Cell Sci. 123(23): 4007–4010. https://doi.org/10.1242/jcs.059287
- Veit, M. (2012). Palmitoylation of virus proteins. Biol Cell. 104(9): 493–515. https://doi.org/10.1111/boc.201200006
- Jin, J., Zhi, X., Wang, X. and Meng, D. (2020). Protein palmitoylation and its pathophysiological relevance. J Cell Physiol. 236(5): 3220–3233. https://doi.org/10.1002/jcp.30122
- Veit, M. and Siche, S. (2015). S-acylation of influenza virus proteins: Are enzymes for fatty acid attachment promising drug targets?. Vaccine. 33(49): 7002–7007. https://doi.org/10.1016/j.vaccine.2015.08.095
- Drisdel, R. C. and Green, W. N. (2004). Labeling and quantifying sites of protein palmitoylation. Biotechniques. 36(2): 276–285. https://doi.org/10.2144/04362rr02
- Kordyukova, L., Krabben, L., Serebryakova, M. and Veit, M. (2019). S-Acylation of Proteins. In C. Kannicht (Ed.), Post-Translational Modification of Proteins: Tools for Functional Proteomics (pp. 265–291). New York, NY: Springer. https://doi.org/10.1007/978-1-4939-9055-9_17
- Resh, M. D. (2006). Use of analogs and inhibitors to study the functional significance of protein palmitoylation. Methods 40(2): 191–197. https://doi.org/10.1016/j.ymeth.2006.04.013
- Charron, G., Zhang, M. M., Yount, J. S., Wilson, J., Raghavan, A. S., Shamir, E. and Hang, H. C. (2009). Robust Fluorescent Detection of Protein Fatty-Acylation with Chemical Reporters. J Am Chem Soc. 131(13): 4967–4975. https://doi.org/10.1021/ja810122f
- Hannoush, R. N. and Arenas-Ramirez, N. (2009). Imaging the Lipidome: ω-Alkynyl Fatty Acids for Detection and Cellular Visualization of Lipid-Modified Proteins. ACS Chem Biol. 4(7): 581–587. https://doi.org/10.1021/cb900085z
- Forrester, M. T., Thompson, J. W., Foster, M. W., Nogueira, L., Moseley, M. A. and Stamler, J. S. (2009). Proteomic analysis of S-nitrosylation and denitrosylation by resin-assisted capture. Nat Biotechnol. 27(6): 557–559. https://doi.org/10.1038/nbt.1545
- Wan, J., Roth, A. F., Bailey, A. O. and Davis, N. G. (2007). Palmitoylated proteins: purification and identification. Nat Protoc. 2(7): 1573–1584. https://doi.org/10.1038/nprot.2007.225
- Meng, X., Templeton, C., Clementi, C. and Veit, M. (2023). The role of an amphiphilic helix and transmembrane region in the efficient acylation of the M2 protein from influenza virus. Sci Rep. 13(1): 18928–18928. https://doi.org/10.1038/s41598-023-45945-z
- Villanueva, C., Nolte, W. and Hagenbuch, B. (2023). Identification and Characterization of Palmitoylation Sites in the Organic Anion Transporting Polypeptide 1B1 (OATP1B1). J Pharmacol Exp Ther. 385: 180. https://doi.org/10.1124/jpet.122.206650
- Mesquita, F. S., Abrami, L., Sergeeva, O., Turelli, P., Qing, E., Kunz, B., Raclot, C., Paz Montoya, J., Abriata, L. A., Gallagher, T., et al. (2021). S-acylation controls SARS-CoV-2 membrane lipid organization and enhances infectivity. Dev Cell. 56(20): 2790–2807. https://doi.org/10.1016/j.devcel.2021.09.016
- Puthenveetil, R., Lun, C. M., Murphy, R. E., Healy, L. B., Vilmen, G., Christenson, E. T., Freed, E. O. and Banerjee, A. (2021). S-acylation of SARS-CoV-2 spike protein: Mechanistic dissection, in vitro reconstitution and role in viral infectivity. J Biol Chem. 297(4): 101112. https://doi.org/10.1016/j.jbc.2021.101112
- Wang, W. and Malcolm, B. A. (2002). Two-Stage Polymerase Chain Reaction Protocol Allowing Introduction of Multiple Mutations, Deletions, and Insertions, Using QuikChangeTM Site-Directed Mutagenesis. In J. Braman (Ed.), In Vitro Mutagenesis Protocols (pp. 37–43). Totowa, NJ: Humana Press. https://doi.org/10.1385/1-59259-194-9:037
Article Information
Publication history
Received: Oct 31, 2024
Accepted: Mar 4, 2025
Available online: Mar 23, 2025
Published: Apr 5, 2025
Copyright
© 2025 The Author(s); This is an open access article under the CC BY-NC license (https://creativecommons.org/licenses/by-nc/4.0/).
How to cite
Abdulrahman, D. A. and Veit, M. (2025). Detection and Analysis of S-Acylated Proteins via Acyl Resin–Assisted Capture (Acyl-RAC). Bio-protocol 15(7): e5268. DOI: 10.21769/BioProtoc.5268.
Category
Microbiology > Microbial biochemistry > Protein > Modification
Biochemistry > Protein > Posttranslational modification
Do you have any questions about this protocol?
Post your question to gather feedback from the community. We will also invite the authors of this article to respond.