- Protocols

- Articles and Issues
- For Authors
- About
- Become a Reviewer

Screening for Streptococcus agalactiae: Development of an Automated qPCR-Based Laboratory-Developed Test Using Panther Fusion® Open AccessTM


Published: Vol 15, Iss 7, Apr 5, 2025 DOI: 10.21769/BioProtoc.5255 Views: 2144
Reviewed by: Satya Ranjan SahuAnonymous reviewer(s)
Original research article
The authors used this protocol in:

Apr 2024
Advertisement


Protocol Collections
Comprehensive collections of detailed, peer-reviewed protocols focusing on specific topics


Related protocols
Abstract
Laboratory-developed tests (LDTs) are optimal molecular diagnostic modalities in circumstances such as public health emergencies, rare disease diagnosis, limited budget, or where existing commercial alternatives are unavailable, limited in supply, or withdrawn, either temporarily or permanently. These tests reduce access barriers and enhance equitable clinical practice and healthcare delivery. Despite recommendations for the development of nucleic acid amplification tests, procedural details are often insufficient, inconsistent, and arbitrary. This protocol elucidates the methodology used in the development of a fully automated real-time polymerase chain reaction (qPCR)-based test, using the Panther Fusion® Open AccessTM functionality, for the detection of Streptococcus agalactiae in pregnant women, using selectively enriched rectovaginal swabs. In addition, guidelines are provided for oligonucleotide design (primers and TaqMan probes), in silico and in vitro evaluation of design effectiveness, optimization of the physicochemical conditions of the amplification reaction, and result analysis based on experimental designs and acceptance criteria. Furthermore, recommendations are provided for the analytical and clinical validation of the intended use. Our approach is cost-effective, particularly during the design and optimization phases. We primarily used open-source bioinformatics software and tools for in silico evaluations for the test design. Subsequently, the process was manually optimized using a CFX96 Dx analyzer, whose technical specifications and performance are homologous to that of the final platform (Panther Fusion®). Unlike Panther Fusion®, the CFX96 Dx does not require excess volumes of reagents, samples, and evaluation materials (dead volume) to accommodate potential robotic handling-associated imprecisions. The utilization of the CFX96 Dx analyzer represents a strategic approach to enhancing the efficiency of resources and the optimization of time during LDT optimization.
Key features
• Efficient and robust use of bioinformatics tools for designing primers and TaqMan probes for qPCR-based detection of Streptococcus agalactiae.
• Optimization of physicochemical conditions and evaluation of the design effectiveness of a qPCR-based laboratory-developed test (LDT).
• Analytical and clinical validation of the qPCR-based LDT developed on an open-access functionality (Open AccessTM) of an automated in vitro diagnostic platform, Panther Fusion® (Hologic).
Keywords: Laboratory-developed testGraphical overview
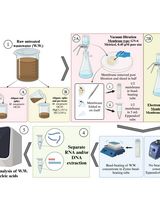
Protocol to develop a qPCR-based laboratory-developed test (LDT) for detecting Streptococcus agalactiae using the Panther Fusion® Open AccessTM system. Created in BioRender. Caballero Méndez, A. (2025) https://BioRender.com/n51j599.
Background
The Clinical and Laboratory Standards Institute (CLSI) defines a laboratory-developed test (LDT) as any test that has been designed, manufactured, and used within a single institution [1]. The use of LDTs is justified in scenarios where diagnostic tests are needed for rare and emerging infections, when commercial alternatives are unavailable, limited in supply, or withdrawn, or when cost-reduction strategies are needed in resource-limited settings. Validation of LDTs on automated in vitro diagnostic (IVD) platforms can potentially enhance laboratory responsiveness and efficiency, reduce access barriers, and improve equitable clinical practices and healthcare delivery. The Panther Fusion® system (Hologic, CA, USA) is an example of this potential. Its Open AccessTM functionality, fully automated sample-to-result processing, and continuous and random access capabilities enable high throughput and facilitate the safe implementation of qPCR-based LDTs [2]. In addition, bidirectional connectivity with laboratory information systems eliminates potential transcription errors [3].
However, LDT optimization on the Panther Fusion® Open AccessTM functionality is disadvantaged primarily by its high cost, largely attributable to the low yield of primer and probe reconstitution solutions (PPRs) and the substantial volumes of required samples, evaluation materials, or nucleic acid solutions. During optimization, multiple combinations of amplification mixture component concentrations must be prepared as PPRs and distributed within the system’s Open Access Packs. To compensate for imprecisions inherent to robotic handling of liquids, each PPR requires a minimum of 33% and a maximum of 70% more reactions than are strictly necessary. Hence, a convenient strategy for optimizing resources during this phase is the use of third-party qPCR analyzers that are similar to the Panther Fusion® in terms of detection channels and performance. Although undocumented for the Panther Fusion® Open AccessTM functionality, this strategy has been recommended for the open channels of other closed platforms, including the cobas® 5800/6800/8800 system [4,5].
Antepartum maternal rectovaginal colonization by Streptococcus agalactiae (Group B Streptococcus, GBS) is the leading risk factor for neonatal early-onset invasive GBS disease, which occurs within the first 6 days of life [6,7]. Culture remains the gold standard for universal screening; however, its limitations in sensitivity and turnaround time [8–10] have driven the development of alternative assays, such as those based on nucleic acid amplification (NAAT), which offer superior performance [11,12]. Herein, a protocol for the development of a qPCR-based LDT on the Panther Fusion® Open AccessTM functionality for the automated detection of the surface immunogenic protein (sip) gene of S. agalactiae is outlined. Furthermore, instructions for optimizing the assay’s physicochemical conditions using the CFX96 Dx analyzer (Bio-Rad, CA, USA) are provided. The evaluation of the analytical and clinical performance of the LDT, described herein as a validator of the protocols, is based on the recommendations of the CLSI, United States.
Materials and reagents
Biological materials
1. Streptococcus agalactiae Lehmann and Neumann (ATCC, 12386)
2. LIM broth-enriched rectovaginal swabs (clinical samples from women at ≥36 0/7 weeks’ gestation)
Reagents
1. Tris-ethylenediaminetetraacetic acid (10 mM Tris and 0.1 mM EDTA), pH 8.0 (IDTE buffer, pH 8.0) (IDT, catalog number: 11–05-01-13)
2. Tris-ethylenediaminetetraacetic acid (10 mM Tris and 0.1 mM EDTA), pH 7.5 (IDTE buffer, pH 7.5) (IDT, catalog number: 11-05-01-15)
3. 1 M Tris buffer (TRIS) (Hologic, catalog number: PRD-04935)
4. 1 M magnesium chloride (MgCl2) (Hologic, catalog number: PRD-04926)
5. 1 M potassium chloride (KCl) (Hologic, catalog number: PRD-04927)
6. Nuclease-free water (IDT, catalog number: 11-05-01-14)
7. iTaq Universal SYBR® green supermix (Bio-Rad, catalog number: 1725120)
8. Panther Fusion® Open AccessTM RNA/DNA enzyme cartridge (Hologic, catalog number: PRD-04303)
9. Panther Fusion® extraction reagents-X (Hologic, catalog number: PRD-04477)
10. Panther Fusion® internal control-X (IC-X) (Hologic, catalog number: PRD-04476)
11. eSwab® (Copan, catalog number: 480CE)
12. LIM broth, 5 mL (Todd Hewitt broth, 30 g/L; yeast extract, 10 g/L; nalidixic acid, 15 mg/L; and colistin sulfate, 10 mg/L) (Hardy Diagnostics, catalog number: L57)
13. Specimen transport medium (STM) (Hologic, catalog number: PRD-04423)
14. Aptima Specimen Transfer kit (AST) (Hologic, catalog number: 301154C)
15. DNA IC primers (Hologic, catalog number: PRD-04306)
16. DNA IC probe (Quasar 705) (Hologic, catalog number: PRD-04308)
17. Panther Fusion® elution buffer (Hologic, catalog number: PRD-04334)
18. Panther Fusion® oil (Hologic, catalog number: PRD-04335)
19. Oil reagent (Hologic, catalog number: PRD-04304)
20. Aptima auto detect (Hologic, catalog number: 303013)
21. Aptima Assay Fluids kit (Hologic, catalog number: 303014)
22. GBS forward primer (HPLC-double-purified from IDT): AGT TTC TCT CAA TAC AAT TTY GGA AGG T
23. GBS reverse primer (HPLC-double-purified from IDT): GCT GGC GCA GAA GAA TAT GTC T
24. GBS TaqMan-probe (HPLC-double-purified from IDT): 6-FAM/CA ATC GTT G/ZEN/K TGC TGC TTC TGG TGT CA/IABkFQ
25. UltramerTM duplex control (standard desalting-purified from IDT): GTT TCT GTT GCA GAC CAA AAA GTT TCT CTC AAT ACA ATT TCG GAA GGT ATG ACA CCA GAA GCA GCA ACA ACG ATT GTT TCG CCA ATG AAG ACA TAT TCT TCT GCG CCA GCT TTG AAA TCA AAA GAA GTA TT
26. MagNA Pure 24 Total DNA Isolation kit (Roche Diagnostics, catalog number: 07658036001)
27. MagNA pure bacterial lysis buffer (Roche Diagnostics, catalog number: 06374921001)
28. Proteinase K, recombinant, PCR grade (Roche Diagnostics, catalog number: 03115828001)
29. ID broth, 4.5 mL (potassium chloride, 7.5 g/L; calcium chloride, 0.5 g/L; tricine glycine, 0.895 g/L; and polysorbate 80, 0.025%) (saline solution) (Beckton, Dickinson and Co., catalog number: 246001)
30. BBLTM infusion agar (blood agar) (Beckton, Dickinson and Co., catalog number: 211037)
Solutions
1. Primer and probe reconstitution solution (PPR) for optimizing MgCl2 and KCl concentrations (see Recipes)
2. PPR for optimizing the concentration of the primer mix and probe for the LDT-GBS assay (see Recipes)
3. PPR for optimizing TRIS concentration (see Recipes)
4. PPR for optimizing Ta (see Recipes)
5. PPR for optimizing the primer mix and probe concentrations for an IC-X detection assay (see Recipes)
6. Optimized primer and probe reconstitution solution (oPPR) (see Recipes)
7. SYBR® green master mix (see Recipes)
Recipes
1. Primer and probe reconstitution solution (PPR) for optimizing MgCl2 and KCl concentrations
| Reagent | Working concentration | Final concentration | Unitarian volume1 | Volume (four tests)2 |
|---|---|---|---|---|
| Nuclease-free water | n/a | n/a | 10.5–14 µL | 42–56 µL |
| KCl | 1 M | Variable3 | 0–2.5 µL | 0–10 µL |
| MgCl2 | 100 mM | Variable4 | 0.25–1.25 µL | 1–5 µL |
| TRIS | 100 mM | 8 mM | 2 µL | 8 µL |
| GBS forward primer | 10 µM | 0.6 µM | 1.5 µL | 6 µL |
| GBS reverse primer | 10 µM | 0.6 µM | 1.5 µL | 6 µL |
| GBS probe | 10 µM | 0.3 µM | 0.75 µL | 3 µL |
| Total volume | n/a | n/a | 20 µL | 80 µL |
1An amplification volume of 25 µL is assumed [20 µL of master mix (MMX) + 5 µL of DNA template].
2A PPR volume of 80 µL yields four tests using the CFX96 Dx analyzer: two replicates and two additional excess reactions (“dead reactions”), one for PPR and one for MMX.
3MgCl2 concentrations of 1.0, 2.0, 3.0, 4.0, and 5.0 mM.
4KCl concentrations of 0, 25, 50, 75, and 100 mM.
The volumes presented have been calculated using the calculation template mentioned in File S5.
2. PPR for optimizing the concentration of the primer mix and probe for the LDT-GBS assay
| Reagent | Working concentration | Final concentration | Unitarian volume1 | Volume (four tests)2 |
|---|---|---|---|---|
| Nuclease-free water | n/a | n/a | 10.8–13.8 µL | 43–55 µL |
| KCl | 1 M | 100 mM | 2.5 µL | 10 µL |
| MgCl2 | 100 mM | 3 mM | 0.75 µL | 3 µL |
| TRIS | 100 mM | 8 mM | 2 µL | 8 µL |
| GBS primer mix | 10 µM | Variable3 | 0.5–2.5 µL | 2–10 µL |
| GBS probe | 10 µM | Variable4 | 0.5–1.5 µL | 2–6 µL |
| Total volume | n/a | n/a | 20 µL | 80 µL |
1An amplification volume of 25 µL is assumed (20 µL of MMX + 5 µL of DNA template).
2A PPR volume of 80 µL yields four tests using the CFX96 Dx analyzer: two replicates and two dead reactions (one for PPR and one for MMX).
3Primer mix concentrations of 0.2, 0.4, 0.6, 0.8, and 1.0 µM (1:1 ratio).
4Probe concentrations of 0.2, 0.3, 0.4, 0.5, and 0.6 µM.
The volumes presented have been calculated using the calculation template mentioned in File S5.
3. PPR for optimizing TRIS concentration
| Reagent | Working concentration | Final concentration | Unitarian volume1 | Volume(four tests)2 |
|---|---|---|---|---|
| Nuclease-free water | n/a | n/a | 10.25–11.5 µL | 41–46 µL |
| KCl | 1 M | 100 mM | 2.5 µL | 10 µL |
| MgCl2 | 100 mM | 3 mM | 0.75 µL | 3 µL |
| TRIS | 100 mM | Variable3 | 1.25–2.5 µL | 5–10 µL |
| GBS forward primer | 10 µM | 0.6 µM | 1.5 µL | 6 µL |
| GBS reverse primer | 10 µM | 0.6 µM | 1.5 µL | 6 µL |
| GBS probe | 10 µM | 0.4 µM | 1 µL | 4 µL |
| Total volume1 | n/a | n/a | 20 µL | 80 µL |
1An amplification volume of 25 µL is assumed (20 µL of MMX + 5 µL of DNA template).
2A PPR volume of 80 µL yields four tests using the CFX96 Dx analyzer: two replicates and two dead reactions (one for PPR and one for MMX).
3TRIS concentrations of 5.0, 8.0, and 10 mM.
The volumes presented have been calculated using the calculation template mentioned in File S6.
4. PPR for optimizing Ta
| Reagent | Stock concentration | Final concentration | Unitarian volume1 | Volume(27.5 tests)2 |
|---|---|---|---|---|
| Nuclease-free water | n/a | n/a | 16.83 µL | 462.6 µL |
| KCl | 1 M | 100 mM | 2.5 µL | 68.8 µL |
| MgCl2 | 1 M | 3 mM | 0.075 µL | 2.1 µL |
| TRIS | 1 M | 8 mM | 0.2 µL | 5.5 µL |
| GBS forward primer | 100 µM | 0.6 µM | 0.15 µL | 4.1 µL |
| GBS reverse primer | 100 µM | 0.6 µM | 0.15 µL | 4.1 µL |
| GBS probe | 100 µM | 0.4 µM | 0.1 µL | 2.8 µL |
| Total volume | n/a | n/a | 20 µL | 550 µL |
1An amplification volume of 25 µL is assumed (20 µL of MMX + 5 µL of DNA template).
2A PPR volume of 550 µL yields 27.5 tests: 24 replicates and 3.5 dead reactions.
The volumes presented have been calculated using the calculation template mentioned in File S7.
5. PPR for optimizing the primer mix and probe concentrations for an IC-X detection assay
| Reagent | Working concentration | Final concentration | Unitarian volume1 | Volume(four tests)2 |
|---|---|---|---|---|
| Nuclease-free water | n/a | n/a | 2.08–11.43 µL | 8.33–45.67 µL |
| KCl | 1 M | 100 mM | 2.5 µL | 10 µL |
| MgCl2 | 100 mM | 3 mM | 0.75 µL | 3 µL |
| TRIS | 100 mM | 8 mM | 2 µL | 8 µL |
| DNA IC primer mix | 3.75 µM3 | Variable4 | 1.33–6.67 µL | 5.33–26.67 µL |
| DNA IC probe | 2.5 µM3 | Variable5 | 2–6 µL | 8–24 µL |
| Total volume | n/a | n/a | 20 µL | 80 µL |
1An amplification volume of 25 µL is assumed (20 µL of MMX + 5 µL of DNA template).
2A PPR volume of 80 µL yields four tests using the CFX96 Dx analyzer: two replicates and two dead reactions (one for PPR and one for MMX).
31:10 dilution of the factory preparation.
4Primer mix concentrations of 0.2, 0.4, 0.6, 0.8, and 1.0 µM (1:1 ratio).
5Probe concentrations of 0.2, 0.3, 0.4, 0.5, and 0.6 µM.
The volumes presented have been calculated using the calculation template mentioned in File S5.
6. Optimized primer and probe reconstitution solution (oPPR)
| Reagent | Working concentration | Final concentration | Unitarian volume3 | Volume(24 tests)4 |
|---|---|---|---|---|
| Nuclease-free water | n/a | n/a | 16.43 µL | 697.9 µL |
| KCl | 1 M | 100 mM | 2.5 µL | 106.3 µL |
| MgCl2 | 1 M | 3 mM | 0.075 µL | 3.2 µL |
| TRIS | 1 M | 8 mM | 0.2 µL | 8.5 µL |
| GBS forward primer | 100 µM | 0.6 µM | 0.15 µL | 6.4 µL |
| GBS reverse primer | 100 µM | 0.6 µM | 0.15 µL | 6.4 µL |
| GBS probe | 100 µM | 0.4 µM | 0.1 µL | 4.3 µL |
| DNA IC primers1 | 37.5 µM | 0.3 µM | 0.2 µL | 8.5 µL |
| DNA IC probe2 | 25 µM | 0.2 µM | 0.2 µL | 8.5 µL |
| Total volume | n/a | n/a | 20 µL | 850 µL |
1,2Analyte specific reagent (ASR): Primer mix and a TaqMan-probe, respectively, for detecting the Panther Fusion® internal control-X (IC-X).
3An amplification volume of 25 µL is assumed (20 µL of MMX + 5 µL of DNA template).
4A PPR volume of 850 µL yields 24 tests on the Panther Fusion® system (excluding the dead space volume) and requires 350 µL of oil reagent.
The volumes presented have been calculated using the calculation template mentioned in File S7.
7. SYBR® green master mix
| Reagent | Working concentration | Final concentration | Unitarian volume1 | Volume(24 tests)2 |
|---|---|---|---|---|
| Nuclease-free water | n/a | n/a | 4.7 µL | 117.5 µL |
| GBS forward primer | 100 µM | 0.6 µM | 0.15 µL | 3.75 µL |
| GBS reverse primer | 100 µM | 0.6 µM | 0.15 µL | 3.75 µL |
| SYBR® green supermix3 | 2× | 1× | 10 µL | 250 µL |
| Total volume | n/a | n/a | 15 µL | 375 µL |
1An amplification volume of 20 µL is assumed (15 µL of MMX + 5 µL of DNA template).
2A PPR volume of 375 µL yields 24 tests on the CFX96 Dx analyzer: eight levels × three replicates and one dead reaction.
3From iTaq Universal SYBR® green supermix.
Laboratory supplies
1. Hard-shell PCR plates, 96 well, thin wall (Bio-Rad, catalog number: HSP9655)
2. MicroAmp® optical adhesive film (Applied Biosystems, catalog number: 4311971)
3. MicroAmp® thin-walled reaction tube with flat cap, 0.5 mL (Applied Biosystems, catalog number: N8010737)
4. SC micro tube PCR-PT, 1.5 mL (Sarstedt, catalog number: 72.692.405)
5. SC micro tube PCR-PT, 2.0 mL (Sarstedt, catalog number: 72.693.465)
6. Multi-tube units (MTU) (Hologic, catalog number: 104772-02)
7. Panther Fusion® tube trays (Hologic, catalog number: PRD-04000)
8. Tips, 1,000 µL filtered, conductive, liquid-sensing, and disposable (Tecan, catalog number: 10612513)
9. Specimen aliquot tubes (Hologic, catalog number: 503762)
10. (Optional) Aptima® penetrable caps (Hologic, catalog number: 105668)
11. Panther waste bag kit (Hologic, catalog number: 902731)
12. Panther waste bin cover (Hologic, catalog number: 504405)
13. Disposable filter tips, nuclease-free certified, 10, 20, 50, 100, 200, and 1,000 µL (any manufacturer)
14. Micrewtubes with low adhesion surface, 2 mL, self-standing (PPR tubes) (Simport, catalog number: T341-6TLST100)
15. Screw caps for microtubes with O-ring, neutral color (caps for PPR tubes) (Simport, catalog number: T340NOS100)
16. (Optional) ChillBlockTM tube racks for MCT (Simport Scientific Inc., catalog number: S700-14)
17. MagNA Pure 24 processing cartridge (Roche Diagnostics, catalog number: 07345577001)
18. MagNA Pure 24 processing tip park/piercing tool (Roche Diagnostics, catalog number: 07345585001) or MagNA Pure 24 piercing tool (Roche Diagnostics, catalog number: 07534205001)
19. MagNA Pure tip 1,000 µL (Roche Diagnostics, catalog number: 06241620001)
20. MagNA Pure tip waste tray (Roche Diagnostics, catalog number: 08185492001)
21. MagNA Pure tube 2.0 mL (Roche Diagnostics, catalog number: 07857551001)
22. MagNA Pure sealing foil (Roche Diagnostics, catalog number: 06241638001)
Equipment
1. CFX96 Dx system [Bio-Rad, catalog numbers: 1845097-IVD (CFX96 Dx ORM) and 1841000-IVD (C1000 Dx Thermal Cycler)]
2. Panther Fusion® Open Access® system (Hologic, catalog number: PRD-04172)
3. MagNA Pure 24 instrument (Roche Diagnostics, catalog number: 07290519001)
4. Digital vortex mixer (Thermo Scientific, catalog number: 88882009)
5. SorvallTM ST 8 small benchtop centrifuge (Thermo Scientific, catalog number: 75007200)
6. Buckets for Thermo ScientificTM M10 microplate swinging bucket rotor (Thermo Scientific, catalog number: 75005723)
7. MicroClick 24 × 2 fixed angle microtube rotor (Thermo Scientific, catalog number: 75005715)
8. MALDI Biotyper®-BD Sirius IVD system (Bruker, catalog number: 1875321)
9. BD PhoenixTM AP instrument (Beckton, Dickinson and Co., catalog number: 448010)
Software and datasets
1. Unipro UGENE v48.0 or newer versions (Unipro, Novosibirsk, Russia, 09/08/2023) [13]
2. Jalview v2.11.2.7 or newer versions (University of Dundee, Scotland, UK, 06/30/2023) [14]
3. BioEdit v7.7.1 or newer versions (Tom Hall, 05/10/2021) [15]
4. Oligo v7.60 (Molecular Biology Insights, Inc., CO, USA, 12/2018) [16]
5. BDAL v12.0 library (11 897 MSP, rev. 2023)
6. MBT Compass (RUO/GP) v4.1.100 (Bruker, MA, USA)
7. myAccessTM v2.1.2.1 or newer versions (Hologic, CA, USA, 06/08/2022)
8. Analyse-it for Microsoft Excel, Ultimate Edition v6.15.4 or newer versions (Analyse-it Software Ltd., Leeds, UK, 04/18/2023)
9. Microsoft Excel 2016 or newer versions (Microsoft Corporation)
10. Bacterial and Viral Bioinformatics Resource Center (BV-BRC, University of Chicago, USA) (https://www.bv-brc.org) (access date, 02/10/2022)
11. GenBank database of the National Center for Biotechnology Information (NCBI) (https://www.ncbi.nlm.nih.gov/genbank/) (access date, 02/12/2022)
12. Basic Local Alignment Search Tool (BLAST) of the GenBank database (https://blast.ncbi.nlm.nih.gov/Blast.cgi?PROGRAM=blastn&PAGE_TYPE=BlastSearch&LINK_LOC=blasthome) (access date, 04/20/2022)
13. Entropy Calculator tool (The National Institute of Public Health, Czech Republic) (https://entropy.szu.cz/EntropyCalcWeb/entropy) (access date, 02/25/2022) [17]
14. Multiple Alignment using the Fast Fourier Transform (MAFFT, Osaka University, Japan) (http://mafft.cbrc.jp/alignment/server/) (access date, 03/03/2022) [18]
15. BenchlingTM (Benchling, CA, USA) (https://benchling.com/) (access date, 03/08/2022)
16. OligoAnalyzerTM tool (IDT, IA, USA) (https://www.idtdna.com/calc/analyzer) (access date, 03/08/2022)
17. MFEprimer, v3.1 (iGeneTech Bioscience, Beijing, China) (https://mfeprimer3.igenetech.com/) (access date, 05/08/2022) [19,20]
18. Public Databases for Molecular Typing and Microbial Genome Diversity (PubMLST, University of Oxford, UK) (https://www.pubmlst.org/) (access date, 05/12/2022) [21]
19. Bacterial Isolate Genome Sequence Database online software (BIGSdb, University of Oxford, UK) (access date, 05/12/2022) [22]
20. Polymerase Chain Reaction Evaluation Through Large-Scale Mining of Genomic Data (SCREENED) v1.0 (Sciensano Galaxy External) (https://galaxy.sciensano.be/) (access date, 05/13/2022) [23]
21. Resuspension Calculator (IDT, IA, USA) (https://www.idtdna.com/Calc/resuspension/) (access date, 06/05/2022)
22. Dilution Calculator (IDT, IA, USA) (https://www.idtdna.com/Calc/Dilution/) (access date, 06/05/2022)
23. WinEpi v2.0 (University of Zaragoza, Spain) (http://www.winepi.net/winepi2/f102.php) (access date, 04/05/2022) [24]
Procedure
Refer to General note 1 and 2 for additional guidance.
A. Selection of target genes
1. Retrieve and download sequences.
a. Search for the greatest number of partial and complete sequences of the sip gene of S. agalactiae from the BV-BRC (https://www.bv-brc.org) and GenBank of the NCBI (https://www.ncbi.nlm.nih.gov/genbank/).
Notes:
1. Sequence comparison tools, such as BLAST, may be used alongside a reference or representative sequence, preferably one from a peer-reviewed paper. Alternatively, a keyword search and/or the application of filtering criteria, if available, may be performed.
2. The number of sequences that can be managed is often limited by the bioinformatics and technological resources available for analysis. Very large and numerous sequences may require days to align, and purging low-quality sequences can be challenging. In these scenarios, exclusion criteria could be applied to reduce the number of sequences, but this could compromise the coverage of the design. For example, you could filter the search by accession date, host, sample type, geographic location of isolates, number of degenerate nucleotides, and size of sequences.
3. All known serotypes or strains of S. agalactiae should be present in the sequence data set.
b. Download the sequences in FASTA format and, whenever possible, include the following metadata: organism name, sequence segment/region name, genotype, strain or variant, serotype, host, geographic location, and collection date.
2. Align sequences.
a. Open the *.FASTA file using the Unipro UGENE software v48.0 or later version.
b. Locate a reference sequence and declare it as a reference. If unavailable, select a full-length sequence in the correct orientation, place it first in the list, and declare it as the reference.
i. Right-click on the sequence in question.
ii. Select the Set this sequence as reference option from the context menu.
Note: The reference sequence will always be the full-length sequence. If the reference sequence is not available, a good way to select a full-length sequence is to find the one with the largest size that repeats the most.
c. Align the sequences in the Unipro UGENE software using the MAFFT algorithm, maintaining the default settings.
Note: Sequence alignment can be executed using alternative desktop sequence analysis software, including Jalview, BioEdit, MEGA-X, or web-based services such as MAFFT. Moreover, sequences can be oriented in a direction different from the declared reference sequence. Accordingly, select the option to Adjust direction according to the first sequence within the Direction of the nucleotide sequences parameters.
d. Save the changes.
3. Validate the alignment.
a. Restore alignment continuity.
i. Inspect the alignment, both vertically and horizontally.
ii. Select and remove the “empty columns” that introduce sequences with single artificial insertions in the alignment.
iii. Correct sequence orientation, if required.
Note: To modify the sequence orientation in the Unipro UGENE software v48.0 or newer versions, right-click on the sequence, hover over Edit, and select one of the following options: Replace selected rows with reverse-complement, Replace selected rows with reverse, or Replace selected rows with complement. Other sequence analysis software such as Jalview, BioEdit, and MEGA-X can be used similarly. If the web-based service MAFFT is used, the sequence orientation may be corrected according to the aforementioned instructions.
iv. Re-run the alignment.
b. Trim the alignment.
i. Trim sequence ends to match the standard length of the sip gene sequence. Alternatively, trim the ends of any sequence exhibiting <50% coverage.
Note: To trim the ends of sequences, first select the columns of the desired section, and second press the Delete key. This may be accomplished via sequence analysis software, including those previously referenced (Unipro UGENE, Jalview, BioEdit, and MEGA-X).
ii. Save the changes.
c. Remove low-quality sequences.
i. Identify and remove sequences containing repeated degenerate bases (e.g., R, Y, M, K, S, W, H, B, V, D, and N) that indicate uncertain positions.
Note: To identify and remove low-quality sequences, use the Search functionality of a suitable sequence analysis software, such as Unipro UGENE, Jalview, BioEdit, and MEGA-X.
ii. Save the changes.
d. Eliminate redundant sequences.
i. Open the *.FASTA file using Jalview software v2.11 or newer versions.
ii. Navigate to Edit → Remove redundancy…
iii. Adjust the Redundancy threshold option to 100% after the analysis.
iv. Press Delete.
v. Save the changes.
4. Select a target gene.
a. Using the BioEdit software v7.7.1 or newer versions, identify the most conserved regions of the alignment.
i. In the Alignment tab, select the Find Conserved Regions option.
ii. Modify the Minimum Length of … residues for all sequence parameters to 100 residues for all sequences while keeping the remaining search parameters in their default setting (Figure 1).
Note: The amplicon size in a qPCR-based assay is typically between 55 and 150 nucleotides. Therefore, any value within this range can be used. One hundred (100) nucleotides represent a midpoint between optimal and desirable.
iii. Press Start.
iv. Save the generated file in your preferred directory (File S1).
Note: Multiple conserved regions can be identified concurrently.
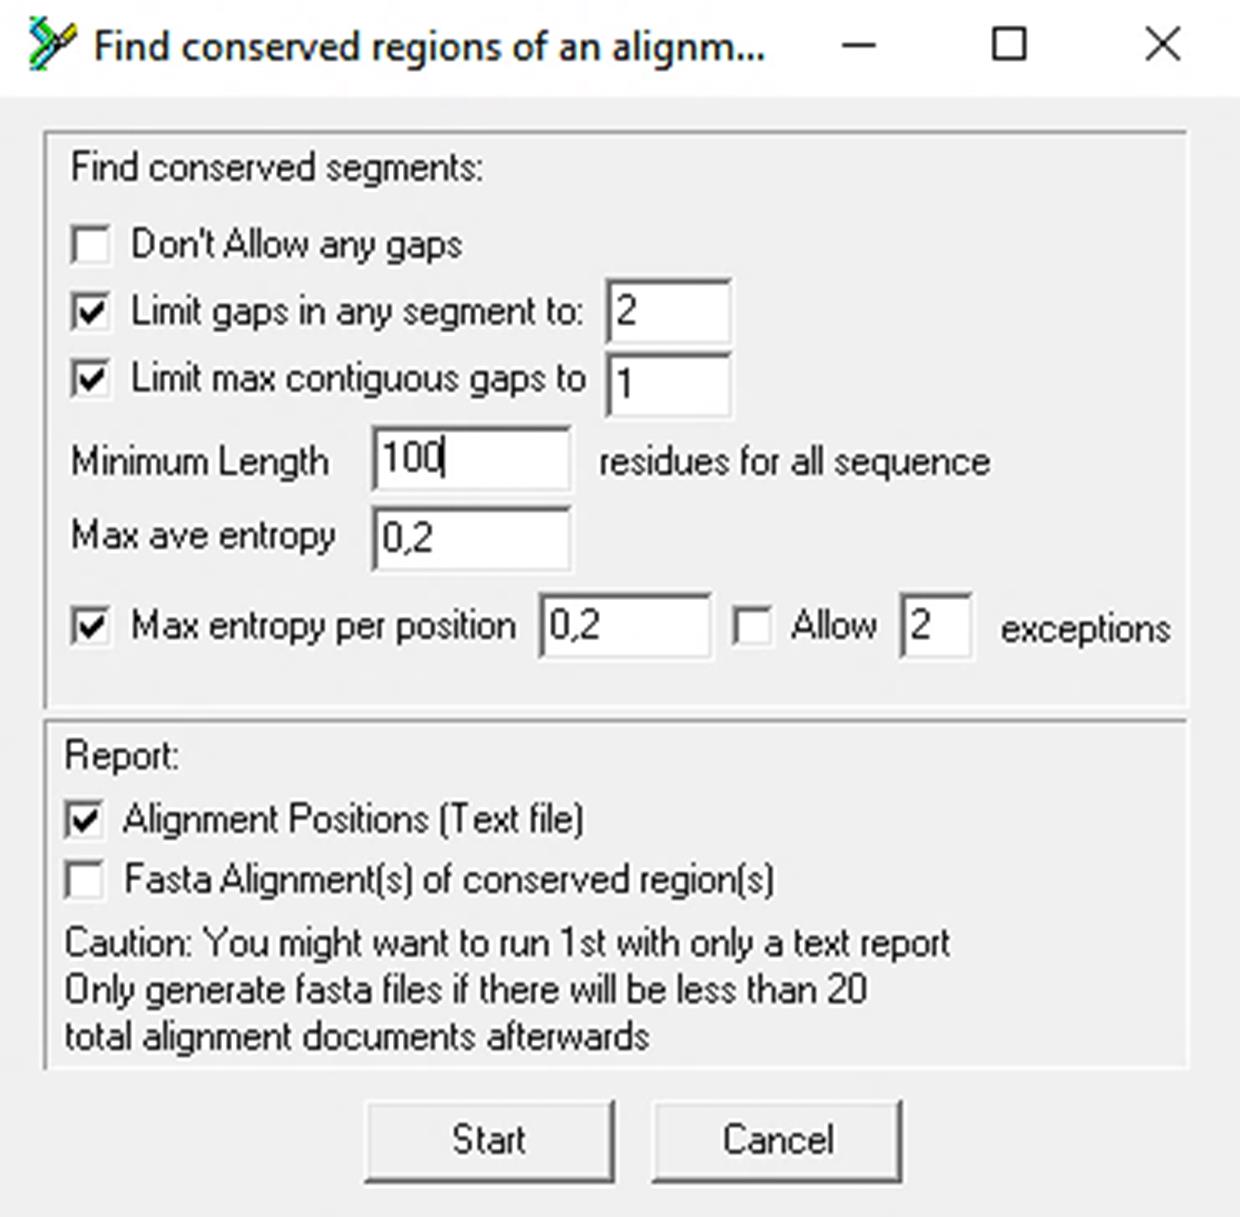
Figure 1. Control panel of the Find Conserved Regions tool. The default configuration is indicated, with the exception of the Minimum length, which has been set to 100 residues for all sequences.
b. Using the same software (BioEdit software v7.7.1 or newer versions), create a Positional Nucleotide Numerical Summary report.
i. Select the Alignment tab.
ii. Select the Positional Nucleotide Numerical Summary option.
iii. Save the generated file in your preferred directory with the file name Positional Nucleotide Numerical Summary_BioEdit.txt (File S2).
c. Calculate entropy and coverage percentage.
i. Access the web-based tool Entropy Calculator (https://entropy.szu.cz/EntropyCalcWeb/entropy).
ii. In the Input File section, upload the file generated in the previous step (Positional Nucleotide Numerical Summary_BioEdit.txt: File S2).
iii. Click Submit.
iv. Download the results as a *.xls file.
v. Open the template titled Entropy & coverage analysis_BioEdit.xlsx (File S3).
vi. Copy the entire table from the downloaded results from the Entropy Calculator tool into the NucleotNumericInformation tab of the template.
Caution: The copied content should be pasted from cell A1 of the NucleotNumericInformation tab. Notably, the Consensus column (Column X) is optional and contains calculated cells that should not be modified.
Notes:
1. The values for nucleotide entropy and coverage percentage are displayed in columns H(i) and %Coverage, respectively, in the tab labeled NucleotNumericInformation.
2. The position (From and To) of the selected conserved region is indicated in the file generated in step A4a (File S1). Notably, only one conserved region can be represented at a given time.
d. Graphically represent entropy (variability) and coverage.
i. Go to the Variability&CoverageAnalysis tab within the Entropy & coverage analysis_BioEdit.xlsx template (File S3).
ii. In the Selected conserved region section, specify the position (From and To) of the selected conserved region in nucleotides (nt).
Note: The Variability & Coverage plot will display a red box representing the selected conserved region, which is automatically adjusted based on the specified position.
iii. Visualize the Variability & Coverage plot and verify that the selected conserved region has low variability (minimal entropy in terms of frequency, amplitude, and intensity) and is preferably located in an area of maximum coverage (Figure 2).
Note: If more than one conserved region is identified, it is recommended to complete this protocol from step A4d.i with at least three of the best conserved regions. The final design will be selected based on performance.
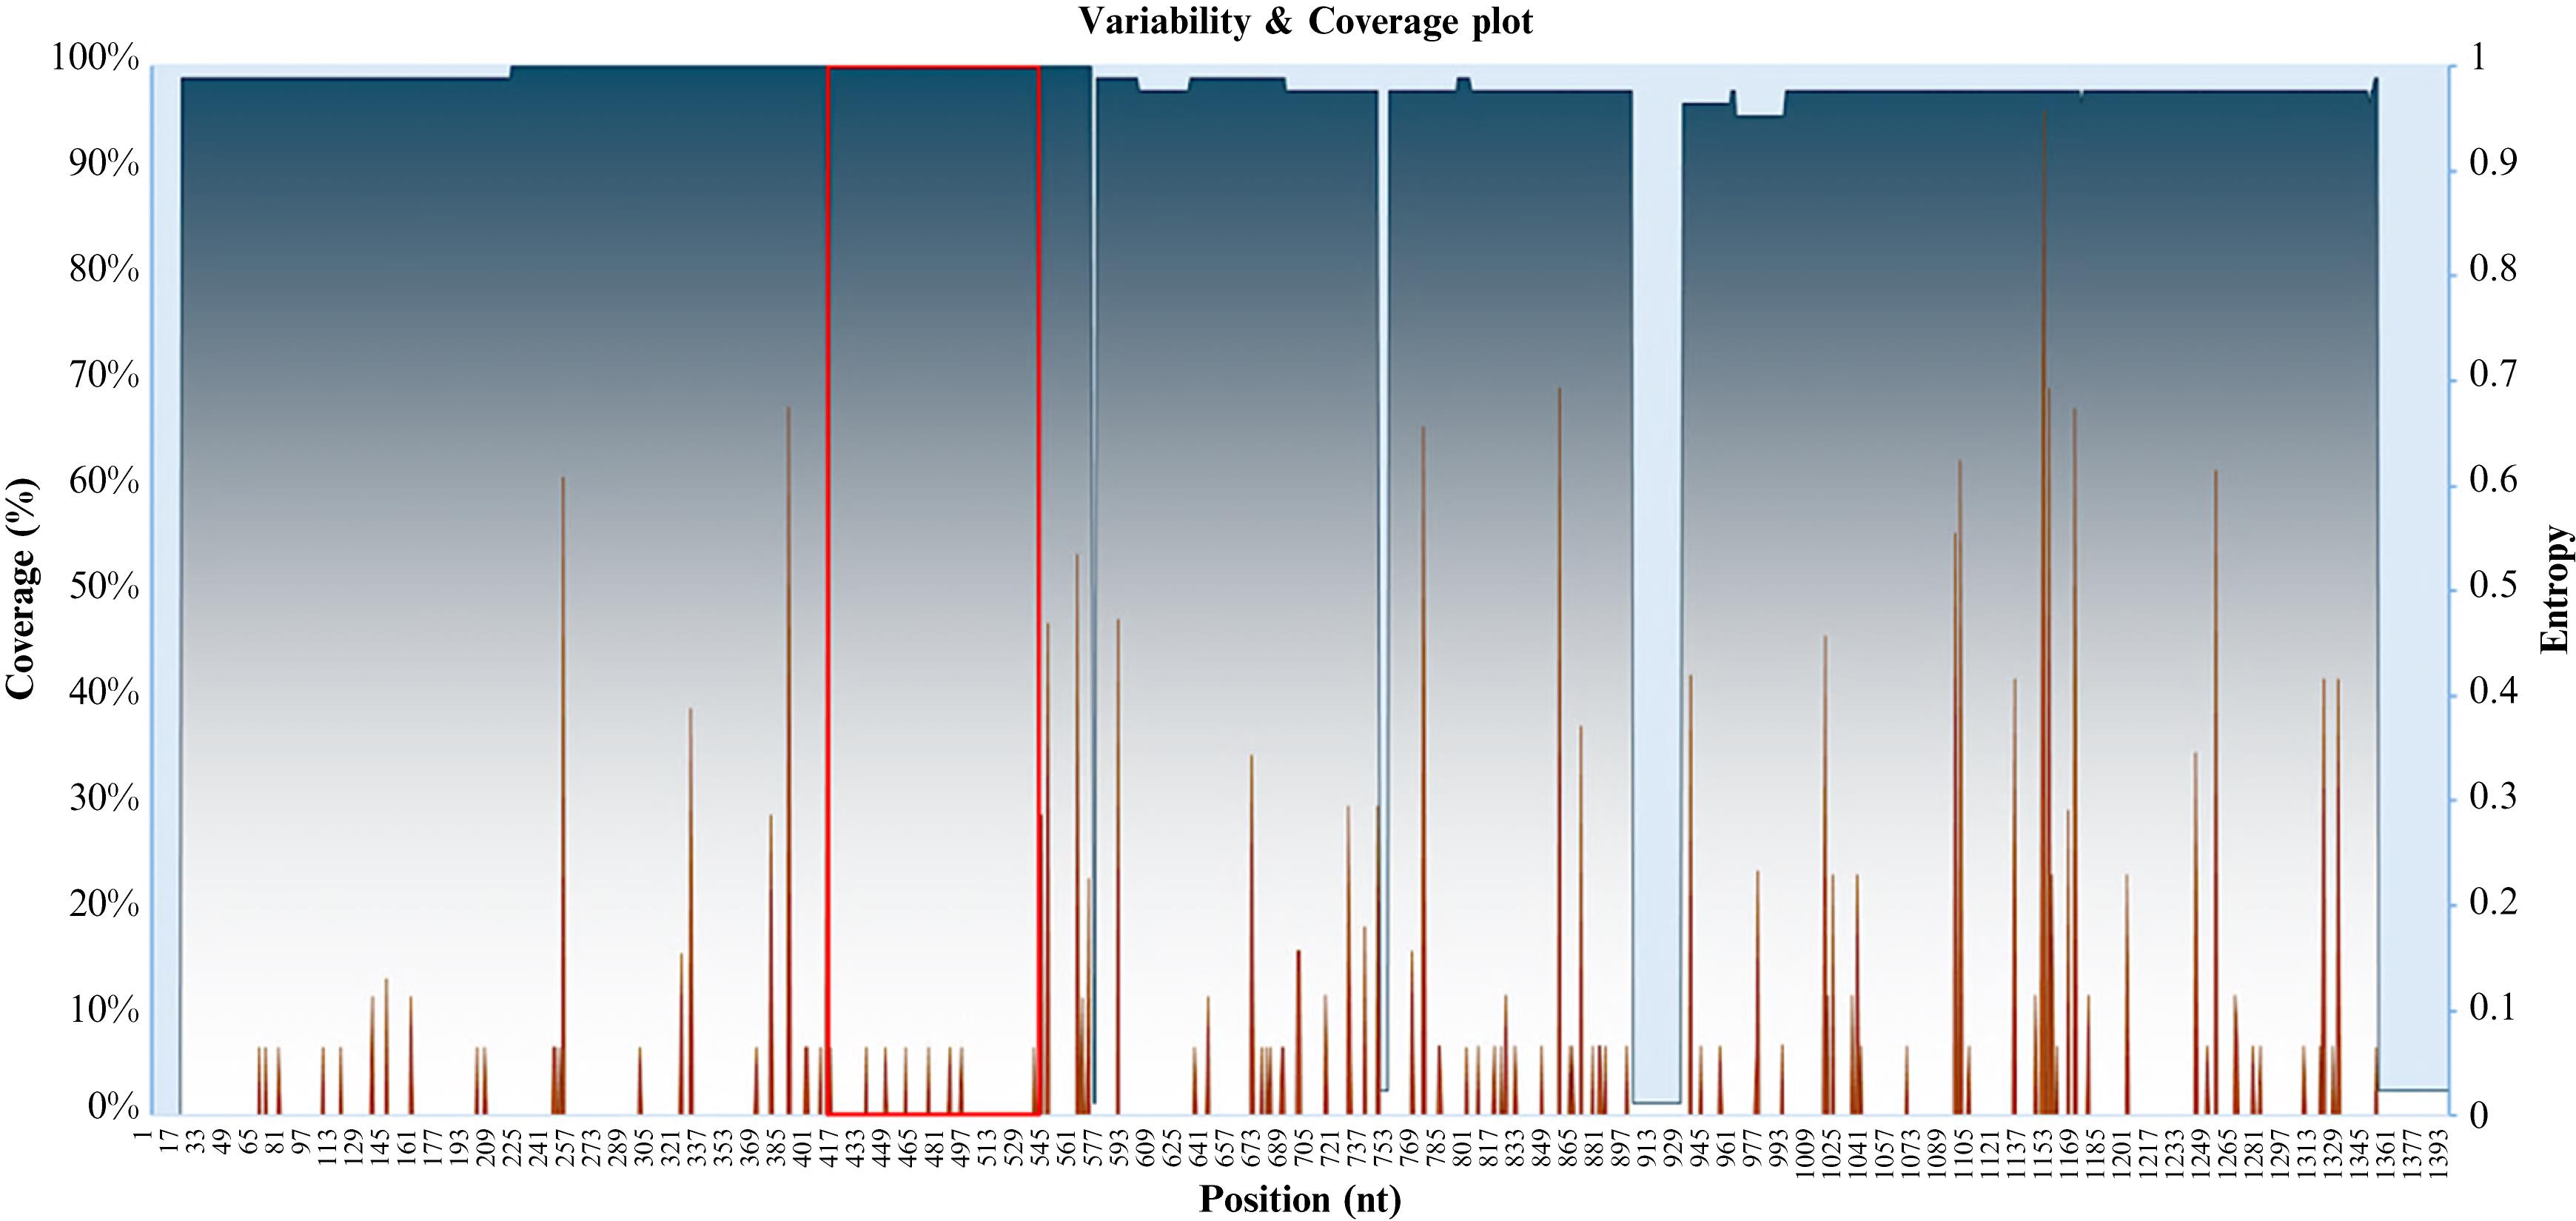
Figure 2. Variability and coverage plot. The plot depicts the coverage percentage [Coverage (%)] in a gradient of blue and the entropy (variability) in brown vs. the nucleotide (nt) position. The red box highlights the selected conserved region.
B. Primer and probe design
Refer to General note 3 for additional guidance.
1. Copy the consensus sequence.
a. Open the alignment file from the most recent modification (without redundant sequences) using the Unipro UGENE software v48.0 or newer versions.
b. Set the consensus sequence display format (Consensus type) to its default configuration (Default).
Note: In this configuration, nucleotides exhibiting 100% and <100% sequence identity are displayed in uppercase and lowercase, respectively.
c. Right-click anywhere on the aligned sequences.
d. Navigate to the Copy/Paste option within the dialog box that is subsequently displayed.
e. Choose the Copy consensus option.
2. Identify primer and probe sets in the selected conserved region of the consensus sequence.
a. Open the Oligo software v7.60 or newer versions. Navigate to the File tab and select the New Sequence option.
b. Paste the consensus sequence into the dialog box and click Accept to apply changes.
c. Save the sequence to your preferred directory. You can also close the Edit Sequence dialog box.
d. Go to the Search tab and select the Primers & Probes tool.
e. In the Search options tab, enable the Complex Substrate and TaqMan Probes & PCR Pairs options. From the dropdown menu under After successful search show, select Oligonucleotide Sets. Retain the default settings in the Subsearches tab (see Figure 3A, 3B).
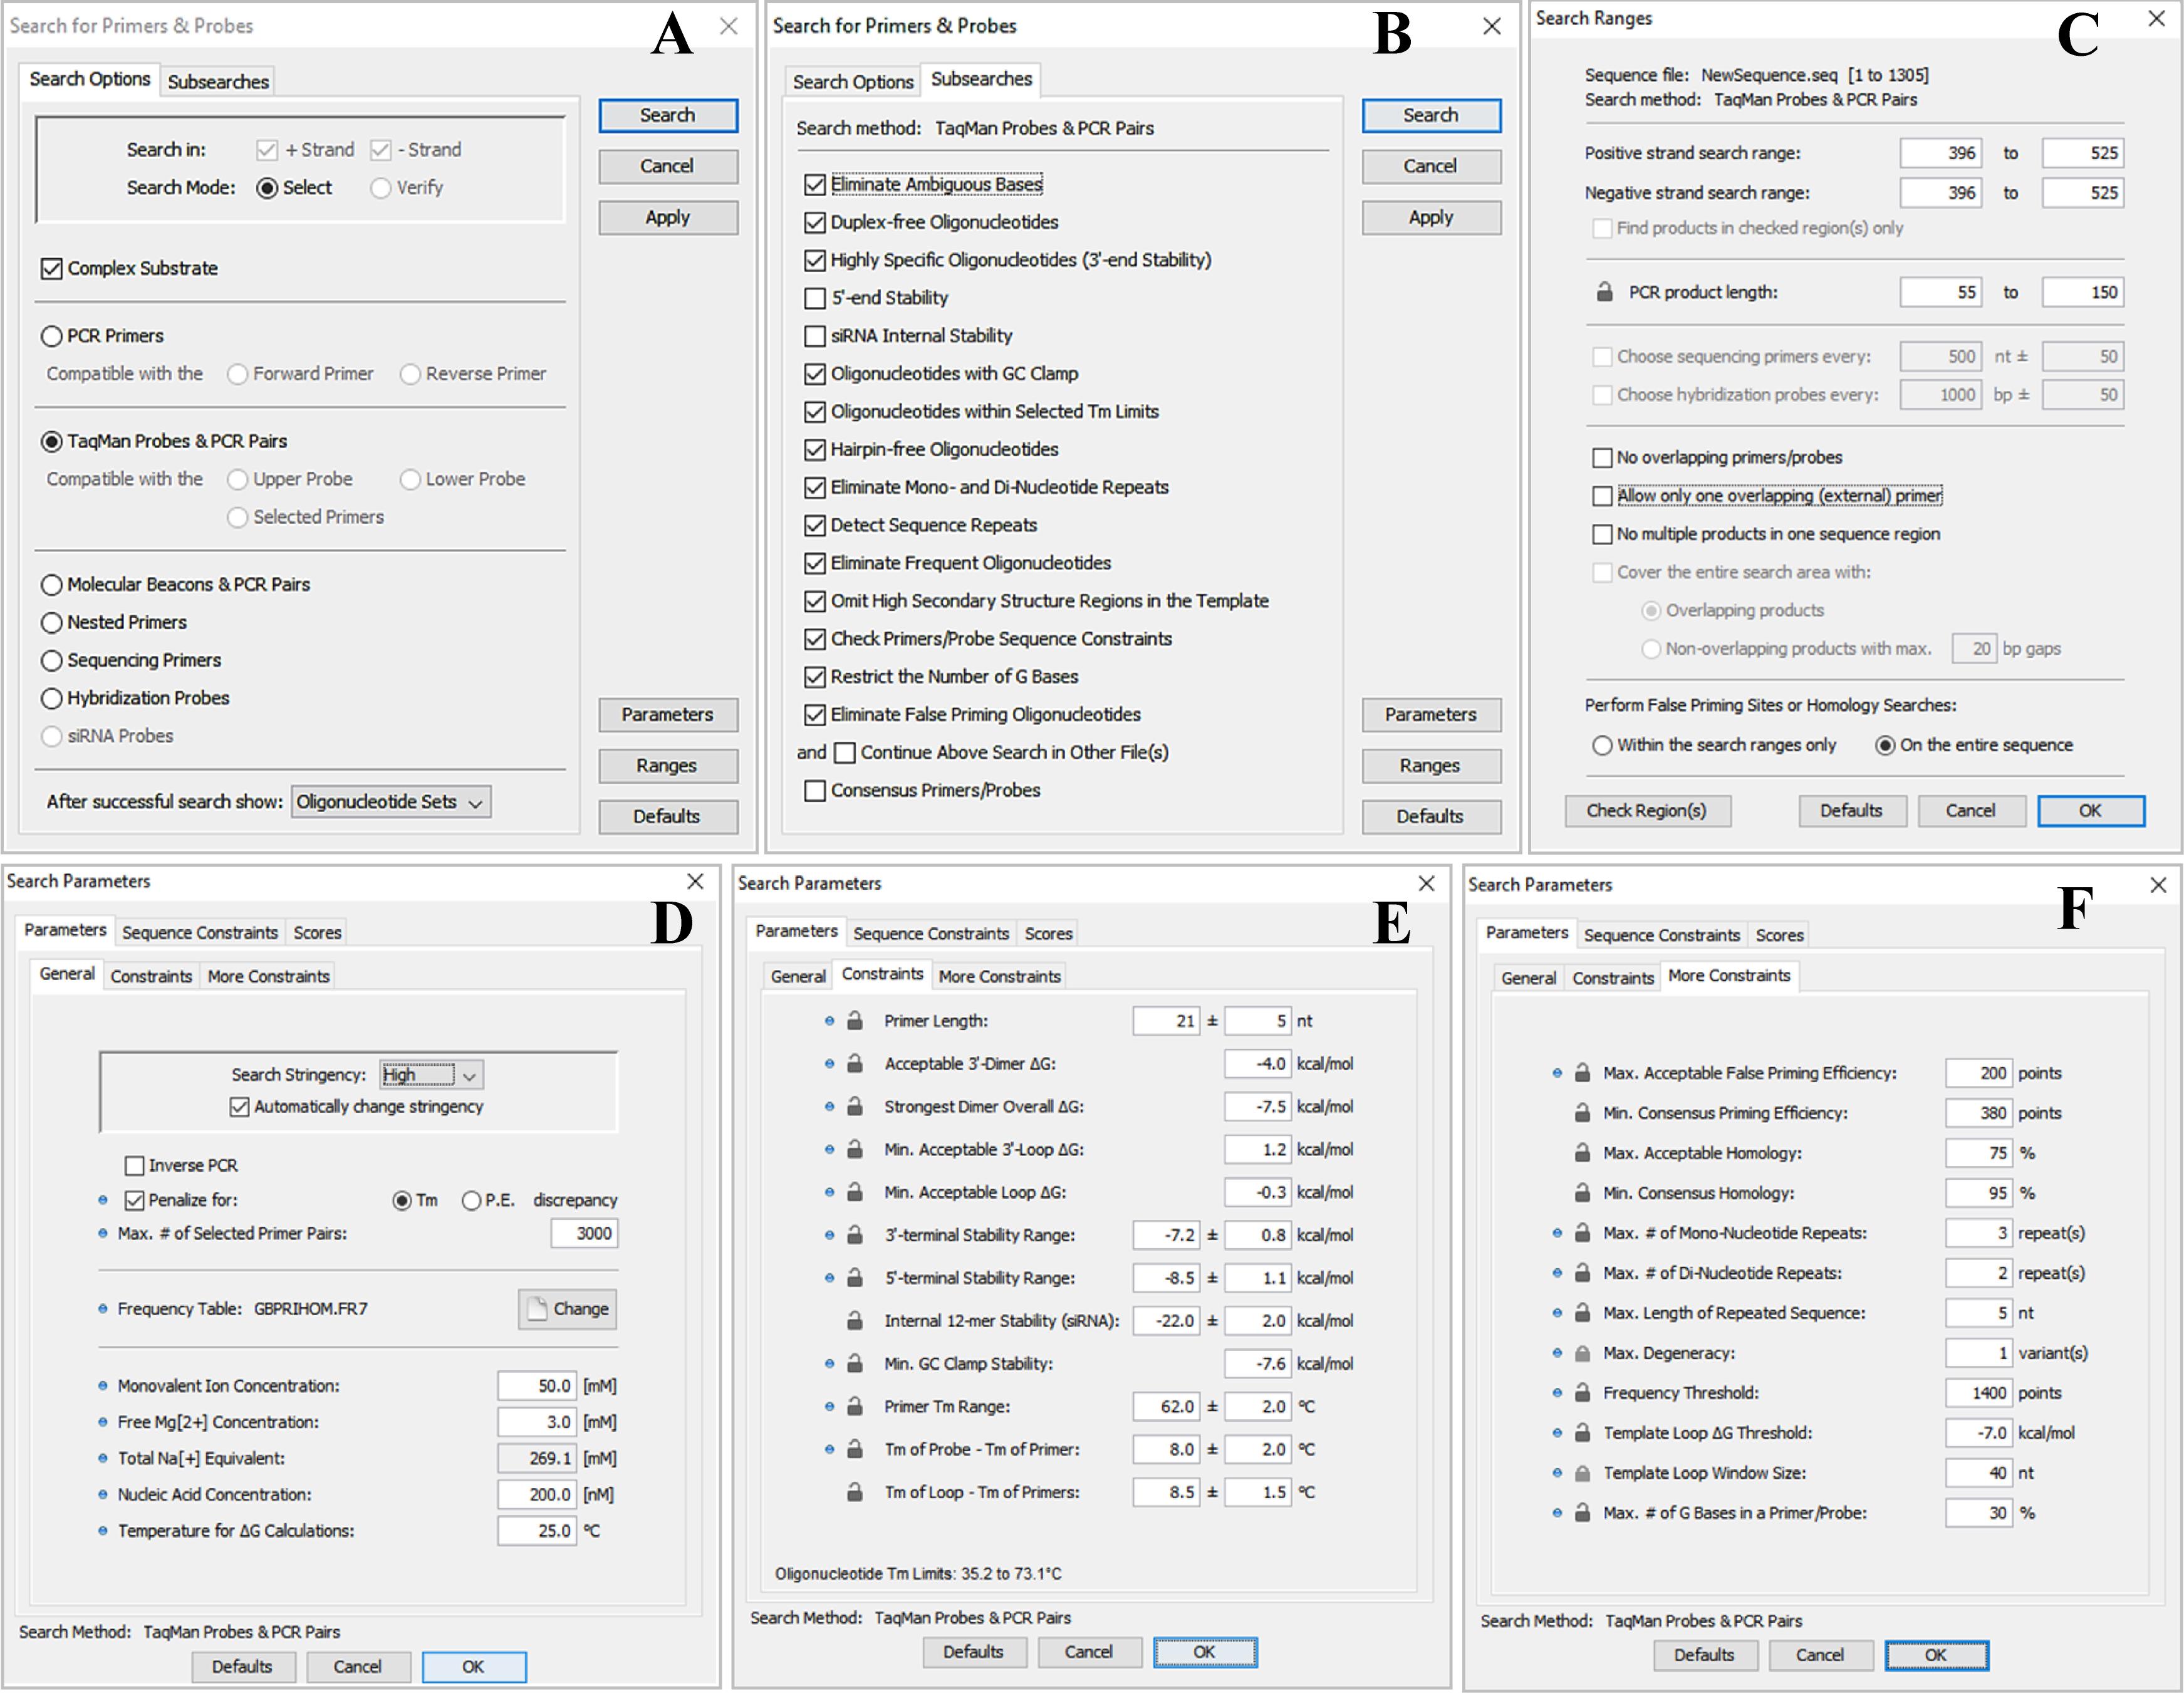
Figure 3. Configuration panels for the Search for Primers & Probes tool. A. Search options tab of the Search for Primers & Probes tool. B. Subsearches tab of the Search for Primers & Probes tool. C. Configuration panel for the Search Ranges settings (the Ranges button). D. General sub-tab of the Parameters tab under the Parameters button. E. Constraints sub-tab of the Parameters tab under the Parameters button. F. More Constraints sub-tab of the Parameters tab under the Parameters button.
f. In the editable fields of the Positive strand search range and Negative strand search range options of the Ranges button, set the region of interest in the consensus sequence to the interval 396–525 (selected conserved region). In the editable PCR product length fields, adjust the field to an amplicon size of 55–150 bases. Furthermore, uncheck the following options: No overlapping primer/probes, Allow only one overlapping (external) primer, and No multiple products in one sequence region. Finally, select the On the entire sequence option under the Perform False Priming Sites of Homology Searches section (Figure 3C).
Caution: The elimination of redundancies in the alignment must be followed by the removal of gaps at its leftmost end; otherwise, there is a risk of a leftward shift in the region of interest in the consensus sequence.
g. In the General sub-tab of the Parameters tab under the Parameters button, configure the following: select High from the Search Stringency dropdown menu and select the Automatically change stringency option. In the Frequency Table parameter, select the sequence frequency table labeled GBPRIHOM.FR7. Set the Free Mg[2+] Concentration to 3.0 mM. Retain the default settings for all other options (Figure 3D).
Note: The GBPRIHOM.FR7 frequency table facilitates the evaluation of the risk of false priming in human DNA, which serves as the background.
h. In the Constraints sub-tab of the Parameters tab under the Parameters button, adjust the following: Primer Length to 21 ± 5 nt; Acceptable 3'-Dimer ∆G to –4.0 kcal/mol; Primer Tm Range to 63.0 ± 2 °C; and Tm of Probe – Tm of Primer to 8.0 ± 2 °C. Retain the remaining parameters in their default settings (Figure 3E).
Critical: The primer Tm should be set such that it does not exceed 5 °C above the Ta of the standard DNA amplification protocol used by the automation platform Panther Fusion®. Maintain Ta within the designated range, as a temperature exceeding this range can potentially risk surpassing the maximum permissible amplification time, a requirement commonly found in continuous and random-load automation platforms.
i. In the More Constraints sub-tab of the Parameters tab under the Parameters button, adjust only the Max. Acceptable False Priming Efficiency to 200 points. Retain all other settings in the current sub-tab and in other tabs (Sequence Constraints and Scores) at their default values.
j. Click the OK button (Figure 3F). Next, click Apply (Figure 3A). Finally, click Search (Figure 3A).
k. Pick the top three primer and probe sets with the highest Score (see Data analysis 1).
l. Assess the quality of each primer and probe set (see Data analysis 1).
Note: If there is more than one oligo set that meets the requirements, it is recommended to complete the rest of this protocol with at least three of them. The final design will be selected based on performance.
C. In silico validation of design specificity
1. Analyze the homology of the oligonucleotide set.
a. Open the GenBank database's Basic Local Alignment Search Tool (BLAST).
b. In Enter accession number(s), gi(s), or FASTA sequence(s) fields, paste the sequences of the primer and probe sets to be analyzed. Follow the format specifications provided by the tool.
c. Expand the algorithm parameters by clicking + Algorithm parameter. Next, select 500 from the dropdown menu corresponding to Max target sequences parameter.
d. Retain all other parameters at their default settings.
e. Click BLAST (see Data analysis 2 and General note 4).
2. Evaluate the exclusivity of the oligonucleotide set.
a. Analyze cross-reactivity with human background (homology with human sequences).
i. Open the BLAST tool from the GenBank database.
ii. In the Enter accession number(s), gi(s), or FASTA sequence(s) fields, paste the sequences of the primer and probe sets to be analyzed. Follow the format specifications provided by the tool.
iii. In the field Organism, select Homo sapiens (taxid: 9606).
iv. Retain all other parameters at their default settings.
v. Click BLAST (see Data analysis 3 and General note 4).
b. Analyze cross-reactivity with human background (in silico PCR).
i. Evaluate whether primers can amplify human DNA. Access the MFEprimer web tool.
ii. Adjust the analysis parameters (see Data analysis 4).
iii. Retain all other parameters at their default settings.
iv. Click Run (see Data analysis 4 and General note 4).
v. Compare the results of the hairpin and dimer formation evaluation (implicit analysis) with those obtained in step B2l. The results should be comparable (both must meet the acceptability and selection criteria; see Data analysis 1).
c. Analyze cross-reactivity with microorganisms (homology with clinically and biologically related microorganisms).
i. Open the BLAST tool from the GenBank database.
ii. In the Enter accession number(s), gi(s), or FASTA sequence(s) fields, paste the sequences of the primer and probe sets to be analyzed. Follow the format specifications provided by the tool.
iii. Expand the algorithm parameters by clicking + Algorithm parameter. Next, select 500 from the dropdown menu corresponding to Max target sequences parameter.
iv. Choose Streptococcus agalactiae (taxid: 1311) in the Organism field and check the box Exclude.
v. Retain all other parameters at their default settings.
vi. Click BLAST (see Data analysis 3).
Note: The algorithm will perform an open search for homologous sequences, excluding those of S. agalactiae.
vii. Repeat the search; however, select, without exclusions, the microorganisms biologically and clinically related to S. agalactiae, as detailed in Table S3 (Supplemental material - spectrum.00057-24-s0002.docx, available at https://journals.asm.org/doi/10.1128/spectrum.00057-24 [34]).
viii. Click BLAST (see Data analysis 3 and General note 4).
Note: The algorithm will perform a closed search for homologous sequences among microorganisms that are clinically and biologically related to S. agalactiae.
3. Evaluate the inclusivity of the oligonucleotide set: coverage and clustering analysis.
a. Access the Public Databases for Molecular Typing and Microbial Genome Diversity (http://www.pubmlst.org/) database of clinical isolates.
b. Using the integrated Bacterial Isolate Genome Sequence Database (BIGSdb) tool, download all available sip gene sequences from clinical isolates of S. agalactiae.
c. (Optional) Using the Jalview software v2.11 or newer versions, remove redundant sequences. See Data analysis 5.
i. Navigate to Edit → Remove redundancy…
ii. Set the Redundancy threshold to 100%.
iii. Click Delete.
iv. Save the results as a *.FASTA file.
d. Subject the selected oligonucleotide set to a theoretical production and clustering analysis of amplicons (see Data analysis 5).
i. Go to the website at https://galaxy.sciensano.be/. Log in with your username and password. Click on SCREENED v1.0 to launch the tool.
ii. Open and conveniently name a new History (Analysis).
iii. In the Input fasta file? field, upload the (*.FASTA) file containing the retrieved sequences.
iv. In the Config file? field, upload the (*.txt) file containing the primers, detection probe, and representative/reference amplicon sequences. The oligonucleotide sequences must follow this structural format:
Table 1. Schematic representation of the order of oligonucleotide sequences in the *.txt file for analysis
| Assay name | Forward primer | Reverse primer | Probe | Amplicon |
|---|---|---|---|---|
| LDT_GBS_sip | AGTTTCTCTCAATACAATTTYGGAAGGT | GCTGGCGCAGAAGAATATGTCT | TGACACCAGAAGCAGCAMCAACGATTG | AGTTTCTCTCAATACAATTTCGGAAGGTATGACACCAGAAGCAGCAACAACGATTGTTTCGCCAATGAAGACATATTCTTCTGCGCCAGC |
Notes:
1. Oligonucleotides and amplicons should not be formatted with headers; rather, the table format is for illustrative purposes only.
2. The sequence of the probe and the amplicon must always be in the forward direction.
3. If more than one assay is to be tested, repeat the same structure on a new line in the same file. This only applies to tests directed against more than one target sequence for the detection of the same pathogen (multi-target tests).
v. In the Method to evaluate? field, input the assay name exactly as specified in the *.txt file.
Note: For multi-target tests, specify all the assay names separated by commas (,) without spaces. Avoid using special characters.
vi. Enable the Set advanced options? option.
vii. In the Clustering to perform? dropdown menu, select the Greedy algorithm.
viii. Adjust the following parameters to 10, 90, and 0, respectively: Maximum percentage of allowed mismatches in fragment annealing sites?, Minimum alignment percentage in fragment annealing sites?, and Number of mismatches allowed in the chosen oligonucleotide 3' end region?.
ix. Retain all other parameters at their default settings.
x. Click Run Tool.
Note: The analysis may take several minutes, or it may be paused, depending on the number and length of clinical isolate sequences and the number of users of the tool at the time of analysis.
xi. Download the files generated as a result of the analysis: Summary output on data…, Cluster output on data…, and Detail output on data.
xii. Copy the contents of the tables, without their headers, from the output files and paste them into the corresponding (homonymous) sheets in the inclusivity calculation template (File S4 Inclusivity calculator_LDT GBS sip.xlsx). When pasting, always start from cell A2 of the sheets.
Critical: Columns W to AE [Seq. ID Count, Assay fail by oligo mismatches (1 = No, 0 = Yes), Assay fail by 3-end mismatches (1 = No, 0 = Yes), Multiple assay fail by oligo mismatches (1 = No, 0 = Yes), Multiple assay fail by 3-end mismatches (1 = No, 0 = Yes), Positive signal for combination of methods (o = no, 1 = yes), Cluster number, and Number of sequences per Cluster y 1 / Number of sequences per Cluster, respectively] of the Detail output sheet contain calculated cells and should not be modified.
e. Purge the registry.
Notes:
1. All the steps to purge the records described below are performed in the Detail output sheet of the inclusivity calculation Template (File S4 Inclusivity Calculator_LDT GBS SIP.xlsx).
2. For more information on the rules for scoring and filtering during purging, refer to the Explanation sheet of the inclusivity calculation template or the SCREENED bioinformatics tool manual.
i. Delete the records (rows) in column C [Amplicon code (see manual!)] that have a score value of zero (0).
Note: It is much easier to delete records when filtering by the content of the table columns.
ii. Delete records containing amplicons with degenerate nucleic acids or incomplete sequences. To do this, filter column D (Found amplicon sequence in reference genome) by the values “N” and then “-”.
Note: It is highly probable that the filters applied prior to each purging step must be removed.
iii. Delete the records whose score values in column E [Forward primer anneals? (1 = yes, < 1 = no (see manual!))] are zero (0) or -2.
iv. Investigate the records in column E [Forward primer anneals? (1 = yes, < 1 = no (see manual!))] with score values of -1 and -3. It is necessary to distinguish the records whose amplicon sequences match the target sequence. Eliminate all records with a score of -1 or -3 whose amplicon sequence [column D (Found amplicon sequence in reference genome)] is not within the target sequence.
Notes:
1. To quickly identify records whose amplicon sequences might not belong to the target sequence, look for records with more than three mismatches in column I (Number of mismatches in forward primer annealing site), while keeping column E [Forward primer anneals? (1 = yes, < 1 = no (see manual!))] filtered.
2. To figure out if the found amplicon matches the target sequence, use the “copy” and “search” features of the Excel and BenchlingTM software, respectively. If the amplicon sequence (with a reasonable amount of mismatches) is not flanked by the primer sequences, it does not belong to the target sequence.
v. Make sure the size of the forward primer in all records is as expected. If not, investigate the cause and consider deleting the record based on the considerations and criteria above.
vi. Repeat steps C3e.iii–v but for the remaining oligos (reverse primer and probe).
Note: For the reverse primer, use columns K [Reverse primer anneals? (1 = yes, < 1 = no (see manual!))], O (Number of mismatches in reverse primer annealing site), and P (Length of reverse primer annealing site). For the probe, use columns Q [Probe anneals? (1 = yes, < 1 = no (see manual!))], U (Number of mismatches in probe annealing site), and V (Length of probe annealing site).
Critical: Columns W to AE, highlighted in a different color, contain calculated cells and should not be edited.
vii. (Only for multi-target tests) Delete all records whose score values in column W (Seq. ID Count) are less than the number of target sequences.
Note: For example, for a test targeting two sequences, delete all records with a score of 1. For a test targeting three sequences, delete all records with a score of 1 and 2, and so on.
f. Calculate inclusivity and clustering.
i. Copy the contents of cells A1–A15 of any of the files generated using the SCREENED tool (Summary output on data..., Cluster output on data..., and Detail output on data...) and paste them into cells A5–A19 of the Analysis sheet of the inclusivity estimation template.
Critical: If you skip this step, the inclusivity estimation and clustering analysis will not work correctly, and the results will contain errors.
ii. In the ASSAY column of the Assay Inclusivity Calculator table on the same sheet (Analysis), select the assay that corresponds to the LDT from the drop-down list. Delete any assays that do not correspond to the test from previous analyses.
Note: The Assay Inclusivity Calculator and Amplicon Cluster Analyser tables are updated right away.
iii. Check the OVERALL INCLUSIVITY column of the Assay Inclusivity Calculator table and the Amplicon Cluster Analyser table. These show the calculated inclusivity and results of the clustering analysis, respectively (see Data analysis 5 and General note 3).
D. Optimization of physicochemical conditions
Refer to General note 5 for additional guidance.
1. Prepare the synthetic amplification control (see General note 6).
a. Reconstitute the synthetic duplex DNA control (UltramerTM duplex) with 1 mL of IDTE buffer, pH 8.0.
Note: The reconstitution of 4 nmol UltramerTM duplex synthetic control with 1 mL of diluent will yield a nominal concentration of approximately 2.41 × 10¹⁵ copies/mL.
Caution: The risk of cross-contamination due to UltramerTM duplex synthetic controls is high. Hence, these materials must be handled in a post-amplification area or in a dedicated aerosol-controlled airflow cabinet.
b. Prepare a dilution panel of the UltramerTM duplex synthetic control by performing 13 1:10 serial dilutions in the IDTE buffer, pH 8.0, starting from the reconstituted control. The dilution panel will consist of 14 members with nominal concentrations ranging from 2.41 × 10¹⁵ to 2.41 × 10² copies/mL.
Note: A 1:100 dilution factor may be used for the initial three serial dilutions, followed by a 1:10 dilution factor from 2.41 × 10⁹ copies/mL to 2.41 × 10² copies/mL. A dilution volume of 1 mL/member may be used.
c. Prepare a 1:500 dilution of IC-X in IDTE buffer, pH 8.0.
Note: A 1:500 dilution of the IC-X, which ensures Ct ≈ 29 ± 1, represents approximately twice the concentration that the Panther Fusion® system achieves during automated sample processing (Ct ≈ 30 ± 1).
2. Prepare the LDT oligonucleotide stock solutions. Resuspend the oligonucleotides in IDTE buffer, pH 7.5, to reach a final concentration of 100 µM. Follow the manufacturer’s instructions for reconstitution.
Notes:
1. The Resuspension Calculator tool from IDT (https://www.idtdna.com/Calc/resuspension/) can be used for calculations.
2. Primers and TaqMan probes can be synthesized via synthesis services such as Integrated DNA Technology (IDT, https://www.idtdna.com/) or Biosearch Technologies (https://www.biosearchtech.com/) (see General note 7).
3. Prepare the working solutions of oligonucleotides. Prepare 1:10 dilutions (10 µM) of the stock solutions using nuclease-free water. Follow the manufacturer’s instructions for oligonucleotide dilution.
Notes:
1. The Dilution Calculator tool from IDT (https://www.idtdna.com/Calc/Dilution/) may be used for accurate calculations.
2. The primer working solution can be prepared as a mixture of both forward and reverse primers (primer mix).
4. Optimize salt concentrations (Mg2+ and K+).
a. Arrange 25 MicroAmp® thin-walled reaction tubes with flat caps (0.5 mL) in a 5 × 5 grid (5 rows and 5 columns of tubes)
Note: For ease of handling of the reaction tube arrangement, use ChillBlockTM tube racks for microcentrifuge tubes. To ensure the stability of the PPR components, maintain the block at a temperature of 2–8 °C.
b. Assign MgCl2 concentrations (1.0, 2.0, 3.0, 4.0, and 5.0 mM) to the columns, from left to right. Similarly, assign KCl concentrations (0, 25, 50, 75, and 100 mM) to the rows, from top to bottom.
Note: The intersection of the columns represents the concentrations of MgCl2, and the rows representing the concentrations of KCl represent the combinations. A total of 25 distinct combinations are possible; this is analogous to an antibody titration matrix.
c. Using the template in File S5, determine the volumes of the common (primers, probes, and TRIS) and variable components (MgCl2, KCl, and nuclease-free water) in the PPR for all possible combinations of the variable components (components to be optimized) (see the recipe for PPR for optimizing MgCl2 and KCl concentrations)
Notes:
1. At least two replicates per PPR may be included, with an excess reaction volume prepared to accommodate potential volumetric imprecision. Given that each PPR replicate will occupy one well of the 96-well amplification plate, it is not feasible to utilize more than two replicates per PPR. In the absence of suboptimal imprecision, it is possible to repeat the experiment as many times as necessary until the desired precision is achieved.
2. Fix the concentrations of the common components (primers, probes, and TRIS) at baseline levels of 0.6, 0.3, and 8 mM, respectively.
d. Mix all common components of the PPR, as specified in the calculation template, in an SC micro tube PCR-PT (1.5 mL). Homogenize on a vortex mixer using short pulses. Next, centrifuge briefly to collect the solution at the bottom of the tube.
e. Mix the volumes of the common and variable components in each PPR tube as specified in the calculation template. Homogenize on a vortex mixer using short pulses. Next, centrifuge briefly to collect the solution at the bottom of the tube.
Notes:
1. Nuclease-free water may be added initially, followed by the variable components, and subsequently, the mixture of common components.
2. Although not definitively delineated in this protocol, the use of a bidimensional serial dilution matrix (rows and columns) is a viable option for the preparation of the PPRs as well.
f. Using a nuclease-free piercing tool, perforate as many wells as needed in the Panther Fusion® Open AccessTM RNA/DNA enzyme cartridge.
Notes:
1. Each Panther Fusion® Open AccessTM RNA/DNA enzyme cartridge contains 12 wells, which is sufficient for 12 separate reactions.
2. The MagNA Pure 24 piercing tool may be used to pierce the enzyme wells.
3. Before piercing, the Panther Fusion® Open AccessTM RNA/DNA enzyme cartridge must be labeled to facilitate identification and sectioning by the PPR.
g. Rehydrate each lyophilized enzyme with 20 µL of the corresponding PPR. Rehydrate as many wells as were predicted as replicates (+ 1) per PPR.
h. Allow the master mixes (MMXs) to stand for 1–5 min at room temperature (18–25 °C). Next, gently homogenize on a vortex mixer, placed on a flat, cushioned motion platform, using short pulses.
Note: During vortex homogenization, do not allow the liquid column of the MMXs in each well of the enzyme cartridge to reach the surface.
i. (Optional) Centrifuge briefly to collect all reaction mix volumes at the bottom of the wells in the Panther Fusion® Open AccessTM RNA/DNA enzyme cartridge.
j. (Optional) Combine the MMXs from a single PPR into a new nuclease-free tube.
Notes:
1. If applicable, the MMXs may be distributed in the PPRs’ 5 × 5 matrix format.
2. Depending on the MMX volumes, use 0.5, 1.5, or 2 mL nuclease-free tubes as appropriate.
k. In an organized manner, transfer 20 µL of each MMX into the selected wells of a 96-well thin-wall hard-shell PCR plate. Consider the number of replicates per MMX (PPR) defined in the experimental design.
Note: If applicable, the MMXs may be distributed in the PPRs’ 5 × 5 matrix format.
l. Add 5 µL of the dilution panel member of the UltramerTM duplex synthetic control, with a nominal concentration of 2.41 × 10⁵ copies/mL, to each well containing the MMX.
Note: In optimal conditions, the UltramerTM duplex control at 2.41 × 10⁵ copies/mL ensures a Ct of approximately 30.0 ± 1.
m. Seal the amplification plate with a MicroAmp® optical adhesive film.
n. Centrifuge the amplification plate at 2,576× g for 1 min at room temperature (18–25 °C).
o. Perform amplification and detection using the CFX96 Dx analyzer according to the protocol outlined in Table 2 (see General note 3).
Table 2. Panther Fusion® Open AccessTM DNA standard protocol
| Step | Temperature | Time | Cycles |
| Activation | 95 °C | 2 min | 1 |
| Amplification/detection | 95 °C | 8 s | 45 |
| 60 °C* | 25 s |
*Fluorescence reading.
On the CFX96 Dx analyzer, amplification is assumed to occur under the following minimum configuration: Plate type, BR White; Scan mode, All Channels.
p. Analyze the results.
i. On the log scale of a graph of the relative fluorescence units (RFU) vs. amplification cycles, adjust the Ct threshold to a height approximately similar to the midpoint of the linear zone (exponential amplification region) of the fluorescence amplification curves (approximately 1000 RFU) (see General note 8).
ii. Identify the fluorescent amplification curves with signs of optimal performance (see Data analysis 6) (Figure 4).
iii. Select one of the possible optimal conditions or combinations corresponding to the fluorescence amplification curves identified in the preceding step (Figure 4).
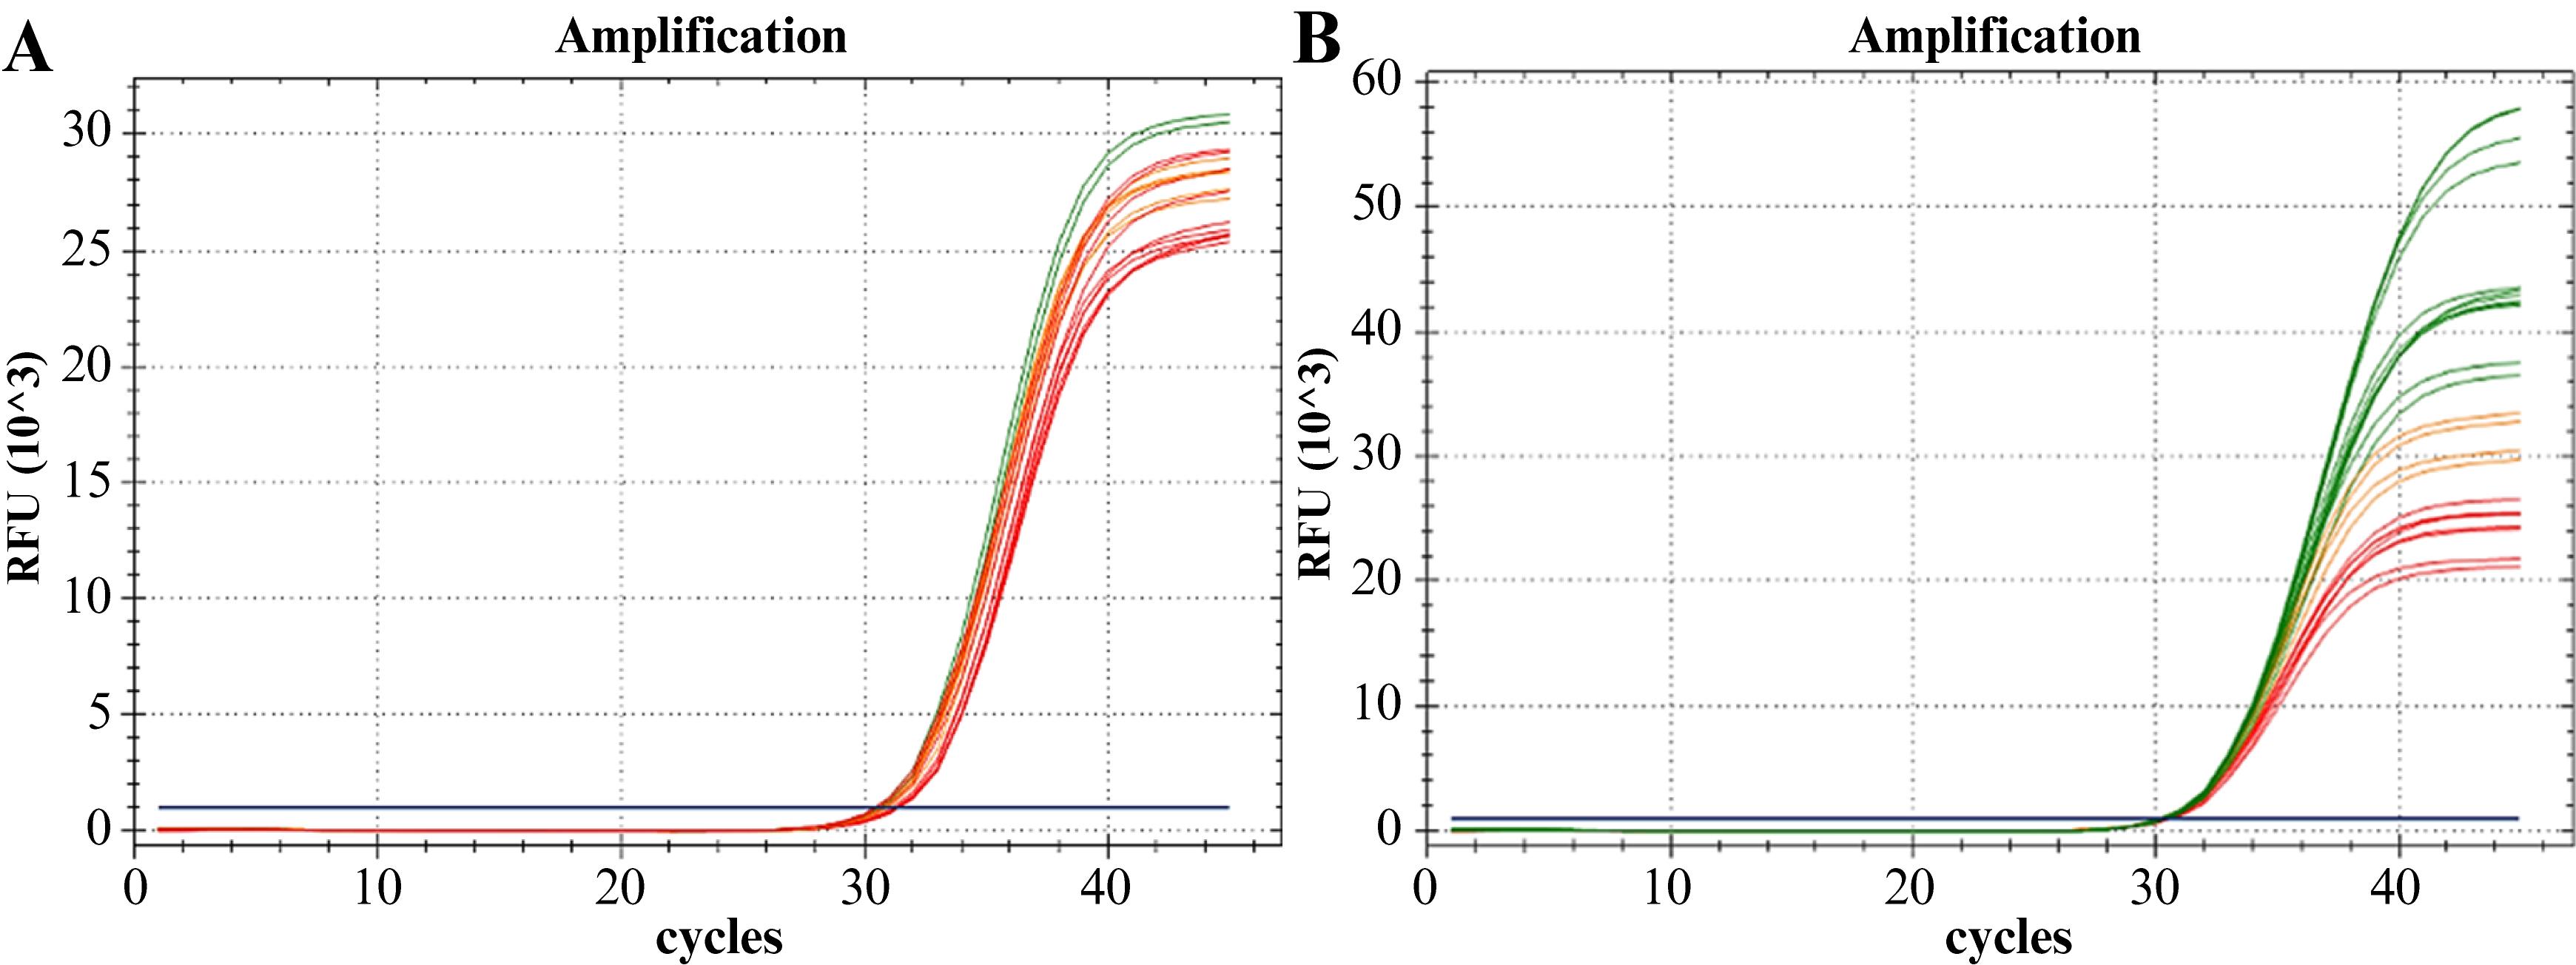
Figure 4. Amplification curves from the experiment optimizing salt and oligonucleotide concentrations. A. Optimization of MgCl2 and KCl concentrations. B. Optimization of primer mix and probe concentrations. The combinations of optimal concentrations (desired for the amplification of S. agalactiae sequence target) are represented in green. The combinations with lower performance are shown in red, while those with intermediate performance are represented in orange.
5. Optimize primer and probe concentrations.
Repeat all steps outlined in step D4 [Optimize salt concentrations (Mg2+ and K+)].
Notes:
1. Consider the following:
Fix salt concentrations at their optimized values: [MgCl2] = 3 mM and [KCl] = 100 mM.
In the 5 × 5 matrix for primer mix and probe concentration optimization, assign the following values: primer mix concentrations (1:1 ratio) of 0.2, 0.4, 0.6, 0.8, and 1.0 µM and probe concentrations of 0.2, 0.3, 0.4, 0.5, and 0.6 µM. Modify the template in File S5 to calculate the volumes of the common (MgCl2, KCl, and TRIS) and variable (primers/primer mix, probe, and nuclease-free water) components in the PPR for all possible combinations (components to be optimized) (see the recipe for PPR for optimizing the concentration of the primer mix and probe for the LDT-GBS assay).
2. The specified primer mix concentration refers to the concentration of each individual primer (forward and reverse), rather than the sum of both.
3. The primer concentrations can be optimized individually (one by one) before optimizing the probe concentration. However, no significant error is introduced when optimizing primer concentrations as a 1:1 ratio mix, provided that:
The Tm of the primers differs by no more than 2 °C, and any degenerate nucleotide positions, if present, are not in the last five nucleotides of the 3' end.
Degenerate nucleotides constitute no more than 10% of the primer’s total length.
6. Optimize TRIS concentration.
Note: Consider the following:
Fix salt concentrations at their optimized values: [MgCl2] = 3 mM and [KCl] = 100 mM.
Fix oligonucleotide concentrations at their optimized values: [primer mix] = 0.6 µM and [probe] = 0.4 µM.
a. Assign the following TRIS concentrations to three MicroAmp® thin-walled reaction tubes with flat caps 0.5 mL: 5.0, 8.0, and 10.0 mM.
b. Using the template in File S6, calculate the volumes of the common (primers, probe, MgCl2, KCl) and variable (TRIS and nuclease-free water) components of the PPRs (see the recipe for PPR for optimizing TRIS concentration).
Note: At least two replicates may be included for each PPR, with an additional excess of reaction volume prepared to accommodate potential volumetric imprecision. Each replicate should be prepared in a single well of a 96-well PCR plate.
c. Continue from step D4d.
Notes:
1. Typically, the presence of TRIS at concentrations from 5 to 10 mM does not interfere with the optimal performance of an amplification mix.
2. While other additives, including betaine, bovine serum albumin, and dimethyl sulfoxide, can also be optimized using the principles outlined herein, a detailed description of these is beyond the scope of the present work.
7. Optimize annealing/elongation temperature (Ta) (see General note 3).
a. Prepare a PPR that can handle 24 reactions, with at least two extra reactions (dead reactions) (see the recipe for PPR for optimizing Ta). Use the calculation template in File S7.
Note: Ensure the use of optimized concentrations of the components: [MgCl2] = 3 mM, [KCl] = 100 mM, [TRIS] = 8 mM, [primer mix] = 0.6 µM, and [probe] = 0.4 µM.
b. Continue from step D4f.
Note:
1. Consider the following:
Resuspend 25 wells (24 + 1 extra well) of the Panther Fusion® Open AccessTM RNA/DNA enzyme cartridge with the prepared PPR.
Combine all MMX (PPR-resuspended enzyme) into a single nuclease-free tube.
Distribute the MMX across a 96-well hard-shell PCR plate, filling wells from A1 to H3.
2. The distribution setup guarantees that the MMX is exposed to eight distinct annealing and elongation temperatures (from lower to higher, rows H–A of the amplification plate). Each temperature is tested in triplicate (columns 1–3 of the amplification plate).
Perform amplification using a gradated annealing/elongation temperature protocol. Use a temperature range of 10 °C, from 56 °C (row H) to 66 °C (row A): 56, 56.7, 58, 60, 62.4, 64.3, 65.5, and 66 °C. Details of the amplification protocol are presented in Table 3.
3. The annealing temperature range can be adjusted based on the theoretical Ta of the LDT and the desired level of accuracy required to determine the optimal Ta experimentally. Ensure that the theoretical Ta is as close as possible to the center of the temperature gradient. In this case, the theoretical Ta aligns close to column E of the amplification plate. The Ta range can subsequently be adjusted, expanded, or narrowed based on the experimental results.
Table 3. CFX96 Dx DNA protocol for the optimization of annealing temperature (Ta): Ta gradient.
| Step | Temperature | Time | Cycles |
| Activation | 95 °C | 2 min | 1 |
| Amplification/detection | 95 °C | 8 s | 45 |
| 60 °C* | 25 s |
*Ta gradient and fluorescence reading.
8. Verify the optimality of other non-optimized parameters (see General note 9 and Data analysis 7).
a. Verify the activation temperature (Tact) of the PCR protocol. Follow the procedures outlined in step D7.
Note: Consider the following:
Perform amplification using gradated activation temperatures. Use a temperature range of 5 °C, from 93 °C (row H) to 98 °C (row A): 93, 93.4, 94, 95, 96.2, 97.2, 97.7, and 98 °C. Use the amplification protocol described in Table 3 and adjust as needed.
Maintain all other optimized or verified physicochemical parameters (Ta = 60 °C).
b. Verify the denaturation temperature (Td) of the PCR protocol. Follow the procedures outlined in step D7.
Note: See the note in step D8a. Maintain all other optimized or verified physicochemical parameters (Tact = 95 °C and Ta = 60 °C).
c. Verify the activation time (tact) of the PCR protocol. Follow the procedures outlined in step D7.
Note: Consider the following:
Perform three amplifications using the standard DNA amplification protocol (Table 2) with activation times of 1, 2, and 3 min, respectively.
Analyze five replicates for each amplification protocol.
Maintain all other optimized or verified physicochemical parameters (Tact = 95 °C, Td = 95 °C, and Ta = 60 °C).
d. Verify the denaturation time (td) of the PCR protocol. Follow the procedures outlined in step D7.
Note: Consider the following:
Perform three amplifications using the standard DNA amplification protocol (Table 2) with denaturation times of 5, 8, and 10 s, respectively.
Analyze five replicates for each amplification protocol.
Maintain all other optimized or verified physicochemical parameters (Tact = 95 °C, tact = 2 min, Td = 95 °C, and Ta = 60 °C)
e. Verify the annealing/elongation time (ta) of the PCR protocol. Follow the procedures outlined in step D7.
Note: Consider the following:
Perform three amplifications using the standard DNA amplification protocol (Table 2) with annealing/elongation times of 18, 22, and 25 s, respectively. The annealing or elongation time cannot be extended beyond 25 s, as this would exceed the critical amplification time of 55 min on the Panther Fusion® (see General note 3).
Analyze five replicates for each amplification protocol.
Maintain all other optimized or verified physicochemical parameters (Tact = 95 °C, tact = 2 min, Td = 95 °C, td = 8 s, and Ta = 60 °C).
9. Optimize primer mix and probe concentration for the IC-X detection assay. Repeat all steps outlined in step D5.
Note: Consider the following:
Replace the UltramerTM duplex synthetic control with the previously prepared 1:500 dilution of the IC-X DNA template.
Use the template in File S5 to determine the volumes of the common (MgCl2, KCl, and TRIS) and variable (primer mix, probe, and nuclease-free water) components in the PPR for all possible combinations (components to be optimized) (see the recipe for PPR for optimizing the primer mix and probe concentrations for an IC-X detection assay).
During result analysis:
i. Set the fluorescence threshold at the midpoint of the linear phase (log scale) of the amplification curves (approximately 500 RFU) (see General note 8).
ii. Identify amplification curves with suboptimal performance signs based on fluorescence patterns (see Data analysis 6) (Figure 5).
iii. Select one of the suboptimal conditions corresponding to the amplification curves identified above (Figure 5).
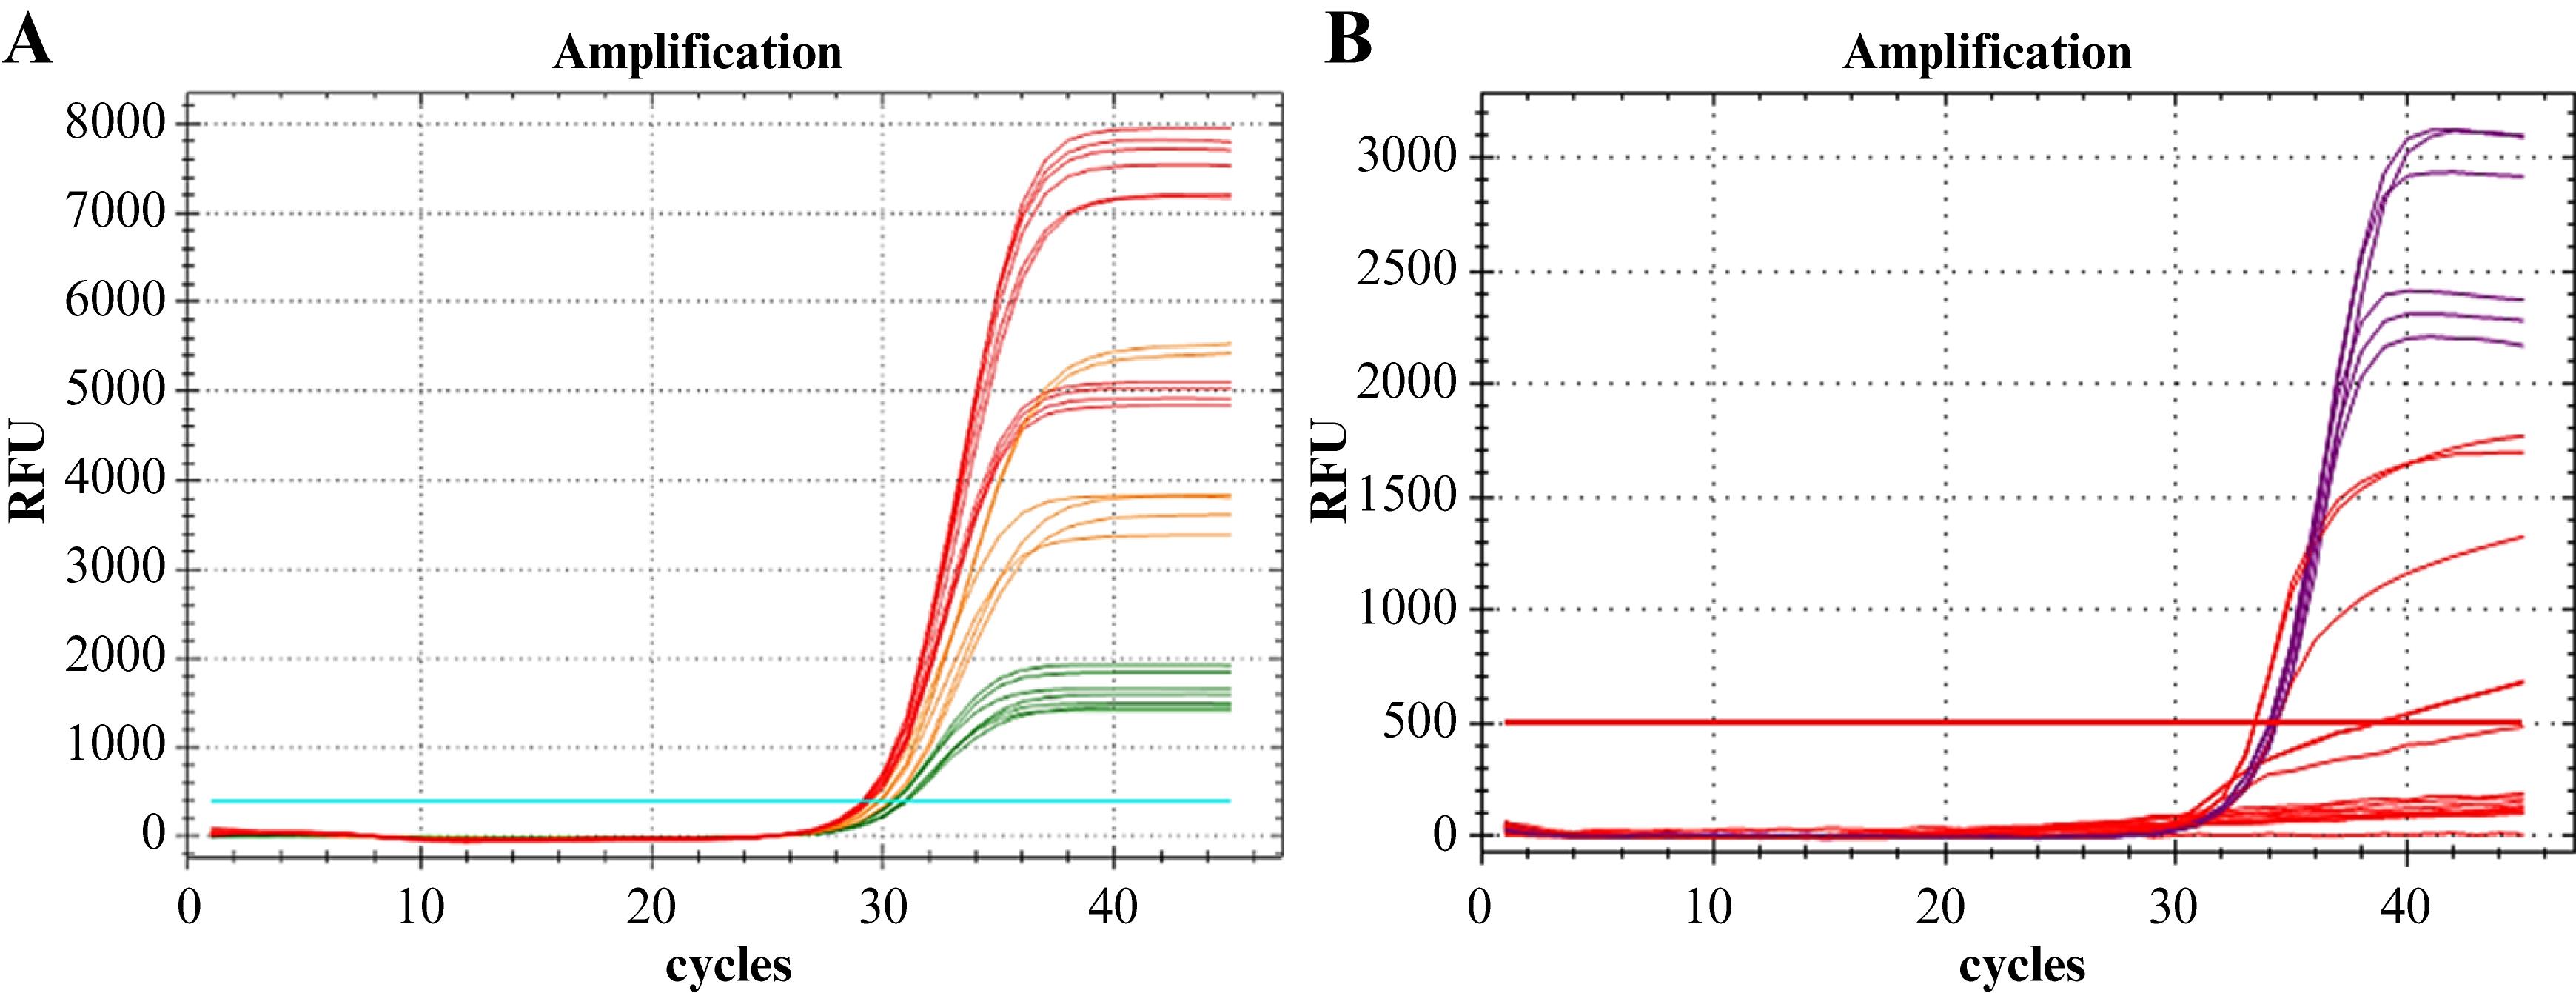
Figure 5. IC-X amplification curves. A. Optimization experiment of the IC-X primer mix and probe concentrations. The red color indicates optimal concentration combinations that are not recommended for IC-X multiplex amplification. The green color indicates the most favorable suboptimal concentration combinations, which are suitable for IC-X multiplex amplification. The orange color represents concentration combinations with intermediate performance. B. IC-X amplification curves in the multiplex reaction (LDT-GBS + IC-X detection assay) from the multiplex compatibility evaluation experiment at 0.3 µM of DNA IC primer mix (IC-X primer mix) and 0.2 µM of DNA IC probe (IC-X probe). The red curves indicate a reduction in amplification efficiency or, in some cases, amplification failure. These curves correspond to nominal concentrations of 2.41 × 10–2.41 × 10 copies/mL of the UltramerTM duplex synthetic control. In contrast, the purple curves represent the maximum amplification efficiency. These curves correspond to nominal concentrations of 2.41 × 10 copies/mL, or less, of the UltramerTM duplex synthetic control.
E. In vitro validation of design specificity
1. Prepare the dilution panel.
a. Obtain a clinical specimen (rectovaginal swab selectively enriched in LIM broth) with a high S. agalactiae count. Alternatively, use a spiked sample (using a commercial strain or reference material) enriched in LIM broth (see General note 10).
Notes:
1. A suitable reference material is Streptococcus agalactiae Lehmann and Neumann, serotype Ia (ATCC, 12386).
2. A bacterial count is deemed to be high when the Ct value is ≤25.
b. Prepare seven 1:10 serial dilutions in fresh LIM broth medium.
c. Perform extraction and purification of bacterial nucleic acids from all dilution levels using the MagNA Pure 24 instrument. Follow the manufacturer’s instructions. In brief:
i. Prepare a sufficient volume of MagNA Pure bacterial lysis buffer and proteinase K at a 5:1 ratio (lytic mixture) for 7 + 1 samples. Use a lytic mixture volume of 300 µL/sample.
ii. Add 300 µL of the lytic mixture to seven 2.0 mL SC micro tubes PCR-PT.
iii. Add 250 µL of each member of the enriched LIM broth dilution panel.
iv. Incubate at 56 °C for 10 min at 1,400 rpm.
v. Load the reagents, consumables, and samples into the MagNA Pure 24 instrument and perform bacterial DNA extraction and nucleic acid isolation using the following specifications:
Extraction kit: MagNA Pure 24 Total DNA Isolation kit.
Extraction protocol: Pathogen 1000 3.1.
Sample type: Swab.
Sample volume: 500 µL (external lysate).
Elution volume: 50 µL.
2. Evaluate primer dimer formation and mispriming.
a. In a 1.5 mL SC micro tube PCR-PT, prepare a SYBR® green master (MMX) mix sufficient to analyze the seven dilution levels of the evaluation panel and one no-template control (NTC), each in triplicate (see the recipe for SYBR® Green master mix)
b. Gently homogenize by aspiration/dispensing with a pipette or using short pulses in a vortex mixer. Avoid foam formation.
c. Centrifuge briefly to collect the mixture at the bottom of the tube.
d. Dispense 15 µL of the MMX into a 96-well amplification plate from wells A1 to H3.
e. Add 5 µL of eluates from the evaluation panel and the NTC to the respective wells of the amplification plate.
Note: Three replicates per dilution level (including the NTC) should be used.
f. Seal the amplification plate with a MicroAmp® optical adhesive film.
g. Centrifuge the amplification plate at 2,576× g for 1 min at room temperature (18–25 °C).
h. Perform nucleic acid amplification and detection on the CFX96 Dx analyzer using the protocol presented in Table 4.
Table 4. iTaq Universal SYBR® green supermix standard protocol.
| Step | Temperature | Duration | No. of cycles | |
| Activation | 95 °C | 5 min | 1 | |
| Amplification/detection | 95 °C | 5 s | 45 | |
| 60 °C* | 30 s | |||
| Melting | 53–95 °C, 0.5 °C increments* | 2 s/step | 1 | |
In the CFX96 Dx analyzer, amplification is assumed to have the following minimum configuration: plate type, BR White; Scan mode, SYBR/FAM only.
i. Analyze the results.
i. Navigate to the Melt Curve tab on the results screen of the CFX Manager Dx software (Data Analysis).
ii. Visually assess the characteristics of the melting curves at all levels where the amplification has been recorded.
iii. Apply the acceptability criteria (see Data analysis 8) (Figure 6).
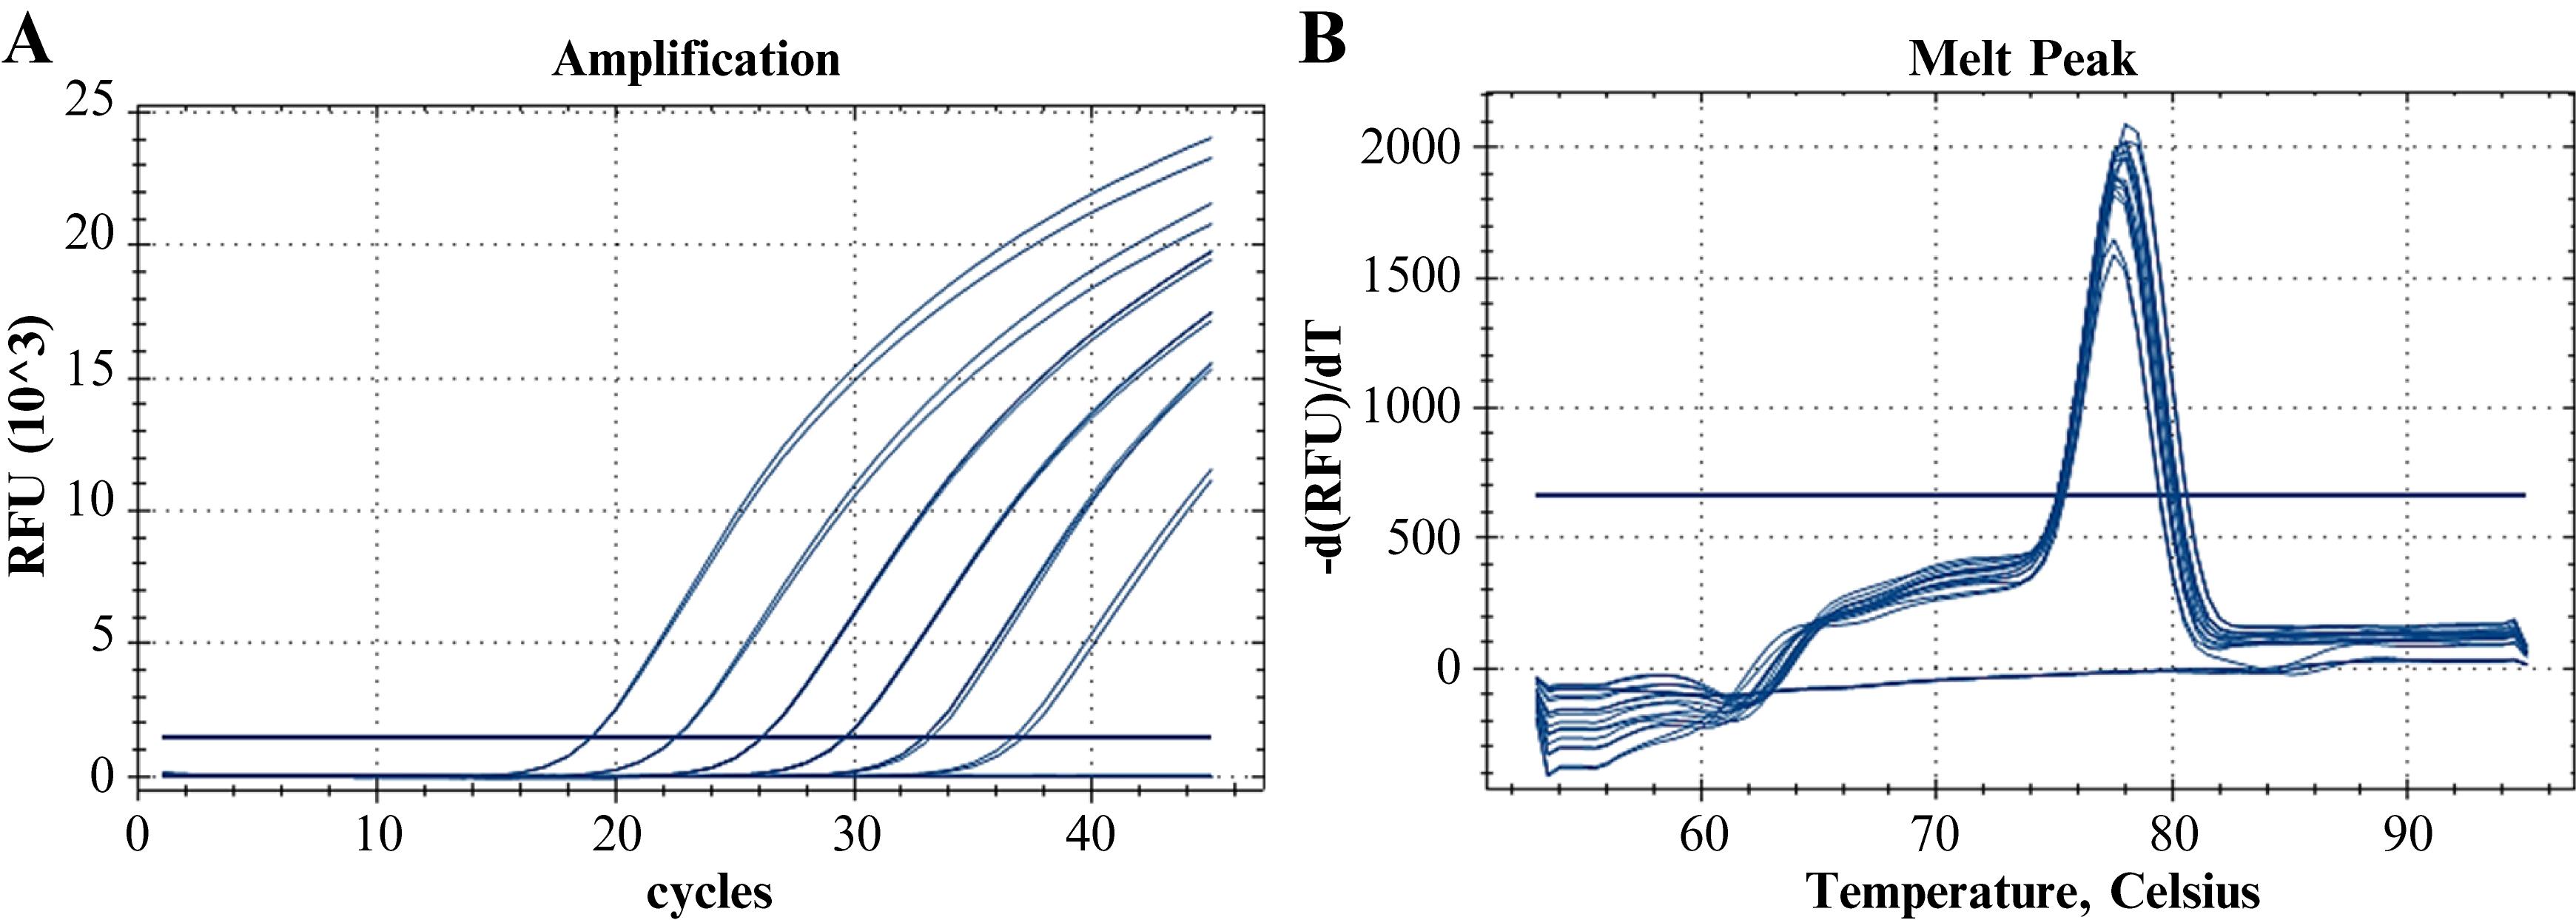
Figure 6. Melting analysis of the Group B Streptococcus (GBS) primer pair. A. Fluorescent amplification curves (SYBR® Green) for the dilution panel of the clinical/spiked specimen. B. Melting curves.
3. Evaluate the amplification efficiency (E) and multiplex compatibility (MPLXc) of the LDT.
a. In 1.5 mL SC micro tube PCR-PT tubes, prepare two PPRs using the optimized concentrations described in the oPPR recipe, which is based on the File S8 calculation template.
Notes:
1. One oPPR should contain the LDT-GBS monoplex assay only, while the other oPPR should contain all the assays that comprise the multiplex assay (LDT-GBS + IC-X detection assays). To prepare the oPPR of the monoplex assay, replace the oligonucleotide volumes of the IC-X detection assay with nuclease-free water.
2. Ensure that the volume of each oPPR is sufficient to analyze eight levels of the dilution panel of the UltramerTM duplex synthetic control, ideally in triplicate (minimum in duplicate).
b. Homogenize using short pulses in a vortex mixer. Next, centrifuge briefly to collect the mixture at the bottom of the tubes.
c. Follow steps D4f–o using each oPPR.
Note: Consider the following:
Resuspend 17 wells (16 + 1) of the Panther Fusion® Open AccessTM RNA/DNA enzyme cartridge with each prepared oPPR.
Each MMX (PPR-resuspended enzyme) may be distributed in a 96-well amplification plate following a 2-column × 8-row arrangement.
Add 5 µL of each member of the dilution panel of the UltramerTM duplex synthetic control (one level per row, from 2.41 × 10⁹ to 2.41 × 10² copies/mL) to all wells containing the MMX.
The rows represent the levels of the synthetic control’s dilution panel, and the columns correspond to the replicates/level.
d. Analyze the results.
i. Make a different subset for each MMX type (monoplex and multiplex).
ii. Adjust the fluorescence threshold to the midpoint of the linear phase (log scale) of the amplification curves (approximately 1000 RFU for GBS and 500 RFU for IC-X) (see General note 8).
iii. Plot the Ct values against the log of the nominal initial concentration (Ci) of each dilution [Log (Ci)] (Figure 7).
iv. Fit the point cloud to a curve with the general equation y = mx + n, where: y represents the Ct value, x represents the Log (Ci) value, m is the slope, and n is the y-axis intercept (linear regression) (Figure 7).
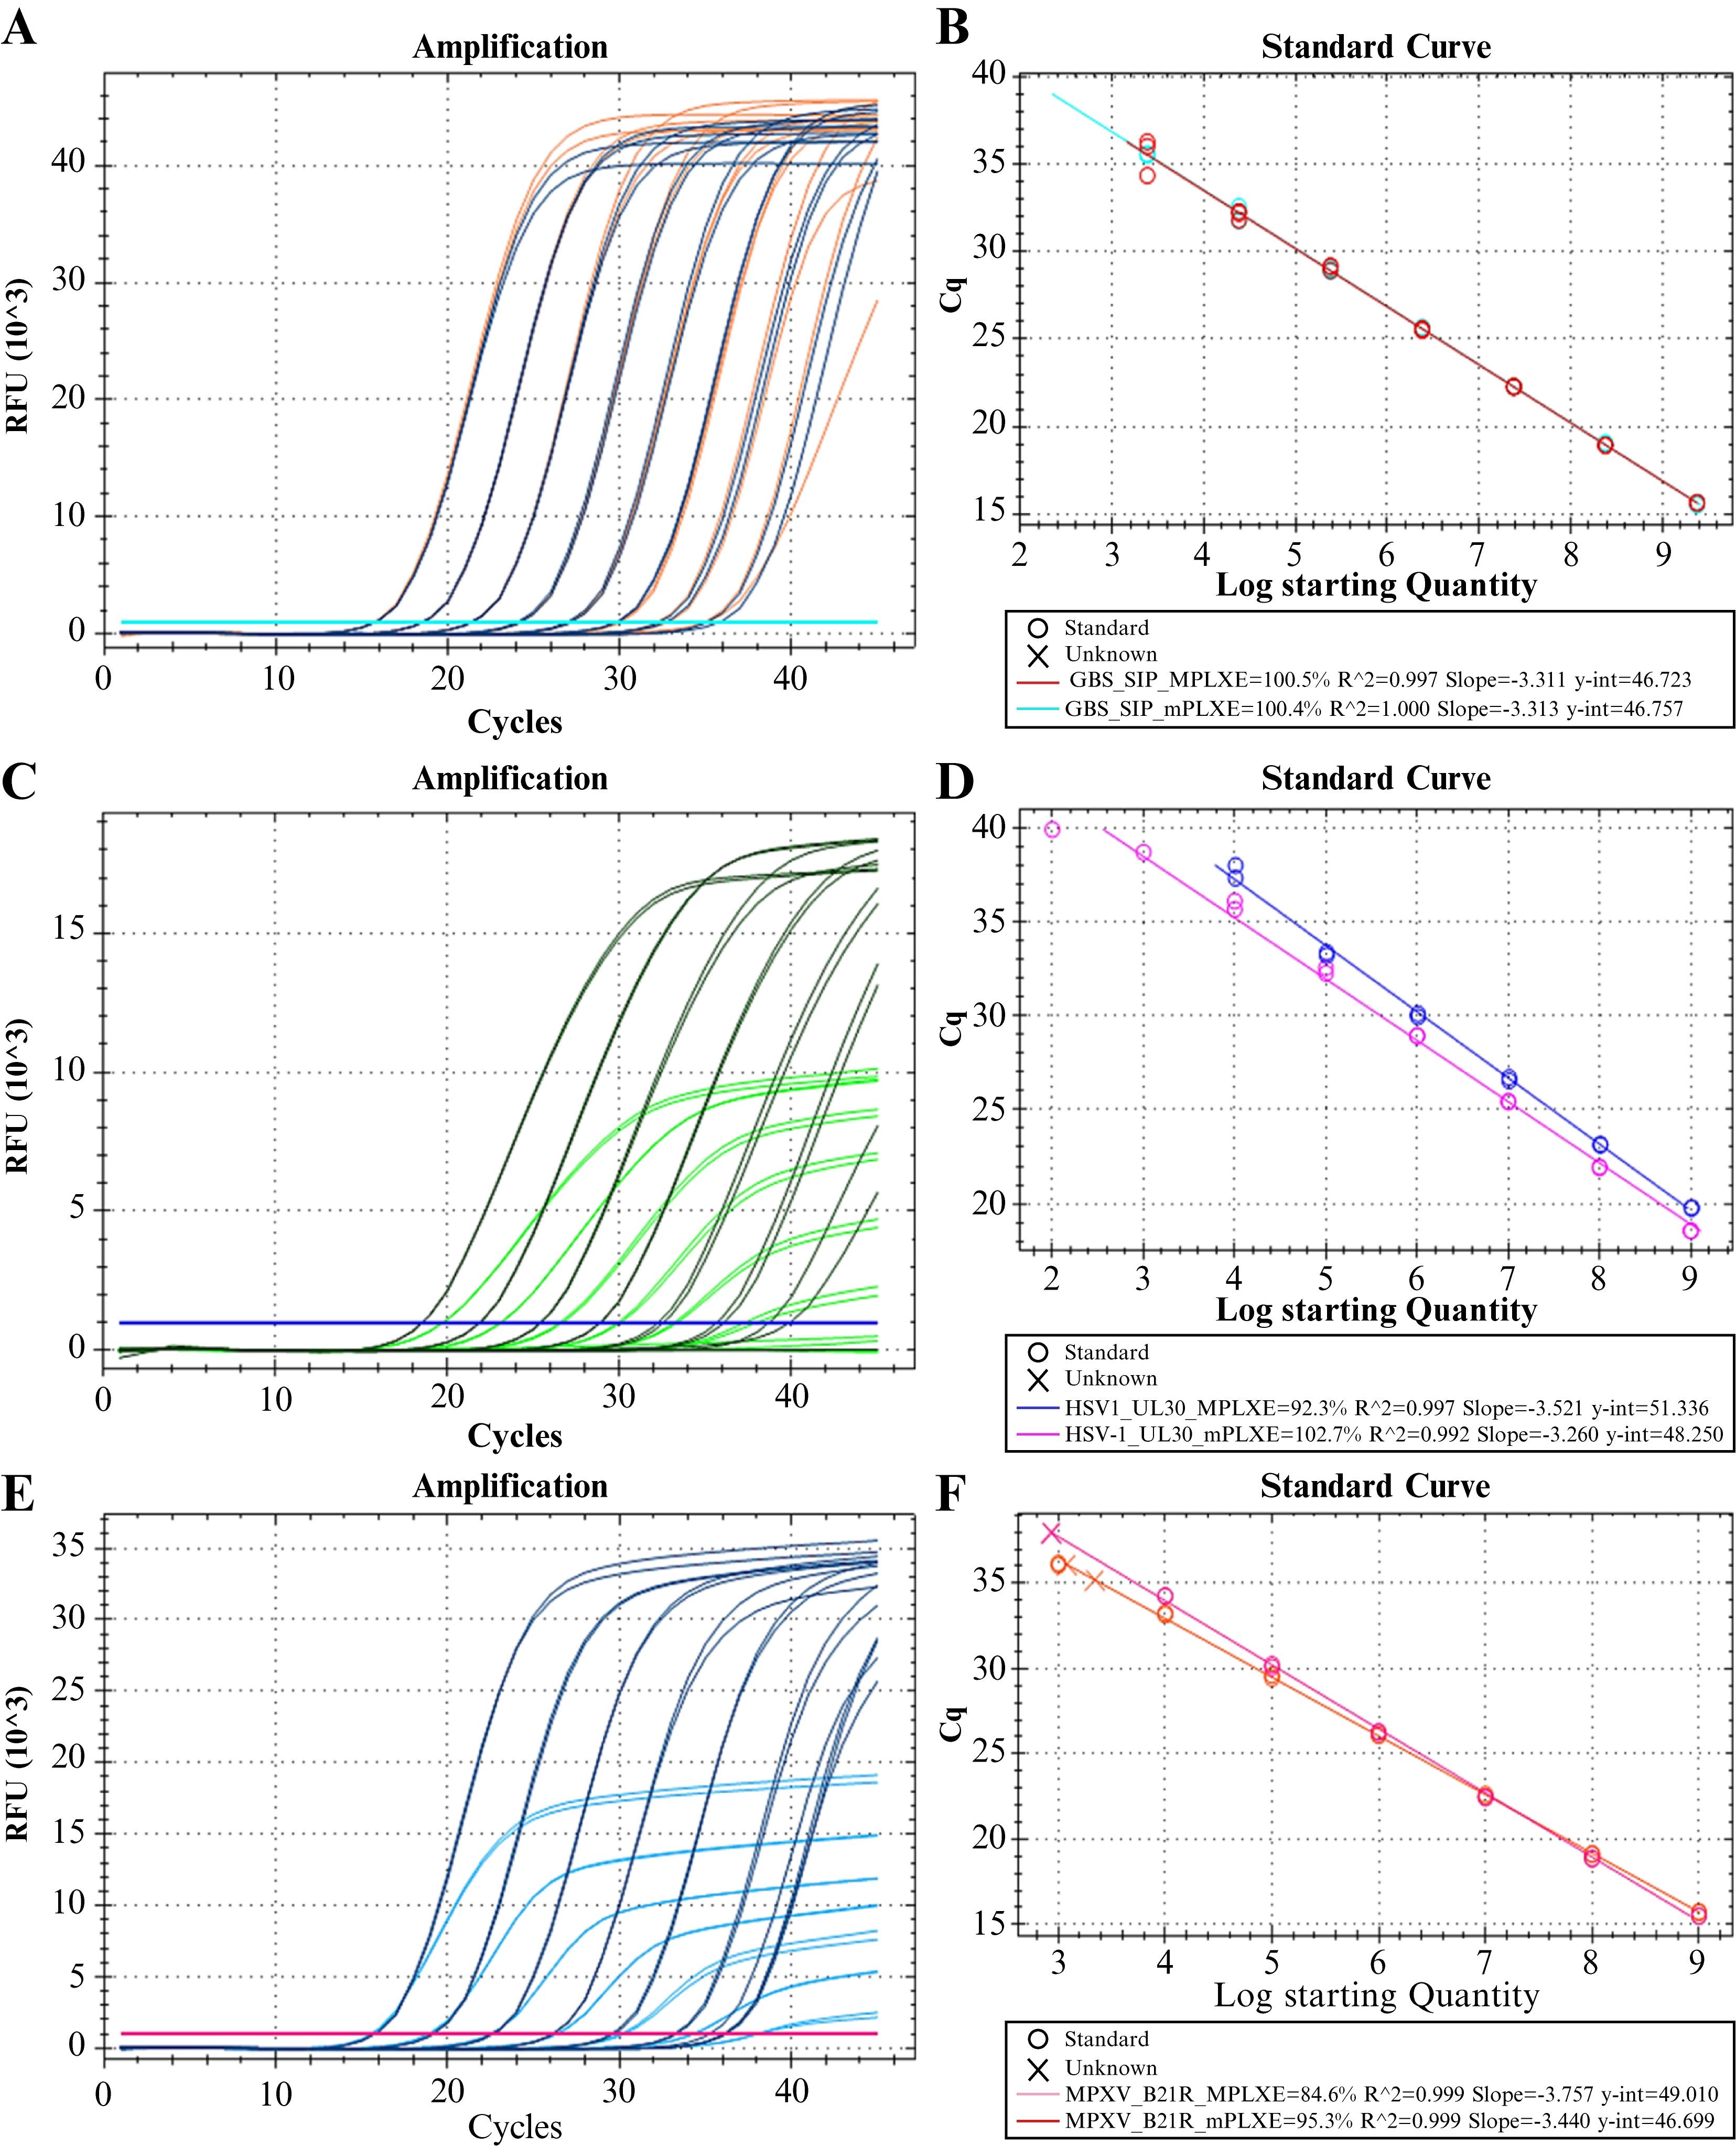
Figure 7. Evaluation of amplification efficiency and multiplex compatibility: representative results. A, B. Intended result for a laboratory-developed test (LDT) with high multiplex compatibility (Scenario 1). All predefined acceptability criteria for amplification efficiency and multiplex compatibility have been satisfied. C, D. Potential outcome for an LDT with low multiplex compatibility (Scenario 2). While the amplification efficiencies (E) of the monoplex and multiplex reactions meet the acceptability criteria (90% ≤ E ≤ 110%, R2 ≥ 0.98), the absolute Ct difference does not (|∆Ct| > 0.5). The sensitivity of the multiplex reaction may have been compromised, as no reactivity is observed at the lowest concentration level in comparison to the monoplex reaction. As the concentration of the target sequence decreases, the slopes of the linear phase and maximum fluorescence (Fmax) exhibit a corresponding decline. (E and F) Potential outcome for an LDT with low multiplex compatibility (Scenario 3). While the |∆Ct| value meets the acceptability criterion (|∆Ct| ≤ 0.5), the E of the multiplex reaction does not (E ≤ 90%). Similar to scenario 2, the sensitivity of the multiplex reaction is likely to be compromised because the reactivity at the lower concentrations is very low compared to the monoplex reaction. This can be attributed to the slope of the linear phase of the fluorescence curves, and thus, the Fmax, declines as the target sequence concentration decreases. The amplification curves of the molecular target from the UltramerTM duplex synthetic control dilution panel at nominal concentrations of 2.41 × 10–2.41 × 10 copies/mL are depicted in A, C, and E. Monoplex reactions are indicated in orange, green, and dark blue, while multiplex reactions are indicated in dark blue, green, and light blue. (B, D, and F) Graph of the Ct values vs. the log of the nominal initial concentration [Log (Ci)] of the UltramerTM duplex synthetic control (linear regression). The monoplex reaction fits (mPLX) are indicated in turquoise, lilac, and orange, while the multiplex reaction fits (MPLX) are depicted in red, purple, and pink. The E, R2, slope, and y-intercept of the best-fit line are described for each regression.
v. Using Equation 1, calculate the slope, goodness of fit (coefficient of determination, R2), and amplification efficiency (E) (Figure 7).
Note: The CFX96 Dx Analyzer is capable of automatically calculating the slope, R2, and E when an amplification assay is run in standard curve mode.
vi. Apply the acceptability criteria (see Data analysis 9) (Figure 7).
e. Repeat the amplification efficiency evaluation on the Panther Fusion® system.
Note: An assessment of MPLXc is not required. Consider the following:
Prepare a new dilution panel for the UltramerTM duplex synthetic control, using STM as the diluent. The panel should span nominal concentrations of 2.41 × 10⁹–2.41 × 10² copies/mL.
Each dilution level may be processed in triplicate (duplicate processing is acceptable as well) using the PCR protocol outlined in Table 2.
Analyze the results and apply the acceptability criteria listed in step E3d.
F. Analytical and clinical validation
The performance of an LDT must be established in a manner consistent with the procedures used by manufacturers to determine the performance of their commercial tests. During the validation phase, the performance characteristics are confirmed to meet the specified design input requirements and to ensure that the overall performance is consistent with the intended use. Specifically, the intended use of an LDT is supported by the underlying design and development stages and confirmed during the validation phase.
Note: The intended use was stated (during the design phase) as follows: screening for S. agalactiae colonization in pregnant women between 36 0/7 and 37 6/7 weeks’ gestation, using selectively enriched rectovaginal swabs.
While standards such as the ISO 15189, ISO 17025, ISO 9001, and the College of American Pathologists generally provide a framework that addresses only the “what,” CLSI guidelines outline unambiguous procedures in quantity and form, thus addressing the “how.” In conjunction with other published guidelines [27–33], the CLSI guidelines provide insight into the applicability or incorporation of qPCR-based LDTs in analytical and clinical evaluations. The parameters recommended for validating the analytical performance of an LDT include accuracy, precision, bias (trueness), measurement range, detection capability, analytical sensitivity and specificity, positive and negative percent agreement, and the stability of reagents and samples. To ascertain whether the target condition is present, the candidate test must be compared against a reference standard. Clinical performance studies evaluate diagnostic accuracy measures, including diagnostic sensitivity and specificity, predictive values, agreement percentages, and likelihood ratios, using patient samples. The clinical study samples must be subjected to analysis with the candidate test and evaluated in comparison with established diagnostic accuracy criteria. Two pivotal factors inform the robustness of clinical performance studies: the type of clinical specimen and the representativeness of the population sample size. The type of clinical specimen is contingent upon the intended use, whereas the population sample size is ideally derived from prior descriptive studies (see Data analysis 10).
Table 5 comprehensively lists the CLSI Evaluation Protocol (EP) documents pertinent to the validation phase of the Test Life Phases Model. These documents should be used alongside the CLSI EP19 when test developers validate performance claims for LDTs. The CLSI EP19 is a free-to-use, fundamental resource that assists test developers in identifying pertinent CLSI EP documents for establishing and implementing test methods using the Test Life Phases Model (design, development, validation, etc.).
Table 5. CLSI evaluation protocol documents
| Performance claim | CLSI documents |
| Precision | CLSI EP05 | Evaluation of Precision of Quantitative Measurement Procedures |
| CLSI EP12 | Evaluation of Qualitative, Binary Output Examination Performancea | |
| CLSI EP21 | Evaluation of Total Analytical Error for Quantitative Medical Laboratory Measurement Procedures | |
| Accuracy | CLSI EP09 | Measurement Procedure Comparison and Bias Estimation Using Patient Samples |
| CLSI EP12 | Evaluation of Qualitative, Binary Output Examination Performancea | |
| CLSI EP21 | Evaluation of Total Analytical Error for Quantitative Medical Laboratory Measurement Procedures | |
| Reportable interval | CLSI EP06 | Evaluation of Linearity of Quantitative Measurement Procedures |
| CLSI EP17 | Evaluation of Detection Capability for Clinical Laboratory Measurement Procedures | |
| CLSI EP34 | Establishing and Verifying an Extended Measuring Interval Through Specimen Dilution and Spiking | |
| Analytical sensitivity | CLSI EP17 | Evaluation of Detection Capability for Clinical Laboratory Measurement Procedures |
| Analytical specificity | CLSI EP07 | Interference Testing in Clinical Chemistry |
| CLSI EP37 | Supplemental Tables for Interference Testing in Clinical Chemistry | |
| Clinical validation | CLSI EP12 | Evaluation of Qualitative, Binary Output Examination Performancea |
| CLSI EP24 | Assessment of the Diagnostic Accuracy of Laboratory Tests Using Receiver Operating Characteristic Curves | |
| CLSI EP27 | Constructing and Interpreting an Error Grid for Quantitative Measurement Procedures | |
| Fundamental | CLSI EP19 | A Framework for Using the CLSI Documents to Evaluate Medical Laboratory Test Methods |
| CLSI QSRLDT | Quality System Regulations for Laboratory-Developed Tests | A Practical Guide for the Laboratory | |
| Total analytical error | CLSI EP21 | Evaluation of Total Analytical Error for Quantitative Medical Laboratory Measurement Procedures |
| Commutability or matrix effects | CLSI EP14 | Evaluation of Commutability of Processed Samples |
| CLSI EP30 | Characterization and Qualification of Commutable Reference Materials for Laboratory Medicine | |
| CLSI EP35 | Assessment of Equivalence or Suitability of Specimen Types for Medical Laboratory Measurement Procedures | |
| CLSI EP39 | A Hierarchical Approach to Selecting Surrogate Samples for the Evaluation of In vitro Medical Laboratory Tests | |
| Stability | CLSI EP25 | Evaluation of Stability of In Vitro Medical Laboratory Test Reagents |
| Quality control | CLSI EP23TM | Laboratory Quality Control Based on Risk Management |
| Risk management | CLSI EP18 | Risk Management Techniques to Identify and Control Laboratory Error Sources |
| CLSI EP23 | Laboratory Quality Control Based on Risk Management | |
| Supplementary documents | CLSI MM17 | A Verification and Validation of Multiplex Nucleic Acid Assays |
| CLSI MM19 | Establishing Molecular Testing in Clinical Laboratory Environments |
aProvides guidance specifically for qualitative test methods.
Taken and adapted from the Clinical and Laboratory Standards Institute (CLSI) [1,35].
Refer to General notes 8 and 11.
See the Analytical sensitivity, In vitro analytical specificity (cross-reactivity), and Clinical performance studies subsections in the corresponding (homonymous) section of File S9.
G. Test maintenance
The maintenance phase encompasses processes and procedures that are designed to ensure compliance with the developer’s performance claims and acceptable criteria. The procedures include routine quality control, periodic calibration and calibration verification, equipment maintenance, environmental monitoring, proficiency testing, and other measures, as applicable. In this phase, the end-users are responsible for gathering data regarding the quality, performance, and safety of the test method in question.
Table 6 lists the CLSI documents pertinent to the maintenance phase of the Test Life Phases Model.
Table 6. CLSI maintenance phase documents
| Performance claim | CLSI documents |
| Quality control | CLSI EP23TM | Laboratory Quality Control Based on Risk Management |
| CLSI EP26-A | User Evaluation of Between-Reagent Lot Variation | |
| CLSI EP31-A | Verification of Comparability of Patient Results Within One Health Care System | |
| Risk management | CLSI EP18 | Risk Management Techniques to Identify and Control Laboratory Error Sources |
| CLSI EP23 | Laboratory Quality Control Based on Risk Management |
See the Preparation of LDT quality controls (QC) subsection in the corresponding (homonymous) section of File S9.
Data analysis
1. The proposed primer and probe set should meet the following criteria: amplicon length, melting temperature (Tm), primer and probe length, GC content, self-complementary, primer-dimer and hairpin formation, degree of degeneracy, 5' end stability, 3' end specificity, and mispriming. The assessment of the quality of the primer and probe sets is implicit in the search parameterization of the Oligo software v7.60. In principle, the highest-quality sets will be assigned a high score. A high score indicates that the identified oligonucleotides can meet the desired thermodynamic variables. Owing to the inherent variability in the robustness of thermodynamic property estimates for oligonucleotides, third-party bioinformatics tools such as OligoAnalyzerTM and BenchlingTM may be used. During the analysis, recommendations of the bioinformatics tool manufacturers may be followed, and the following acceptance criteria should at least be considered: (i) Hairpin: ΔG > –2.0 kcal/mol and/or Tm < Ta – 10 °C; (ii) self- and hetero-dimer: ΔG > –9.0 kcal/mol (internal dimer); and (iii) 3'-end dimer: ΔG > –6.5 kcal/mol. These criteria enhance the sensitivity of the test. Additional criteria specific to the Oligo software v7.60, including Internal Stability of the oligonucleotides, Sequence Frequency, and Max. Acceptable False Priming Efficiency (Figure 3), generally determine the specificity of the test. The Oligo software v7.60 is equipped with a “lock icon” feature, which indicates whether adjustments to a thermodynamic variable are mandatory (Figure 3). Noncompliance with any of the established acceptability criteria has been proven to increase the probability of suboptimal LDT performance, and in some cases, may necessitate the discarding of the designated design. Selected oligosets that exhibit violations of the established acceptability criteria should undergo in vitro evaluation. The criteria for primer and probe design have previously been described in detail [32,36,37].
Additionally, other software can be used for the design and in silico evaluation of oligonucleotide quality. These include Primer 3 (Whitehead Institute for Biomedical Research), Primer3Plus (Whitehead Institute for Biomedical Research), PrimerQuest Tool (IDT), QuikChange Primer Design Program (Agilent), Primer Express (Applied Biosystems), Primer-BLAST (NCBI), RealTimeDesign (LGC Biosearch Technologies), qPCR Primer & Probe Design Tool (Eurofins Genomics), Real-time PCR (TaqMan) Primer and Probes Design Tool (GenScript), FastPCR (PrimerDigital), Primer Premier (PREMIER Biosoft), and Visual OMP (DNA Software). Notably, certain bioinformatics tools, including PerlPrimer, Oligo Analysis Tool (Eurofins Genomics), and Visual OMP (DNA Software), are capable of calculating primer parameter values. A compendium of additional bioinformatics tools, meticulously categorized utility-wise, can be found in the works of Guo et al. [36] and Rodriguez et al. [37].
2. The selected oligonucleotide sequences are expected to have high homology with the target region or sequence of the S. agalactiae sip gene stored in the database. For 100% coverage, high-homology sequences are defined as those with a percentage of identity ≥95% and an expectation value (E-value) ≤10–2 [37].
3. The selected oligo sequences are expected to have low homology with non–S. agalactiae sequences. Low homology, and consequently, a low probability of cross-reactivity, is defined as an E-value >10–2, regardless of the coverage or percentage of identity values.
4. The in silico PCR analysis tool, MFEprimer, enables the assessment of the potential for nonspecific amplification of primers in a background rich in human DNA. Moreover, the tool concurrently assesses the potential for hairpin and dimer formation by the primers. The configuration of the analysis parameters should be aligned with the predicted thermodynamic properties of the oligonucleotides. In this study, the parameters included the Background Database, UCSC - Homo sapiens - hg38 – Genome; Allow mismatch at the 3' end, No (default); Tm min, 50 °C (minimum Tm required for binding stability between the primer and its binding sites: Ta – 10 °C); Concentration of divalent cations (usually MgCl2), 3.0 mM; Annealing oligo concentration, 600 nM (optimized primer concentration). The primers will not amplify background human DNA, resulting in no potential amplicons. If the MFEprimer identifies a potential risk of nonspecific amplification of human DNA, the amplicon size must be a minimum of 1,000 base pairs for the primer set to be deemed acceptable.
5. The inclusivity evaluation of the LDT oligonucleotide sets is a means of estimating the risk of false negatives due to mutation-induced amplification failure in the primer and probe binding sites. The bioinformatics tool SCREENED v1.0 (Sciensano Galaxy External) enables the theoretical production of amplicons and subsequent clustering analysis, thus allowing the estimation of the design coverage percentage and the target sequence conservation degree. A result is classified as a false negative if at least one of the following conditions is met: a) at least one mutation exists in the first five nucleotides of the 3' binding site of any oligonucleotide (primer or probe) of the LDT, and b) the total number of mutations in the binding site of any oligonucleotide exceeds 10% of its nucleotide length. The estimation of design coverage percentage (inclusivity) and the target sequence conservation degree (clustering) relies on the Inclusivity Calculator_LDT GBS sip.xlsx template (File S4). In silico inclusivity is deemed acceptable when the design or assay coverage percentage is ≥97%. Similarly, the target sequence conservation degree is considered acceptable when the sequences of the three most frequent amplicon clusters account for at least 90% of the analyzed sequences.
Notes:
1. The decision to remove redundant sequences can be conditional on the number of clinical isolate sequences recovered and the level at which it is appropriate to estimate inclusivity. The higher the number of sequences, the lower the negative impact of removing redundancies on inclusivity. Generally speaking, the lower the number of redundant sequences, the more stringent the estimation will be.
2. Inclusivity can be estimated and analyzed at different taxonomic and epidemiological (geography and time) levels, depending on the intended use of the LDT. Estimates derived from nonredundant sequences and those with collection dates covering a wide period of time acquire a genotypic character down to the variant level, where epidemiology may not contribute significantly. Conversely, inclusivity derived from sequences with redundancies, from local or regional clinical isolates, and with collection times more proximate to the present assumes a more epidemiological value.
6. Regarding the analysis of optimal physicochemical conditions, statistical methods can be used, though not strictly necessarily; a simple inspection is usually sufficient. Regarding the detection assay targeting the S. agalactiae sequence, selection and rejection criteria are based on identifying fluorescent amplification curves (traceable to the evaluated conditions and their combinations) that exhibit signs of optimal performance within certain limits. The optimal curves (exhibiting superior amplification dynamics) and the conditions that enable them are as follows: a) Ct values do not exhibit a significant difference (∆Ct) from the minimum trending Ct value (Ct min) of the experiment; b) amplification efficiencies, defined as the slopes of the linear zone of the amplification curves on the linear scale of the cumulative fluorescence vs. cycles graph, are observed to be maximum (steepest curves); and c) maximum fluorescence (Fmax, plateau phase) is found to be higher (criterion dispensable in some scenarios) [37]. Conversely, suboptimal reaction conditions are preferred for the internal control detection assay. These conditions or combinations result in amplification curves with the following: a) Ct values that differ significantly (∆Ct) from the experimental Ct min, and b) amplification efficiencies that deviate from the maximum slope and tend toward or equal the minimum slope. The robustness and efficiency of the internal control as an inhibition and process control will depend on the differences between the optimal and selected suboptimal physicochemical conditions.
Note: A difference is considered nonsignificant for ∆Ct = Ct – Ct min ≤ 0.5, and significant otherwise.
6. To facilitate the analysis of the verification results pertaining to the activation, denaturation, and annealing/elongation times, the fluorescence data (per cycle and replicate) recorded by the CFX96 Dx thermocycler must be copied or exported. The data should subsequently be imported into a Microsoft Excel worksheet, where a graph of RFU (y-axis) vs. amplification cycles (x-axis) should be constructed. All amplification datasets must be included on a single graph. The application of selection and rejection criteria should be based on the data represented in the graph.
7. The occurrence of primer dimers and mispriming can be attributed to the lack of stringent oligonucleotide design. Although in silico thermodynamic estimates can accurately predict the physicochemical properties of oligonucleotides and, consequently, their propensity for mispriming and dimerization, an in vitro evaluation may be conducted. The specificity of the design can be evaluated through a DNA melting experiment. Primer dimers typically manifest as peaks with a Tm lower than that of the amplicon in a –d(RFU)/dT vs. temperature (°C) graph, though only in wells lacking a DNA template, which serves as a no-template control (NTC). Mispriming frequently results in the production of nonspecific products of varying sizes, manifesting as peaks with distinct Tm values that differ from those of the amplicon. All LDT assays will be deemed free of primer dimers, mispriming, or secondary targets when a DNA melting experiment yields a single, relatively narrow, and symmetrical peak at the amplicon's Tm in a –d(RFU)/dT vs. temperature (°C) graph. Notably, a discrepancy of up to 5 °C can be observed between the amplicon’s experimental and theoretical Tm values.
When using SYBR® Green chemistry or other double-stranded DNA-binding dyes, gel electrophoresis analysis must be used to confirm the absence of reaction artifacts, as it provides higher resolution than melting curve analysis. Only a PCR product of the expected size should be visualized on the gel; nonspecific products should not be visualized. Furthermore, to ensure accurate verification of amplification, the specific PCR product should be sequenced and compared with published sequences in GenBank, as previously described [37]. The aforementioned analyses were not conducted during the development of our LDT.
8. Amplification efficiency (E) is frequently employed to assess the efficacy of qPCR oligonucleotide design and the optimization of physicochemical conditions in an LDT. The calculation of E is always accompanied by a linear regression analysis and a calculation of the goodness of fit (R2). Typically, an E value between 90% and 110% and an R2-value ≥ 0.98 are indicative of successful design and optimization. However, multiplex compatibility, which is typically evaluated through an experimental design analogous to that used for the amplification efficiency, albeit in a comparative manner (monoplex vs. multiplex reactions), provides a means of assessing the risk of false negatives resulting from interference between oligonucleotides from different assays that are co-amplified in the same reaction volume (multiplex reaction). To assess the multiplex compatibility of a specific assay, variations in the E, R2, Ct values, slope of the linear phase of the amplification curves (in the linear scale of the fluorescence graph), and maximum fluorescence (Fmax) in the multiplex reaction should be considered in comparison with the monoplex reaction. A design is considered compatible with a multiplex amplification arrangement (i.e., simultaneous amplification of the S. agalactiae target sequence and IC-X) if the following criteria are met in the multiplex reaction: a) 90% ≤ E ≤ 110% and R2 ≥ 0.98; b) the absolute value of the mean difference between the Ct values of fluorescence amplification curves in monoplex and multiplex reactions must not exceed 0.5 (|∆Ct| ≤ 0.5); and c) no indications of significantly compromised sensitivity in the multiplex reaction, such as amplification failure or inefficient amplification, should be present.
Note: Inefficient amplification is evidenced by a gradual decline in the slope of the linear phase and in the Fmax of the fluorescence amplification curves depicted on a linear scale of an RFU vs. cycle graph as the concentration of the molecular target decreases (Figure 7). Inefficient amplification suggests the occurrence of interference between assays in the multiplex reaction.
9. To determine the minimum population sample size required for clinical performance studies, the Estimate proportion (random sampling & perfect diagnostic) option in the WinEpi 2.0 web application (http://www.winepi.net/winepi2/f102.php) can be used. To perform this calculation, a confidence level of 95%, an acceptable error (desired precision) of 5%–10%, an unknown population size, and an expected prevalence based on recent descriptive studies conducted in the geographical region of interest should be considered. In the absence of available prevalence data, an unknown expected prevalence should be used [24].
Validation of protocol
This protocol, or parts of it, has been used and validated in the following research article:
Caballero et al. [25]. Development and performance evaluation of a qPCR-based assay for the fully automated detection of group B Streptococcus (GBS) on the Panther Fusion Open Access system. Microbiol Spectr (Figures 1–3; Figure S3).
General notes and troubleshooting
General notes
1. According to the CLSI, all test methods can be described using the Test Life Phases Model. The model delineates two principal stages in the evaluation of test methods: an initial establishment stage (developer-driven) and a subsequent implementation stage (end-user-driven). Both stages comprise successive phases that advance pursuant to the fulfillment of the acceptance criteria of the preceding phase. In the establishment stage, the developer determines and validates the performance characteristics of the test method. In contrast, in the implementation stage, the end-user (typically the laboratory) verifies the developer-established performance characteristics, implements the test method for routine laboratory use, and ensures its maintenance until its retirement. During the development phase, the test method progresses from an initial concept to a fully-fledged, tangible solution. Its constituent components are subjected to iterative testing and optimization. On completion, the test method is “frozen” in the design, thereby ensuring no further changes. In LDTs, the laboratory is both the developer and end-user; hence, certain tasks performed in some of the phases may be located in a different stage or phase, such as those of preliminary evaluation, or even absent, such as verification, which overlaps with analytical and clinical validation.
The Test Life Phases Model requires each evaluation study to commence with a written plan that includes at least a comprehensive experimental design and specific acceptance criteria for evaluating the results. In certain cases, such as at the beginning of the establishment stage for a novel test method, decisions may be based on less definitive or subjective criteria. However, for evaluations conducted during later phases, such as analytical and clinical validation, more definitive and quantitative or objective criteria are required. The conclusion of each phase in the Test Life Phases Model requires deciding whether to terminate, proceed to the subsequent phase, or extend the current phase. This decision-making involves comparing the results of the evaluation study to the predefined acceptance criteria.
The Procedure section provides a procedural framework for the development phase of the establishment stage. The remaining phases are beyond the scope of the present work; however, recommendations for the analytical and clinical validation and maintenance of the LDT have been delineated. The procedures and recommendations described herein comply with the Minimum Information for Publication of Quantitative Real-Time PCR Experiments [38] and Standards for Reporting Diagnostic Accuracy Studies [39] guidelines. Additionally, they incorporate previously published recommendations as well as the latest updates for the development and validation of qPCR-based tests [26–32].
Note: The distinction between the analytical and clinical validation of the LDT and the validation of this protocol must be noted. The former is an indispensable element of the latter.
2. While the instructions in this protocol are designed to facilitate the development of a qPCR-based test for detecting S. agalactiae, the underlying principles are applicable to mono-target detection designs for a range of pathogens, particularly bacteria. The present work does not address multiplex target designs for the simultaneous detection of pathogens. The development of such designs may require the use of more robust bioinformatics software, tools, and analytical methods other than those described herein.
3. In a PCR amplification protocol, the activation time and temperature are typically determined by the biochemical properties of the DNA polymerase. However, the temperatures and times required for denaturation and annealing/elongation are primarily dependent on the amplicon size, GC content, and Tm of the oligonucleotides. If the amplicon size and GC content do not exceed 150 nt and 80%, respectively, and the primers’ Tm is not more than the theoretical Ta + 5 °C, the activation, denaturation, and annealing/elongation variables should follow the enzyme manufacturer’s specifications. The standard DNA amplification protocol for the Panther Fusion®’s Open AccessTM ensures that amplification times do not exceed 55 min. Alterations in the number of cycles as well as in the time and temperature of annealing could significantly increase the risk of exceeding the critical time, which is not permissible because the system operates on a continuous and random loading basis. In other words, the platform ensures continuous sample processing in batches of five, delivering results within a 2.5 h timeframe and at 5 min intervals [3]. Therefore, parameters that ensure optimal performance conditions of the LDT oligonucleotides during the design phase should be established.
4. All results obtained from in silico evaluations of specificity (exclusivity and inclusivity) must be confirmed in vitro during analytical validation, particularly for biological entities that do not meet the established acceptability criteria and are biologically or clinically related to humans or the target pathogen (S. agalactiae) of the LDT.
5. The protocol for the optimization of physicochemical conditions uses a commercially available lyophilized formulation of polymerase enzymes: the Panther Fusion® Open AccessTM RNA/DNA enzyme cartridge. This formulation is meant for immediate use, and the reconstitution volume is exclusively managed by the Panther Fusion® system, eliminating the possibility of adjustments. Therefore, the polymerase enzyme concentration in the reaction mixture need not be optimized. The enzyme manufacturer has guaranteed optimal performance when a reconstitution solution volume of 20 µL for PPR and a DNA/RNA template volume of 5 µL (total reaction volume of 25 µL) are used.
The protocol delineated hereinafter is applicable to all assays that comprise the LDT: S. agalactiae and IC-X (Hologic) detection assays. The physicochemical conditions under which the amplification reaction of the LDT occurs are determined by the optimal performance conditions of the detection assay for the S. agalactiae molecular target. These conditions should create a competitive disadvantage for the amplification of the IC-X. Specifically, the IC-X must amplify efficiently enough to be detected when the S. agalactiae molecular target is absent or present at low concentrations; however, it should not be detected, or may be inefficiently detected at least, under unfavorable amplification conditions, in the presence of inhibitors or abundant amounts of the S. agalactiae molecular target in the reaction mixture.
The IC-X detection assay protocol addresses only the optimization of the primer mix and probe concentrations. These were set at a combination of suboptimal concentrations to favor amplification of the S. agalactiae molecular target (see the recipe for the PPR for optimizing MgCl2 and KCl concentrations).
6. To optimize the physicochemical conditions of the LDT, at least a synthetic amplification control that contains the target sequence of the assay is required. The synthetic controls may comprise DNA and include a minimum of 20 bases of upstream and downstream flanking sequences in relation to the target sequence. Plasmid constructs and oligonucleotides of up to 200 base pairs, purified via standard desalting, are suitable controls [Duplexed UltramerTM DNA Oligos tools (IDT), https://www.idtdna.com/].
7. The optimization of the physicochemical conditions of the LDT may require the evaluation of multiple versions of the same assay; specifically, more than one oligonucleotide set targeting the same or a different region. Refraining from adhering to the Current Good Manufacturing Practices (cGMP) directives for oligonucleotide synthesis is a cost-effective strategy for this stage. The use of enzymatic synthesis and standard desalting as a purification method for primers is often sufficient to ensure the effectiveness of optimization experiments.
8. The Ct threshold value must be situated within the exponential growth phase of the fluorescent amplification curves. This value is determined based on the analytical and clinical performance criteria defined by the intended use during the design phase. As an initial approximation, the Ct threshold can be identified at the midpoint of the linear region (exponential growth, between the background and the maximum fluorescence) of the fluorescent amplification curves in the log scale view. During the evaluation of analytical sensitivity (analytical validation) and cutoff determination (clinical validation), along with adjustments to the Ct threshold, if necessary, certain built-in protocol controls may be defined. These include: i) positivity criteria (minimum slope at the threshold and maximum Ct), ii) channel validity criteria (minimum fluorescence, maximum background fluorescence, and lowest valid Ct), and iii) sample validity criteria (make IC valid if any other channel is positive). For further details regarding the Panther Fusion® Open AccessTM PCR protocol, refer to the supplementary material in LDT-GBS myAccess Protocol, spectrum.00057-24-s0001.pdf, accessible via https://journals.asm.org/doi/10.1128/spectrum.00057-24 [25].
The built-in protocol controls may be statistically defined. Such controls enhance the reliability of results by detecting real-time out-of-control situations related to reagents and instruments, including degradation, instrumental, or preparation errors. Any adjustments to the built-in protocol controls should be accompanied by a re-analysis of the established performance parameters. Performance parameters must be set only after all built-in protocol controls have been defined and entrenched.
In our LDT, adjustments to mitigate inter-channel interference (crosstalk) in the Panther Fusion® detection instrument are not required. The emission/absorption wavelengths of the TaqMan probe fluorophores for sequence targets of the S. agalactiae (FAM) and IC-X (Quasar 705) are sufficiently distant to prevent interference.
9. Parameters such as activation and denaturation times and temperatures and annealing/elongation times are critical to ensure optimal performance. If the evaluation range for these parameters is too narrow due to the risk of exceeding the critical amplification time of 55 min on the Panther Fusion® system, the enzyme manufacturer's recommendations (standardized in the amplification protocol) should at least be verified.
10. The selective enrichment of rectovaginal swab specimens is conducted as follows:
a. Place the swab in 5 mL of LIM broth.
b. Incubate at 37 °C for 18–24 h under aerobic conditions.
c. Extract and isolate nucleic acids immediately.
11. LDT oligonucleotides used during analytical and clinical validation must be manufactured according to the in vitro diagnostic directives (cGMP). At a minimum, synthesis should use template-independent methods (non-enzymatic methods), and purification should ensure at least 85% purity. This may be achieved, for example, via reverse-phase HPLC (RP-HPLC) or anion exchange coupled with reverse-phase HPLC (dual-HPLC). The final quality control specifications for custom-synthesized oligonucleotides must ensure that the observed mass is within ± 0.1% of the theoretical mass, as determined by electrospray mass spectrometry.
Troubleshooting
Problem 1: During the in silico specificity evaluation phase, the following potential issues are identified: a) a high risk of false negatives due to suboptimal homology of one or more oligonucleotides with the target sequence; b) a high risk of false positives due to significant homology of one or more oligonucleotides with sequences of biologically and clinically related pathogens; c) a high risk of false positives due to significant homology of one or more oligonucleotides with human DNA sequences; or d) a high risk of false negatives due to suboptimal design coverage.
Possible cause: The target sequence contains highly repetitive sequences in the human genome located at or near the 3' ends of the oligonucleotides. The target sequence is not exclusive to the pathogen or species for which the design is intended. The target sequence excludes the pathogen or species, though it introduces variability across variants and strains of the same pathogen (low inclusivity).
Solution: Perform an experimental evaluation of any in silico violations of design specificity that may have occurred. If a specificity failure is confirmed via experimental means, select an alternative target sequence and undertake a redesign of the assay (primer and probe set).
Problem 2: The design exhibits suboptimal robustness, manifesting as narrow ranges of optimal physicochemical conditions. These include temperatures, times (in the amplification protocol), and concentrations of the oligos and additives.
Possible cause: Inaccuracy of bioinformatics tools in estimating and predicting the thermodynamic variables of the oligos. Improper target sequence selection, low oligo stability (particularly at the 5' and 3' ends), suboptimal GC content, or mutations in the oligo hybridization sites.
Solution: Redesign the assay: a) increase oligo size to improve GC content, Tm, and stability; and b) add degenerate nucleotides to enhance design coverage in cases of mutations in the target sequence. If the issue persists, select another target sequence and redesign the assay.
Problem 3: During the in vitro specificity evaluation phase, the following potential issues are identified: a) a broad, smaller peak with a lower Tm than the expected amplicon Tm appearing exclusively in NTC wells; or b) a broad, smaller peak with a lower Tm than the expected amplicon Tm appearing exclusively in wells containing DNA templates.
Possible cause: a) Primer-dimers; b) mispriming (secondary target).
Solution: Modify reaction conditions: a) perform amplification and fluorescence acquisition at a Ta higher than the artifact’s Tm and lower than the expected amplicon’s Tm; b) reduce primer and probe concentrations; c) reduce Mg2+ concentration; d) increase K+ concentration; and/or e) consider other qPCR-compatible additives. If the problem persists, redesign the assay.
Problem 4: The amplification efficiency (E) falls outside the 90%–110% range.
Possible cause: E < 90%: Suboptimal physicochemical reaction conditions or mispriming (secondary target).
E > 110%: Primer-dimer formation.
Solution: Reoptimize the physicochemical conditions of the amplification reaction (primer, probe, and additive concentrations; temperatures and times). If the issue persists, consider gel electrophoresis and sequencing analysis to re-evaluate the in vitro specificity of the design. If the problem persists, redesign the assay.
Problem 5: The coefficient of determination (R2) for the amplification efficiency evaluation assay is <0.98.
Possible cause: Nonlinear behavior in the Ct vs. Log (Ci) graph, which is typically caused by variations in E across the dynamic range, is often the result of mispriming between any of the oligonucleotides and the assay's amplicon.
Solution: Refer to the solution for Problem 3.
Problem 6: A notable deficiency in multiplex compatibility between the S. agalactia and IC-X detection assays.
Possible cause: Formation of heterodimers between oligonucleotides from both assays or mispriming between oligonucleotides from the S. agalactiae detection assay and the IC-X DNA sequence or its amplicon may be a contributing factor.
Solution: Refer to the solution for Problem 3.
Problem 7: Design, methodology (qPCR), and instrumentation-related issues.
Possible cause: The qPCR troubleshooting guides provided by the manufacturers of the reagents and instruments should be consulted. Examples of such guides can be found at the following links:
Nolan, et al. [32]: https://www.gene-quantification.de/national-measurement-system-qpcr-guide.pdf
https://azurebiosystems.com/wp-content/uploads/2021/09/Azure-qPCR-troubleshooting-flyer_20210819.pdf
https://blog.biosearchtech.com/thebiosearchtechblog/bid/63622/qpcr-troubleshooting
https://www.thermofisher.com/do/en/home/global/forms/qpcr-handbook-troubleshoot-form.html
https://info.abmgood.com/polymerase-chain-reaction-pcr-qpcr-troubleshooting
Solution: Refer to the aforementioned guides.
Supplementary information
The following supporting information can be downloaded here:
File S1. Conserved Region Analysis_BioEdit.txt
File S2. Positional Nucleotide Numerical Summary_BioEdit.txt
File S3. Entropy & coverage analysis_BioEdit.xlsx
File S4. Inclusivity calculator_LDT GBS sip.xlsx
File S5. Two-Components Optimization Template.xlsx
File S6. One-Component Optimization Template.xlsx
File S7. PPR Preparation Worksheet (General).xlsx
File S8. PPR Preparation Worksheet (for AE & MPLX Compatibility Evaluation).xlsm
File S9. Supplementary protocols for validation_LDT GBS.docx
Table S3. Microorganisms whose sequences were employed for the in silico cross-reactivity (specificity) evaluation of the primers and probe used in the LDT-GBS assay, located in the file Supplemental material - spectrum.00057-24-s0002.docx, available at https://journals.asm.org/doi/10.1128/spectrum.00057-24 [25].
Table S4. Pathogens used in the evaluation of the analytical specificity (cross-reactivity) of the LDT-GBS assay, located in the file Supplemental material - spectrum.00057-24-s0002.docx, available at https://journals.asm.org/doi/10.1128/spectrum.00057-24 [25].
Acknowledgments
Conceptualization, A.C.M.; Data curation, R.A.R.R., M.E.A.B., and E.P.B.; Formal analysis, A.C.M.; Investigation, R.A.R.R., M.E.A.B., M.N.S.O., N.J.P.S., J.C.B.L., and A.C.M.; Methodology, A.C.M.; Project administration, A.C.M.; Funding acquisition, A.C.M.; Supervision, N.J.P.S.; Visualization, A.C.M.; Writing—original draft, R.A.R.R., M.E.A.B., D.M.C.G., M.N.S.O., and A.C.M.; Writing—review & editing; A.C.M. All the authors critically reviewed the manuscript.
This protocol did not receive any specific funding from public, commercial, or not-for-profit agencies.
This protocol was developed and used by researchers from the Research and Development (R&D) Group of the Molecular Biology Department at Referencia Laboratorio Clínico to generate the data and results reported in Microbiology Spectrum (Caballero Méndez et al. [25], https://doi.org/10.1128/spectrum.00057-24).
The content of this document reflects the authors’ views and does not necessarily represent those of Referencia Laboratorio Clínico. The clinical laboratory and its directors had no role in the study’s design, development, data collection, interpretation, or the decision to submit the work for publication. The use of trade names is solely for identification purposes and does not imply endorsement by the clinical laboratory or any government or regulatory authority.
The authors express their profound gratitude for the resources made available and for the exceptional interest of the Executive Directorate of the clinical laboratory, headed by Patricia León, Mark Kelly, and Priscilla Kelly, in terms of research, innovation, and development to provide molecular tests to the Dominican community tailored to their socioeconomic and epidemiological context.
We thank Editage (https://www.editage.com/) for the assistance with English-language editing.
Competing interests
The authors declare no competing interests.
Ethical considerations
Specimens collected for the purpose of clinical validation conformed to the confidentiality and informed consent policies of the Referencia Laboratorio Clínico. All patients consented to the use of residual clinical samples for research and development purposes, as well as the potential publication of the resulting findings.
References
- Clinical and Laboratory Standards Institute (CLSI). (2022). A Framework for Using CLSI Documents to Evaluate Medical Laboratory Test Methods–Third Edition. CLSI report EP19.
- Kulis-Horn, R. K. and Tiemann, C. (2019). Evaluation of a laboratory-developed test for simultaneous detection of norovirus and rotavirus by real-time RT-PCR on the Panther Fusion® system. Eur J Clin Microbiol Infect Dis. 39(1): 103–112. https://doi.org/10.1007/s10096-019-03697-7
- Grant, J., Atapattu, N., Dilcher, M., Tan, C. E., Elvy, J. and Ussher, J. E. (2023). Development of real-time RT-PCR assays to detect measles virus on the Hologic Panther Fusion® System. J Clin Virol. 159: 105355. https://doi.org/10.1016/j.jcv.2022.105355
- Fritzsche, A., Berneking, L., Nörz, D., Reucher, S., Fischer, N., Roggenkamp, H., Aepfelbacher, M., Rohde, H., Pfefferle, S., Lütgehetmann, M., et al. (2021). Clinical evaluation of a laboratory-developed quantitative BK virus-PCR assay using the cobas® omni Utility Channel. J Virol Methods. 290: 114093. https://doi.org/10.1016/j.jviromet.2021.114093
- Köffer, J., Frontzek, A. and Eigner, U. (2023). Development and validation of a bacterial gastrointestinal multiplex RT-PCR assay for use on a fully automated molecular system. J Microbiol Methods. 210: 106754. https://doi.org/10.1016/j.mimet.2023.106754
- Madrid, L., Seale, A. C., Kohli-Lynch, M., Edmond, K. M., Lawn, J. E., Heath, P. T., Madhi, S. A., Baker, C. J., Bartlett, L., Cutland, C., et al. (2017). Infant Group B Streptococcal Disease Incidence and Serotypes Worldwide: Systematic Review and Meta-analyses. Clin Infect Dis. 65: S160–S172. https://doi.org/10.1093/cid/cix656
- Le Doare, K., Heath, P. T., Plumb, J., Owen, N. A., Brocklehurst, P. and Chappell, L. C. (2019) Uncertainties in Screening and Prevention of Group B Streptococcus Disease. Clin Infect Dis. 69(4): 720–725. https://doi.org/10.1093/cid/ciy1069
- Han, M. Y., Xie, C., Huang, Q. Q., Wu, Q. H., Deng, Q. Y., Xie, T. A., Liu, Y. L., Li, Z. L., Zhong, J. H., Wang, Y. C., et al. (2021). Evaluation of Xpert GBS assay and Xpert GBS LB assay for detection of Streptococcus agalactiae. Ann Clin Microbiol Antimicrob. 20(1): 1–11. https://doi.org/10.1186/s12941-021-00461-8
- Vieira, L. L., Perez, A. V., Machado, M. M., Kayser, M. L., Vettori, D. V., Alegretti, A. P., Ferreira, C. F., Vettorazzi, J. and Valério, E. G. (2019). Group B Streptococcus detection in pregnant women: comparison of qPCR assay, culture, and the Xpert GBS rapid test. BMC Pregnancy Childbirth. 19(1): 1–8. https://doi.org/10.1186/s12884-019-2681-0
- Zeng, Y. F., Chen, C. M., Li, X. Y., Chen, J. J., Wang, Y. G., Ouyang, S., Ji, T. X., Xia, Y. and Guo, X. G. (2020). Development of a droplet digital PCR method for detection of Streptococcus agalactiae. BMC Microbiol. 20(1): 1–6. https://doi.org/10.1186/s12866-020-01857-w
- da Silva, H. D. and Kretli Winkelströter, L. (2019). Universal gestational screening for Streptococcus agalactiae colonization and neonatal infection — A systematic review and meta-analysis. J Infect Public Health. 12(4): 479–481. https://doi.org/10.1016/j.jiph.2019.03.004
- Verani, J. R., McGee, L., Schrag, S. J., Division of Bacterial Diseases, N. C. f. I., Respiratory Diseases, C. f. D. C. and Prevention. (2010). Prevention of perinatal group B streptococcal disease--revised guidelines from CDC, 2010. MMWR Recomm Rep. 59(RR-10): 1–36. https://pubmed.ncbi.nlm.nih.gov/21088663/
- Okonechnikov, K., Golosova, O., Fursov, M. and UGENE team. (2012). Unipro UGENE: a unified bioinformatics toolkit. Bioinformatics 28(8): 1166–1167. https://doi.org/10.1093/bioinformatics/bts091
- Waterhouse, A. M., Procter, J. B., Martin, D. M. A., Clamp, M. and Barton, G. J. (2009). Jalview Version 2—a multiple sequence alignment editor and analysis workbench. Bioinformatics 25(9): 1189–1191. https://doi.org/10.1093/bioinformatics/btp033
- Hall, T. A. (1999) BioEdit: a user-friendly biological sequence alignment editor and analysis program for Windows 95/98/NT. Nucleic Acids Symp Ser. 41: 95–98. https://doi.org/10.14601/Phytopathol_Mediterr-14998u1.29
- Rychlik, W. (2007). OLIGO 7 Primer Analysis Software. Methods Mol Biol. 402 : 35–59. https://doi.org/10.1007/978-1-59745-528-2_2
- Nagy, A., Jiřinec, T., Černíková, L., Jiřincová, H. and Havlíčková, M. (2015). Large-Scale Nucleotide Sequence Alignment and Sequence Variability Assessment to Identify the Evolutionarily Highly Conserved Regions for Universal Screening PCR Assay Design: An Example of Influenza A Virus. Methods Mol Biol. 1275: 57–72. https://doi.org/10.1007/978-1-4939-2365-6_4
- Katoh, K., Rozewicki, J. and Yamada, K. D. (2017). MAFFT online service: multiple sequence alignment, interactive sequence choice and visualization. Briefings Bioinf. 20(4): 1160–1166. https://doi.org/10.1093/bib/bbx108
- Qu, W. and Zhang, C. (2015). Selecting Specific PCR Primers with MFEprimer. Methods Mol Biol. 1275: 201–213. https://doi.org/10.1007/978-1-4939-2365-6_15
- Wang, K., Li, H., Xu, Y., Shao, Q., Yi, J., Wang, R., Cai, W., Hang, X., Zhang, C., Cai, H., et al. (2019). MFEprimer-3.0: quality control for PCR primers. Nucleic Acids Res. 47: W610–W613. https://doi.org/10.1093/nar/gkz351
- Jolley, K. A., Bray, J. E. and Maiden, M. C. J. (2018). Open-access bacterial population genomics: BIGSdb software, the PubMLST.org website and their applications. Wellcome Open Res. 3: 124. https://doi.org/10.12688/wellcomeopenres.14826.1
- Jolley, K. A. and Maiden, M. C. (2010). BIGSdb: Scalable analysis of bacterial genome variation at the population level. BMC Bioinf. 11(1): 585. https://doi.org/10.1186/1471-2105-11-595
- Vanneste, K., Garlant, L., Broeders, S., Van Gucht, S. and Roosens, N. H. (2018). Application of whole genome data for in silico evaluation of primers and probes routinely employed for the detection of viral species by RT-qPCR using dengue virus as a case study. BMC Bioinf. 19(1): e1186/s12859–018–2313–0. https://doi.org/10.1186/s12859-018-2313-0
- Vallejo, A., Muniesa, A., Ferreira, C. and Blas, I. d. (2013). New method to estimate the sample size for calculation of a proportion assuming binomial distribution. Res Vet Sci. 95(2): 405–409. https://doi.org/10.1016/j.rvsc.2013.04.005
- Caballero Méndez, A., Reynoso de la Rosa, R. A., Abreu Bencosme, M. E., Sosa Ortiz, M. N., Pichardo Beltré, E., de la Cruz García, D. M., Piñero Santana, N. J. and Bacalhau de León, J. C. (2024). Development and performance evaluation of a qPCR-based assay for the fully automated detection of group B Streptococcus (GBS) on the Panther Fusion Open Access system. Microbiol Spectrum. 12(6): e00057–24. https://doi.org/10.1128/spectrum.00057-24
- Broeders, S., Huber, I., Grohmann, L., Berben, G., Taverniers, I., Mazzara, M., Roosens, N. and Morisset, D. (2014). Guidelines for validation of qualitative real-time PCR methods. Trends Food Sci Technol. 37(2): 115–126. https://doi.org/10.1016/j.tifs.2014.03.008
- Mattocks, C. J., Morris, M. A., Matthijs, G., Swinnen, E., Corveleyn, A., Dequeker, E., Müller, C. R., Pratt, V., Wallace, A., et al. (2010). A standardized framework for the validation and verification of clinical molecular genetic tests. Eur J Hum Genet. 18(12): 1276–1288. https://doi.org/10.1038/ejhg.2010.101
- Jennings, L., Van Deerlin, V. M. and Gulley, M. L. (2009). Recommended Principles and Practices for Validating Clinical Molecular Pathology Tests. Archives of Pathology & Laboratory Medicine 133(5): 743–755. https://doi.org/10.5858/133.5.743
- Rabenau, H. F., Kessler, H. H., Kortenbusch, M., Steinhorst, A., Raggam, R. B. and Berger, A. (2007). Verification and validation of diagnostic laboratory tests in clinical virology. J Clin Virol. 40(2): 93–98. https://doi.org/10.1016/j.jcv.2007.07.009
- Smith, M. (2021). Validating Real-Time Polymerase Chain Reaction (PCR) Assays. Bamford, D. H. and Zuckerman, M. (Eds.) Encyclopedia of Virology. 4th ed. 35–44. https://doi.org/10.1016/b978-0-12-814515-9.00053-9
- Raymaekers, M., Smets, R., Maes, B. and Cartuyvels, R. (2009). Checklist for optimization and validation of real‐time PCR assays. J Clin Lab Anal. 23(3): 145–151. https://doi.org/10.1002/jcla.20307
- Nolan, T., Huggett, Y. and Sanchez, E. (2013) Good practice guide for the application of quantitative PCR (qPCR) Fisrt edition. LGC. Teddington, Middlesex, UK.
- Clinical and Laboratory Standards Institute (CLSI). (2022). Validating Performance Claims for Laboratory-Developed Tests; CLSI EPLDT Quick Guide–First Edition. CLSI document EPLDTEd1QGE.
- Lim, J., Shin, S. G., Lee, S. and Hwang, S. (2011). Design and use of group-specific primers and probes for real-time quantitative PCR. Front Environ Sci En. 5(1): 28–39. https://doi.org/10.1007/s11783-011-0302-x
- Chuang, L. Y., Cheng, Y. H. and Yang, C. H. (2013). Specific primer design for the polymerase chain reaction. Biotechnol Lett. 35(10): 1541–1549. https://doi.org/10.1007/s10529-013-1249-8
- Guo, J., Starr, D. and Guo, H. (2020). Classification and review of free PCR primer design software. Bioinformatics. 36: 5263–5268. https://doi.org/10.1093/bioinformatics/btaa910
- Rodríguez, A., Rodríguez, M., Córdoba, J. J. and Andrade, M. J. (2015). Design of Primers and Probes for Quantitative Real-Time PCR Methods. Methods Mol Biol. 1275: 31–56. https://doi.org/10.1007/978-1-4939-2365-6_3
- Bustin, S. A., Benes, V., Garson, J. A., Hellemans, J., Huggett, J., Kubista, M., Mueller, R., Nolan, T., Pfaffl, M. W., Shipley, G. L., et al. (2009). The MIQE Guidelines: Minimum Information for Publication of Quantitative Real-Time PCR Experiments. Clin Chem. 55(4): 611–622. https://doi.org/10.1373/clinchem.2008.112797
- Cohen, J. F., Korevaar, D. A., Altman, D. G., Bruns, D. E., Gatsonis, C. A., Hooft, L., Irwig, L., Levine, D., Reitsma, J. B., de Vet, H. C. W., et al. (2016). STARD 2015 guidelines for reporting diagnostic accuracy studies: explanation and elaboration. BMJ Open. 6(11): e012799. https://doi.org/10.1136/bmjopen-2016-012799
Article Information
Publication history
Received: Dec 31, 2024
Accepted: Feb 25, 2025
Available online: Mar 11, 2025
Published: Apr 5, 2025
Copyright
© 2025 The Author(s); This is an open access article under the CC BY-NC license (https://creativecommons.org/licenses/by-nc/4.0/).
How to cite
Caballero Méndez, A., Reynoso de La Rosa, R. A., Abreu Bencosme, M. E., Sosa Ortiz, M. N., Pichardo Beltré, E., de La Cruz García, D. M., Piñero Santana, N. J. and Bacalhau de León, J. C. (2025). Screening for Streptococcus agalactiae: Development of an Automated qPCR-Based Laboratory-Developed Test Using Panther Fusion® Open AccessTM. Bio-protocol 15(7): e5255. DOI: 10.21769/BioProtoc.5255.
Category
Bioinformatics and Computational Biology
Molecular Biology > DNA > DNA detection
Microbiology > Pathogen detection > PCR
Do you have any questions about this protocol?
Post your question to gather feedback from the community. We will also invite the authors of this article to respond.