- Protocols

- Articles and Issues
- For Authors
- About
- Become a Reviewer

Visualization of mRNA Translation Within Germ Granule Biphasic Organization in Drosophila Early Embryo
Published: Vol 15, Iss 6, Mar 20, 2025 DOI: 10.21769/BioProtoc.5242 Views: 3626
Reviewed by: Marion HoggTing MiaoKyle Stewart Skalenko
Original research article
The authors used this protocol in:

Sep 2024
Advertisement


Protocol Collections
Comprehensive collections of detailed, peer-reviewed protocols focusing on specific topics


Abstract
Super-resolution imaging of RNA–protein (RNP) condensates has shown that most are composed of different immiscible phases reflected by a heterogenous distribution of their main components. Linking RNA–protein condensate’s inner organization with their different functions in mRNA regulation remains a challenge, particularly in multicellular organisms. Drosophila germ granules are a model of RNA–protein condensates known for their role in mRNA storage and localized protein production in the early embryo. Present at the posterior pole of the embryo within a specialized cytoplasm called germplasm, they are composed of maternal mRNAs as well as four main proteins that play a key role in germ granule formation, maintenance, and function. Germ granules are necessary and sufficient to drive germ cell formation through translational regulation of maternal mRNAs such as nanos. Due to their localization at the posterior tip of the ovoid embryo and small size, the classical imaging setup does not provide enough resolution to reach their inner organization. Here, we present a specific mounting design that reduces the distance between the germ granule and the objectives. This method provides optimal resolution for the imaging of germ granules by super-resolution microscopy, allowing us to demonstrate their biphasic organization characterized by the enrichment of the four main proteins in the outermost part of the granule. Furthermore, combined with the direct visualization of nanos mRNA translation using the Suntag approach, this method enables the localization of translation events within the germ granule’s inner organization and thus reveals the spatial organization of its functions. This approach reveals how germ granules serve simultaneously as mRNA storage hubs and sites of translation activation during development. This work also highlights the importance of considering condensates’ inner organization when investigating their functions.
Key features
• Method for super-resolution imaging of germ granules in Drosophila early embryo.
• Analysis of RNP condensate functional organization.
• Simultaneous recording of RNP condensate function and organization.
Keywords: RNP condensatesGraphical overview
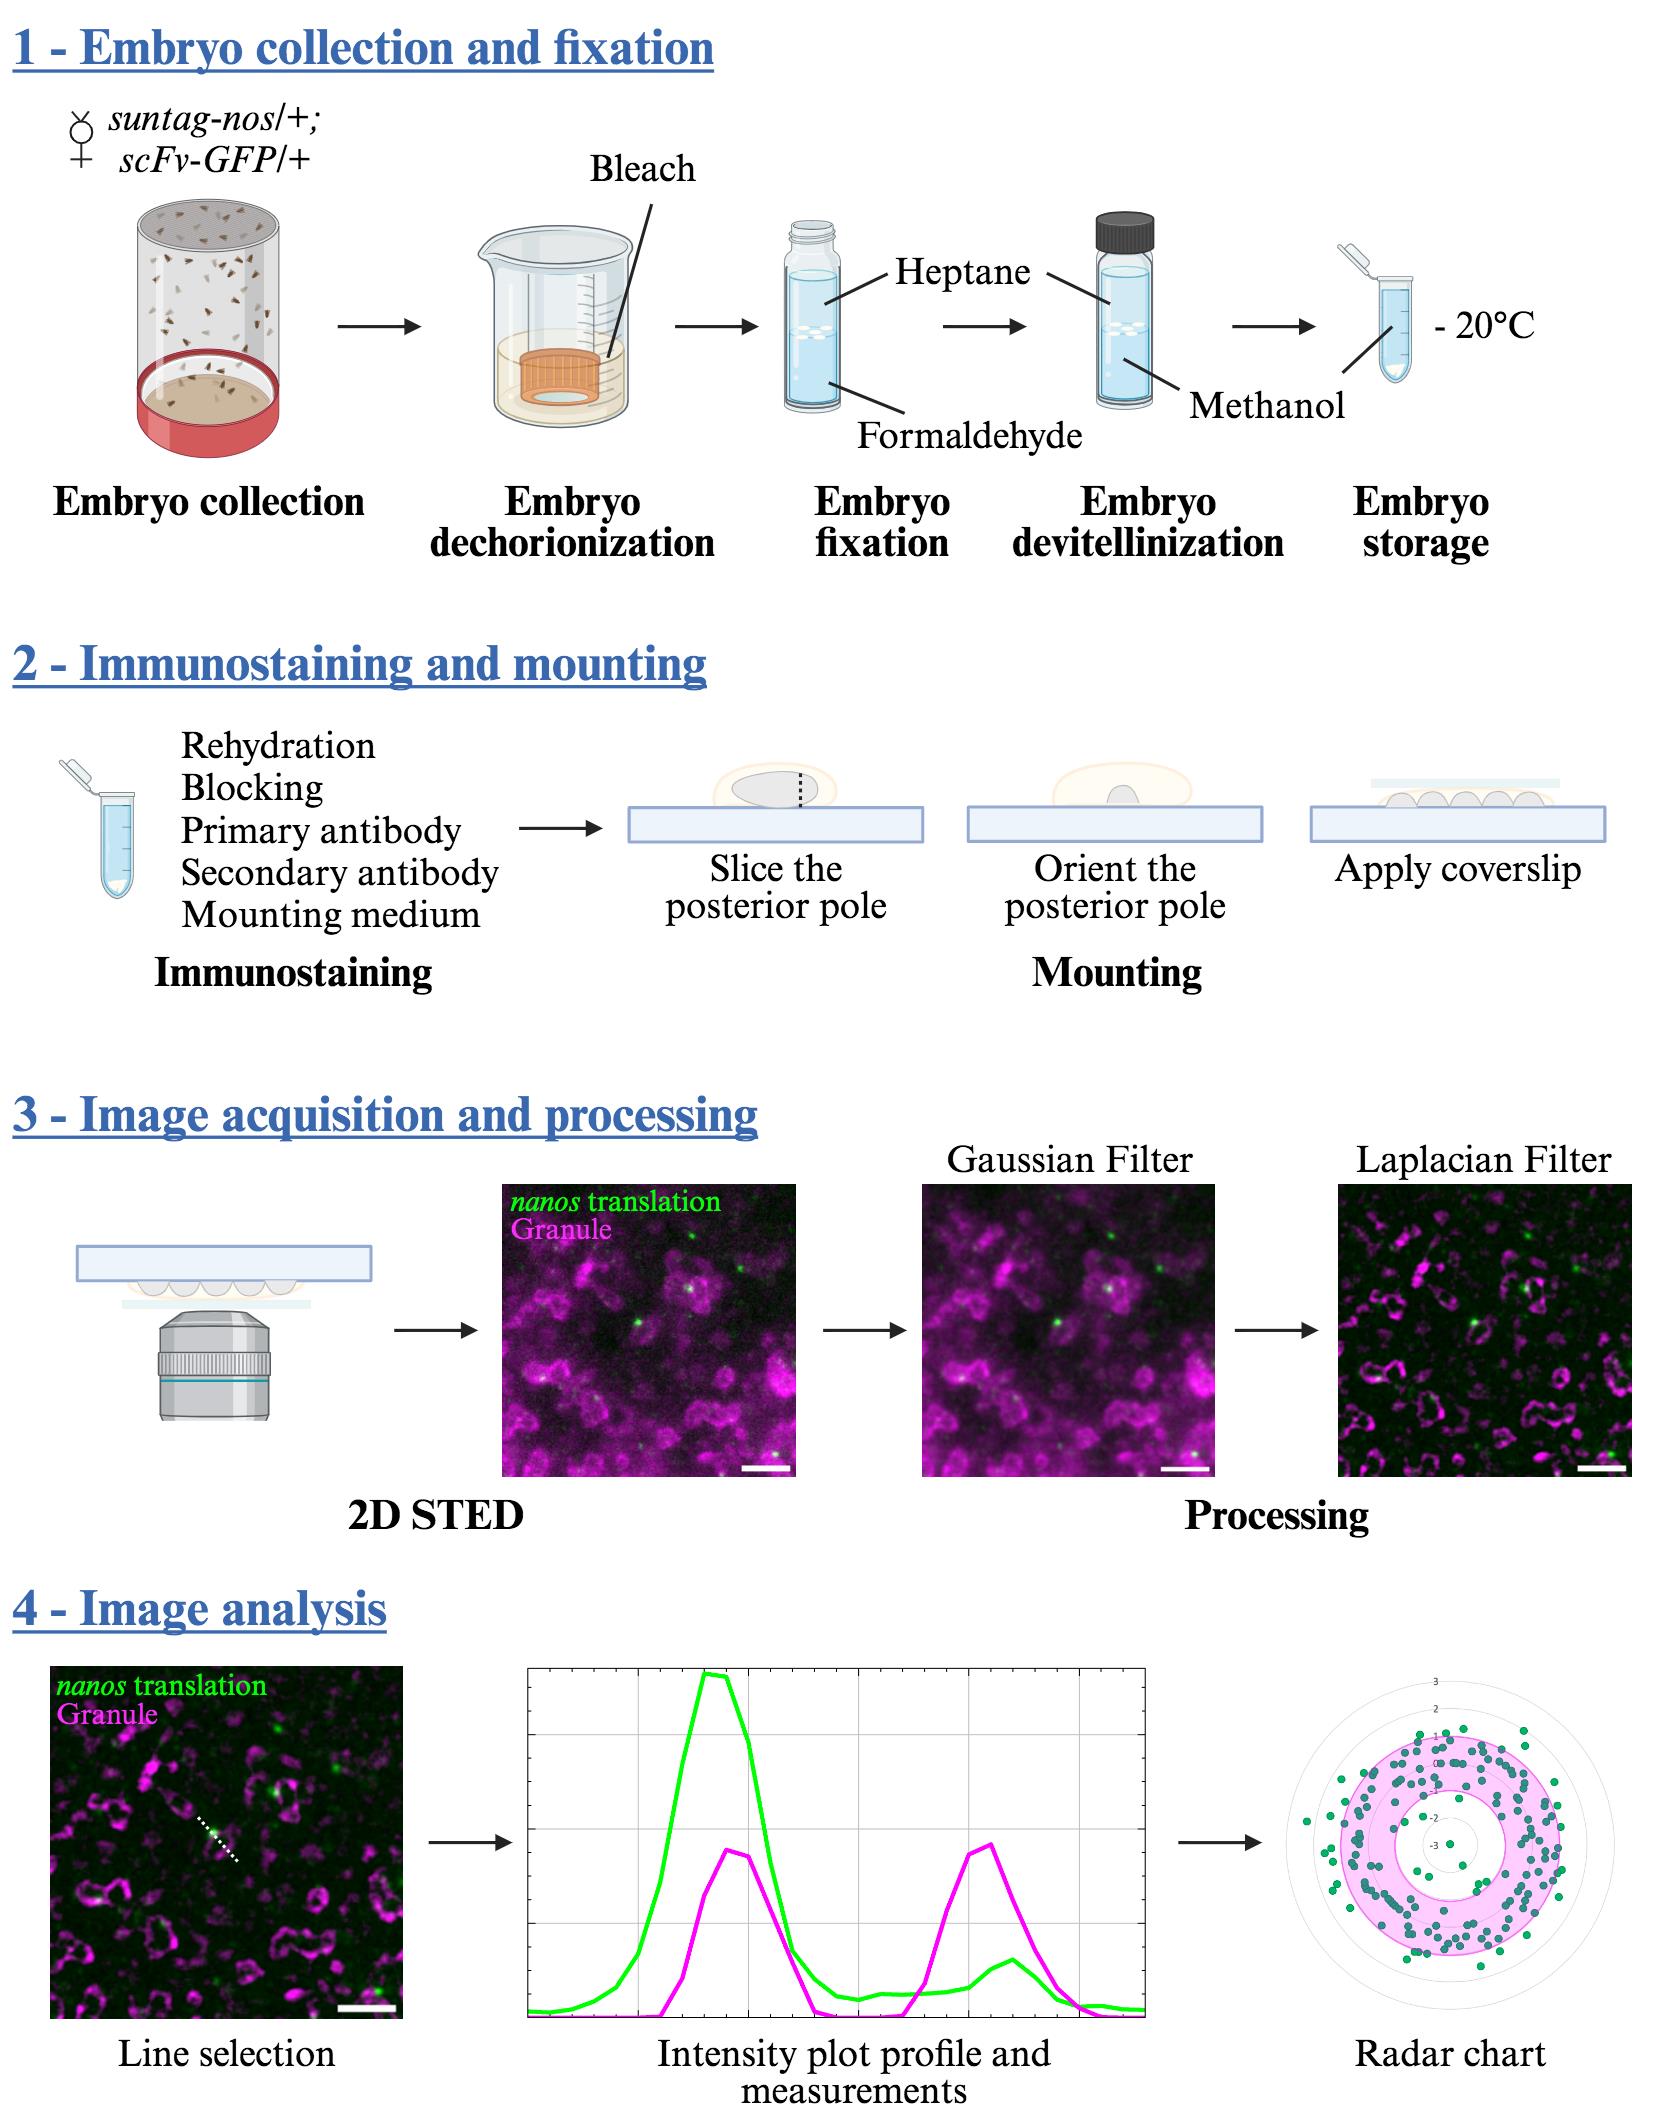
Visualization of mRNA translation within germ granule biphasic organization
Background
RNA–protein (RNP) condensates, also called RNA granules, exist in both the nucleus and cytoplasm and are linked to various aspects of RNA biology [1,2]. Most RNP condensates are composed of multiple immiscible phases, reflected by a heterogeneous distribution of RNA and/or RNA binding proteins [2,3]. Linking RNP condensate functions with their inner organization is a challenge that requires simultaneous recording of both their structure and functions.
Drosophila germ granules are a model of RNP condensates. Localized at the posterior pole of the embryo, they are necessary and sufficient to drive germ cell fate through maternal mRNA storage and their sequential translational activation [4,5]. Composed of four main proteins [Oskar (Osk), Vasa, Tudor, and Aubergine (Aub)] together with more than 200 maternal mRNAs such as nanos mRNA [5–7], they have long been suspected to be a site for localized mRNA translation [8]. We previously showed that Aub is involved in nanos mRNA translational activation through the recruitment of translation initiation factors at the edge of germ granules [9]. This led us to hypothesize that mRNA regulation is organized within the germ granule, with translation occurring at the surface while mRNA storage would be restricted to an internal region of the granule. We thus further explored germ granule inner structure and where mRNA translation and repression occurred in these condensates. However, germ granules have a relatively small size compared to most RNP condensates, ranging from 200 to 500 nm [8], thus rendering the use of super-resolution microscopy mandatory to reveal their organization. Another problem lies in the localization of germ granules at the posterior tip of the ovoid embryo. This implies imaging far from the microscope objective when the embryo lies on the slide, resulting in a decreased resolution not compatible with super-resolution microscopy. To render super-resolution imaging compatible with Drosophila early embryo, we set up a mounting design whereby the posterior pole of the embryo was sliced and placed with germ granules facing the coverslip. This reduced the distance between germ granules and the objective as well as sample-induced light scattering and absorption (the result of imaging deep in a tissue), thus substantially improving resolution. By using this method with stimulated emission depletion (STED) microscopy, whereby a depletion laser reversibly silences fluorophores around the center of the excitation focus, we were able to reach a resolution of 60 nm in our samples and thus reveal germ granule biphasic organization with enrichment of their main proteins in the outermost phase [10]. This mounting method is compatible with other imaging techniques such as AiryScan and OMX [10]; however, STED microscopy provides the best resolution. To record translation at germ granules, we implemented the Suntag technique [11–13] to visualize nanos mRNA translation. Briefly, binding a single-chain antibody fused to GFP (scFv-GFP) to repeats of Suntag epitopes localized downstream of the nanos start codon allows the detection of nascent peptides by creating bright GFP spots above the background. Combined with our method of super-resolution imaging, we were able to precisely localize translation events within the germ granule’s biphasic organization, showing that translation occurs in the outer phase (or shell) and at the surface of the granule and revealing that translational regulation at germ granule is compartmentalized.
Materials and reagents
Biological materials
1. Drosophila melanogaster stock scFv-GFP (w1118;; nos-scFv-GFP) [14]. The scFv-GFP flies contain a transgene encoding the single-chain antibody that recognizes the Suntag epitope fused to GFP and under the control of the germline-specific nanos promoter
2. Drosophila melanogaster stock suntag-nos (w1118; nos-suntagX12-nos/Cyo) generated in our lab [10]. The suntag-nos flies contain a transgene with a nanos genomic region containing 12 Suntag repeats localized after the start codon
3. Drosophila melanogaster stock w1118, referred to as wild type
Reagents
1. Commercial bleach 9.6% 250 mL (local purchase); store in the dark
2. Yeast (local purchase)
3. Formaldehyde 36%, AnalaR NORMAPUR (VWR, catalog number: 20909.290)
4. n-Heptane, AnalaR NORMAPUR (VWR, catalog number: 24551.290)
5. Methanol, AnalaR NORMAPUR (VWR, catalog number: 20847.295)
6. Dulbecco's phosphate-buffered saline (PBS) 10× (Sigma, catalog number: D1408)
7. Tween 20 (Sigma, catalog number: P1379)
8. Bovine serum albumin (BSA) (Sigma, catalog number: A2934)
9. Rabbit anti-Osk antibody (generated in our lab [10]); store at -20 °C in small aliquots to avoid multiple thaw cycles
10. Goat anti-rabbit IgG Abberior Star580 (Abberior, catalog number: ST580-1002-500UG); store at -20 °C in small aliquots to avoid multiple thaw cycles
11. FluoTag®-X4 anti-GFP Abberior StarRed (NanoTag Biotechnologies, catalog number: N0304-AbRED-L); store at -20 °C in small aliquots to avoid multiple thaw cycles
12. Abberior MOUNT, liquid antifade (Abberior, catalog number: MM-2009); store at -20 °C in small aliquots to avoid multiple thaw cycles
13. Neutral Red dye (Sigma, catalog number: N7005)
14. Fly culture medium in tubes or bottles [for 1 L: 8.75 g of agar, 75 g of yeast, 75 g of corn flour, 49.5 mL of Moldex; provided by a local platform (DROSO, Biocampus, Montpellier)]
Solutions
1. 2.6% bleach (see Recipes)
2. 10% BSA (see Recipes)
3. PBST (see Recipes)
4. Methanol dilutions (see Recipes)
Recipes
1. 2.6% bleach
| Reagent | Final concentration | Quantity or Volume |
|---|---|---|
| Bleach 9.6% | 2.6% | 250 mL |
| H2O (tap water) | n/a | 750 mL |
| Total | 1 L |
2. 10% BSA
| Reagent | Final concentration | Quantity or Volume |
|---|---|---|
| BSA | 10% | 10 g |
| PBS 1× | ||
| Total | 100 mL |
3. PBST
| Reagent | Final concentration | Quantity or Volume |
|---|---|---|
| PBS 10× | 1× | 50 mL |
| Tween 20 | 0.1% | 500 μL |
| H2O (MilliQ water) | n/a | 449.5 mL |
| Total | 500 mL |
4. Methanol dilutions
Make 75%, 50%, and 25% dilutions of methanol in PBST. Prepare the dilutions at least 30 min before the experiment as an exothermic reaction occurs when mixing methanol with PBST and the solution needs to be used at room temperature.
Laboratory supplies
1. Embryo collection cages (Dutscher, catalog number: 789092)
2. Collection plates: 90 mm Petri dishes, half filled with fly culture medium with Neutral Red dye to visualize the eggs. Each plate should be supplemented with 1/3 teaspoon of yeast paste spread on the culture medium
3. Embryo collection basket: cut both the end and the screw cap of a 50 mL Falcon tube and screw the open cap with a square of thin mesh (Dutscher, catalog number: 074007)
4. Medium paint brush (local purchase)
5. Eppendorf 2 mL tube (Dutscher, catalog number: 033297)
6. Pasteur glass pipettes 150 mm (Dutscher, catalog number: 065421)
7. Pipettes 5 mL (Dutscher, catalog number: 357543)
8. Scintillation glass vial (Merck, catalog number: DWK986546)
9. Terumo Agani needle 21G × 1’’ (0.8 mm × 25 mm) (VWR, catalog number: TERUSAN2125R1)
10. StarFrost microscope slides (Dutscher, catalog number: 100204)
11. High-precision microscope cover glasses 22 mm × 22 mm, No.1.5H Marienfeld (VWR, catalog number: 630-2186)
12. Transparent nail polish (local purchase)
Equipment
1. PipetBoy
2. Natural rubber suction aid 2 mL (Roth, catalog number: 1C6P.1)
3. Stereomicroscope (Olympus, model: SZ51)
4. Platform shaker (Heidolph, model: Rotamax 120)
5. Benchtop vortex (Corning, model: LSE Vortex Mixer)
6. Rotating wheel (Snijders, model: 34528 Test Tube Rotator)
7. STED microscope (Abberior)
Software and datasets
1. Imspector (Abberior Instruments)
2. ImageJ/Fiji v2.14.0
3. Microsoft Excel v16.90.2
4. Prism v10 (GraphPad)
5. BioRender (https://www.biorender.com/). The following figures were created using BioRender: Graphical overview: BioRender.com/h93e102; Figure 1: BioRender.com/m96q857; Figure 2: BioRender.com/a28f858.
Procedure
A. Fly crosses and embryo fixation
1. Cross scFv-GFP virgin females with suntag-nos/Cyo males (Figure 1A) in tubes or bottles with fly culture medium and maintain them at 25 °C, putting the adult flies into new tubes/bottles every two days.
2. Select and collect from the F1 suntag-nos/+ ; scFv-GFP/+ female flies. Put them with wild-type (w1118) males in an embryo collection cage with a collection plate at the bottom (hereafter, this setup is referred to as a cage). Keep the cage at 25 °C.
3. The next day, change the collection plate, let the females lay for 1 h at 25 °C, and discard the plate since embryos are often of varied ages as females retain their eggs during overnight laying. Add a fresh collection plate.
4. Let the females lay for 1.5 h at 25 °C and collect the plate (Figure 1B). This collection will have embryos aged from 0 to 1.5 h.
5. Add tap water to the collection plate, gently detach the embryos from the plate using the brush, and pour them into the collection basket. Wash them thoroughly with tap water to remove the yeast and culture medium.
6. To remove the chorion, plunge the collection basket with the embryos in 30 mL of 2.6% bleach in a 100 mL beaker (Figure 1C). Using a Pasteur pipette, flush the embryos toward the bottom of the basket 2–3 times, put on the platform shaker, and rotate at 125 rpm for 3 min. An indication of effective dechorionization is that the white embryos will become translucent and float at the surface of the dechorionization solution.
7. Wash the embryos in the basket thoroughly with tap water to remove the bleach.
8. Quickly dry the basket and plunge it into 30 mL of n-heptane in a 100 mL beaker. Dechorionated embryos float at the surface of aqueous solutions but will sink to the bottom of the basket in heptane, allowing a quick collection with a Pasteur pipette. Alternatively, they can be collected on the dry basket with a brush.
9. Pour the embryos into a scintillation vial containing 5 mL of 36% formaldehyde and 5 mL of heptane (Figure 1D). The embryos will stay at the interphase between the formaldehyde (lower phase) and n-heptane (upper phase).
10. Put the vial on a platform shaker and rotate at 125 rpm for 5 min.
11. Using a Pasteur pipette, remove the formaldehyde (lower phase), add 5 mL of methanol, and proceed to embryo devitellinization by vortexing for 1 min (Figure 1E). Devitellinized embryos sink to the bottom of the vial. Embryos that are not devitellinized will stay at the methanol/heptane interphase and must be discarded.
12. Remove the n-heptane (upper phase). Collect the embryos at the bottom of the vial with a Pasteur pipette and transfer them to a 2 mL tube. Wash three times with methanol. Embryos can be stored in methanol at -20 °C for months.
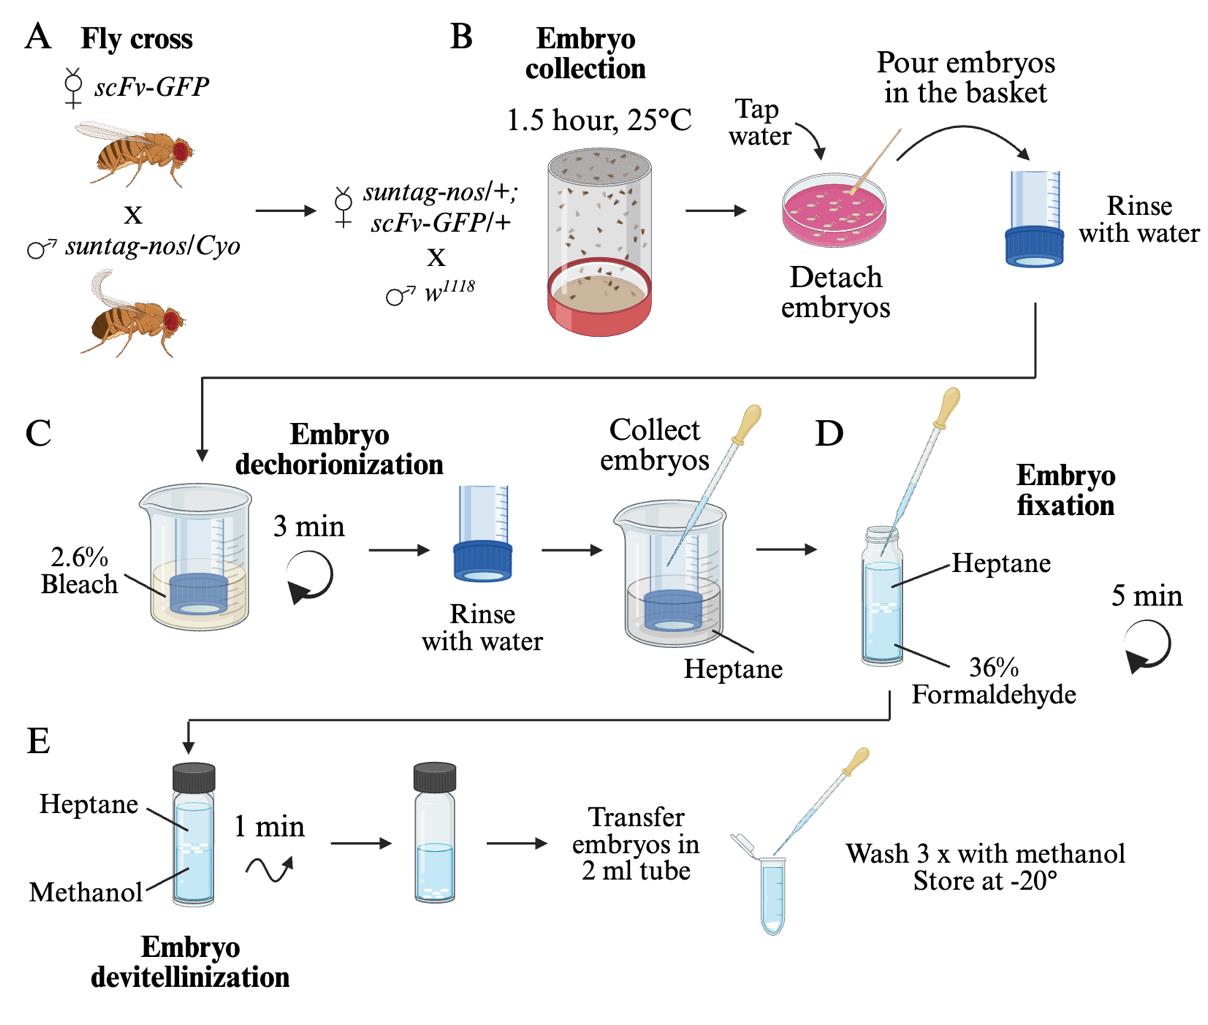
Figure 1. Generation of fixed Drosophila embryos for the visualization of nanos mRNA translation. (A) Representation of the Drosophila cross needed to obtain females that will produce embryos containing the components allowing the visualization of nanos mRNA translation (ScFv-GFP protein and suntag-nos mRNA). (B) Embryo collection. Females suntag-nos/+ ; scFv-GFP/+ from the cross represented in (A) are placed in a collection cage with wild-type males and left to lay for 1.5 h at 25 °C. Laid embryos are collected and washed with water in a collection basket. (C) Embryo dechorionization. Embryos are sunk in 2.6% bleach for 3 min with agitation. Then, they are thoroughly washed and plunged into n-heptane. (D) Embryo fixation. Embryos are transferred in a 1:1 ratio of heptane to 36% formaldehyde and fixed for 5 min with agitation. (E) Embryo devitellinization and storage. Replace formaldehyde with the same volume of methanol and vortex for 1 min. Transfer embryos at the bottom of the vial in a tube and wash thrice with methanol. Embryos can be stored at -20 °C for months.
B. Immunostaining and mounting
1. Progressively rehydrate embryos by incubating them on a rotating wheel for 5 min with 1.5 mL of 75%, 50%, and then 25% of methanol diluted in PBST. Devitellinized embryos will sink in aqueous solutions and will thus settle at the bottom of the tube, and solutions can be removed from the top.
2. Quickly rinse twice with PBST and incubate in PBST for 30 min on a rotating wheel.
3. Block for 3 h in 1 mL of 10% BSA on a rotating wheel.
4. Remove the BSA and add the primary antibody (pre-adsorbed rabbit anti-Osk used to visualize germ granules diluted at 1/1,000 in PBST) overnight at 4 °C on a rotating wheel.
5. Remove the primary antibody and wash three times for 10 min in PBST.
6. Add the secondary antibody (goat anti-rabbit Abberior Star 580, 1/1,000) and anti-GFP FluoTagX4 Abberior Star Red (1/500) diluted in PBST to visualize scFv-GFP foci (i.e., translation foci) and incubate for 1 h at room temperature in the dark on a rotating wheel. Abberior STAR dyes are recommended for STED microscopy as they have been designed to withstand depletion due to their high brightness and photostability. However, we also used other fluorophores such as Cy3-coupled secondary antibodies. In that case, we had to decrease the intensity power of the depletion laser to avoid bleaching and thus decreased a bit the resolution that is dictated by this parameter [15].
7. Wash three times for 10 min in PBST. Remove the PBST and add 60–100 μL of Abberior mount. Leave at 4 °C in the dark for at least 2 h.
8. Using a pipette, put a drop of embryos on a slide with as little mounting medium as possible. Under the stereomicroscope, select 20–30 embryos of the appropriate stage, namely syncytial embryos without germ cells that can be seen as buds on the tip of the embryo (Figure 2A).
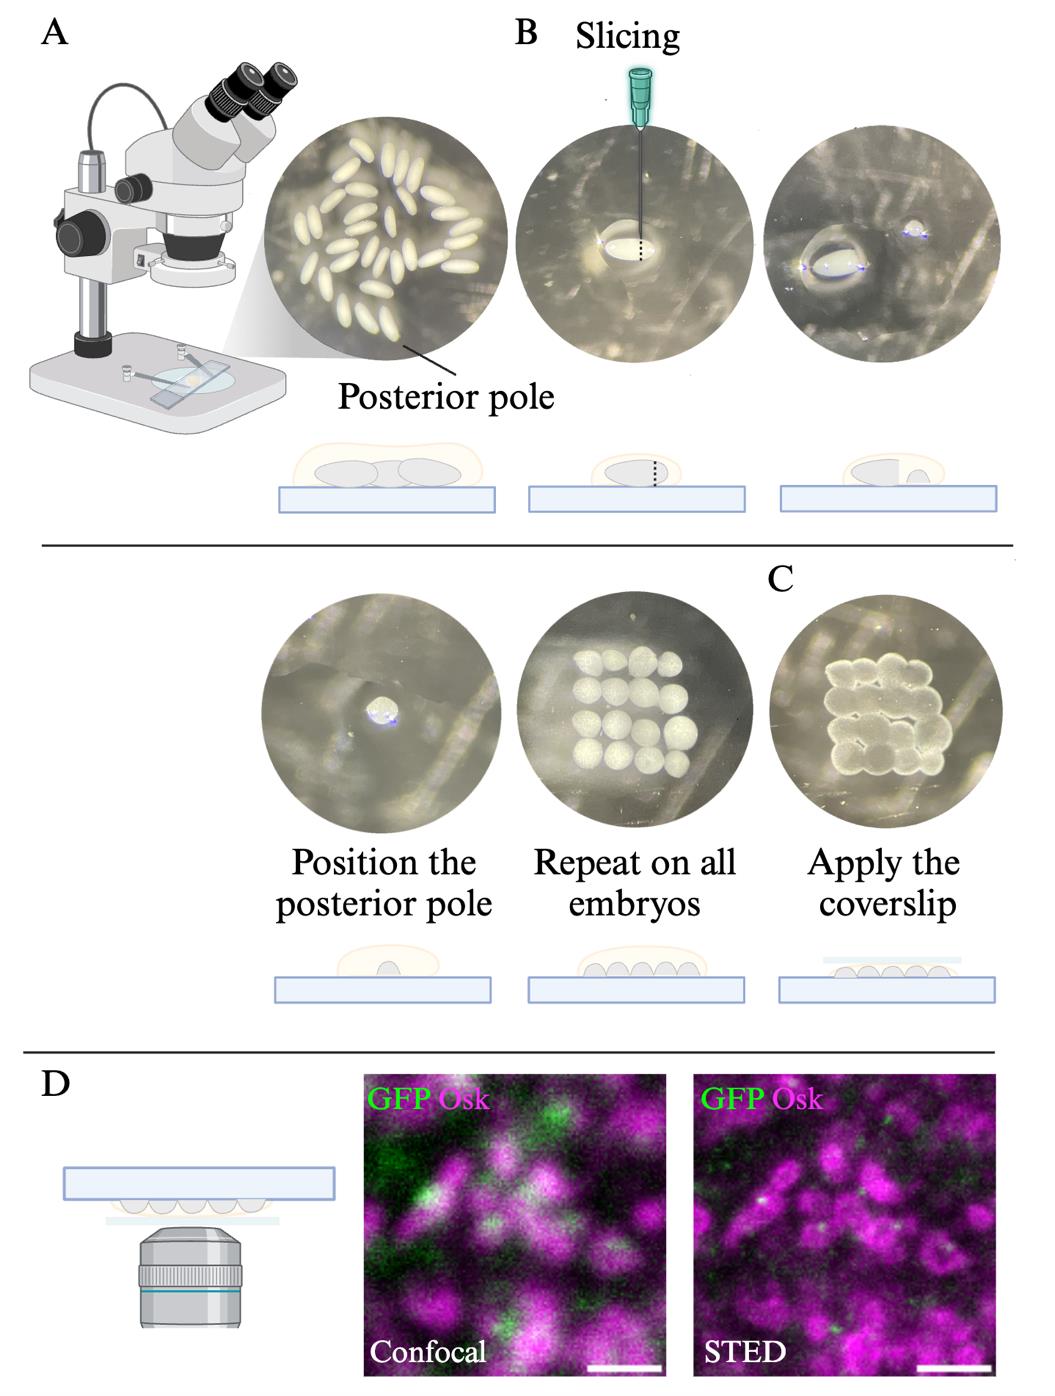
Figure 2. Mounting of Drosophila posterior pole for super-resolution microscopy. (A) Stereomicroscope image (top) and scheme (bottom) of syncytial embryos. Note that the posterior pole is slightly rounder than the anterior pole. (B) Stereomicroscope images (top) and schemes (bottom) of the slicing and positioning of the posterior pole of syncytial embryos. (C) Stereomicroscope image (top) and scheme (bottom) of mounted sliced posterior poles. (D) Confocal and STED images of suntag-nos/+ ; scFv-GFP/+ embryos immunostained with the germ granule marker Osk (magenta) and GFP (green) to reveal scFv-GFP foci. Scale bar: 1 μm.
9. One embryo at a time, move it to the side where there is less mounting medium to facilitate the slicing and identify the position of the posterior pole. On the ovoid embryo, the posterior is slightly rounder than the anterior pole.
10. Using a fine needle, slice the posterior pole, push it to the center of the slide, and place it with the posterior pole facing upward, discarding the rest of the embryo (Figure 2B). Repeat for all embryos.
11. Gently cover the sliced posterior poles with 10 μL of mounting medium, place the coverslip, and seal with nail polish (Figure 2C). This volume of mounting medium is appropriate for 22 mm × 22 mm coverslips and needs to be adjusted if other coverslip sizes are used.
C. Image acquisition
1. Locate the sliced posterior pole using bright light with the 100× objective. Switch to the fluorescent light mode and center on the germplasm using Osk-bound Star580 signal.
2. Using the STED microscope pilot system Imspector, detect in confocal mode the germ granules (Star 580 signal) and Suntag foci (Star Red signal). Set the excitation laser power (lasers 561 and 640 nm for Star 580 and Star Red, respectively) to reach at least 200 grey levels for Osk staining and 100 grey levels for Suntag staining (Figure 2D). Select a region of interest (ROI) of approximately 20 μm × 20 μm at the interface between the germplasm and somatic part of the embryo.
3. Activate the STED depletion laser (775 nm) in Imspector. Both Star 580 and Star Red fluorescent dyes use the same depletion laser wavelength. Depletion laser power is set to get the highest resolution without bleaching the sample, which with our microscope was 30%. Acquire the STED signal for the ROI (Figure 2D) and save the image.
D. Image processing and analysis
1. Open the acquired raw images with the ImageJ software (Figure 3A).
2. On the GFP (Star Red) channel, apply a Gaussian Blur (Process > Filter > Gaussian Blur radius 0.7) to smooth signal intensities (Figure 3B).
3. On the Osk (Star 580) channel that shows germ granule biphasic organization, apply a Laplacian of Gaussian filter. This treatment highlights regions of strong intensity change and is used for edge detection. To do that, first apply a Gaussian Blur (Process > Filter > Gaussian Blur radius 0.7) (Figure 3B). Then, apply a Laplacian filter (Process > Filter > Convolve) (Figure 3C). The size of the kernel used in this filter is determined empirically by comparing the treated and raw images, choosing a kernel size that preserves in the treated image the structures observed in the raw image. We used a 15 × 15 kernel with a single point of interest of value 224 and surrounding negative values of -1, as illustrated in Figure 4.
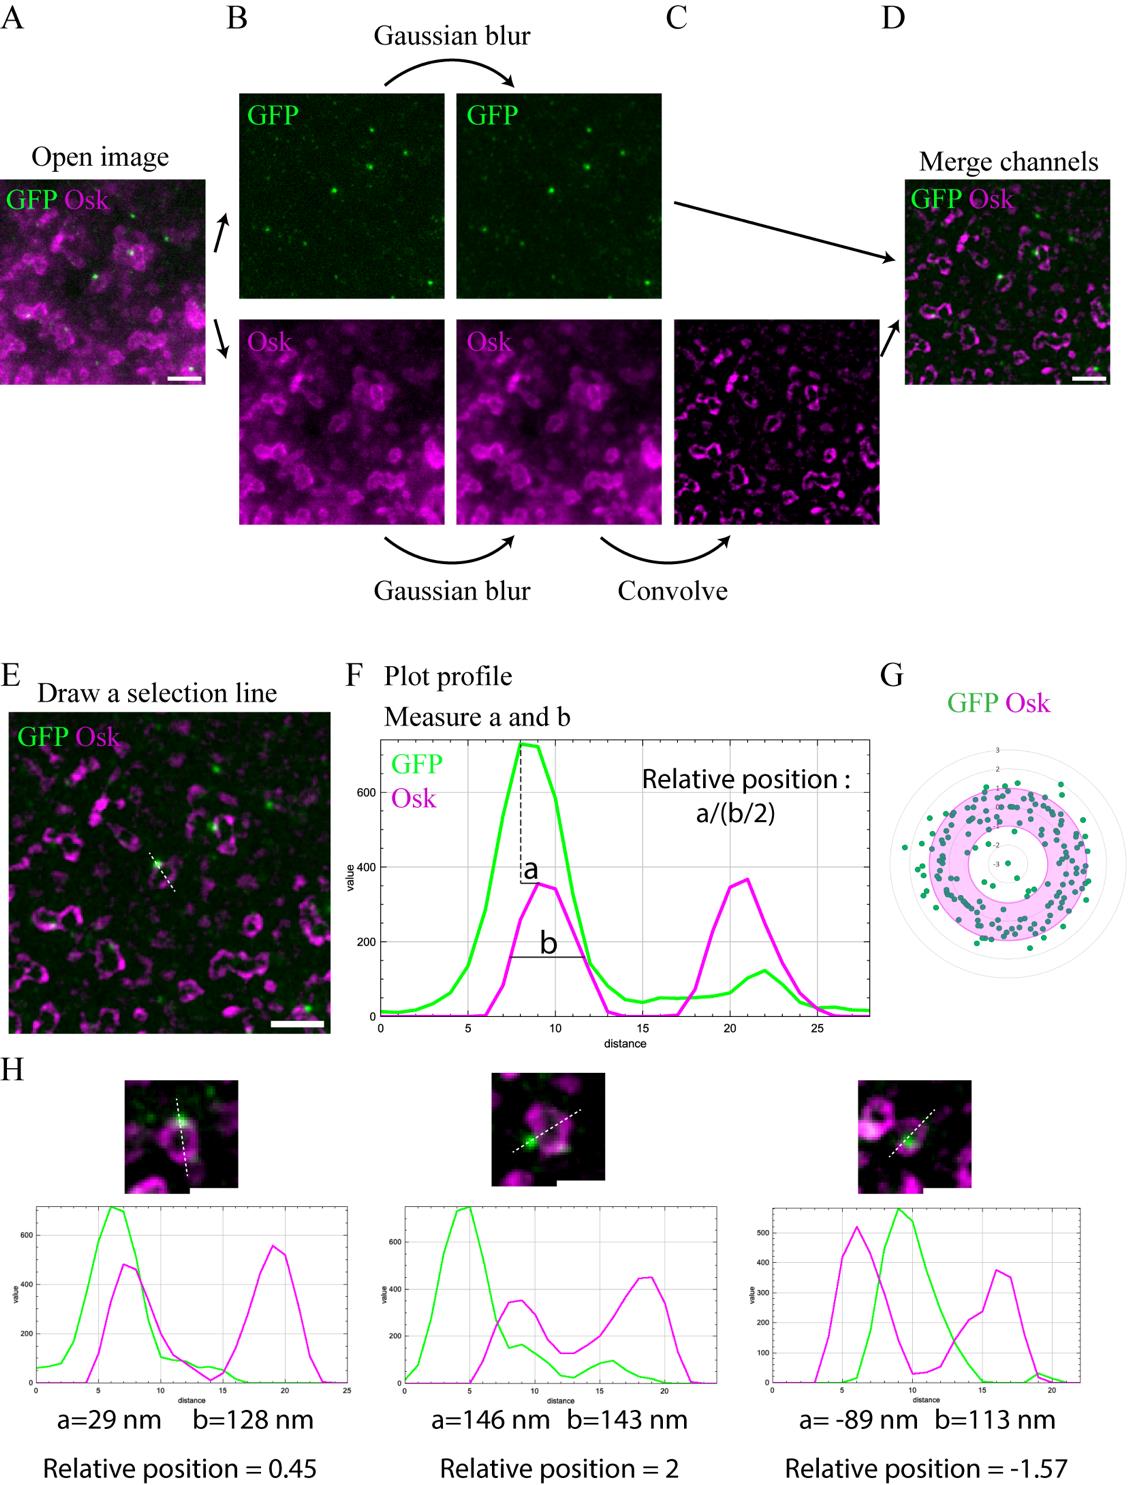
Figure 3. STED image processing and measurement of Suntag foci relative position within germ granule biphasic organization. (A) STED imaging of suntag-nos/+ ; scFv-GFP/+ embryos immunostained with Osk antibody (magenta) and anti-GFP nanobody (green) to reveal scFv-GFP. (B–D) Processing of STED images for the analysis of scFv-GFP foci localization within germ granule biphasic organization. A Gaussian blur is applied to both channels (B) to smooth the signal. Then, a Laplacian filter with a 15 × 15 kernel is applied to the Osk channel to highlight signal edges (C). Both channels are then merged (D). (E–F) Measurement of the relative position of scFv-GFP foci within germ granule biphasic organization. A selection line is drawn on the treated STED image, going across a scFv-GFP foci and granule (E). From the selection, obtain the intensity profile (F) and measure the distance between the peak of scFv-GFP foci and the closest peak for Osk signal measure (a), as well as the full width at half maximum of the selected peak from Osk signal measure (b). The relative position, a/(b/2), has a positive value if the focus is localized outward of the granule (as shown here) and a negative value if the focus is localized inward. (G) Radar chart showing the relative distance of scFv-GFP foci (green dots) within Osk immunostaining (magenta) from images as shown in (E). The granule shell is in pink. (H) Processed STED images showing examples and their corresponding profile plots of the three categories of scFv-GFP localization observed within germ granules: shell (left), periphery (middle), and core (right). Below each profile plot, the measured distances between scFv-GFP and Osk peaks (a), the shell size (b), and the calculated ratio of the relative position of the GFP foci within the granule biphasic organization are indicated. Scale bars: 1 μm in A, D, and E; 0.5 μm in H.
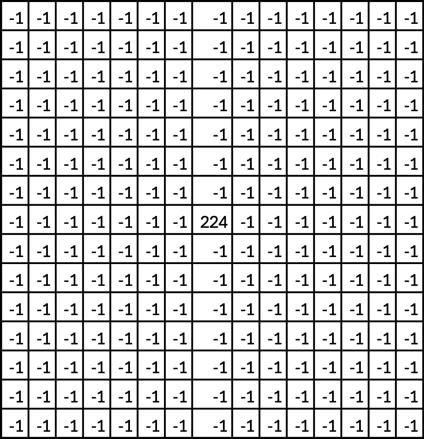
Figure 4. Model of a 15 × 15 kernel used for the Laplacian filter
4. Merge the two channels (Figure 3D).
5. Manually draw a line across the granule (Osk channel) and Suntag foci (GFP channel) (Figure 3E). Record the position of the line in the ROI manager and save all ROIs at the end of the image analysis.
6. Record pixel intensities along the line (Figure 3F) using the Fiji Plot profile (Analyze > Plot Profile). The Osk signal profile shows a bimodal distribution (two peaks, magenta line in Figure 3F), while the profile of the Suntag signal (GFP) shows a normal distribution (one peak, green line in Figure 3F).
7. On the Plot profile, measure the distance between the tip of the GFP signal peak and the closest Osk signal peak (distance a in Figure 3F), as well as the full width at half maximum of the selected peak from Osk signal (distance b in Figure 3F), later referred to as shell size.
Data analysis
1. Export the measured values of the shell length and the distance between the peak of the translation focus and the peak of the shell to Microsoft Excel.
2. Assign a negative value when the Suntag focus is toward the inside of the shell, a positive value when the Suntag focus is toward the outside of the shell, and zero when the Suntag focus coincides with the shell peak.
3. To determine the relative position of the Suntag foci within germ granules (Figure 3F), calculate the following ratio:
If the ratio is >1, the localization of the focus is classified as periphery; if the ratio is ≤-1, the localization of the focus is classified as core; if the ratio is >-1 and ≤1, the localization of the focus is classified as shell.
4. For the representation of the relative position of each Suntag foci within a hypothetical germ granule, we plotted ratio values on a radar chart showing a hollow circle with the outer border localized at 1 and the inner border at -1 (Figure 3G), but other representations can be used.
5. To represent the percentage of foci belonging to each category, on Excel, apply the count.If function on your classification to calculate the number of foci classified in each category and determine the percentage for each category. These percentages can be represented by a histogram.
6. This method can also be used to determine the position of single-molecule FISH (smFISH) foci of mRNAs present within germ granules such as nanos mRNA. To assess if the distribution of the mRNA foci is statistically different between two conditions (developmental timing or mutant condition), export to Prism the number of foci classified in each category for the two conditions and perform a chi-squared test.
Validation of protocol
This protocol has been used and validated in the following research article:
• Ramat et al. [5]. Spatial organization of translation and translational repression in two phases of germ granules. Nature Communications (Figure 2, panels D–L and Supplementary Figure 3G–M).
As described in the research article [10], scFv-GFP foci must be validated as ongoing translation beforehand. First, their colocalization with Suntag mRNA must be evaluated by performing a colocalization assay between smFISH signals against the Suntag sequence and scFv-GFP foci.
In addition, the disappearance of scFv-GFP upon translation inhibition (i.e., puromycin treatment) must be performed as seen in Figure 5.
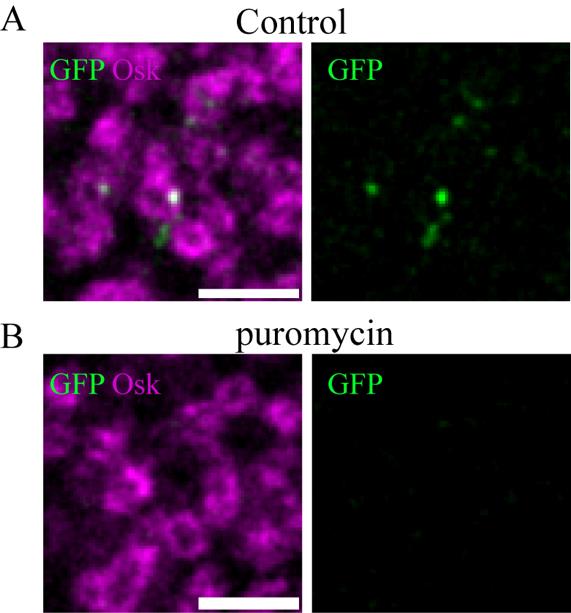
Figure 5. Validation of scFv-GFP foci as translation sites. (A, B) STED imaging of suntag-nos/+ ; scFv-GFP/+ embryos immunostained with Osk antibody (magenta) and anti-GFP nanobody (green) to reveal scFv-GFP in permeabilized embryos without (A) and with (B) puromycin treatment (2 mg/mL for 40 min). Note the absence of GFP foci in the puromycin-treated embryos. Scale bars: 1 μm.
General note and troubleshooting
General note
This protocol relies on the optimization of sample mounting to reduce the distance between the imaged structures and the objective for super-resolution imaging. As such, when the embryos cellularize and primordial germ cells (PGCs) form, germ granules are deeper in the tissue, and thus optimal resolution, as with early embryos, cannot be reached. Other STED microscope equipment with objectives designed to image deeper in the sample may help overcome this limitation. For other biological systems, this protocol may be adapted by implementing fine dissection when possible or using embedded tissue sectioning.
Troubleshooting
Problem 1: Embryos are not properly dechorionated (embryos do not float at the surface of the bleach).
Possible cause: The bleach is altered.
Solution: The 2.6% bleach can be prepared in advance and stored in the dark. Although bleach can be used for several rounds of dechorionization within a day, use a fresh batch of bleach each day.
Problem 2: Embryos are not properly devitellinized (a large proportion of embryos stay at the heptane/methanol interphase).
Possible cause: Failed fixation. However, this can also stem from developmental defects. Indeed, when Drosophila embryo vitelline membrane forms, the proteins composing this layer form a crosslinked network by covalent bonds. In some genetic backgrounds, such as embryos laid by aubergine mutant mothers, this crosslink is altered, resulting in poorly efficient devitellinization of the embryos.
Solution: Ensure the formaldehyde solution is not too old or that the embryos are well layered at the formaldehyde/heptane interphase at the fixation step.
Problem 3: Embryos do not sink at the bottom of the tube when rehydrated.
Possible cause: Embryos not properly devitellinized were collected.
Solution: Devitellinized embryos sink in the methanol while the ones not properly devitellinized stay at the heptane/methanol interphase. When collecting the embryos in the methanol, ensure that the ones at the interphase are not collected. In addition, at the rehydration step, remove with a glass pipette the embryos that do not sink in the solution after 30 s.
Problem 4: Staining has a very high background.
Possible cause: Antibody specificity or insufficient washes.
Solution: Pre-adsorb the primary antibody at 1/20 or 1/50 on embryos mutant for the protein recognized by the antibody if possible. Otherwise, pre-adsorption on wild-type embryos will also help decrease the background. The duration of washes may also be increased.
Problem 5: The quality of the STED acquisition is similar to the same confocal acquisition.
Possible cause: Laser setup defects.
Solution: First, try increasing the power of the depletion laser, as it is this parameter that defines the resolution. If no improvement is observed, with the help of the microscope manager, check excitation and depletion laser powers (in the Imspector software and at the microscope) as well as their alignments.
Acknowledgments
We thank the imaging facility MRI, member of the France-BioImaging national infrastructure supported by the French National Research Agency (ANR-10-INBS-04, «Investments for the future»), for their help and advice for STED imaging. This work was supported by the CNRS-University of Montpellier UMR9002, and by ANR (ANR-19-CE12-0031, ANR-21-CE12-0035-01), MSDAVENIR and FRM (Equipe FRM EQU202303016322) to MS. A. R. held a salary from ANR, Fondation ARC, and CNRS, A. H. held a PhD fellowship from the French Ministry and from the Ligue Nationale Contre le Cancer. This work was described and validated in Ramat et al. [5]. Spatial organization of translation and translational repression in two phases of germ granules. Nature Communications. 2024. 15(1): 8020.
Competing interests
The authors declare no competing interests.
Ethical considerations
We support inclusive, diverse, and ethical conduct in research.
References
- Uversky, V. N. (2017). Intrinsically disordered proteins in overcrowded milieu: Membrane-less organelles, phase separation, and intrinsic disorder. Curr Opin Struct Biol. 44: 18–30. https://doi.org/10.1016/j.sbi.2016.10.015
- Hirose, T., Ninomiya, K., Nakagawa, S. and Yamazaki, T. (2023). A guide to membraneless organelles and their various roles in gene regulation. Nat Rev Mol Cell Biol. 24(4): 288–304. https://doi.org/10.1038/s41580-022-00558-8
- Fare, C. M., Villani, A., Drake, L. E. and Shorter, J. (2021). Higher-order organization of biomolecular condensates. Open Biol. 11(6): e210137. https://doi.org/10.1098/rsob.210137
- Pamula, M. C. and Lehmann, R. (2024). How germ granules promote germ cell fate. Nat Rev Genet. 25(11): 803–821. https://doi.org/10.1038/s41576-024-00744-8
- Rangan, P., DeGennaro, M., Jaime-Bustamante, K., Coux, R.-X., Martinho, R. G. and Lehmann, R. (2009). Temporal and Spatial Control of Germ-Plasm RNAs. Curr Biol. 19(1): 72–77. https://doi.org/10.1016/j.cub.2008.11.066
- Barckmann, B., Pierson, S., Dufourt, J., Papin, C., Armenise, C., Port, F., Grentzinger, T., Chambeyron, S., Baronian, G., Desvignes, J. P., et al. (2015). Aubergine iCLIP Reveals piRNA-Dependent Decay of mRNAs Involved in Germ Cell Development in the Early Embryo. Cell Rep. 12(7): 1205–1216. https://doi.org/10.1016/j.celrep.2015.07.030
- Lécuyer, E., Yoshida, H., Parthasarathy, N., Alm, C., Babak, T., Cerovina, T., Hughes, T. R., Tomancak, P. and Krause, H. M. (2007). Global Analysis of mRNA Localization Reveals a Prominent Role in Organizing Cellular Architecture and Function. Cell. 131(1): 174–187. https://doi.org/10.1016/j.cell.2007.08.003
- Mahowald, A. P. (1962). Fine structure of pole cells and polar granules in Drosophila melanogaster. J Exp Zool. 151(3): 201–215. https://doi.org/10.1002/jez.1401510302
- Ramat, A., Garcia-Silva, M. R., Jahan, C., Naït-Saïdi, R., Dufourt, J., Garret, C., Chartier, A., Cremaschi, J., Patel, V., Decourcelle, M., et al. (2020). The PIWI protein Aubergine recruits eIF3 to activate translation in the germ plasm. Cell Res. 30(5): 421–435. https://doi.org/10.1038/s41422-020-0294-9
- Ramat, A., Haidar, A., Garret, C. and Simonelig, M. (2024). Spatial organization of translation and translational repression in two phases of germ granules. Nat Commun. 15(1): 8020. https://doi.org/10.1038/s41467-024-52346-x
- Pichon, X., Bastide, A., Safieddine, A., Chouaib, R., Samacoits, A., Basyuk, E., Peter, M., Mueller, F. and Bertrand, E. (2016). Visualization of single endogenous polysomes reveals the dynamics of translation in live human cells. J Cell Biol. 214(6): 769–781. https://doi.org/10.1083/jcb.201605024
- Wu, B., Eliscovich, C., Yoon, Y. J. and Singer, R. H. (2016). Translation dynamics of single mRNAs in live cells and neurons. Science. 352(6292): 1430–1435. https://doi.org/10.1126/science.aaf1084
- Yan, X., Hoek, T. A., Vale, R. D. and Tanenbaum, M. E. (2016). Dynamics of Translation of Single mRNA Molecules In Vivo. Cell. 165(4): 976–989. https://doi.org/10.1016/j.cell.2016.04.034
- Dufourt, J., Bellec, M., Trullo, A., Dejean, M., De Rossi, S., Favard, C. and Lagha, M. (2021). Imaging translation dynamics in live embryos reveals spatial heterogeneities. Science. 372(6544): 840–844. https://doi.org/10.1126/science.abc3483
- Leutenegger, M., Eggeling, C. and Hell, S. W. (2010). Analytical description of STED microscopy performance. Opt Express. 18(25): 26417. https://doi.org/10.1364/oe.18.026417
Article Information
Publication history
Received: Dec 9, 2024
Accepted: Feb 7, 2025
Available online: Feb 27, 2025
Published: Mar 20, 2025
Copyright
© 2025 The Author(s); This is an open access article under the CC BY-NC license (https://creativecommons.org/licenses/by-nc/4.0/).
How to cite
Haidar, A., Simonelig, M. and Ramat, A. (2025). Visualization of mRNA Translation Within Germ Granule Biphasic Organization in Drosophila Early Embryo. Bio-protocol 15(6): e5242. DOI: 10.21769/BioProtoc.5242.
Category
Developmental Biology > Reproduction > Germ cell
Cell Biology > Cell imaging > Super resolution imaging
Do you have any questions about this protocol?
Post your question to gather feedback from the community. We will also invite the authors of this article to respond.