- Protocols

- Articles and Issues
- For Authors
- About
- Become a Reviewer

Sensitive and Adaptable Turn-On Maturation (ATOM) Fluorescent Biosensors for Detecting Subcellular Localization of Protein Targets in Cells
Published: Vol 15, Iss 6, Mar 20, 2025 DOI: 10.21769/BioProtoc.5239 Views: 2306
Reviewed by: Xiaokang WuJose Martinez HernandezAnonymous reviewer(s)
Original research article
The authors used this protocol in:

Nov 2023
Advertisement


Protocol Collections
Comprehensive collections of detailed, peer-reviewed protocols focusing on specific topics


Related protocols
Abstract
Fluorescent protein biosensors (FPBs) that turn on—go from dark to bright upon binding their ligands—enable the detection of targets in living cells with high sensitivity and spatial localization. Several approaches exist for creating turn-on FPBs, most notably the method that gave rise to the GCaMP family of genetically encoded calcium indicators. However, it remains challenging to modify these sensors to recognize new ligands. We recently developed adaptable turn-on maturation (ATOM) biosensors, in which target recognition by a small binding domain triggers chromophore maturation in the fluorescent protein to which it is attached. ATOM sensors are advantageous because they are generalizable (by virtue of the monobody and nanobody binding domains) and modular (binding domains and fluorescent proteins of various colors can be mixed and matched for multiplexed imaging), capable of detecting endogenously expressed proteins, and able to function in subcellular compartments including the cytoplasm, nucleus, endoplasmic reticulum, and mitochondria. The protocols herein detail how to design, clone, and screen new ATOM sensors for detecting targets of choice. The starting materials are the genes encoding for a monobody or nanobody and for a cyan, yellow, or red fluorescent protein. We also present general guidelines for creating ATOM sensors using binding domains other than nanobodies and monobodies.
Key features
• Creation of six-member (monobody-based) and nine-member (nanobody-based) plasmid libraries encoding ATOM biosensors.
• Targeting ATOM biosensors to subcellular compartments using peptide tags.
• Screening for biosensor activity in human cells and quantifying turn-on using a fluorescence microscope and freeware software packages.
• The most time-consuming step is ATOM gene construction, which can be bypassed by commercial gene synthesis.
Keywords: ATOMGraphical overview
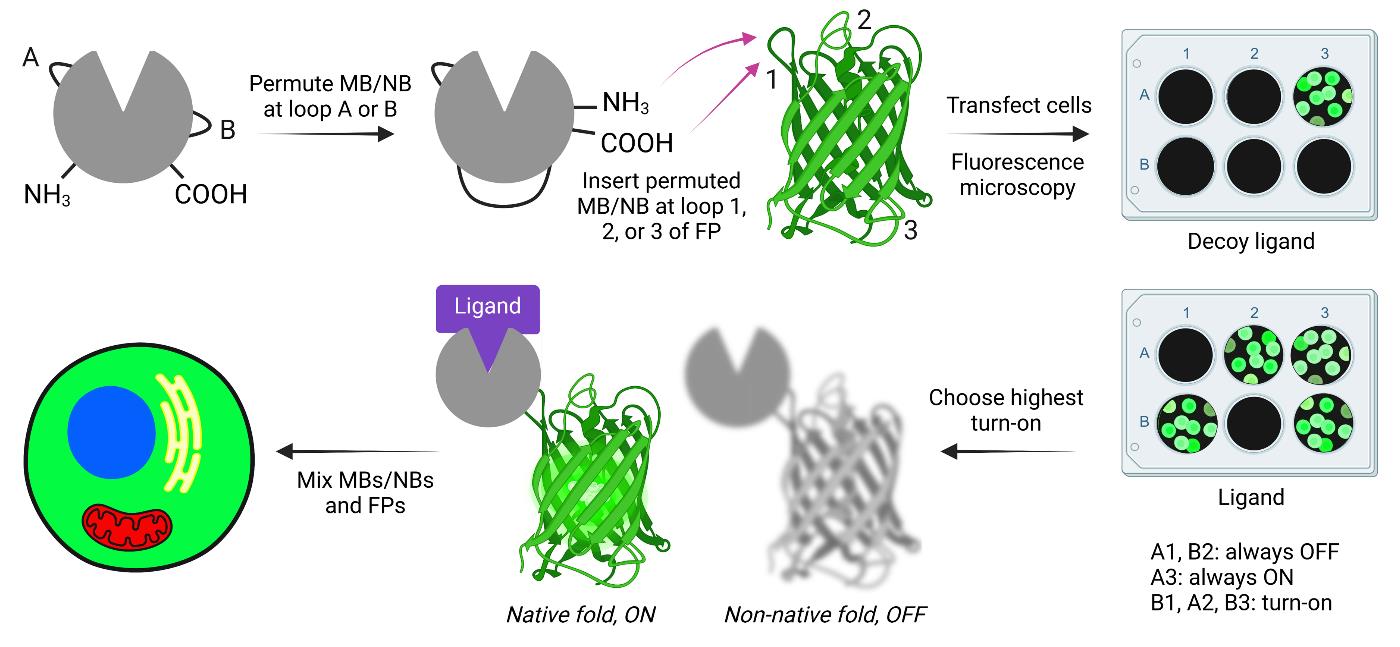
Creating and screening adaptable turn-on maturation (ATOM) biosensors. MB, NB, and FP indicate monobody, nanobody, and fluorescent protein, respectively.
Background
Fluorescent protein biosensors (FPBs) consist of a ligand binding domain coupled to a fluorescent protein (FP), such that binding to the former causes the latter to change the color and/or intensity of its fluorescence. Traditionally, there have been two main mechanisms by which FPBs operate: 1) ligand binding causes a change in the physicochemical environment of the mature chromophore (consisting of three consecutive amino acids that have undergone cyclization and oxidation), or 2) ligand binding either prevents the biosensor from degradation or activates transcription of the biosensor. We recently described a third mechanism, adaptable turn-on maturation (ATOM), in which ligand binding triggers chromophore maturation.
ATOM biosensors are constructed by inserting a circularly permuted binding domain into a surface loop or turn of a fluorescent protein (FP). The amino-to-carboxy terminal distance of most binding domains is too long to be compatible with insertion into surface turns without causing the FP and binding domains to undergo mutually exclusive folding when fused [1]. The binding domains must therefore be circularly permuted first to reduce the distance between their termini. Permutation also serves the purpose of destabilizing the binding domain, which is likely important for the ATOM mechanism. The FP is held in a conformation that does not allow the maturation of its chromophore. Ligand binding then facilitates the folding of the binding domain and FP domain, resulting in chromophore maturation and irreversible intensiometric turn-on.
A key feature of ATOM is that the sensing mechanism is modular and appears to be general. Two different binding domains—monobodies (MBs; ~11 kDa) and nanobodies (NBs; ~14 kDa)—have been shown to be compatible with ATOM [2]. Composed of antiparallel beta strands connected by loops and turns, MBs and NBs recognize ligands via three complementarity-determining loops, leaving the remaining turns (two for MBs and three for NBs) available for circular permutation and fusion into the FP (see section B). MBs and NBs can be adapted to recognize a variety of ligands by in vitro and in vivo selection methods, respectively. We demonstrated generalizability by making ATOM biosensors for four protein targets (WDR5, hRAS, SH2, and mCherry, including the nonfluorescent F70A mCherry variant) with FPs of three colors (mTurquoise, mClover, and mTagRFP). ATOMs function well in the cytoplasm, nucleus, mitochondria, and endoplasmic reticulum [2].
The protocols in this paper detail the steps required to build ATOM biosensors by joining MBs and NBs to FPs of various colors. We also include general considerations if the reader wishes to create ATOM sensors using binding domains other than MBs and NBs (see General Notes 1–3).
Materials and reagents
Biological materials
1. TOP10 chemically competent E. coli cells (Thermo Fisher Scientific, catalog number: C404010)
2. HEK 239T human epithelial-like cells (ATCC, catalog number: CRL-3216)
3. HeLa human epithelial cells (ATCC, catalog number: CCL-2)
4. pCMV-MBP-yATOM_SH2 for expressing y-ATOMSH2 biosensor in mammalian cells (Addgene plasmid # 209708; http://n2t.net/addgene:209708; RRID: Addgene_209708)
5. pCMV-MBP-yATOM_WDR5 for expressing y-ATOMWDR5 biosensor in mammalian cells (Addgene plasmid # 209706; http://n2t.net/addgene:209706; RRID: Addgene_209706)
6. pCMV-MBP-yATOM_mCherry for expressing y-ATOMmCh biosensor in mammalian cells (Addgene plasmid # 209707; http://n2t.net/addgene:209707; RRID: Addgene_209707)
7. pCMV-MBP-yATOM_RAS for expressing y-ATOMRAS biosensor in mammalian cells (Addgene plasmid # 209709; http://n2t.net/addgene:209709; RRID: Addgene_209709)
8. pCMV-RBP_WDR5 for expressing WDR5 in mammalian cells (Addgene plasmid # 209702; http://n2t.net/addgene:209702; RRID: Addgene_209702)
9. pCMV-mCherry (Y70A) for expressing the Y70A (nonfluorescent) mutant of mCherry in mammalian cells (Addgene plasmid # 209703; http://n2t.net/addgene:209703; RRID: Addgene_209703)
10. pCMV-SH2 for expressing SH2 domain in mammalian cells (Addgene plasmid # 209704; http://n2t.net/addgene:209704; RRID: Addgene_209704)
11. PCMV-hRAS (G12V) for expressing hRAS G12V in mammalian cells (Addgene plasmid # 209705; http://n2t.net/addgene:209705; RRID: Addgene_209705)
Reagents
1. Rabbit anti-GFP polyclonal antibody, Alexa Fluor594 (Thermo Fisher Scientific, catalog number: A21312)
2. Rabbit anti-tagRFP polyclonal antibody (Thermo Fisher Scientific, catalog number: R10367)
3. Goat anti-rabbit IgG secondary antibody, Alexa Fluor488 (Thermo Fisher Scientific, catalog number: A11008)
4. Agar (BD Difco, catalog number: 214510)
5. AquaPor LE GTAC agarose (National Diagnostic, catalog number: EC-202-500)
6. Blocking solution (with BSA) 5% in tris-buffered saline (TBS) (Thermo Fisher Scientific, catalog number: J62637.AP)
7. Calcium chloride (CaCl2) dihydrate (J.T. Baker, catalog number: 1332-01)
8. Collagen type I, rat tail (Corning, catalog number: 354236)
9. Deoxynucleotide (dNTP) solution mix (New England Biolabs, catalog number: N0447L)
10. DMEM, high glucose, GlutaMAX supplement, pyruvate (Thermo Fisher Scientific, catalog number: 10569010)
11. DMEM, high glucose, HEPES, no phenol red (Thermo Fisher Scientific, catalog number: 21063029)
12. DpnI restriction endonuclease (New England Biolabs, catalog number: R0176S)
13. DreamTaq DNA polymerase (Thermo Fisher Scientific, catalog number: K1082)
14. Fetal bovine serum (FBS), heat-inactivated (Thermo Fisher Scientific, catalog number: A5670801)
15. GeneJET Gel Extraction kit (Thermo Fisher Scientific, catalog number: K0692)
16. GeneJET Plasmid Miniprep kit (Thermo Fisher Scientific, catalog number: K0503)
17. GeneJET PCR Purification kit (Thermo Fisher Scientific, catalog number: K0702)
18. HEPES (Fisher BioReagents, catalog number: BP310)
19. LB broth, Miller (BD Difco, catalog number: 244610)
20. Kanamycin sulfate (MP Biomedicals, catalog number: 0219453105)
21. Monosodium phosphate monohydrate (J.T. Baker, catalog number: 3818)
22. Paraformaldehyde (PFA), 32% w/v aqueous solution (Thermo Scientific Chemicals, catalog number: 047377.9L)
23. Penicillin-streptomycin (pen/strep) (10,000 units/mL) (Thermo Fisher Scientific, catalog number: 15140122)
24. Phusion high-fidelity DNA polymerase (New England Biolabs, catalog number: M0530S)
25. Q5 high-fidelity DNA polymerase (New England Biolabs, catalog number: M0491L)
26. Sodium chloride (NaCl) (VWR BDH Chemicals, catalog number: BDH9286)
Solutions
1. HEK 293T cell growth media (see Recipes), used in steps F1 and F4
2. 2× HBS (see Recipes), used in step F2
3. PBS (see Recipes), used in steps G2, G4, G8, G10, G11, and H2
4. 3% PFA (see Recipes), used in step G3
Recipes
1. HEK 293T cell growth media
| Reagent | Final concentration | Volume |
|---|---|---|
| DMEM | n/a | 500 mL |
| FBS | 9% | 50 mL |
| Pen/strep | 99 units/mL | 5.5 mL |
| Total | n/a | 555.5 mL |
HEK 293T growth media can be stored at 4 °C for several weeks.
2. 2× HBS
| Reagent | Final concentration | Final pH |
|---|---|---|
| HEPES | 50 mM | 7.0 |
| Monosodium phosphate | 1.5 mM | 7.0 |
| NaCl | 140 mM | n/a |
2× HBS should be frozen at -20 °C in single-use aliquots. Once thawed, any HBS not used that day should be discarded.
3. PBS
| Reagent | Final concentration | Final pH |
|---|---|---|
| Monosodium phosphate | 20 mM | 7.4 |
| NaCl | 150 mM | n/a |
PBS can be stored at room temperature indefinitely if sterility is maintained.
4. 3% PFA
| Reagent | Final concentration | Volume |
|---|---|---|
| PFA (32% stock) | 3% | 468 μL |
| PBS | n/a | 4.532 mL |
| Total | n/a | 5 mL |
3% PFA is prepared fresh for each day’s experiments. The 32% PFA stock solution should be stored at -20 °C in single-use aliquots. Ensure that the stock PFA aliquot is completely thawed and resuspended prior to making the working solution. If needed, heat the stock solution to 42 °C and periodically vortex until fully dissolved.
Laboratory supplies
1. 24-well treated tissue culture plates (NEST, catalog number: 702001)
2. 15 mm coverslip (CELLTREAT Scientific Products, catalog number: 229172)
3. Microscope slides (Fisher Scientific, catalog number: 12-550-143)
Equipment
1. Zeiss Axiovert 200 m inverted microscope with a 10×/0.3 Plan-Neofluor objective
2. Zeiss Axioimager Z1 upright microscope with 10×/0.25 A-plan objective
3. Leica SP8 confocal microscope with 63× oil immersion objective
4. Filter cubes for Zeiss microscopes (Table 1)
Table 1. Filter cube specifications for imaging fluorescent proteins and dyes
| Dye | Excitation | Emission | Dichroic | Zeiss Filter # |
|---|---|---|---|---|
| mTurquoise | 436/20 | 480/40 | 455 | 47 |
| mClover | 500/20 | 535/30 | 515 | 46 |
| mTagRFP-t | 545/25 | 605/70 | 570 | 43 |
| Alexa 595 | 560/40 | 630/75 | 585 | 45 |
| Hoechst | 365 | 445/50 | LP 395 | 49 |
Software and datasets
1. Prism v. 10.4 (GraphPad, 10/23/2024)
2. Fiji [3]
3. PyMol v 3.0 (Schrödinger, LLC)
Procedure
A. Choose the binding domain and FP
1. The choice of binding domain is dictated by the availability of an MB or NB for the desired target. Many such MBs and NBs have been published, and methods for generating custom MBs and NBs have been described elsewhere. We have generally obtained better results using MBs, possibly because they lack the cysteines that are present in most NBs.
2. ATOM biosensors have been created using cyan (mTurquoise), yellow (mClover with Tyr at position 203), and red (mTagRFP) FPs. Table 1 lists the approximate excitation and emission wavelengths of these FPs as well as chemical dyes used in this protocol, along with microscope filter cubes used for their imaging (section H). The protocol steps are identical apart from minor differences in amino acid numbering between FPs and microscope filter settings used in imaging.
a. mTurquoise and mClover FPs used in existing ATOM biosensors were circular permutants. We recommend using these permutants because they performed better than their non-permuted counterparts, perhaps due to the reduced stability of the former. Amino acid sequences of FPs are listed in Figure 1. Nucleotide sequences of ATOM biosensor genes (Biological materials 4–7) are available for download from Addgene.
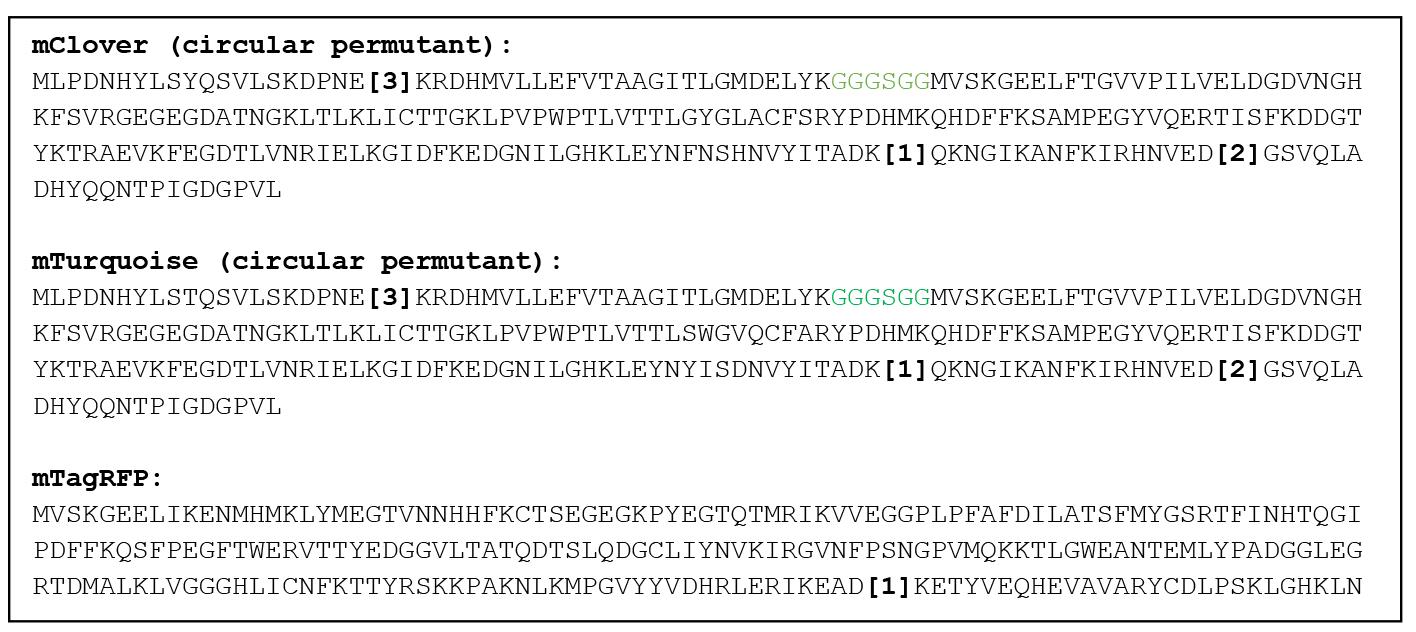
Figure 1. Amino acid sequences of fluorescent proteins (FPs) used to make adaptable turn-on maturation (ATOM) biosensors. Numbers in brackets indicate positions into which circularly permuted binding domains are to be inserted in section C. Green residues in the circular permutants are linkers used to connect the amino and carboxy termini of the original FPs.
B. Design genes for MB or NB permutants
1. For MB domains, design sequences of genes encoding two circular permutants (MBA and MBB). This procedure is illustrated using the amino acid sequence of the MB that recognizes hRAS (MBRAS [4] (Figure 2, top)). Design the MBA gene such that it begins by coding amino acids 41–95 of MBRAS (blue), continues through an 18-AA linker (green), and ends by encoding residues 1–40 of MBRAS (red) (Figure 2, middle). Design the MBB gene in an analogous fashion [coding for residues 65–95 (blue), linker (green), residues 1–64 (red)] (Figure 2, bottom).
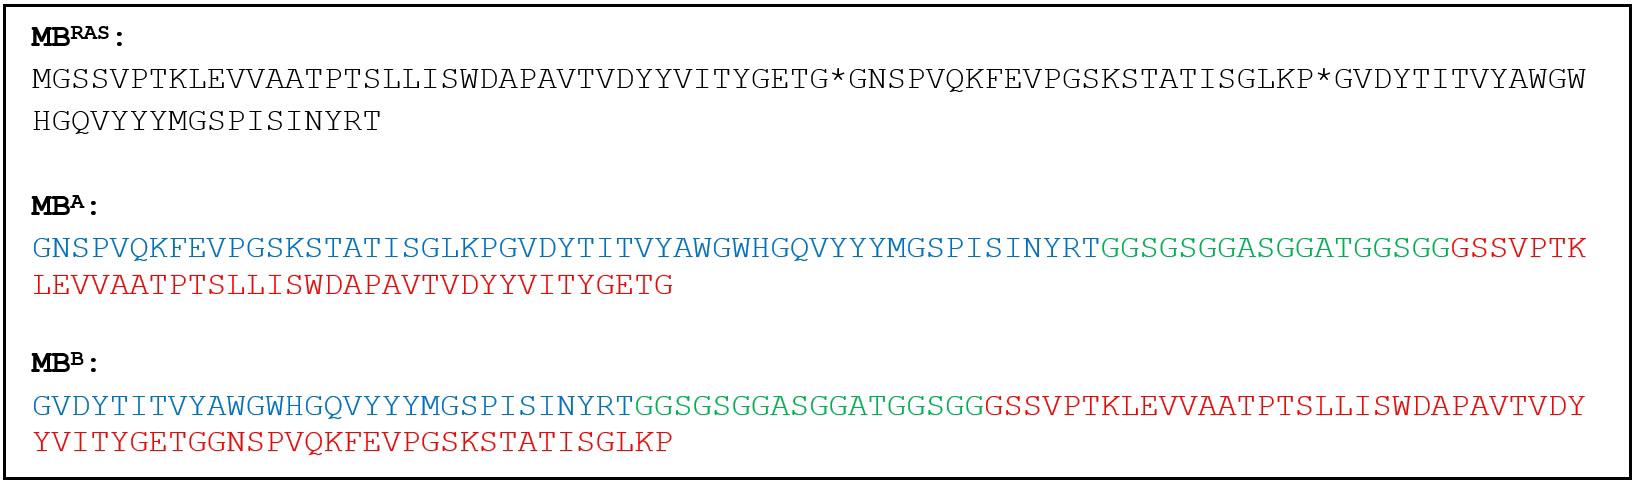
Figure 2. Amino acid sequences of MBRAS, MBA, and MBB. Asterisks in the MBRAS sequence are in between residues 40–41 and 64–65 and indicate the sites of circular permutation used to make MBA and MBB. In MBA and MBB, blue and red correspond to the C-terminal and N-terminal (respectively) portions of the MBRAS sequence, and green indicates the linkers used to connect the original amino and carboxy termini of MBRAS.
When applying this step to other MBs, amino acid numbering will vary slightly. However, permutation sites A and B will usually be identical and can be identified by the TG*GN and KP*GV amino acid patterns (Figure 2, top) in their respective (approximate) locations in the sequence of the new MB. Use the same amino acid linker (green in Figure 2) for all MBs.
2. For NB domains, design sequences of genes coding for three circular permutants (NBA, NBB, and NBC; demonstrated in Figure 3 for NBmCh, the NB variant that binds mCherry as well as the nonfluorescent F70A mutant of mCherry) [5]. Perform this as in Figure 2, using a sequence that encodes for a 32-AA linker peptide to account for the longer N-to-C distance of NBs. Like MBs, NBs will differ in their amino acid numbering, but the non-binding loops tend to be invariant, and permutation sites A, B, and C can be readily identified from the respective AG*GS, AP*GK, and DS*VK sequences in NBmCh. Use the same amino acid linker (green in Figure 3) for all NBs.
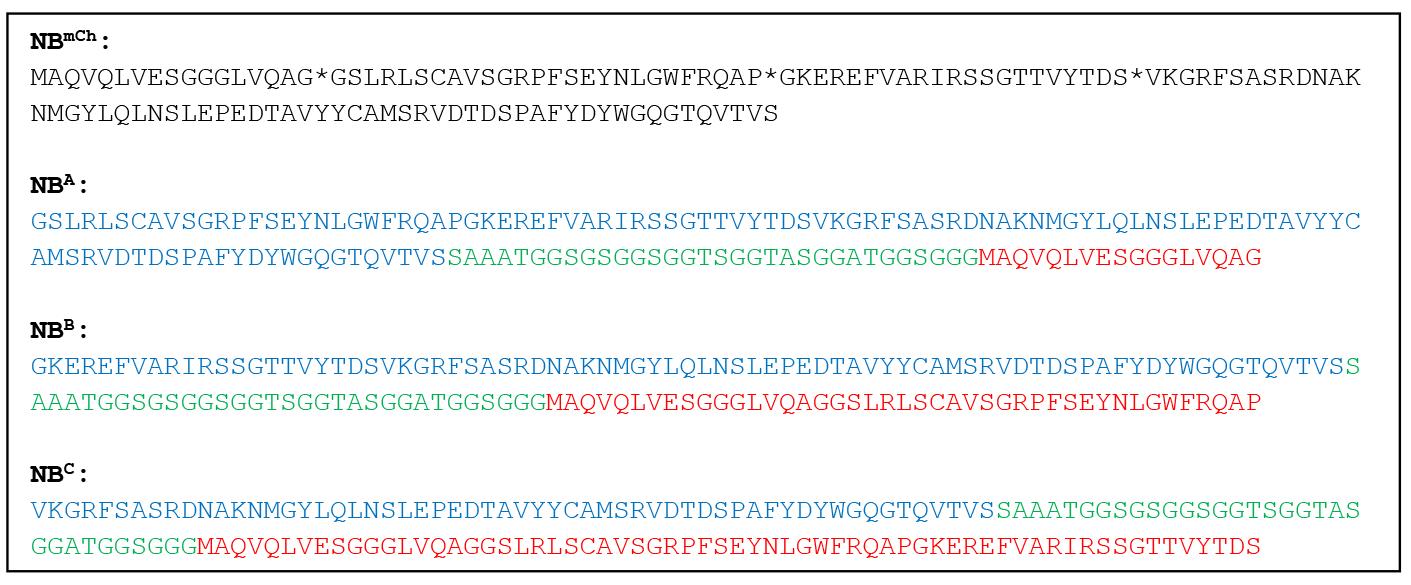
Figure 3. Amino acid sequences of NBmCh, NBA, NBB, and NBC. Asterisks in the NBmCh sequence indicate the sites of circular permutation used to make NBA, NBB, and NBC. In NBA, NBB, and NBC, blue and red correspond to the C-terminal and N-terminal portions of the NBmCh sequence, respectively, and green indicates the linkers used to connect the original amino and carboxy termini of NBmCh.
C. Choose the subcellular localization for the biosensor and insert FP gene into the expression plasmid
1. ATOM genes are sufficiently short for commercial synthesis (<1,200 bp without expression or localization tags). If this is done, skip to section E.
2. Decide whether the ATOM biosensor should be expressed with the aid of maltose binding protein (MBP). Fusing MBP to the N-terminus of the FP domain typically increases the brightness of cell images, but leaving it off can result in higher turn-on ratios due to lower background fluorescence. We therefore recommend making both constructs. If the FP is to be expressed as an MBP fusion, the 5'-sequences for ER and mitochondrial import (see step C3 below) are placed at the 5'-end of the MBP gene, not the FP gene, as those tags must be at the extreme N-terminus of the protein.
3. Choose the cellular compartment to which the ATOM biosensor should be directed.
a. For targeting the biosensor to the ER, append nucleotide sequences to the 5' and 3' ends of the FP gene to encode for the amino acid sequences shown in Figure 4A. These amino acid sequences consist of the prolactin signal sequence [6] and ER retention tag [7] at the amino and carboxy termini, respectively.
b. For targeting the biosensor to mitochondria, append the nucleotide sequence to the 5'-end of the FP gene to encode for the amino acids shown in Figure 4B. This sequence codes for the COX4 mitochondrial localization tag [8] at the amino terminus.
c. For targeting the biosensor to the nucleus, append the nuclear localization sequence to either the 5'-end or the 3'-end of the FP gene as shown in Figure 4C. We chose to place it at the 5'-end of biosensor genes. This sequence codes for the SV40 large T antigen nuclear localization tag [9]. The nuclear localization sequence can be placed at either terminus of the protein for efficient nuclear transport, unlike the ER and mitochondrial import tags, which must be at the amino terminus.
d. For targeting the biosensor to the cytoplasm, do not add any additional sequences to the FP gene.
4. Insert the gene created in step C3 into the desired expression plasmid. ATOM biosensors have been expressed in mammalian cells under the CMV promoter using a pCMV-based plasmid (see Biological materials). Other promoter and plasmid combinations are possible.
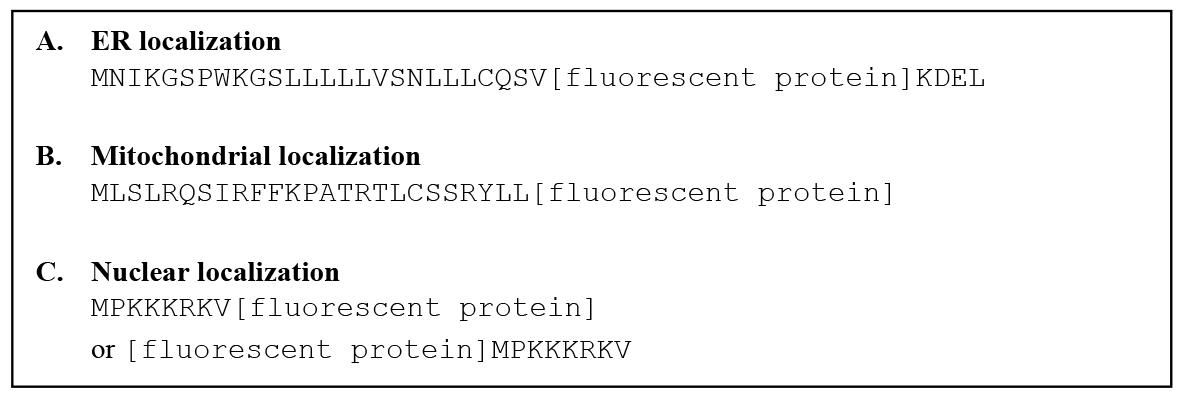
Figure 4. Amino acid sequences of fluorescent proteins (FPs) showing placement of subcellular localization tags
D. Clone ATOM biosensor genes
1. ATOM biosensor genes are created in two PCR steps using the MEGAWHOP cloning method [10], in which the binding domain gene selected in section B is inserted into the FP gene created in section C. Note that no additional nucleotides are introduced when joining the binding domain gene to the FP gene, and the resulting fusion protein does not contain any peptide linkers between the two proteins. The final product is the biosensor gene in the expression plasmid, ready to transfect into cells.
2. Design PCR primers P1 and P2 (Figure 5A). P1 consists of 20–24 nt complementary to the 5' side of the insertion site in the FP gene (orange) and 20–24 nt complementary to the 5' end of the MB or NB gene (cyan). P2 is of the same design as P1, except complementary to the opposite strand. The exact number of nt is adjusted to make the melting temperatures (Tm) appropriate to the polymerase being used (e.g., ~65 °C for Q5 high-fidelity DNA polymerase). Use the online tool from New England Biolabs to calculate Tm values (https://tmcalculator.neb.com). Make note of the recommended annealing temperatures. Examples of P1 and P2 are shown in Figure 5C for inserting MBA (from Figure 2) into position 1 of mClover (from Figure 1).
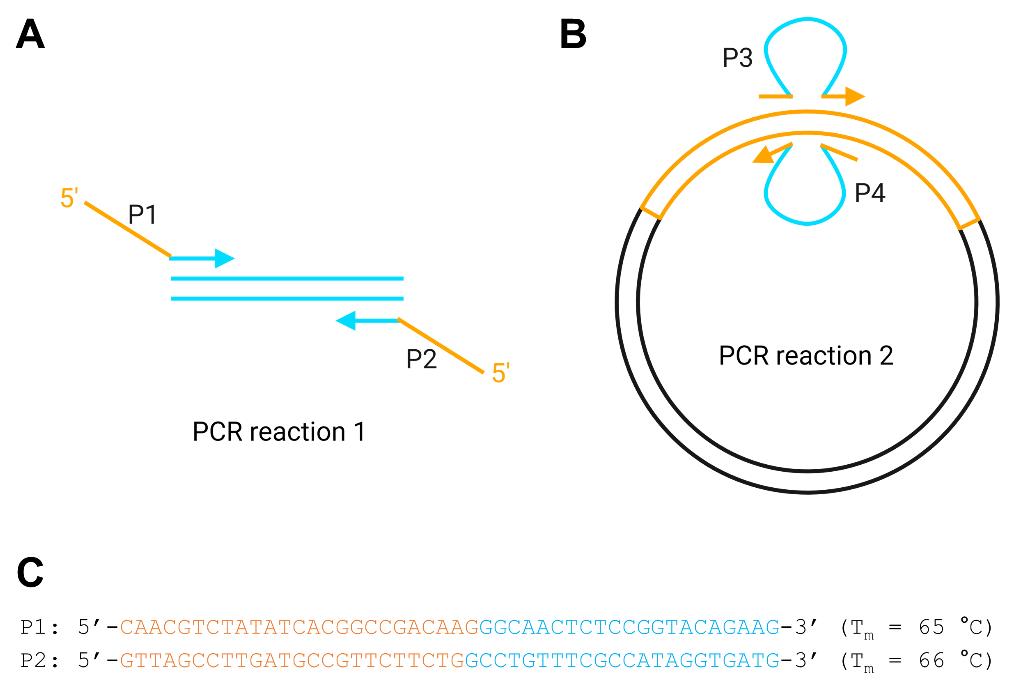
Figure 5. Creating biosensor genes in plasmid expression vectors. Orange and cyan lines represent fluorescent protein (FP) and monobody/nanobody (MB/NB) gene sequences, respectively. (A) PCR reaction 1 generates megaprimers P3 and P4 consisting of the full MB/NB sequence with tails complementary to the points of insertion in the FP gene. (B) PCR reaction 2 inserts the binding domain gene into the FP gene that was previously introduced into the expression plasmid (black lines). (C) Examples of P1 and P2 are shown for inserting MBA into position 1 of mClover.
3. Carry out PCR reaction 1 (Figure 5A) using the MB or NB gene from section B as the template. We use Q5 polymerase for this step. Mix the reagents in Table 2 on ice.
Table 2. Components of PCR reaction 1 and PCR reaction 2
| Reagent | PCR reaction 1 (50 μL total) | PCR reaction 2 (25 μL total) |
|---|---|---|
| Reaction buffer (5×, from kit) | 10 μL of Q5 polymerase buffer | 5 μL of Phusion polymerase buffer |
| Primers | 2.5 μL of 10 μM primer P1 and 2.5 μL of 10 μM primer P2 | 1–3 pmol (total) of primers P3 and P4, purified in step D4 |
| dNTPs (10 mM) | 1.0 μL | 0.5 μL |
| Template | 10–50 ng (total) | 5–25 ng of plasmid (total) |
| Polymerase (from kit) | 0.3 μL of Q5 polymerase | 0.3 μL of Phusion polymerase |
| H2O | Adjust to 50 μL of total volume | Adjust to 25 μL of total volume |
Perform PCR reaction 1 following the specifications in Table 3, inserting the annealing temperature that was calculated in step D2.
Table 3. Thermal cycling conditions for PCR reaction 1 and PCR reaction 2
| Step | PCR reaction 1 | PCR reaction 2 |
|---|---|---|
| Initial denaturation (1 cycle) | 98 °C, 30 s | 98 °C, 60 s |
| Amplification (25–30 cycles) | 98 °C, 10 s Annealing temperature, 15 s 72 °C, 10 s per kb | 98 °C, 30 s Annealing temperature, 30 s 72 °C, 30–60 s per kb |
| Final extension | 72 °C, 2 min | 72 °C, 5 min |
4. Purify the products of PCR reaction 1 from agarose gel using the GeneJET Gel Extraction kit following the manufacturer’s instructions. These are the megaprimers P3 and P4 used in PCR reaction 2 (Figure 5B).
5. Carry out PCR reaction 2 (Figure 5B) with a plasmid containing the FP gene from Figure 1 as the template, to make the full-length ATOM biosensor gene. We use Phusion high-fidelity polymerase for PCR reaction 2. Mix the reagents on ice according to Table 2. Calculate the annealing temperature of primers P3 and P4 as described in step D2 and perform the thermal cycles as specified in Table 3.
6. Digest the mixture with 1 μL of DpnI per 50 μL of PCR reaction 2 to degrade the template plasmid (37 °C, 2–3 h).
E. Amplify plasmid DNA by transforming into E. coli
1. Thaw competent TOP10 cells by transferring frozen cells from -80 °C to ice. Cells must be kept on ice until heat shock.
2. Add up to 5 μL of amplified, DpnI-digested plasmid DNA (step D6) to 50 μL of competent cells. Mix by gently pipetting up and down 4–6 times. Do not vortex. Incubate the cells on ice for 30 min.
3. Heat shock the cells by placing them in a 42 °C water bath for 30 s and then transferring them back to ice for 2 min.
4. Add 1 mL of LB broth (with no antibiotics) and shake at 200 rpm for 1 h at 37 °C.
5. Spread 100 μL of the sample on an LB agar plate supplemented with the antibiotic appropriate to the plasmid being used (30 mg/mL kanamycin for the pCMV-based plasmids in this protocol). Centrifuge the remaining cells in a tabletop microfuge (9,300 rcf, 4 min, room temperature), then resuspend cells in 100 μL of LB and spread on a second plate. Incubate the plates at 37 °C overnight.
6. Screen colonies by colony PCR.
a. Select 8–20 colonies and mark them with numbers on the plate.
b. Touch a fresh pipette tip to each colony and transfer the cells to 2.5 μL of H2O in numbered PCR tubes.
c. Perform colony PCR using the P1 and P2 primers from step D2 and the DreamTaq DNA polymerase, following the manufacturer’s instructions.
d. Determine the colonies that yielded the expected P3 and P4 PCR products. This is done by running the colony PCR reactions on an agarose gel, along with the products of PCR reaction 1 (from step D4) as a positive control. Positive colonies will yield bands of the same size as the positive control.
7. Select one colony determined from step E6d, inoculate into 5 mL of LB with 30 mg/mL kanamycin, and shake at 200 rpm for 10–16 h at 37 °C.
8. Purify plasmid DNA using the GeneJet Plasmid Miniprep kit following the manufacturer’s protocol. Sequence the entire biosensor gene to verify no cloning errors were introduced.
F. Screen biosensor performance in HEK 293T cells
1. One day before transfection, split cells in a 24-well plate containing 0.5 mL of HEK 293T cell growth media such that they reach ~80% confluency at the time of transfection (~2 × 10⁵ cells per well). The dilution factor depends on a variety of growth conditions, so we recommend ensuring ideal confluency by making several dilutions at this step.
2. Prepare the plasmid mixture for transfection according to the following recipe. Use Table S1 to calculate the recipe for different plate sizes.
Ingredients (calculated for one well of a 24-well plate):
a. Plasmids expressing biosensor and target ligand, 1:1 ratio (w/w), 500 ng of total DNA. For the fluorescence baseline control, replace the plasmid expressing the target ligand with a plasmid expressing a decoy ligand.
b. CaCl2, 5 μL of 2 M stock.
c. H2O, up to 50 μL.
d. 2× HBS, 50 μL of 2× stock.
Place 100 μL water in a 1.5 mL microfuge tube and determine the maximum vortex speed such that the solution does not splash out when the tube is open. In a fresh microfuge tube, mix plasmids, CaCl2, and H2O and vortex. Open the tube and, while vortexing, add 2× HBS. Close the tube and incubate it at room temperature for 20–30 min without vortexing or shaking.
3. Add the plasmid solution dropwise to the cells that were plated the previous day. Mix by gently swirling.
4. Replace the plate with fresh HEK 293T cell growth media 16–24 h after transfection. We recommend that the fresh media be prewarmed to 37 °C before adding to the plates, but room temperature media is acceptable.
5. Image the cells 36–48 h after transfection (section H). If desired, cells can be fixed and antibody-stained at this time (section G).
G. Fix cells and antibody stain
1. Staining the cells with an antibody that recognizes the FP domain of the ATOM biosensor aids the screening process in two ways. First, it identifies which cells were successfully transfected so that they can be segmented and analyzed (section I). Second, it helps troubleshoot in the event that cells expressing the target ligand exhibit little or no fluorescence (see Troubleshooting). Care must be taken to use antibodies (such as those listed in Reagents) that are labeled with dyes whose excitation and emission spectra are sufficiently removed from those of the ATOM biosensor that crosstalk is negligible or that the two signals can be reliably unmixed.
2. Replace the growth medium in the plate wells with 500 μL of PBS, gently shake for 10 s, and discard. Repeat.
3. Add 500 μL of 3% PFA to each well to fix the cells. Shake gently at room temperature for 20 min.
4. Discard PFA and wash the cells three times with PBS by repeating step G2, except with 5 min of shaking each time.
5. Fixed cells can be stored at 4 °C for 2 weeks before antibody staining.
6. Add 300 μL of blocking solution containing 0.25% Triton X-100 and shake the plate for 30 min. While the cells are shaking, prepare antibody staining solution by diluting the primary antibody 1:1,000 into blocking solution. If using a fluorescently tagged primary antibody, skip to step G10.
7. Discard the blocking solution and add 300 μL of antibody staining solution containing 0.25% Triton X-100 into each well. Shake for 1 h.
8. Discard the staining solution and wash with PBS containing 0.25% Triton X-100 three times as described in step G4.
9. Dilute the secondary antibody 1:1,000 into blocking solution containing 0.25% Triton X-100 and add 300 μL into each well. Shake for 1 h.
10. Repeat the PBS wash three times as described in step G4.
11. Proceed to imaging (section H). If needed, stained cells can be stored in PBS at 4 °C for 2 weeks without any fading of signal.
H. Image cells
1. If imaging live cells, replace the media with DMEM without phenol red. For fixed and stained cells, PBS can be used.
2. If using an inverted microscope, the plates can be mounted directly on the stage using an appropriate adapter. For an upright microscope, the cells should be grown on round 15 mm coverslips and prepared as follows:
a. Add 50 μL of PBS on a microscope glass slide.
b. Carefully lift the coverslips using needle forceps and slowly mount on the glass slides by placing the edge first and then lowering the rest of the coverslip starting from an angle.
c. Blot the coverslip five times with Kimwipes to dry the surface.
d. If needed, seal the coverslips by applying nail polish to the edge.
3. Image cells using the microscope manufacturer’s instructions. We recommend using a 12- or 16-bit camera sensor and a 10× objective to visualize enough cells for statistical analysis. Use the filter cubes listed in Table 1.
4. Image the positive controls (biosensors with target ligands) first to determine the intensity of the light source and integration time such that few to no pixels are saturated. Use these settings to image all the wells.
5. Record at least three images of randomly chosen fields of view for each sample and then pool these together to analyze as a single experiment.
6. Save the images in a format supported by Fiji. If Fiji cannot read the native format, export the data as tiff files.
I. Analyze cell image data
1. Cell images can be analyzed either manually by drawing a region of interest (ROI) around each cell or automatically using a reference image. The latter requires a channel that marks cells and is independent of the biosensor fluorescence. One can use either antibody staining (section G), nuclear staining (Hoechst or DAPI), or co-transfection with a fluorescent protein such as mCherry.
2. For manual analysis, follow these steps:
a. Set the program to measure cell intensity by Analyze > Set Measurements and ensuring that Mean Gray Value is selected.
b. Background subtract the image using Process > Subtract Background. Start with a 50-pixel rolling ball radius for a 10× objective.
c. Use the Freehand Selection tool to manually draw around the periphery of the cell.
d. Use the keyboard shortcut Ctrl+m to measure the intensity of the cell.
e. Repeat steps I2c and I2d for 20–30 cells in each image, selecting the cells randomly.
3. For automated analysis, Fiji’s Analyze Particles can be used. We note that more accurate cell segmentation software exists, such as StarDist, Cellpose, and others [11–13]. However, we find Analyze Particles to be sufficient for screening purposes. The macro below can be used to perform background subtraction, thresholding, and analysis. An example of automated analysis is shown in Figure 6, using the ATOM biosensor for mCherry (y-ATOMmCh) [2]. Examples of SegmentAlone.ijm and MeasureAlone.ijm macros are included as Dataset S1.
a. Open the macro SegmentAlone.ijm in Fiji.
b. For the variable RegistryChannel, select which channel is displaying the constant marker (antibody, nuclear stain, or co-expressed fluorescent protein) independent of the biosensor.
c. The current macro uses Otsu’s method for thresholding, but this can be changed in line 29 to another method if needed.
d. Set the size to 100-Infinity in line 31.
e. Click Run. The cell outlines and the ROI list will be displayed.
f. The cells are marked with the corresponding ROI number. If a cell needs to be excluded from an analysis, delete the ROI corresponding to the cell in the ROI manager. Similarly, if a cell needs to be included, manually draw an outline according to step I2 and click on Add in the ROI manager.
g. If the selected cells are satisfactory, open the MeasureAlone.ijm macro and click Run. The results from both channels will be summarized for each cell.
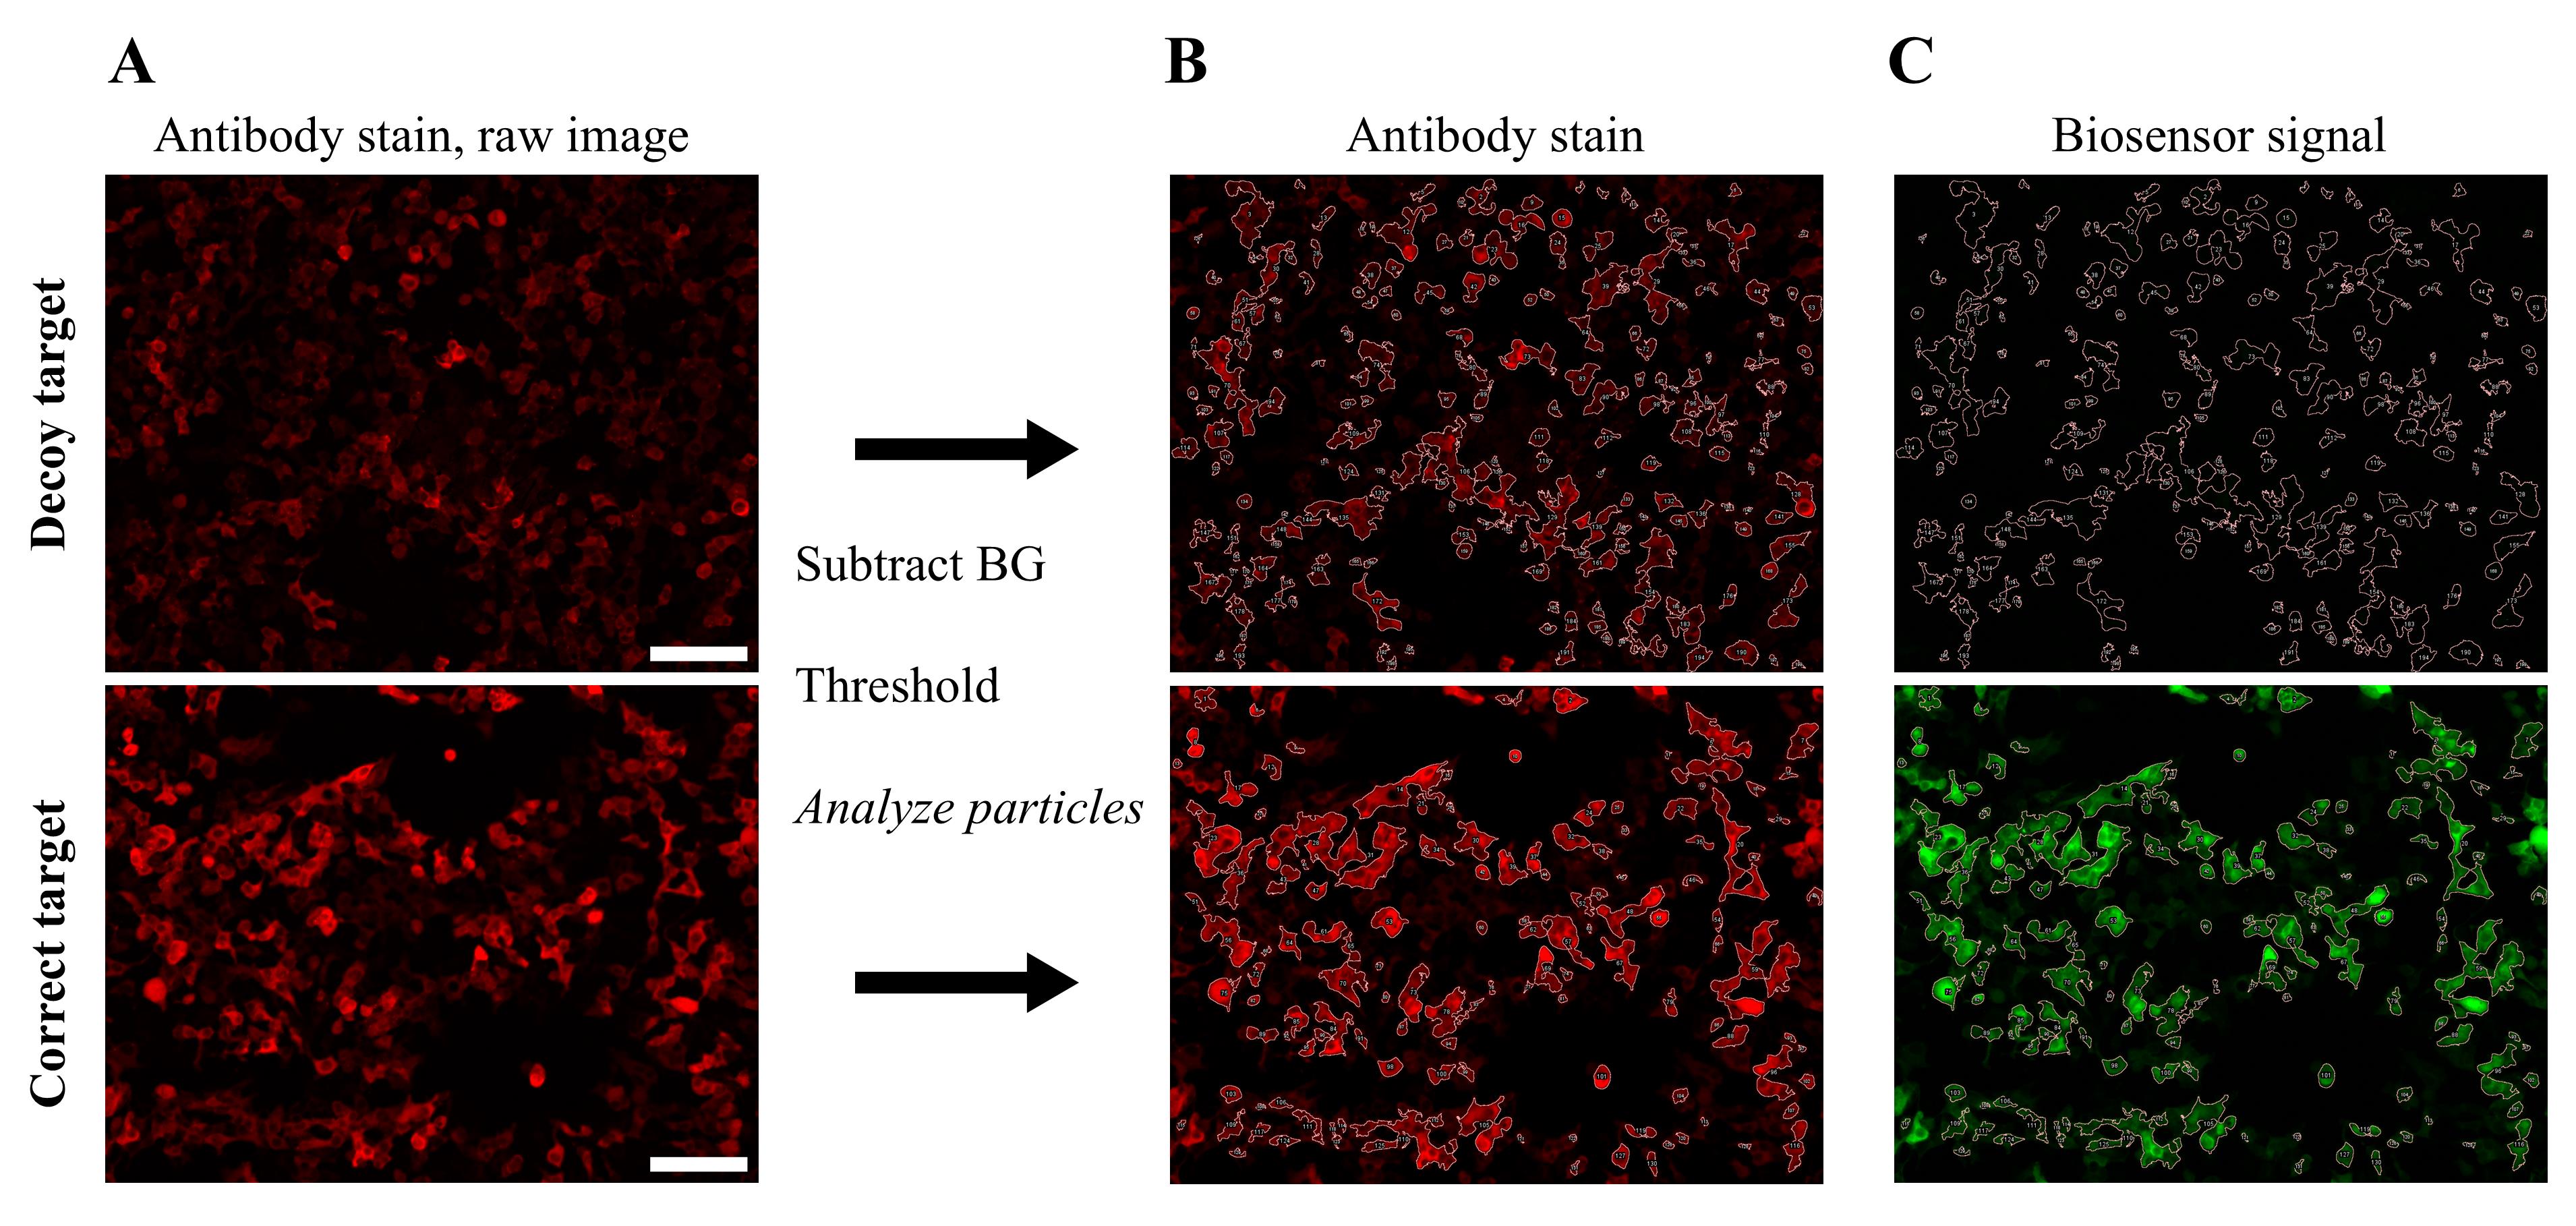
Figure 6. Automated cell analysis demonstrated with y-ATOMmCh. HEK 293T cells were transfected with one plasmid encoding y-ATOMmCh and a second plasmid expressing either decoy target (hRAS) or correct target (mCherry containing the Y70A mutation that rendered it nonfluorescent). y-ATOMmCh binds equally well to mCherry and the Y70A variant; the latter was used here to avoid interfering with the fluorescence of the Alexa Fluor594-labeled antibody (item 1 in Reagents) that recognized the mClover domain of the biosensor. Cells were stained with this antibody to quantitate the total expression of the biosensor. (A) Raw, two-channel images were analyzed using the SegmentAlone.ijm macro in Fiji. (B) The antibody channel was selected for identifying cells. (C) The same mask was then applied to the biosensor channel to measure biosensor signal intensity. Scale bar = 100 μm. Raw image files in Zeiss Vision Image format (mCherryNeg.zvi and mCherryPos.zvi) are included as Dataset S2.
J. Determine the best-performing ATOM biosensors
1. Using GraphPad Prism or comparable software, plot the intensities of cells expressing biosensor and target ligand and the intensities of cells expressing biosensor and decoy ligand (obtained from step I3g). At least 50 cells from each group should be plotted for statistical analysis.
2. Calculate the turn-on ratio by dividing the mean intensity of the cells expressing biosensor and target ligand (ON state) by the mean intensity of the cells expressing biosensor and decoy ligand (OFF state). The results of analyzing the images from Figure 6 are shown in Figure 7.
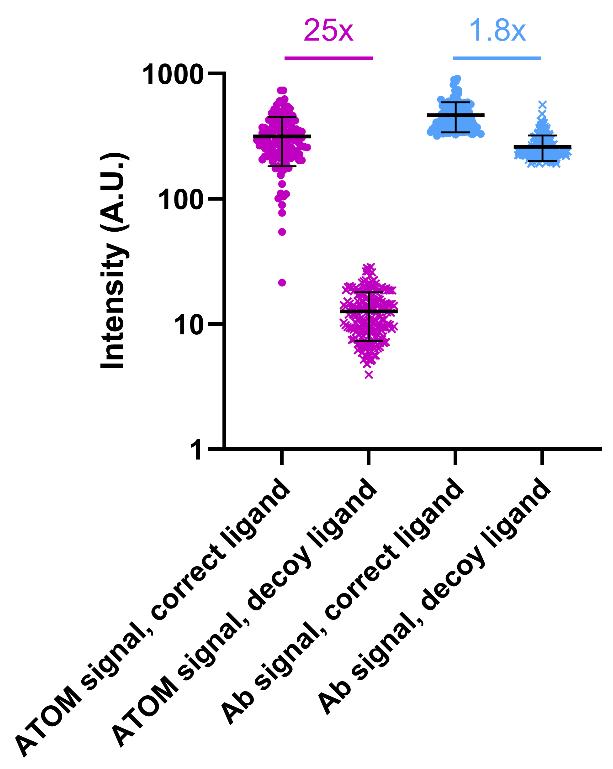
Figure 7. Quantification of y-ATOMmCh turn-on. Fluorescence intensities of HEK 293T cells expressing y-ATOMmCh and either the correct ligand (mCherry Y70A, circles) or a decoy ligand (hRAS, crosses) were measured according to step I3, using the images from Figure 6. Data points from the ATOM biosensor channel are magenta and data points from the antibody (Ab) channel are cyan. Turn-on ratios are indicated. Error bars correspond to the standard deviation. Data were obtained from a single transfection, and each symbol represents one cell (n = 131 for samples with correct ligand, n = 199 for samples with decoy ligand). The mean intensities were quantified using 12-bit images and are as follows: 316 ± 133 (ATOM signal, correct ligand) and 12 ± 5 (ATOM signal, decoy ligand), 466 ± 125 (Ab signal, correct ligand) and 261 ± 13 (Ab signal, decoy ligand). The GraphPad Prism file of cell fluorescence intensities is included as Dataset S3.
3. Functional ATOM biosensors will exhibit >5-fold turn-on ratio and reasonable brightness, i.e., will be detectable with the user’s microscope at acceptable light intensities and exposure times. Depending on the application, the reader may wish to use the ATOM biosensor with the greatest turn-on ratio, the highest brightness in the presence of the target ligand, or a balance of both.
K. Verify localization of biosensors to subcellular compartments
1. We recommend using HeLa cells for visualizing biosensor targeting to ER and mitochondria, as these organelles are more clearly defined in HeLa cells compared to HEK 293T cells.
2. Prepare the following two transfections, following the steps in section F. Transfection #1 consists of the plasmid expressing the biosensor (tagged with ER or mitochondrial localization sequence; section C) with a second plasmid encoding the cognate ligand tagged with the same ER or mitochondrial localization sequence. Transfection #2 is prepared identically except with a plasmid expressing the cognate ligand that lacks an ER or mitochondrial localization tag (negative control).
3. To assess the extent of subcellular targeting, image the above cells following the steps in section H (we typically image live cells). Transfection #1 cells should appear bright, as both biosensor and target ligand reside in the same subcellular compartment (ER or mitochondria). Transfection #2 cells should be mostly dark, as the target ligand is expected to be in the cytoplasm. The ratio of the two intensities provides an estimate of localization efficiency. An example of this procedure for HeLa cells transfected with plasmids expressing y-ATOMSH2 and SH2 ligand is shown in Figure 8A.
4. Further confirmation of ER and mitochondrial targeting can be obtained by confocal microscopy. At the higher resolution of the confocal microscope, the mesh-like pattern of the ER and tubular networks of mitochondria should be clearly visible in the transfection #1 cells (Figure 8B).
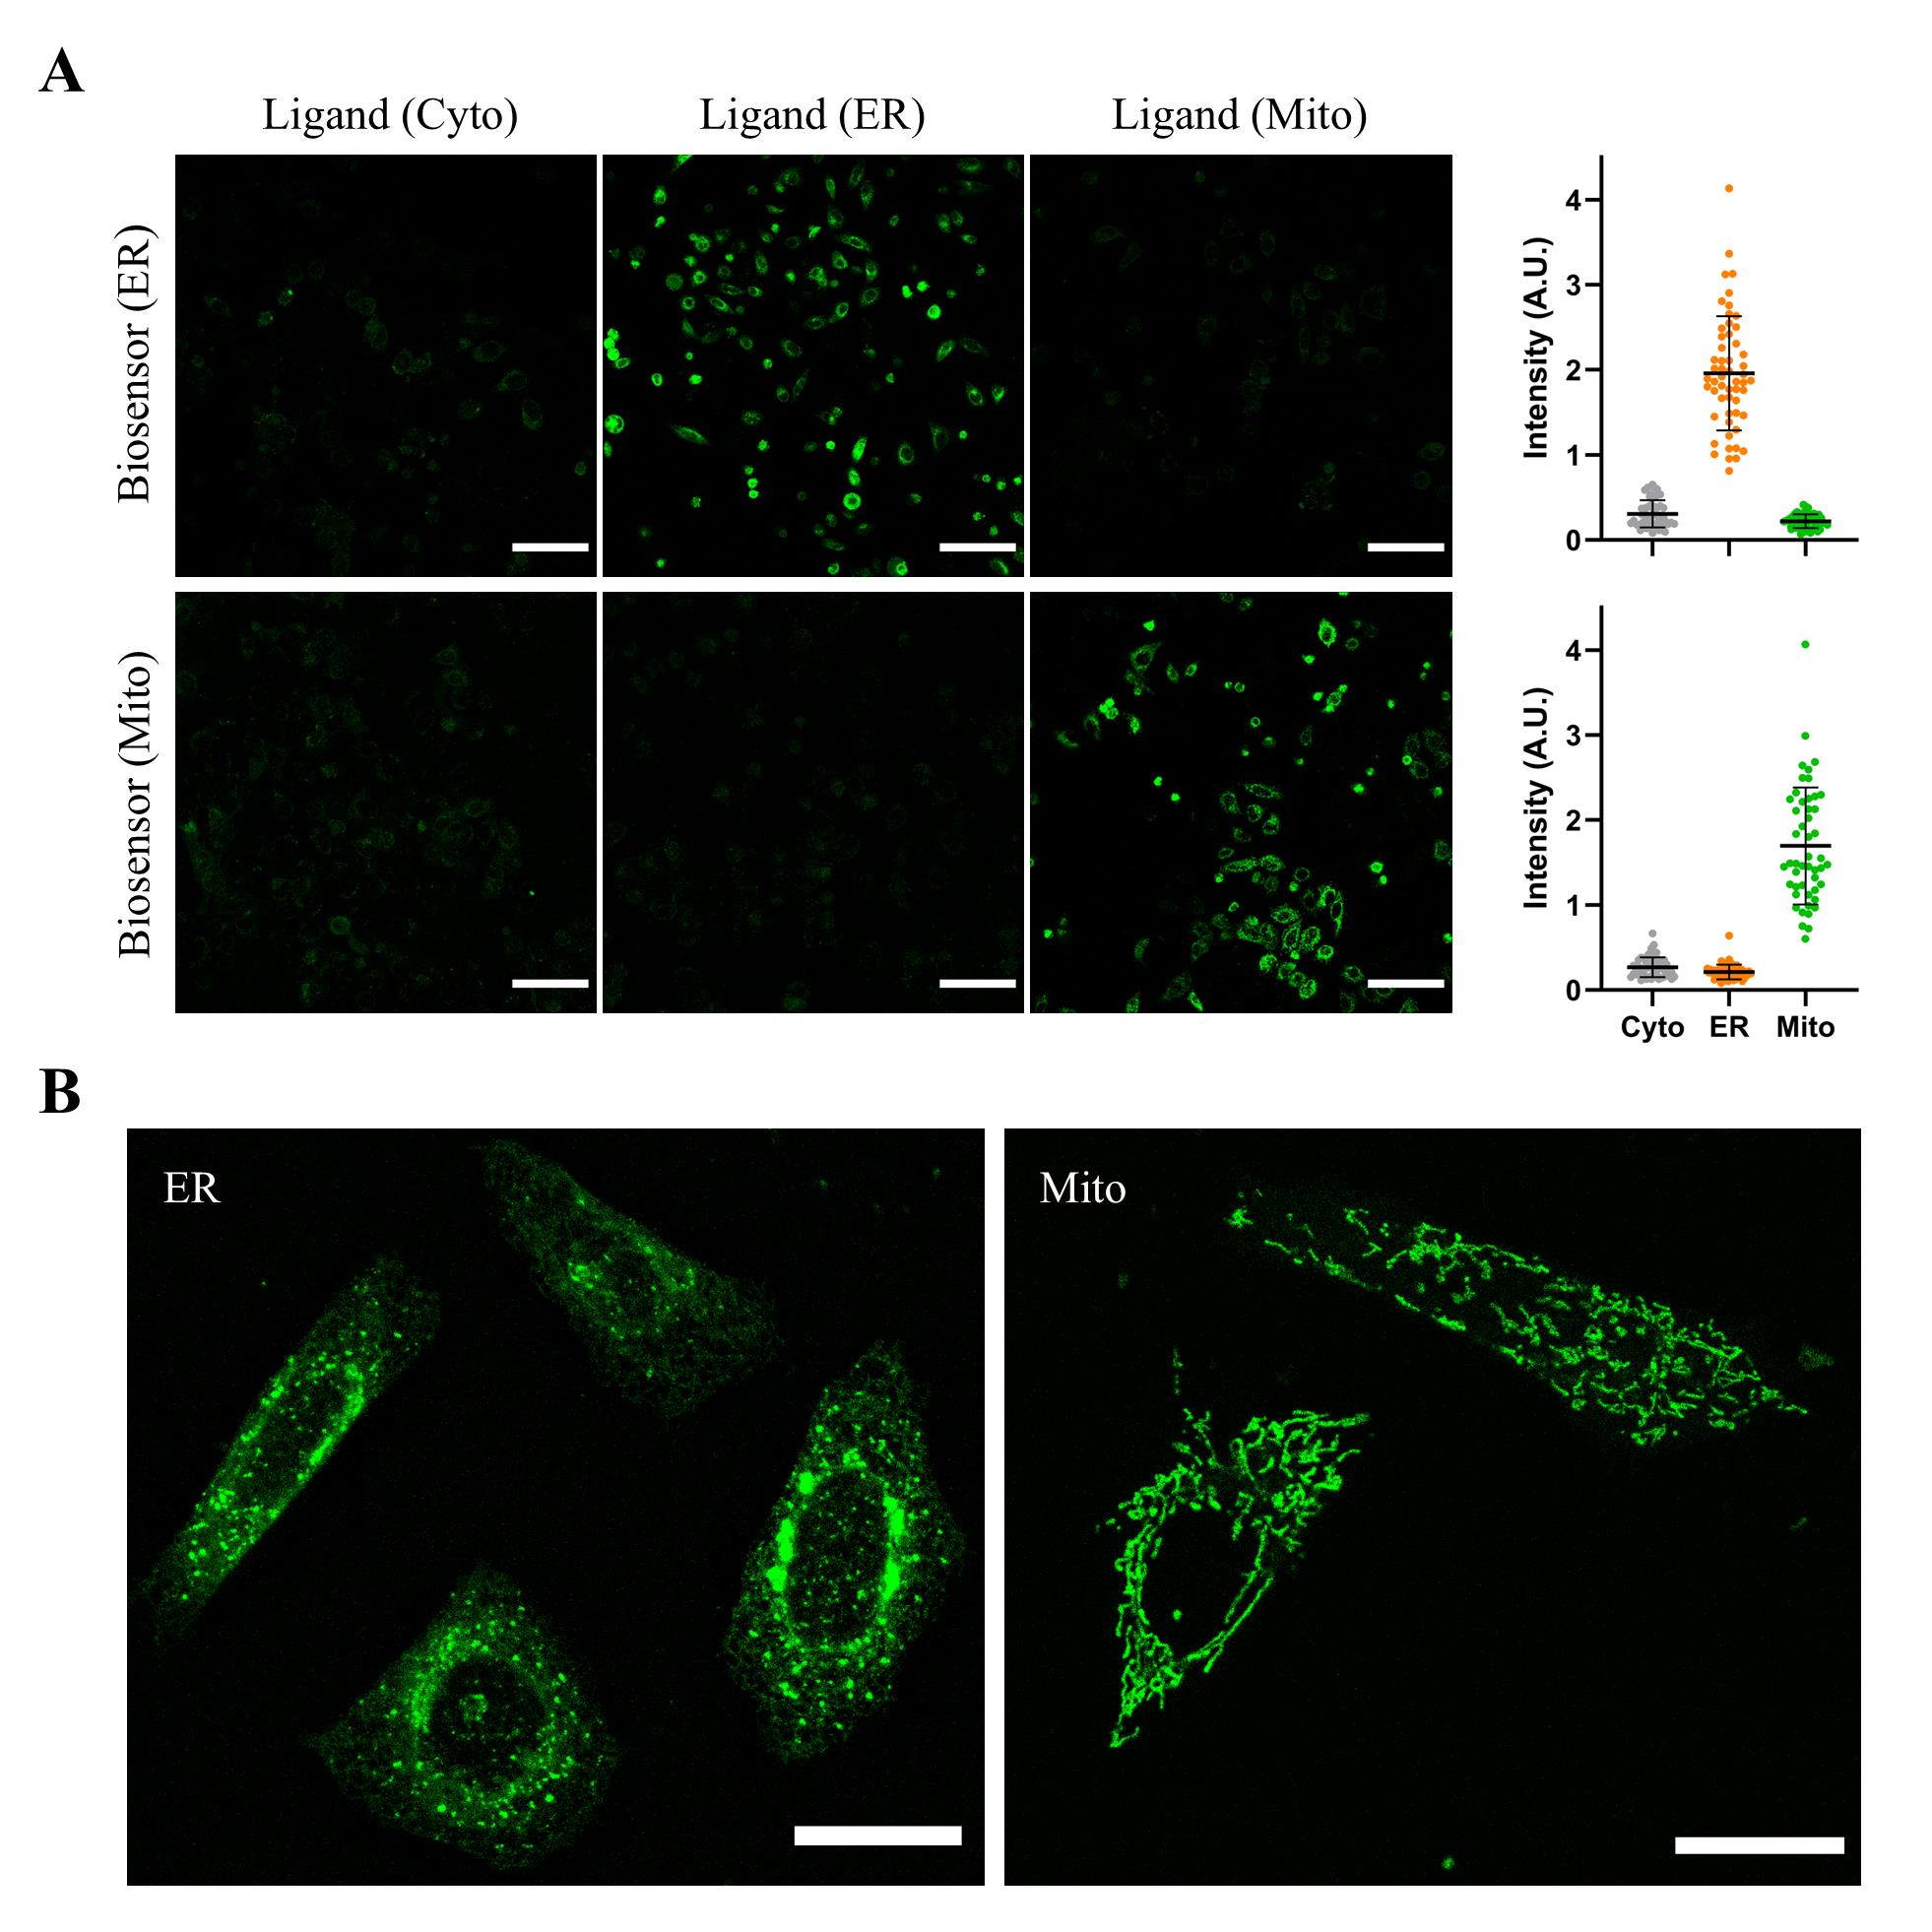
Figure 8. Verifying that biosensors localize to the endoplasmic reticulum (ER) and mitochondria and retain activity in those compartments. HeLa cells were transfected with one plasmid expressing ER- or mitochondria-localized y-ATOMSH2 and a second plasmid encoding either ER- or mitochondrial-targeted SH2 (transfection #1), or SH2 with no localization tags (resulting in cytoplasmic SH2 expression; transfection #2). (A) Cells appeared green when the biosensor and ligand were targeted to the same compartment and were mostly dark when the biosensor was targeted to ER or mitochondria and the ligand was expressed in the cytoplasm. Scale bars are 100 μm. For the quantification at the right side, each dot represents one cell (n ≥ 50), and error bars correspond to the standard deviation. (B) Confocal images of HeLa cells expressing y-ATOMSH2 and SH2 ligand, both targeted to ER (left) or mitochondria (right), reveal the expected mesh-like and tubular structures of the respective organelles. Scale bars are 10 μm.
Data analysis
For quantitative determination of ATOM biosensor turn-on with rigorous statistics, fluorescence microscopy experiments should be performed a minimum of three times with freshly split and transformed cells on different days. For each experiment, at least three fields containing at least 30 cells per field should be imaged, and the cells should be pooled for quantification of that sample. When quantifying biosensor turn-on ratios, the only adjustment that should be applied to the images is background subtraction (e.g., step I3). Statistical significance between mean fluorescence intensities of datasets is determined by a two-sided t-test with unequal variance using GraphPad Prism. Additional details can be found in the Methods section of Sekhon et al. [2].
Validation of protocol
This protocol or parts of it has been used and validated in the following research article: Sekhon et al. [2]. Adaptable, turn-on maturation (ATOM) fluorescent biosensors for multiplexed detection in cells. Nature Methods [Figure 1 (panels d–e), Figure 2, Figure 4, Figure 5, Extended Data Figure 1, Extended Data Figure 2, and Extended Data Figure 3]. All raw and processed data, statistical analyses, and images (with associated metadata) in those figures can be downloaded from the Figshare repository (https://doi.org/10.58120/upstate.23959239).
General notes and troubleshooting
General notes
1. The ATOM mechanism allows for the usage of binding domains other than MBs and NBs. Suggested properties for such a domain are that it is relatively small (<15 kDa) and of a single domain, does not contain multiple disulfide bonds, and possesses reasonable thermodynamic stability. A known or predicted three-dimensional structure is useful for deciding the points of circular permutation and the number of amino acids used to link the original amino and carboxy termini (see step B3).
2. For binding domains other than MBs and NBs (see General Note 1), select permutation sites by using PyMol or a similar molecular visualization program (or AlphaFold2 [14] if the structure is unknown) to identify turns or short surface loops (<4–5 residues) that are distant from the ligand binding site. There are typically 2–4 such loops/turns in a protein <15 kDa in size. The permutation site should be at the “tip” of the loop, i.e., the point at which there are approximately the same number of loop residues on either side. Measure the distance (in Å) from the alpha carbon of the amino-terminal residue to the alpha carbon of the carboxy-terminal residue. Dividing this quantity by 1.5 yields the length of the linker, in amino acids, to be used to join the original termini when making the circular permutant. The linker sequence is based on repeats of GSG, as shown in Figure 2, for flexibility and solubility. Design the linker by subtracting amino acids from the end of the linker in Figure 2 or adding amino acids in blocks of GSG depending on the desired length. If the N-to-C distance cannot be measured accurately, it is better to err on the side of longer linkers.
3. The ATOM mechanism is compatible with FPs of different lineages (mTurquoise and mClover derive from Aequorea victoria and mTagRFP originates from Entacmaea quadricolor). If the reader wishes to generate ATOM sensors of additional colors and/or lineages, the main prerequisite is that the FP be monomeric. The same protocol steps are then followed.
Troubleshooting
To aid in troubleshooting, we recommend performing a positive control consisting of transfecting HEK 293T cells with plasmids expressing a validated ATOM biosensor and its cognate ligand (e.g., y-ATOMmCh and mCherry Y70A, as in Figure 6 and Figure 7). Plasmids expressing other validated biosensors (y-ATOMSH2, y-ATOMWDR5, and y-ATOMRAS) and their ligands are also available from Addgene (Biological materials 4–11). One should then follow the steps in section F and image cells as in sections G and H. This will help identify which problem listed below may be occurring.
Problem 1: Transfection efficiency and/or protein expression levels are low.
Possible cause 1: Cells have been passaged too many times. Old cells transfect with poor efficiency and, when transfected, express low levels of protein.
Solution: Obtain fresh cells with low passage numbers.
Possible cause 2: Transfection efficiency can vary with cell type and transfection method.
Solution: We typically observe ~60% transfection efficiency using HEK 293T cells and the CaCl2 method described in section F. If efficiencies are poor, we recommend trying alternate transfection methods such as lipofectamine or electroporation, following the manufacturer’s protocols.
Problem 2: Biosensor appears to be always off in cells.
Possible cause 1: Biosensor expresses poorly or is being degraded.
Solution: Stain cells with an antibody that recognizes the biosensor (anti-GFP or anti-TagRFP; see section G) to determine if the biosensor is largely absent from cells or is abundant but dark. If the former is found, express the biosensor as an MBP fusion (see step C2). If the latter is observed, proceed to possible cause 2.
Possible cause 2: Biosensor fails to turn on.
Solution: Check expression levels of the target ligand by staining with an antibody or fusing it to a fluorescent protein. The always-off condition can be correlated with thermodynamic instability and/or insolubility of the binding domain, the FP domain, or both. Stability and solubility of the MB or NB cannot be readily predicted, especially after circular permutation and insertion into the FP. Try circularly permuting the MB or NB 1–3 amino acids away from the original sites or inserting the MB or NB into a different FP (mClover appears to be more stable than TagRFP). If the ATOM biosensor employed mClover or mTurquoise, consider trying the non-circularly permuted forms of those FPs. Another possibility is that the MB or NB have lost their intrinsic binding affinity for the target ligand, most likely as a result of circular permutation and fusion to the FP. The same solutions described above apply to this scenario.
Problem 3: Biosensor is always on in cells.
Possible cause 1: Biosensor expression is too high.
Solution: Remove MBP tag if applicable. Express biosensor under the control of a promoter weaker than CMV.
Possible cause 2: The MB/NB or FP domains are too thermodynamically stable. In this case, the chromophore of the FP will mature independently of the ligand.
Solution: Experiment with different MB/NB permutation sites and FPs as described in Problem 2.
Problem 4: Antibody staining produces a low signal.
Possible cause 1: Cells are lifting off during wash steps.
Solution: Coat the coverslips or the plate with collagen according to the manufacturer’s instructions.
Possible cause 2: Antibody concentration is too low.
Solution: Test the following antibody dilutions: 1:250, 1:500, 1:1,000, and 1:2,000. Determine the concentration at which the signal is at least 10–100× higher than an untransfected negative control.
Problem 5: PCR reaction 1 or PCR reaction 2 fails.
Possible cause: High GC content in the DNA. We did not encounter this problem with MB, NB, or FP genes or with the plasmid into which these genes were inserted, but it may manifest if the reader employs genes or plasmids with higher GC content.
Solution: Add a GC enhancer (included in the Q5 and Phusion Polymerase kits) to the reactions in Table 2 (10 μL for PCR reaction 1 and 5 μL for PCR reaction 2) and reduce the volume of H2O by the corresponding volume.
Problem 6: Biosensor fluorescence is too dim in the subcellular compartments in HeLa cells.
Possible cause: Low transfection efficiency from the calcium phosphate method.
Solution: Use a commercially available transfection reagent such as Lipofectamine 2000 (Thermo Fisher) and repeat the transfection using the same concentration and ratio of plasmids.
Supplementary information
The following supporting information can be downloaded here:
1. Dataset S1. Examples of SegmentAlone.ijm and MeasureAlone.ijm Fiji macros from step I3.
2. Dataset S2. Raw images of data in Figure 6 in Zeiss Vision Image format.
3. Dataset S3. GraphPad Prism file of cell fluorescence intensities in Figure 7.
4. Table S1. Excel file for calculating transfection recipes for different plate sizes from step F2.
Acknowledgments
This work was supported by National Institutes of Health grants F30 GM146428 to H.S. and R01 GM148448 to S.N.L. This protocol was first described and validated in Sekhon et al. [2].
Competing interests
The authors declare no competing interests.
References
- Radley, T. L., Markowska, A. I., Bettinger, B. T., Ha, J. H. and Loh, S. N. (2003). Allosteric Switching by Mutually Exclusive Folding of Protein Domains. J Mol Biol. 332(3): 529–536. https://doi.org/10.1016/s0022-2836(03)00925-2
- Sekhon, H., Ha, J.-H., Presti, M. F., Procopio, S. B., Jarvis, A. R., Mirsky, P. O., John, A. M. and Loh, S. N. (2023). Adaptable, turn-on maturation (ATOM) fluorescent biosensors for multiplexed detection in cells. Nat Methods. 20(12): 1920–1929. https://doi.org/10.1038/s41592-023-02065-w
- Schindelin, J., Arganda-Carreras, I., Frise, E., Kaynig, V., Longair, M., Pietzsch, T., Preibisch, S., Rueden, C., Saalfeld, S., Schmid, B., et al. (2012). Fiji: an open-source platform for biological-image analysis. Nat Methods. 9(7): Article 7. https://doi.org/10.1038/nmeth.2019
- Spencer-Smith, R., Koide, A., Zhou, Y., Eguchi, R. R., Sha, F., Gajwani, P., Santana, D., Gupta, A., Jacobs, M., Herrero-Garcia, E., et al. (2017). Inhibition of RAS function through targeting an allosteric regulatory site. Nat Chem Biol. 13(1): 62–68. https://doi.org/10.1038/nchembio.2231
- Fridy, P. C., Li, Y., Keegan, S., Thompson, M. K., Nudelman, I., Scheid, J. F., Oeffinger, M., Nussenzweig, M. C., Fenyö, D., Chait, B. T., et al. (2014). A robust pipeline for rapid production of versatile nanobody repertoires. Nat Methods. 11(12): Article 12. https://doi.org/10.1038/nmeth.3170
- Kapp, K., Schrempf, S., Lemberg, M. K. and Dobberstein, B. (2013). Post-Targeting Functions of Signal Peptides. In: Madame Curie Bioscience Database [Internet]. Landes Bioscience. Retrieved from https://www.ncbi.nlm.nih.gov/books/NBK6322/
- Pelham, H. R. (1990). The retention signal for soluble proteins of the endoplasmic reticulum. Trends Biochem Sci. 15(12): 483–486. https://doi.org/10.1016/0968-0004(90)90303-s
- Zhu, J., Zhang, Z.-T., Tang, S.-W., Zhao, B.-S., Li, H., Song, J.-Z., Li, D. and Xie, Z. (2019). A Validated Set of Fluorescent-Protein-Based Markers for Major Organelles in Yeast (Saccharomyces cerevisiae). mBio. 10(5): 10.1128/mbio.01691-19. https://doi.org/10.1128/mbio.01691-19
- Lobl, T. J., Mitchell, M. A. and Maggiora, L. L. (1990). SV40 Large T-antigen nuclear signal analogues: Successful nuclear targeting with bovine serum albumin but not low molecular weight fluorescent conjugates. Biopolymers. 29(1): 197–203. https://doi.org/10.1002/bip.360290124
- Miyazaki, K. (2011). MEGAWHOP cloning: a method of creating random mutagenesis libraries via megaprimer PCR of whole plasmids. Methods Enzymol. 498: 399–406. https://doi.org/10.1016/B978-0-12-385120-8.00017-6
- Caicedo, J. C., Roth, J., Goodman, A., Becker, T., Karhohs, K. W., Broisin, M., Molnar, C., McQuin, C., Singh, S., Theis, F. J., et al. (2019). Evaluation of Deep Learning Strategies for Nucleus Segmentation in Fluorescence Images. Cytometry Part A. 95(9): 952–965. https://doi.org/10.1002/cyto.a.23863
- Schmidt, U., Weigert, M., Broaddus, C. and Myers, G. (2018). Cell Detection with Star-Convex Polygons. In: Frangi, A. F., Schnabel, J. A., Davatzikos, C., Alberola-López, C. and Fichtinger, G. (Eds.). Medical Image Computing and Computer Assisted Intervention – MICCAI 2018. Cham: Springer International Publishing. 265–273. https://doi.org/10.1007/978-3-030-00934-2_30
- Stringer, C., Wang, T., Michaelos, M. and Pachitariu, M. (2021). Cellpose: a generalist algorithm for cellular segmentation. Nat Methods. 18(1): 100–106. https://doi.org/10.1038/s41592-020-01018-x
- Jumper, J., Evans, R., Pritzel, A., Green, T., Figurnov, M., Ronneberger, O., Tunyasuvunakool, K., Bates, R., Žídek, A., Potapenko, A., et al. (2021). Highly accurate protein structure prediction with AlphaFold. Nature. 596(7873): 583–589. https://doi.org/10.1038/s41586-021-03819-2
Article Information
Publication history
Received: Nov 1, 2024
Accepted: Feb 9, 2025
Available online: Feb 26, 2025
Published: Mar 20, 2025
Copyright
© 2025 The Author(s); This is an open access article under the CC BY-NC license (https://creativecommons.org/licenses/by-nc/4.0/).
How to cite
Sekhon, H., Ha, J. H. and Loh, S. N. (2025). Sensitive and Adaptable Turn-On Maturation (ATOM) Fluorescent Biosensors for Detecting Subcellular Localization of Protein Targets in Cells. Bio-protocol 15(6): e5239. DOI: 10.21769/BioProtoc.5239.
Category
Molecular Biology > Protein > Detection
Biochemistry > Protein > Fluorescence
Biological Engineering > Biomedical engineering
Do you have any questions about this protocol?
Post your question to gather feedback from the community. We will also invite the authors of this article to respond.