- Protocols

- Articles and Issues
- For Authors
- About
- Become a Reviewer

Voltage Clamp Fluorometry in Xenopus laevis Oocytes to Study the Voltage-sensing Phosphatase

Published: Vol 15, Iss 4, Feb 20, 2025 DOI: 10.21769/BioProtoc.5212 Views: 2048
Reviewed by: Willy R Carrasquel-UrsulaezAkira KarasawaXiaochen SunVinaykumar Idikuda
Original research article
The authors used this protocol in:

Jul 2024
Advertisement


Protocol Collections
Comprehensive collections of detailed, peer-reviewed protocols focusing on specific topics


Related protocols
Abstract
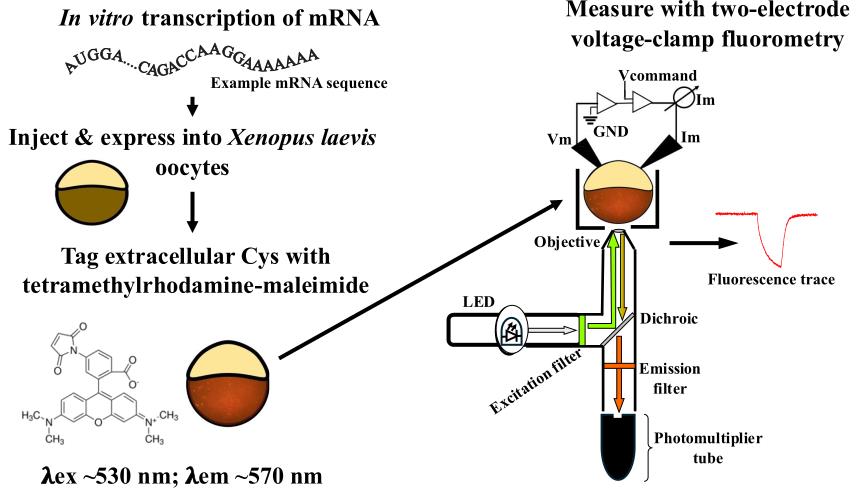
Voltage clamp fluorometry (VCF) is a powerful technique in which the voltage of a cell’s membrane is clamped to control voltage-sensitive membrane proteins while simultaneously measuring fluorescent signals from a protein of interest. By combining fluorescence measurements with electrophysiology, VCF provides real-time measurement of a protein’s motions, which gives insight into its function. This protocol describes the use of VCF to study a membrane protein, the voltage-sensing phosphatase (VSP). VSP is a 3 and 5 phosphatidylinositol phosphate (PIP) phosphatase coupled to a voltage sensing domain (VSD). The VSD of VSP is homologous to the VSD of ion channels, with four transmembrane helices (S1–S4). The S4 contains the gating charge arginine residues that sense the membrane’s electric field. Membrane depolarization moves the S4 into a state that activates the cytosolic phosphatase domain. To monitor the movement of S4, the environmentally sensitive fluorophore tetramethylrhodamine-6-maleimide (TMRM) is attached extracellularly to the S3-S4 loop. Using VCF, the resulting fluorescence signals from the S4 movement measure the kinetics of activation and repolarization, as well as the voltage dependence of the VSD. This protocol details the steps to express VSP in Xenopus laevis oocytes and then acquire and analyze the resulting VCF data. VCF is advantageous as it provides voltage control of VSP in a native membrane while quantitatively assessing the functional properties of the VSD.
Key features
• Voltage clamp fluorometry using Xenopus laevis oocytes expressing the voltage-sensing phosphatase of Ciona intestinalis.
• This protocol uses the fluorophore tetramethylrhodamine-6-maleimide (TMRM).
• This protocol details the procedure for a two-electrode voltage clamp using the Dagan CA-1B amplifier.
Keywords: Voltage clamp fluorometry (VCF)Graphical overview
Background
Voltage clamp fluorometry (VCF) is a powerful technique to study voltage-sensitive conformational dynamics in membrane proteins. By combining the membrane voltage clamp with the measurement of fluorescent signals from the fluorophore attached to the protein of interest, real-time measurements of the protein’s conformational changes can be obtained and correlated to the electrophysiological functions. Initially developed to measure the conformational changes occurring in ion channels [1,2], the technique evolved to study other membrane proteins such as ion transporters [3,4] and, as discussed in this protocol, the voltage-sensing phosphatase (VSP) [5,6].
VSP is a 3 and 5 phosphatidylinositol phosphate (PIP) phosphatase coupled to a voltage-sensing domain (VSD) [7]. The VSD is made up of four transmembrane helices (S1–S4), with the S4 containing arginine residues that act as gating charges to sense the electric field of the membrane. Depolarization of the membrane causes the S4 to move from a down “resting” state in the membrane to an up “active” state. Unlike ion channels, the movement of the VSD in VSP does not lead to ionic currents; therefore, VCF is particularly advantageous as a robust measure of VSP’s voltage sensitivity and protein motions.
Environmentally sensitive fluorophores, like tetramethylrhodamine-6-maleimide (TMRM), are often used to monitor protein movements when attached to a protein’s predicted mobile region. Because the maleimide of TMRM is thiol-reactive, single cysteine mutations are introduced into these regions for labeling and are empirically tested for fluorescence changes that correlate with protein activation. To monitor S4 movements in VSP, G214C, at the top of S4 in the extracellular loop between S3 and S4, is a common labeling site. By analyzing the G214C-TMRM fluorescence signal during activation and repolarization conditions, the kinetics of the VSD, specifically S4, are calculated, giving us insight into the VSD motions in response to the changing voltage stimulus. Additionally, by taking the amplitude of the fluorescence signal relative to the membrane voltage, we calculate the voltage dependence of the VSD, which correlates with the voltage dependence of VSP’s phosphatase activity. Further, VCF labeling sites can be combined with other mutations to probe the mechanism of voltage dependence [6,8], coupling properties of the linker [9–11] and phosphatase activity [12,13]. While we only discuss the G214C labeling site here, different labeling sites will report on different protein motions and can be used to further test the mechanism of protein function [10,11].
Because Xenopus laevis (X. laevis) oocytes are large single cells that are easy to manipulate and maintain, they are a great expression system for VCF. This protocol describes all the different parts of preparing, setting up, and conducting a VCF experiment. It starts with how to prepare X. laevis oocytes from the ovary; it then describes how to make the messenger RNA (mRNA). It moves on to how to inject the oocytes with the mRNA for expression, how to label them with TMRM, and ultimately how to voltage clamp them using a Dagan CA-1B amplifier for two-electrode voltage clamp. Lastly, this protocol describes the steps for analyzing the acquired fluorescence signals.
Materials and reagents
Biological materials
1. Xenopus laevis ovaries (Xenopus One, catalog number: 10004, ¼ ovary)
2. Ciona intestinalis voltage-sensing phosphatase (Ci-VSP) in pSD64TF vector (Y. Okamura, Osaka University, Osaka, Japan, Addgene plasmid #80332) (Figure 1A)
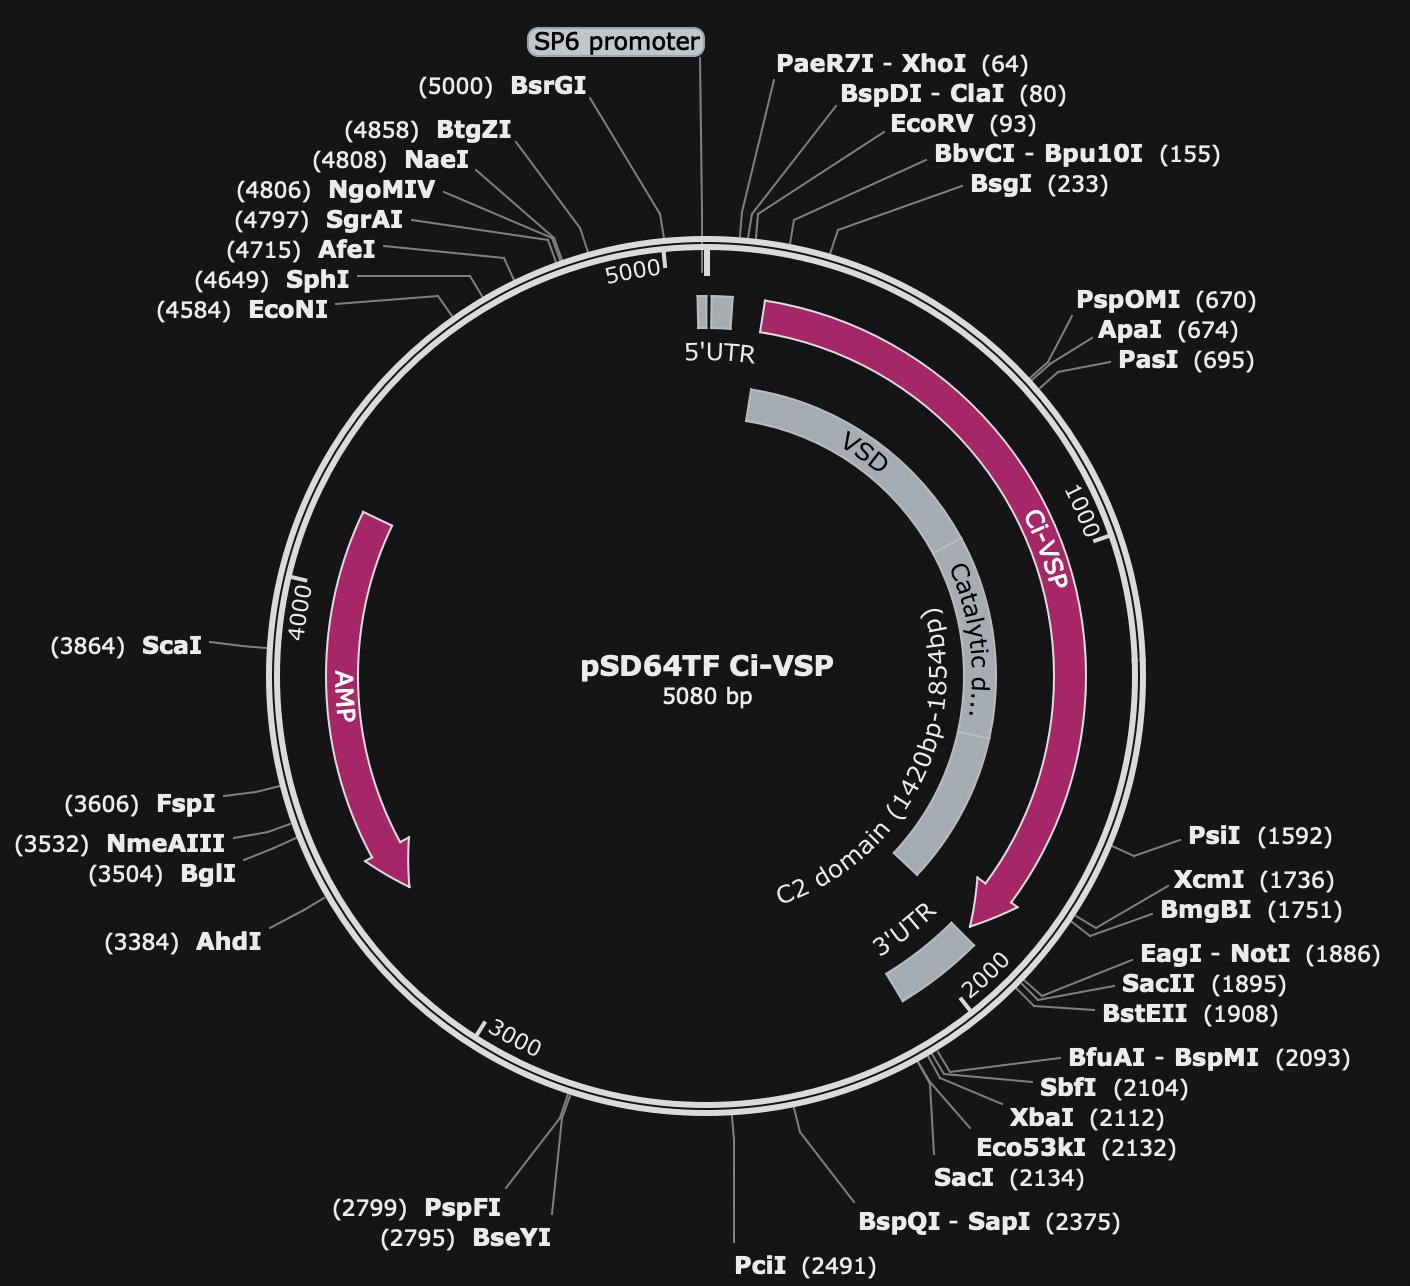
Figure 1. Map of pSD64TF Ci-VSP plasmid. Vector of pSD64TF with ampicillin selection and an SP6 promoter. The VSD, catalytic domain, and C2 domain of Ci-VSP are noted in the gray regions.
Reagents
1. mMESSAGE mMACHINE SP6 Transcription kit (Invitrogen, catalog number: AM1340)
2. Linearization enzyme XbaI (NEB, catalog number: R3131L)
3. Water, DNase/RNase free (Fisher, catalog number: BP561-1)
4. Ethyl alcohol 200 proof (EtOH) (Pharmco, catalog number: 111000200)
5. Ethyl alcohol 190 proof (EtOH) (Pharmco, catalog number: 111000190)
6. GeneRuler DNA ladder (Thermo Scientific, catalog number: SM0333)
7. Millennium RNA marker (Thermo Fisher, catalog number: AM7150)
8. QIAquick PCR Purification kit (QIAGEN, catalog number: 28104)
9. Light mineral oil (Millipore Sigma, catalog number: ES005C)
10. Collagenase type 2 (Worthington Biochemical Corporation, catalog number: LS004177)
11. Collagenase type 3 (Worthington Biochemical Corporation, catalog number: LS004183)
12. Tetramethylrhodamine-6-maleimide (TMRM) (Abcam, catalog number: ab145471)
13. Sodium pyruvate (Fisher, catalog number: BP356-100)
14. NaCl (Fisher, catalog number: BP358-1)
15. KCl (Fisher, catalog number: BP366-500)
16. CaCl2·2H2O (JT Baker, catalog number: 1332-01)
17. MgCl2·6H2O (Thermo Scientific, catalog number: J62575.36)
18. Gentamicin sulfate (Thermo Scientific, catalog number: J6283406)
19. HEPES (Fisher, catalog number: BP310-500)
20. N,N-Dimethylformamide (DMF) (Thermo Scientific, catalog number: 041859AK)
21. HCl (Fisher, catalog number: S25358)
22. NaOH (Fisher, catalog number: P250-500)
23. RNase Away (Thermo Scientific, catalog number: 7005-11)
Solutions
1. ND-96 (see Recipes)
2. Ca2+-free buffer (see Recipes)
3. ND-96(-) (see Recipes)
4. Bridge buffer (see Recipes)
Recipes
1. ND-96 (1 L)
Note: Adjust pH to 7.6 with HCl or NaOH and filter-sterilize to prevent contaminating growth. Store at room temperature for up to a year or longer as long as it does not show any growth.
| Reagent | Final concentration | Quantity or Volume |
|---|---|---|
| NaCl | 96 mM | 56.1 g |
| KCl | 2 mM | 0.15 g |
| CaCl2·2H2O | 1.8 mM | 0.265 g |
| MgCl2·6H2O | 1 mM | 0.203 g |
| Gentamicin sulfate | 50 μg/mL | 2 mL of 50 mg/mL stock |
| Sodium pyruvate | 2.5 mM | 5 mL of 1 M stock |
| HEPES | 10 mM | 2.383 g |
| Total | n/a | 1,000 mL |
2. Ca2+-free buffer (1 L)
Note: Adjust pH to 7.6 with HCl or NaOH and autoclave to sterilize. Store at room temperature for up to a year or longer as long as it does not show any growth.
| Reagent | Final concentration | Quantity or Volume |
|---|---|---|
| NaCl | 83 mM | 4.8 g |
| KCl | 2 mM | 0.15 g |
| MgCl2·6H2O | 1 mM | 0.203 g |
| HEPES | 10 mM | 2.383 g |
| Total | n/a | 1,000 mL |
3. ND-96(-) (1 L)
Note: Adjust pH to 7.6 with HCl or NaOH and autoclave to sterilize. Store at room temperature for up to a year or longer as long as it does not show any growth.
| Reagent | Final concentration | Quantity or Volume |
|---|---|---|
| NaCl | 96 mM | 56.1 g |
| KCl | 2 mM | 0.15 g |
| CaCl2·2H2O | 1.8 mM | 0.265 g |
| MgCl2·6H2O | 1 mM | 0.203 g |
| HEPES | 10 mM | 2.383 g |
| Total | n/a | 1,000 mL |
4. Bridge buffer (1 L)
Note: Adjust pH to 7.4 with HCl or NaOH and autoclave to sterilize. Store at room temperature for up to a year or longer as long as it does not show any growth.
| Reagent | Final concentration | Quantity or Volume |
|---|---|---|
| NaCl | 1 M | 58.4 g |
| HEPES | 10 mM | 2.383 g |
| Total | n/a | 1,000 mL |
Laboratory supplies
1. Reusable 45 mm bottle top filter (Nalgene, catalog number: DS0320-5045)
2. Membrane and prefilter disks (Nalgene, catalog number: DS02154020)
3. Low-retention filtered RNase-free pipette tips (Fisher, catalog numbers: 02-707-002, 02-707-006, and 02-707-008)
4. 3.5” glass capillaries (Drummond Scientific, catalog number: 3-000-203-G/X)
5. Glass capillary tubes (VWR, catalog number: 5432-921)
6. Glass coverslips, No. 1, 22 × 40 mm (Warner Instruments, catalog number: 64-0707)
7. Polypropylene microcentrifuge tubes (Globe Scientific, catalog number: 11563)
8. Falcon Petri dishes (Falcon, catalog number: 351007)
9. 50 mL conical tubes (Thermo Fisher, catalog number: AM12502)
10. 25 G × 5/8 in. needle (BD, catalog number: 305122)
11. 1 mL syringe (BD, catalog number: 309628)
12. DrieriteTM 10–20 mesh (Thermo Scientific, catalog number: 219065000)
13. 150 mm × 15 mm Petri dish (Falcon, catalog number: 351058)
14. Palladium wire (Thermo Scientific, catalog number: AA45072G1)
Equipment
1. Belly Dancer Orbital Shaker (IBI Scientific, model: BDRAA115S)
2. Glass Pasteur pipette (Fisher, catalog number: 13-678-4A)
3. Blunted glass Pasteur pipette (homemade using the pipettes in #2)
4. Mini low-temperature refrigerated incubator, 18 L (Fisher, catalog number: 15-015-2632)
5. Water bath 2 L digital (Benchmark Scientific, catalog number: B2000-2)
6. Refrigerated high-speed microcentrifuge (Thomas Scientific, catalog number: 1154Q52)
7. Rotor (Thomas Scientific, model: AS-24-2)
8. Centrifugal vacuum concentrator (Thermo Scientific, model: DNA120)
9. NanoDropTM One spectrophotometer (Thermo Scientific, catalog number: ND-ONE-W)
10. Nanoject II Auto-Nanoliter Injector (Drummond Scientific, catalog number: 3-000-204)
11. Dissecting microscope (Olympus, model: SZ61)
12. Manipulator (Märzhäuser Wetzlar, catalog number: 00-42-101-0000)
13. Flaming/Brown micropipette puller (Sutter Instruments, model: P-97)
14. Inverted microscope (Leica, model: DM IRBE, catalog number: 020-525.701 to 020-525.780)
15. HC Pl APO 20×/0.7 fluorescence objective (Leica, catalog number: 506166)
16. Amplifier (Dagan Corporation, model: CA-1B)
17. Photomultiplier tube (PMT) (ThorLabs, catalog number: PMTSS2)
18. Axon Digidata-1440A (Molecular Devices Instruments, catalog number: DD1440A)
19. X-Cite XLED1 light source (Lumen Dynamics, catalog number: 010-00288R)
20. LED 505-546 nm (Lumen Dynamics, model: BGX)
21. Cy3 Leica cube set with HQ531/40 excitation filter, HQ593/40 emission filter, Q562LP dichroic (Semrock, catalog number: Cy3-4040C-LSC-ZERO)
22. Eight-pole Bessel filter (Frequency Devices, model: 900CT)
23. Gravity glass puller (Narishige, model: PC-10)
24. Vibration isolation platform (TMC, catalog number: 77049189)
25. Faraday cages (homemade)
26. Glass agarose bridges (homemade)
27. Bath chamber (Warner Instruments, model: RC-24E)
28. Bath chamber platform (Warner Instruments, model: 64-1526)
29. Inox tweezers style #5 (Dumont, catalog number: 11254-20)
30. Mesh 0.011 diameter, 18 × 16 mesh count (Phifer, catalog number: 3002201)
Software and datasets
1. pClamp version 10.3 software package (Axon Instruments)
2. Microsoft Excel, version 16.9 for Mac (Microsoft)
3. Igor Pro version 8 software (WaveMetrics)
Procedure
A. Defolliculating X. laevis oocytes
1. Immediately upon arrival of the X. laevis ovaries (Figure 2A and B), wash the ovary pieces in Ca2+-free buffer.
a. If unable to immediately process the ovaries, store the oocytes in fresh ND-96 with antibiotic in the incubator at 18 °C for a maximum of 4 h. Do NOT freeze or store at 4 °C.
Note: We use ND-96 with and without antibiotic. We use the notation ND-96(-) to denote without antibiotic and just ND-96 to denote with antibiotic.
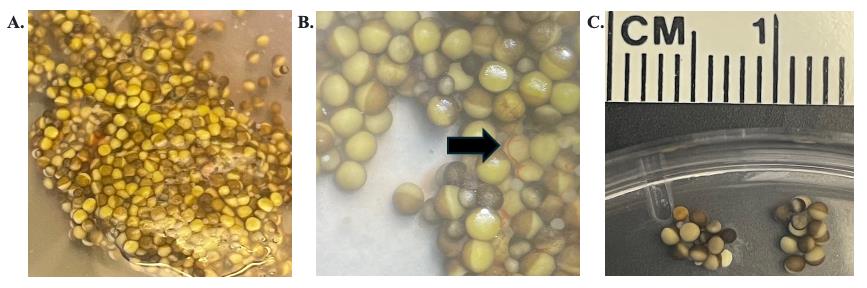
Figure 2. X. laevis oocytes pre-digestion of follicular membrane. A. Lobe of X. laevis ovary. B. Magnified lobe of X. laevis ovary; black arrow highlights the follicular membrane. C. Morselized ovary pieces.
2. Use sterile tweezers and/or small sharp scissors to morselize the ovary into pieces around 5 mm in size (which is about five oocytes) in Ca2+-free buffer (Figure 2C).
Tip: Make the morselized pieces roughly the same size so the follicular layer of the oocyte digests at the same rate.
3. Place the morselized ovary pieces into a 50 mL tube and wash to remove the yolk of lysed oocytes.
a. Agitate by gently inverting the tube up and down. Pour out the Ca2+-free buffer and replace with fresh Ca2+-free buffer. Repeat the wash steps 2–3 times. On the final wash, decant as much of the liquid off as you can, leaving ~5 mL of morselized ovary pieces.
4. Digest the cleaned and morselized ovary pieces.
a. In a 50 mL tube, make the digestion solution: 0.5 mg/mL collagenase type II and 0.83 mg/mL collagenase type III in 15 mL of Ca2+-free buffer.
b. Add the digestion solution to the ~5 mL of morselized ovary pieces and gently shake on the belly dancer rotating platform at speed ~4 at room temperature for 60–70 min.
Note: Collagenase activity can show batch-to-batch variability. If it is the first use of a collagenase batch, it is recommended to check the progression of digestion earlier in the process (~30 min) and then repeatedly check every 10 min. Once a good baseline of the collagenase activity is established, the amount of monitoring can be reduced. For our batches, checking at the initial 60 min mark is a good starting point to monitor the collagenase effectiveness.
c. Partway through digestion, remove a few oocytes from the digestion solution. Place them onto a Petri dish under a dissecting microscope to assess the level of digestion through the removal of the follicular membrane (Figure 3A). The follicular membrane is part of the extracellular matrix that holds the cells together. On an individual cell, it looks like a transparent layer with red veining (Figure 3C).
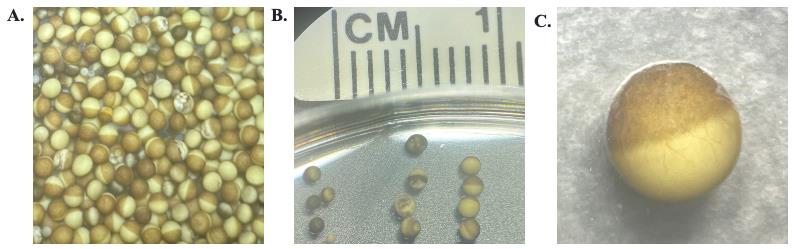
Figure 3. X. laevis oocytes post-digestion of the follicular membrane. A. Mixture in the appearance of X. laevis oocytes post-digestion. B. Various qualities of X. laevis oocytes. From left to right: small immature cells, poor-quality stage-V cells, and good-quality stage-V cells. C. Magnified image of a good-quality stage-V cell with part of the follicular membrane attached.
5. After the majority of the morselized ovary is digested into individual oocytes, and approximately 20%–50% have the follicular membrane removed, wash the oocytes in the same 50 mL tube by gently inverting the tube up and down. Pour out the Ca2+-free buffer and replace with 30 mL of fresh Ca2+-free buffer. Repeat this wash step 10 times.
6. Sort the healthy stage-V oocytes from the dead, immature, and unhealthy oocytes. A healthy stage-V oocyte will be approximately 1 mm in diameter with a well-defined line for animal (dark) and vegetal (light) poles. Any oocytes that are small or have mixing animal and vegetal poles are discarded (Figure 3B). Culture the remaining healthy oocytes in ND-96 at 18 °C.
a. To create a glass pipette for moving the oocytes, a glass Pasteur pipette is first scored by a file close to the end of the taper of the pipette. The placement is dependent on how big an opening is desired. The glass is broken off at the scoring and briefly passed through a flame to create a smooth edge to the glass. Allow it to cool to room temperature before use (Figure 4A).
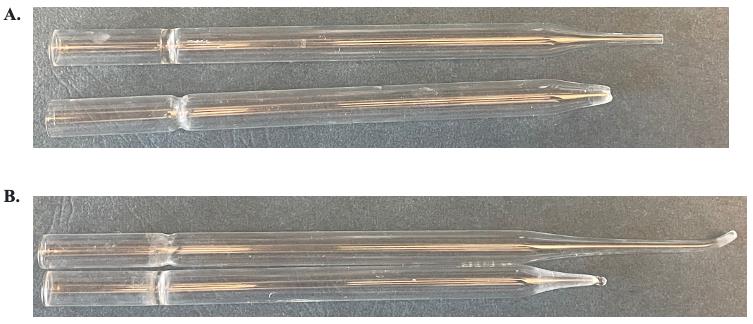
Figure 4. Glass Pasteur pipettes for X. laevis oocyte manipulation. A. Pasteur pipettes for moving oocytes. Top: some pipette taper remaining and a small opening; bottom: pipette taper removed and a larger opening. B. Pasteur pipettes for manual defolliculation. Top: more taper and longer length; bottom: less taper and shorter length.
7. In our experience, oocytes have better experimental survival under voltage clamp at high positive voltages if they are manually defolliculated rather than completely defolliculated by collagenase.
a. For manual defolliculation, select individual oocytes with the follicular membrane still attached (Figure 3C).
b. Pipette the oocytes into a Falcon Petri dish containing ND-96.
c. To create a defolliculating glass pipette, repeat step 6a but heat the end of the glass for longer to create a blunted tip that is smaller than the size of the oocyte. Allow to cool to room temperature before use (Figure 4B).
d. Gently press the folliculated oocytes into the Falcon dish with the blunted glass pipette until the follicular membrane “sticks” to the Falcon dish (Video 1). While the exact chemistry is uncertain, we believe the crystal-grade polystyrene of the Falcon Petri dishes is more hydrophobic than other Petri dishes and therefore allows for better follicular membrane sticking.
e. Using the blunted glass pipette, gently roll the oocyte out of the stuck follicular membrane.
f. Repeat for all the oocytes needed. We typically inject approximately 10–20 oocytes.
Tip: We find that lining up all the oocytes in rows in the dish facilitates this process.

B. In vitro RNA production
1. Critical: The following steps should be done under DNase/RNase-free conditions. Use DNase/RNase-free plasticware and reagents. Wear gloves and clean with RNase decontamination solution such as RNase Away in the following order: benchtop, pipettors, and gloves.
2. Linearize the Ci-VSP plasmid in the vector of pSD64TF.
a. Set up the reaction mixture to contain 5 μg of Ci-VSP plasmid, 5 μL of the restriction enzyme Xba I, and 10 μL of buffer rCutSmartTM, and bring to a total reaction volume of 100 μL with nuclease-free water.
b. Incubate the reaction in a water bath incubator at 37 °C for 1 h.
3. Clean up the linearization reactions with the QIAquick PCR Purification kit using RNase-free plasticware and H2O. Follow the kit instructions and then elute in 30 μL of RNase-free water supplied in the transcription kit.
a. Afterward, run 0.5–1 μL of the elution on a DNA gel to check for complete linearization. Complete linearization is verified by the presence of a single band at the molecular weight of the plasmid (~5 kb, Figure 5A, right lane). The circular plasmid will run further (Figure 5A, middle lane) due to the supercoil conformation.
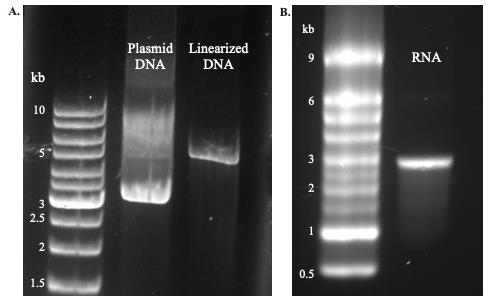
Figure 5. DNA and RNA gels. A. Lanes from left to right: GeneRuler DNA ladder, Ci-VSP circular plasmid, Ci-VSP linearized DNA. B. Left lane: MillenniumTM Marker RNA ladder; right lane: Ci-VSP mRNA product.
4. Transcribe RNA with the mMESSAGE mMACHINE SP6 Transcription kit.
a. Set up the reaction to contain 1 μg of linearized and purified DNA (6 μL), 2 μL of reaction buffer, 10 μL of nucleotide mixture, and 2 μL of polymerase enzyme in a total reaction volume of 20 μL. Doubling the reaction also works well.
b. Incubate this reaction in a water bath incubator at 37 °C for 2–4 h.
Tip: We recommend incubating the reaction for the full 4 h to obtain the maximum amount of RNA.
5. Make the LiCl precipitation solution by adding 30 μL of nuclease-free H2O to 20 μL of LiCl from the RNA transcription kit (7.5 M LiCl, 50 mM EDTA). If the reaction is doubled, then the precipitation solution should also be doubled.
a. Add the LiCl precipitation solution to the RNA reaction.
b. Incubate at -20 °C for a duration of 20 min to overnight. We tend to get better precipitation with longer incubations.
6. Spin the stopped reaction at max speed (≥17,000× g) for 30 min at 4 °C. A white pellet may be visible here, but in many cases, it may be clear.
Tip: Spin the tube with the square latch side up. This will pellet the RNA against the wall of the square latch so that even when the pellet is poorly visible, care can be taken around this area of the tube to prevent accidentally pipetting away the pellet in the following step. As the RNA pellet becomes more visible throughout the wash steps, keep track of the pellet.
7. Carefully pipette off the supernatant so as to not disturb the RNA pellet and wash with 500 μL of cold RNase-free 70% EtOH.
a. Spin the tube at max speed (≥17,000× g) for 5 min at 4 °C.
Note: RNase-free 200 proof EtOH is diluted to 70% using RNase-free H2O and stored at -20 °C.
8. Remove 70% EtOH and add fresh 70% EtOH. Repeat step B7 for a total of three washes. Keep the sample cold at all times during the washes. An ice bucket is sufficient.
9. After the last 70% EtOH wash, carefully and completely pipette off the EtOH and dry the RNA pellet at a medium heat setting in a vacuum concentrator for 2 min. You can also leave the tubes on a bench with the lids open to allow for evaporation; however, we recommend the vacuum concentrator to limit RNase contamination from leaving the lids open.
10. Resuspend the dried RNA pellet in 10–20 μL of nuclease-free H2O. If the RNA pellet is large, heat at 70 °C for 2 min to completely dissolve the RNA pellet.
a. RNA is stored at -20 °C in its original resuspended concentration. While we have not seen issues with freeze/thaw degradation, 2–5 μL aliquots can be made. In our hands, stock RNA stored at -20 °C can last for several years even at stock concentrations. RNA can also be stored at -80 °C and can last a decade or longer.
11. Run 0.5 µL of the final RNA product on an RNA gel to check for the quality of the product.
Note: Remove any secondary RNA structure by heating the RNA mixed with the formaldehyde loading buffer that comes with the transcription kit to 70 °C for 10 min and then cooling on ice for 2 min before loading onto the gel. Not all RNA will form a secondary structure, but the Ci-VSP RNA does.
a. Look for bands at the expected molecular weight between 3,000 and 2,000 bp (Figure 5B).
12. To assess the quantity and quality of the final RNA product, measure on the NanoDropTM. A260/A280 should be ~2. Use RNase-free water as blank. Concentrations will depend on how much water is used to resuspend the pellet. We typically get between 1 and 2 µg/µL.
13. Before injection, dilute Ci-VSP mRNA to 0.4–0.8 µg/µL depending on the expected incubation time. The higher the amount of injected mRNA, the shorter the time needed for incubation.
a. Measure again on the NanoDropTM to ensure the accuracy of the dilution.
C. RNA injection
1. Critical: These steps should be done under RNase-free conditions as discussed in section B.
2. Prepare the injection glass.
a. Pull 3.5” glass capillaries with the P-97 Sutter Instruments puller.
i. Each puller’s filament is different, so per the instruction manual, determine the ramp number for the glass being used. The ramp value for our filament is 561.
ii. Use the ramp value to create a program that will pull the glass into a long needle-like projection (Figure 6A) (see the Pipette Cookbook from Sutter Instruments).
Tip: We pull a maximum of four glass injection needles before turning the puller off to allow it to cool for at least 15 min before pulling another four glass injection needles (if needed). This pause period helps maintain the quality of the injection glass needles pulled by not overheating the filament.
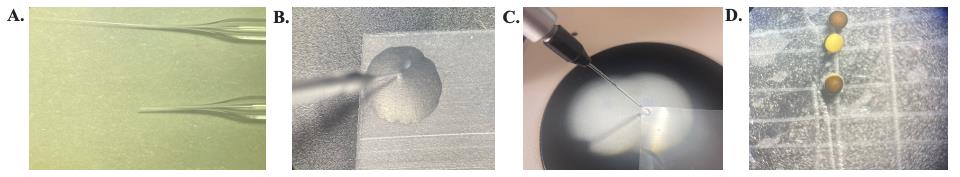
Figure 6. Supplies and setup for X. laevis injection. A. Glass injection needles. Top: directly from the glass pipette puller; bottom: after being trimmed. B. Microscope view of the needle aligned with the parafilm corner and the mineral oil being ejected out. C. View of the injector and injection needle with mineral oil being ejected out. The metal plunger is halfway down the needle. D. Oocytes resting in the etched Petri dish.
b. Break the tip of this injection glass with tweezers to give a suitable opening for injection (Video 2). The opening diameter we usually use is approximately 45 µm. The smaller the diameter, the less damage is done to the oocyte membrane; however, the more likely the injection needle is to get clogged (Figure 6A).
Tip: The glass tip coming out of the puller should be thin enough to be flexible. We aim our tweezers to the area where the glass bends and then break just below that region.
c. Backfill the glass needle with 100% mineral oil using a 25-gauge needle and syringe.
Tip: Take care not to produce any air bubbles in the mineral oil as this will negatively impact the injection volume’s accuracy.
d. On the Nanoject II injector, loosen the black collet and carefully slide the injection glass needle onto the metal plunger pushing until the glass hits the white spacer (hidden under the black collet) and then tighten the collet. Double-check that the glass needle is secure on the injector by giving a gentle tug.
e. Cut a square of parafilm and apply 70% EtOH (made from 190 proof EtOH) to the work surface to act as a lubricant for moving the parafilm around. Place the parafilm on the work surface with the paper side up and remove the paper. This is assumed to be the RNase-free side.
f. Line up a corner of the parafilm in the view of the microscope; this now becomes the point toward which to aim the tip of the needle. With the needle touching the parafilm, press the empty button on the injector until the metal plunger reaches approximately halfway down the glass needle. Then, pull the needle directly up from the parafilm (Figure 6B and C).
i. Another method is to extend the plunger before placing the needle on the injector. This avoids expelling a significant amount of mineral oil but requires care not to bend the plunger when placing the needle. Both methods work equally well.
g. Place 0.5–1 μL of diluted RNA (depending on how many cells you want to inject at once) onto the piece of parafilm. Find the drop of RNA in the microscope by moving the parafilm around. Then, lower the glass needle into the center of the RNA drop, making sure no air is present in the tip, and press the fill button to fill the needle with RNA.
Tip: Sometimes, letting a drop of oil cover the RNA makes this step easier since the RNA will not evaporate as quickly. DO NOT fill the needle with the oil once the RNA is gone.
3. Place the defolliculated oocytes into a solution of ND-96 on an etched plastic Petri dish to prevent rolling (Figure 6D).
4. At a 45° angle, push the glass needle into the oocyte until it just slightly punctures the membrane. There is no need to go deep into the cell. We recommend creating a divot on the cell membrane first and then pushing in with just a fraction of a turn of the manipulator.
Tip: After creating a divot on the cell membrane, a slight tap on the manipulator also works to push the needle into the cell.
5. Before injecting, make sure the injector is set to inject 50 nL (see Nanoinject manual) and then press the inject button to dispense RNA into the oocyte. Oocytes may visibly inflate while pressing the inject button. We also use the foot peddle for injections to streamline injections.
6. We typically inject 10–20 cells. After injecting all cells, incubate the oocytes in ND-96 at 18 °C for 24–36 h.
D. TMRM labeling of oocytes
1. TMRM labeling is done on the day of the experimental recording. Labeled oocytes can be stored in the dark at 18 °C for the duration of the day. Storing for longer than 12 h will result in significant expression of unlabeled VSP, making the labeled protein unrepresentative of the whole pool of expressed protein.
2. Make the TMRM labeling mixture in a 2 mL round-bottom Eppendorf tube, containing 200 μL of ND-96 without gentamicin or pyruvate [ND-96(−)] plus 0.2 μL of the 25 mM TMRM (final concentration 25 μM). Vortex this mixture for 10 s.
a. Make the 25 mM TMRM stock with dry DMF and keep at -20 °C in the dark and in a container filled with DrieriteTM.
3. Transfer the oocytes to the TMRM labeling mixture with minimal liquid transfer to avoid dilution of the mixture.
Tip: Let gravity do the work and let the oocytes fall into the labeling solution instead of squirting them in.
4. Leave the oocytes to label in the dark and on ice for 20 min.
5. After labeling, wash the oocytes with 1 mL of ND-96(−). Repeat this wash five times.
6. Store the labeled oocytes in ND-96(−) in the dark and in an incubator at 18 °C until the experiment.
Note: While the oocytes are experimentally measured at room temperature, leaving the cells at room temperature instead of 18 °C will increase the amount of unlabeled protein on the membrane since protein expression does not stop and can lead to a deterioration of the quality of the oocytes. Therefore, labeled oocytes are left at 18 °C and are individually removed when ready to start an experiment.
E. Two-electrode voltage-clamp electrophysiology and fluorometry measurement of VSD motion
1. Set up the two-electrode voltage clamp rig.
a. Confirm that the Digidata, computer, amplifier, and LED are powered on. Confirm that the amplifier is in TEV (V1, Vi) mode and set to external command so the computer can control the amplifier. Before powering on the PMTs, make sure that they are shielded from light and the voltage is off.
b. Fill the bath chamber with the experimental measurement solution ND-96(−).
c. Fill the back two wells with 1 M NaCl. Add the silver-chloride wires from the bath/guard headstage to the wells.
The silver-chloride wires are connected to the P1 and P2 headstages with the V2 headstage wire spliced into the wire for the P1 headstage (Figure 7A, white and yellow wire, respectively).
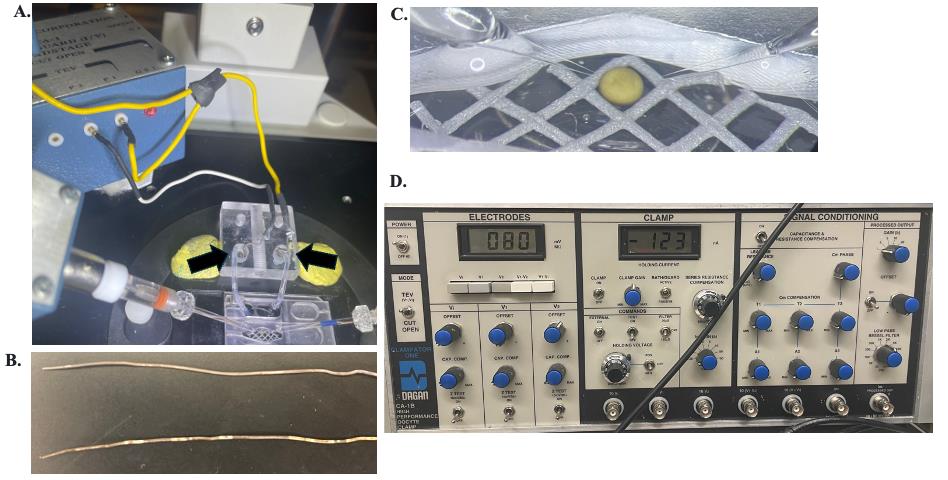
Figure 7. VCF setup. A. An oocyte under voltage clamp showing the bath and headstage setup. The black arrows point to the wells containing the silver-chloride wires and agarose bridges. The yellow wire connects to the P1 and V2 headstages, and the white wire connects to the P2 headstage. B. Silver-chloride wires. Top: properly chlorinated; bottom: needs to be chlorinated as shiny metal patches are showing. C. Oocyte in the bath chamber with glass microelectrodes inserted; the surrounding gray mesh prevents the oocyte from rolling. D. Front of Dagan CA-1B amplifier in the TEV setting. The digital monitor is set to V2 showing the bath clamp; note that the amplifier internally inverts the command (i.e., a -80 mV holding shows +80 mV). To the right, the CLAMP is in the ON position and BATH/GUARD switch to ACTIVE.
d. Place the two glass agarose bridges into the bath to connect the bath chamber to each of the two back wells.
i. To make the agarose bridges, take the 3.5” glass capillaries and cut to approximately 1.5’’ length with a file or glass cutter (Figure 8A and B). Using a Bunsen burner and tweezers, flame the end of the glass so a bend will appear approximately 0.25” from the end. Cut longer pieces if you want taller bridges. Let it cool down. Using the tweezers, grab the bent end and flame the other side to bend that end about the same height. Keep the glass such that the bend happens in the same direction as the first bend. The end result should look like a bridge.
ii. Thread a piece of palladium wire through the open tube. Cut at a length such that the wire does not stick out from the glass. Tuck the wire into the bridge so neither end sticks out (Figure 8C and D).
iii. To prepare the agarose, measure enough agarose for a 2% solution in bridge buffer. We tend to make about 50 mL at a time. Transfer the solution to a low-sided beaker. The low side will make the transfer of the solution into the glass bridge easier.
iv. Melt the agarose in the microwave making sure it does not boil over, as that will change the concentration of the agarose. Place the melted agarose on a hot plate to keep it hot and melted.
v. The 3.5” glass capillaries come with a suction tube that can be connected on one side to the bridge and the other side to a syringe (Figure 8E and F).
vi. Once both sides are sealed, fill up the agarose solution into the bridge. Because air bubbles will disrupt the connection, we keep filling into the suction tube. Remove from the melted agarose and leave for approximately 10–20 s, letting the agarose in the bridge solidify; then, remove from the seal (Figure 8G).
vii. We prepare several bridges with inserted wires before melting the agarose. Let them all solidify completely and inspect for any air bubbles inside or at the ends. If air bubbles are visible, discard. If none are visible, test the bridges with the next step of the protocol. When stored in bridge solution, bridges last for years.
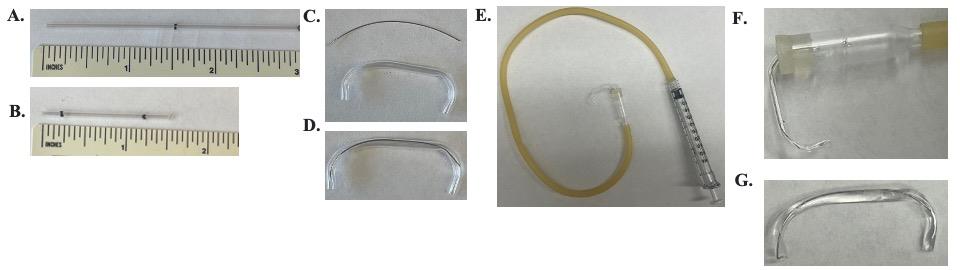
Figure 8. Making of agarose bridges. A. 3.5” glass capillary marked at 1.5”. B. The glass capillary from A cut with bend points marked 0.25” from either end. C. Top: palladium wire cut the length of the glass capillary. Bottom: the glass capillary bent at the 0.25” mark. D. Palladium wire threaded through the bent glass capillary. E. Bent and palladium-filled glass capillary attached to the suction tube, which is attached to a syringe. F. Close view of the bent and palladium-filled glass capillary attached to the suction tube. G. The final bridge made of a bent glass capillary filled with the bridge agarose solution and a palladium wire.
e. On the amplifier, turn the BATH/GUARD switch to ACTIVE (Figure 7D). If the bridges are good (both are needed), then the middle display under “Clamp” on the amplifier will read the number of nA needed to zero the voltage from the bath. If a single bridge is removed while the BATH/GUARD switch is ACTIVE, then the display will max out because of the open circuit and display a -1 or a 1.
f. Inspect the microelectrode holders for cleanliness and chlorination of the silver wire as verified by a dull gray appearance. Place the microelectrode holders onto the V1 and Vi headstages.
If part of the wire is shiny, remove the wire and soak in undiluted household bleach for a duration from 1 h to overnight. Be sure to rinse off excess bleach with diH2O before replacing it onto the electrode holder (Figure 7B).
g. Pull the glass microelectrodes using the Narishige puller on the appropriate settings that will give a resistance measure between 0.2 and 1 MΩ (see step E1n).
Tip: We only pull two glass microelectrodes before turning the puller off to allow it to cool for 15 min before pulling another two glass microelectrodes (if needed). This pause period helps maintain the quality of the microelectrode pulled by not overheating the filament.
Tip: Glass microelectrodes are fragile and should be handled with care. An easy microelectrode holder can be made from a 150 mm Petri dish with modeling clay pressed into the bottom to hold the electrodes (Figure 9).
Figure 9. Dish for holding glass microelectrodes. The holder is a 150 mm Petri dish with modeling clay pressed into the bottom.
h. Use a blunted 25-gauge needle to backfill the glass electrodes with 3 M KCl about halfway up the glass. With the sharp tip of the glass electrode down, flick out any bubbles that may have formed in the tip of the glass electrode, so that the air bubbles rise through the solution. The bubbles may be visible as they rise. Bubbles between the tip of the glass electrode and the wire will increase resistance leading to a poor clamp of the cell.
i. Securely fit the 3 M KCl-filled glass microelectrodes into their holders and place into the bath solution.
j. Open the Clampex software and set the holding voltage to -80 mV.
k. Lower both electrodes so that the tips are in the recording solution.
l. On the amplifier, press the V1 monitoring button. Adjust the V1 OFFSET knob until the electrode digital meter reads the applied holding voltage in the opposite sign (i.e., holding voltage is -80 mV, therefore the digital meter will read +80 mV).
m. Press the Vi monitoring button. Adjust the Vi OFFSET knob until the electrode digital meter reads the applied holding voltage in the opposite sign.
n. Press the V1 monitoring button and turn the “Z TEST” button in the V1 column to the ON position. The displayed value is the resistance of the V1 microelectrode. Press the Vi monitoring button and turn the “Z TEST” button in the Vi column to the ON position. The displayed value is the resistance of the Vi microelectrode.
i. Each microelectrode resistance should measure between 0.2 and 1 MΩ.
ii. If a microelectrode measures out of the resistance range, replace the glass microelectrode. A resistance higher than 1 MΩ could indicate air bubbles. Carefully remove the glass electrode and flick again to remove any remaining bubbles to lower the resistance (see step E1g).
o. To prevent light contamination of the fluorometry, turn off the lights in the room and turn on a desk lamp facing away from the VCF setup.
Tip: If unable to turn the room lights off, cloth blackout covers can be made to sit on top of the Faraday cage to protect the samples from the light.
2. After setting up the VCF rig, pull the electrodes out of the recording solution and then place the oocyte into the bath chamber. Gently roll the oocyte until the dark animal pole faces down onto the glass coverslip. We use a mesh to keep the oocytes from rolling around on the coverslip.
a. Roll by either pipetting up and down or through gentle pushing with an empty pulled glass microelectrode that has been flamed to create a closed blunted tip, like a hockey stick.
3. Bring the objective into focus on the oocyte. Because the oocyte will cover most of the field of view when using a 20× objective, aim to focus on the granules that give the dark pole its color since these will represent the bottom of the oocyte.
4. On the amplifier, press the monitoring button for V1-V2. If the offsets were properly adjusted as in step E1i–k, then the digital meter will read 0 volts, as both V1 and V2 are set to reading the bath clamp at 80 mV. Impale the V1 microelectrode into the oocyte membrane with as shallow a penetration as possible. We use the same technique here as we do when injecting the cells. The value of V1-V2 will increase as soon as the oocyte is impaled; this value is the oocyte resting membrane potential.
a. While the resting membrane potential is dependent on the health of the oocyte, the protein expressed, and the solution conditions of the oocyte, for our given experiments with Ci-VSP G214C in ND-96, the resting membrane potential should range from -20 to -60 mV. Values close to 0 mV indicate that the oocyte quality is poor. These poor-quality cells are discarded as they typically will not reliably hold a voltage clamp.
5. Repeat step E4, this time impaling the oocyte with the Vi microelectrode and using the V1-Vi digital meter (Figure 7C). Before the oocyte is impaled with Vi, both the monitors for V1-V2 and V1-Vi should read the resting membrane potential, as both V2 and Vi are still reading the bath clamp at 80 mV. As soon as the Vi microelectrode impales the oocyte, the V1-Vi digital meter will read 0 mV, as both V1 and Vi are reading the same oocyte internal values.
Tip: Simultaneous impalement makes it less likely that the oocyte will roll away. Create a divot with both electrodes and then tap the manual manipulators. That degree of force is usually enough to pop the electrode into the cell without damaging the cell.
6. Do a final focus of the objective on the oocyte (should just be small fine adjustments at this point).
7. Switch the microscope prism to send the emission light to the PMT port instead of the eye port. If using a blackout cover, lower the cover over the opening of the Faraday cage now.
8. On the amplifier, switch the CLAMP to the ON position (Figure 7D). If the oocyte is properly clamped, the V1 monitor should read 0 mV, as V1 monitors the inside of the cell held at a virtual ground, while the bath is voltage-clamped to the set holding voltage (-80 mV) as monitored by V2. Therefore, when the clamp is on, the V1-V2 monitor should read the oocyte holding voltage of -80 mV.
9. Turn the CLAMP GAIN knob to the ½ position. To confirm the integrity of the clamp and determine the clamp gain settings, run a single voltage pulse going from -80 mV to +150 mV for 125 ms and then back to -80 mV with the LED trigger off.
a. The Im (membrane current) signal should have minimal oscillations, and the waveform of the applied voltage pulse should be a tight square. If the Im signal shows oscillations, turn down the gain. If the voltage pulse shows a slow rise to the applied voltage step, turn the gain up. If adjusting the gain does not help, then the integrity of the oocyte membrane is likely not ideal, and another oocyte should be used.
10. Trigger the LED to turn on for 250 ms to establish the PMT baseline. Initially, the output signal from the PMT is close to 0 as there is no voltage in the system. Turn up the voltage on the PMT until the output signal measures around 6 V. This level provides a good signal while avoiding the potential saturation of the PMT (10 V).
11. Then, run a single pulse protocol, holding from -80 to +150 mV for 300 ms and then back to -80 mV with the LED set to 70% of max intensity triggered during the entire protocol (before, during, and after the voltage pulse).
a. If Ci-VSP G214C is expressed and labeled properly, a fluorescence decrease will be seen, corresponding to the +150 mV step as in Figure 5 of reference [6].
12. The stepwise VCF voltage protocol used in our lab consists of 10 mV steps starting at -150 mV and ending at 200 mV with a holding potential of -80 mV. The LED should be triggered at the same time for each step in the protocol.
Data analysis
1. The ΔF/F is calculated by measuring the amplitude of fluorescence change of each pulse and dividing by the initial value.
a. Start by opening the experimental pulse recordings in Clampfit.
b. Cursor 1 & Cursor 2 are locked with 100 ms between them (right click, Lock to Partner) and are moved to the fluorescence baseline before the voltage change is applied.
c. Cursor 3 & Cursor 4 are locked with 10 ms between them (right click, Lock to Partner) and are placed at the point where the fluorescence signal reaches the plateau before the end of the voltage step.
d. Under the Analyze tab, press the Statistics button (or Alt+S). This writes the mean value of each cursor pair into the results window.
e. Copy the values from the results window into Excel and calculate ΔF/F by ΔF/F = [(Fx - F0)/F0]. F0 is the initial fluorescence baseline value (Cursor 1–2) and Fx is the plateau of the fluorescence signal (Cursor 3–4).
2. To display the fluorescence signal, it is normalized in Clampfit by zeroing the fluorescence baseline.
a. Save this file as a .atf file (making sure that all signals and the whole trace options are selected to be saved).
b. Open this file in Igor: Data, Load Waves, Load Waves… In the Load Waves window that pops up, select General Text and select the file under the Path option.
c. Under Windows, select New Graph. In the New Graph popup window, the Y Wave selected is the fluorescence trace signal and the X Wave selected is the time signal.
3. In Igor, the normalized fluorescence signal is used to generate the kinetic fits. Both the activation and repolarization kinetics are obtained from either a single or double exponential.
a. To fit the activation kinetics:
i. The normalized fluorescence signal from step 2 is zoomed into the start of the fluorescence change.
ii. Cursor A is placed at the first decrease in the fluorescence signal.
iii. Cursor B is placed at the plateau of the fluorescence change.
iv. Under the Analysis tab, click Curve Fitting… In the popup window, under the Function and Data tab, select either the single exponential (exp) or the double exponential (dblexp).
v. Under the Data Options tab, select the Range as Cursors.
vi. Press Do It to run the fit.
b. To fit the repolarization kinetics, the steps are the same as in step 3a. However, move Cursor A to the very start of the fluorescence signal repolarization where the voltage pulse has returned to the -80 mV holding potential. And move Cursor B to the point where the fluorescence signal has returned to baseline.
c. To determine whether a single or double exponential fit is more appropriate, start with a single exponential and visually determine whether the fit follows the data. If parts of the data are not properly represented by the fit, try a double exponential. In general, a double exponential is almost always better than a single, but to justify the additional parameters, a significant improvement of the fit is needed. See Figure 2d in [5] for an example. To quantitate whether the improvement is sufficient, we use residuals (data point minus the fit).
4. F/V curves are created by taking the amplitude of fluorescence change of the normalized fluorescence signal and plotting that value against the corresponding voltage value.
a. The fluorescence trace is opened in Clampfit. Cursors 1 and 2 are placed to select the last 10 ms of the voltage pulse. Cursor 3 is placed toward the end of the voltage pulse.
i. Press the I/V button.
ii. In the resulting I-V window popup, set cursor 3 as the X-axis so the values correspond to the actual applied voltage.
iii. The Y-axis values correspond to the mean of the value between cursor 1 and 2 in the fluorescence signal.
iv. After pressing ok, this writes the F/V values into the results window.
b. The F/V values are then imported into Igor to be normalized from -1 to 0 by dividing all the fluorescence signal values by the fluorescence signal value at the +200 mV stimulus.
c. The F/V curves are then fit with either a single or double Boltzmann sigmoid equation (Igor lists this option just as a sigmoid) to obtain the V1/2 and slope values.
i. The double sigmoid equation is manually added into Igor using the following equation:
ii. To overlay multiple F/Vs, we recommend re-normalizing the curves to the individual curve fits. This will give exact -1 and 0 values at the ends of the curves, facilitating the visual observation and comparison of the V1/2 and slope values.
Validation of protocol
This protocol or parts of it was used in the following research article:
• Rayaprolu et al. [6]. Hydrophobic residues in S1 modulate enzymatic function and voltage sensing in voltage-sensing phosphatase. Journal of General Physiology. (Figure 5, Figure S2, and Figure S3)
General notes and troubleshooting
General notes
1. The voltage clamping procedures outlined in this protocol are specific to the Dagan CA-1B amplifier, which is no longer manufactured. There are other models of voltage clamp amplifiers on the market, such as the currently available Axoclamp 900A Amplifier (Molecular Devices), TEC-03X, and TEC-10CX (Npi Electronic). While the principles of two-electrode voltage clamp are the same, the specifics of user interface change. Please follow the directions for setting up two-electrode voltage clamping per each specific manufacturer.
2. This protocol does not cover the setting up of a solution exchange system for the bath chamber as it was not needed in the experiments detailed here. However, the rapid changing of the bath solution surrounding the oocyte is a route experimental variable that can easily be set up in any VCF system.
3. This protocol details fluorometry using a cysteine crosslinking fluorophore (TMRM). Other fluorescent reporters are also suitable for VCF including Alexa dyes, Monobromo(trimethylammonio)bimane bromide (qBBr), or fluorescein. Additionally, to probe sites not extracellularly available, ANAP [3-(6-acetylnaphthalen-2-ylamino)-2-aminoprop anoic acid] [14], a fluorescent unnatural amino acid incorporated by genetic means, can be used.
4. VSP does not contain any extracellularly available native cysteines; however, other proteins of interest may have extracellularly available native cysteines that may also be labeled with TMRM. Two problems may arise from this native labeling. The labeled native cysteine may respond to voltage and generate its own VCF signal. If this signal is not wanted, we recommend mutating the native cysteine residues to create a cysteine-less background. The cysteine-less protein must be tested to measure the extent to which cysteine replacement did or did not affect function. If the native cysteine labels but does not change fluorescence with voltage, then the experimenter needs to decide if the background fluorescence is low enough for a true voltage-dependent signal to be detected. If so, then leave the native cysteine. If the background fluorescence is too high to see signals, we again recommend generating a cysteine-less protein. If a cysteine-less protein is not an option because it is unacceptably functionally changed, we recommend testing other attachment chemistries like methanethiosulfonate (MTS) or other fluorophores, since the size of the fluorophore will impact the labeling efficiency depending on the exposure of the cysteine. Another option is to change the method of the fluorophore incorporation to a genetic incorporation of an unnatural amino acid such as ANAP [14].
Troubleshooting
Problem 1: Poor oocyte health.
Possible cause: Improper incubating solution or issues with overexpression of the protein.
Solution: Ensure that the ND-96 solution is not contaminated and is at the correct pH and osmolarity. If the ND-96 solution is good, then lowering the incubation temperature to slow the trafficking of the protein can be useful. In addition, injecting less RNA and empirically determining incubation times is useful. While we use the cells for a week after processing, their health can decline during those 7 days. Using cells the day after processing will usually result in better experiments.
Problem 2: Poor protein expression, small or no fluorescence change.
Possible cause: Poor mRNA quality or issues with the protein expression.
Solution: Make sure that the mRNA is produced under RNase-free conditions to prevent degradation. Check for degradation using RNA gels. The concentration of the solution will not necessarily reflect degradation. Store RNA at ≤-20 °C and keep on ice while using. Make sure the DNA linearization reaction is complete. The RNA polymerase is very processive and will not easily fall off any contaminating plasmid, therefore producing nonfunctional RNA. Increasing incubation time and temperature may also improve protein expression.
Problem 3: Pink hue on oocytes after labeling.
Possible cause: The oocytes have been over labeled and the TMRM in the membrane creates a high background of fluorescence.
Solution: Take care to label the oocytes on ice for no longer than 20 min. Increase wash time and volume. TMRM will also label the membranes when they are compromised. If the proper labeling conditions have been followed and the pink hue is still present, the plasma membranes are absorbing the dye and are unlikely to clamp properly.
Acknowledgments
This protocol is related to the following paper: Rayaprolu et al. Hydrophobic residues in S1 modulate enzymatic function and voltage sensing in voltage-sensing phosphatase https://doi.org/10.1085/jgp.202313467. We thank Y. Okamura for providing the Ci-VSP cDNA. This work was supported by funds from the National Institute of General Medical Science of the National Institutes of Health grants R01GM111685 (S.C.K.) and National Science Foundation grant 2310489 (S.C.K.).
Competing interests
Authors declare no competing financial interests.
Ethical considerations
All animal tissue used was purchased from approved suppliers of Xenopus laevis oocytes.
References
- Mannuzzu, L. M., Moronne, M. M., and Isacoff, E.Y. (1996). Direct physical measure of conformational rearrangement underlying potassium channel gating. Science. 271(5246): 213–216.
- Cha, A. and Bezanilla, F. (1997). Characterizing voltage-dependent conformational changes in the Shaker K+ channel with fluorescence. Neuron. 19(5): 1127–1140.
- Dürr, K. L., Abe, K., Tavraz, N. N. and Friedrich, T. (2009). E2P State Stabilization by the N-terminal Tail of the H,K-ATPase β-Subunit Is Critical for Efficient Proton Pumping under in Vivo Conditions. J Biol Chem. 284(30): 20147–20154.
- Young, V. C. and Artigas, P. (2021). Displacement of the Na+/K+ pump’s transmembrane domains demonstrates conserved conformational changes in P-type 2 ATPases. Proc Natl Acad Sci USA. 118(8): e2019317118.
- Kohout, S. C., Ulbrich, M. H., Bell, S. C. and Isacoff, E. Y. (2008). Subunit organization and functional transitions in Ci-VSP. Nat Struct Mol Biol. 15(1): 106–108.
- Rayaprolu, V., Miettinen, H. M., Baker, W. D., Young, V. C., Fisher, M., Mueller, G., Rankin, W. O., Kelley, J. T., Ratzan, W. J., Leong, L. M., et al. (2024). Hydrophobic residues in S1 modulate enzymatic function and voltage sensing in voltage-sensing phosphatase. J Gen Physiol. 156(7): e202313467.
- Murata, Y., Iwasaki, H., Sasaki, M., Inaba, K. and Okamura, Y. (2005). Phosphoinositide phosphatase activity coupled to an intrinsic voltage sensor. Nature. 435(7046): 1239–1243.
- Villalba-Galea, C. A., Sandtner, W., Starace, D. M. and Bezanilla, F. (2008). S4-based voltage sensors have three major conformations. Proc Natl Acad Sci USA. 105(46): 17600–17607.
- Villalba-Galea, C. A., Miceli, F. and Bezanilla, F. (2009). Uncoupling Of The Phosphatase Produces A Deeper Relaxation Of Ci-VSP. Biophys J. 96(3): 370a.
- Kohout, S. C., Bell, S. C., Liu, L., Xu, Q., Minor, D. L. and Isacoff, E. Y. (2010). Electrochemical coupling in the voltage-dependent phosphatase Ci-VSP. Nat Chem Biol. 6(5): 369–375.
- Mizutani, N., Kawanabe, A., Jinno, Y., Narita, H., Yonezawa, T., Nakagawa, A. and Okamura, Y. (2022). Interaction between S4 and the phosphatase domain mediates electrochemical coupling in voltage-sensing phosphatase (VSP). Proc Natl Acad Sci USA. 119(26): e2200364119.
- Castle, P. M., Zolman, K. D. and Kohout, S. C. (2015). Voltage-sensing phosphatase modulation by a C2 domain. Front Pharmacol. 6: e00063.
- Paixao, I. C., Mizutani, N., Matsuda, M., Andriani, R. T., Kawai, T., Nakagawa, A., Okochi, Y. and Okamura, Y. (2023). Role of K364 next to the active site cysteine in voltage-dependent phosphatase activity of Ci-VSP. Biophys J. 122(11): 2267–2284.
- Kalstrup, T. and Blunck, R. (2013). Dynamics of internal pore opening in KV channels probed by a fluorescent unnatural amino acid. Proc Natl Acad Sci USA. 110(20): 8272–8277.
Article Information
Publication history
Received: Nov 11, 2024
Accepted: Dec 30, 2024
Available online: Jan 19, 2025
Published: Feb 20, 2025
Copyright
© 2025 The Author(s); This is an open access article under the CC BY-NC license (https://creativecommons.org/licenses/by-nc/4.0/).
How to cite
Young, V. C., Rayaprolu, V. and Kohout, S. C. (2025). Voltage Clamp Fluorometry in Xenopus laevis Oocytes to Study the Voltage-sensing Phosphatase. Bio-protocol 15(4): e5212. DOI: 10.21769/BioProtoc.5212.
Category
Biophysics > Electrophysiology > Patch-clamp technique
Biochemistry > Protein > Fluorescence
Do you have any questions about this protocol?
Post your question to gather feedback from the community. We will also invite the authors of this article to respond.