- Protocols

- Articles and Issues
- For Authors
- About
- Become a Reviewer

Profiling the Secretome of Glioblastoma Cells Under Histone Deacetylase Inhibition Using Mass Spectrometry
Published: Vol 15, Iss 3, Feb 5, 2025 DOI: 10.21769/BioProtoc.5197 Views: 2091
Reviewed by: Nona FarbehiRupam GhoshAnonymous reviewer(s)
Original research article
The authors used this protocol in:
Mar 2024
Advertisement


Protocol Collections
Comprehensive collections of detailed, peer-reviewed protocols focusing on specific topics


Related protocols


Abstract
Glioblastoma (GBM) is the most aggressive brain tumor, and different efforts have been employed in the search for new drugs and therapeutic protocols for GBM. A label-free, mass spectrometry–based quantitative proteomics has been developed to identify and characterize proteins that are differentially expressed in GBM to gain a better understanding of the interactions and functions that lead to the pathological state focusing on the extracellular matrix (ECM). The main challenge in GBM research has been to identify novel molecular therapeutic targets and accurate diagnostic/prognostic biomarkers. To better investigate the GBM secretome upon in vitro treatment with histone deacetylase inhibitor (iHDAC), we employed a high-throughput label-free methodology of protein identification and quantification based on mass spectrometry followed by in silico studies. Our analysis revealed significant changes in the ECM protein profile, particularly those associated with the angiogenic matrisome. Proteins such as decorin, ADAM10, ADAM12, and ADAM15 were differentially regulated upon in silico analysis. In contrast, key angiogenesis markers such as VEGF and ECM proteins like fibronectin and integrins did not display significant changes. These results suggest that iHDAC inhibitors may modulate or suppress tumor behavior growth by targeting ECM proteins’ secretion rather than directly inhibiting angiogenesis.
Key features
• Analysis of the secretome of U87MG glioblastoma cells.
• Studies of mass spectrometry designed to modulate GBM biology and behavior focused on histone deacetylase inhibitors (iHDAC).
• Mass spectrometry was developed to identify and characterize proteins that are differentially expressed in GBM.
Keywords: EpigeneticsGraphical overview
Background
The identification of novel molecular therapeutic targets and accurate diagnostic/prognostic biomarkers has been a major challenge in glioblastoma (GBM) research. Proteins have the potential to be used as diagnostic and prognostic biomarkers in patients with brain tumors. They can be detected in glioblastoma cells and in liquid matrices such as blood and its derivatives, cerebrospinal fluid (CSF), and urine [1]. Currently, the main approach in the search for tumor markers is the study of proteomic profiling, along with the study of gene expression [2]. In the repertoire of tumor-associated proteins, a great variety of functional proteins, peptides, and other biomolecules are secreted or released by tumor cells to promote abnormal cell growth, invasion, and metastasis. Some of these proteins include growth factors, chemokines, and angiogenic factors, resulting in ECM remodeling, modulation of cellular signaling, and inflammatory responses in the tumor microenvironment. These proteins belong to pathways classically related to alterations in the tumor microenvironment and, for this reason, might be eligible as biomarkers for tracking tumor growth or relapse in non-invasive strategies upon surgery, chemo, and radiotherapy [3,4]. In this sense, the tumor secretome may reflect tumor behavior and predict patient management. In this work, we studied the alterations in the GBM secretome upon the treatment of U87-MG cells with a histone deacetylase inhibitor (iHDAC). In fact, preclinical studies have demonstrated the efficiency of different iHDACs as antitumor agents, especially when associated with other therapies, including chemotherapy and radiotherapy [5]. The main mechanisms involved in iHDACs efficiency as anti-tumor drugs are related to the reduction in the expression of genes involved in DNA repair, mitotic spindle formation, homologous chromosome segregation, and positive modulation of apoptosis [6].
The translation of iHDAC inhibitors into clinical practice requires a deeper understanding of their mechanism of action. To advance the clinical application of iHDAC inhibitors, it is essential to understand their impact on the tumor mechanisms that shape their microenvironment. By combining epigenetic and biochemical profiling, we can uncover the link between iHDACs and secreted molecular factors that drive tumor growth and potentially lead to new therapeutic strategies [7].
To understand how iHDAC inhibitors influence glioblastoma (GBM) secretome, we examined the total set of proteins secreted by iHDAC-treated GBM cells using mass spectrometry. Our analysis revealed significant changes in the extracellular matrix (ECM) protein profile, particularly those associated with the angiogenic matrisome. Proteins such as decorin, ADAM10, ADAM12, and ADAM15 were differentially regulated upon in silico analysis. In contrast, key angiogenesis markers such as VEGF and the ECM proteins fibronectin and integrins did not display significant changes. These results indicate that iHDAC inhibitors may modulate tumor behavior by targeting the ECM proteins’ secretion, rather than directly inhibiting angiogenesis [7].
Here, we describe a step-by-step protocol for our GBM cell line secretome analysis protocol, further categorization of tumor-secreted proteins, and the characterization of pathways in which these proteins play already known roles.
Materials and reagents
Biological materials
1. U87MG glioblastoma cell line (Banco de Células do Rio de Janeiro, BCRJ Code: 0241)
Reagents
1. Dulbecco's modified Eagle's medium (DMEM) low glucose (Sigma-Aldrich, catalog number: D5523)
2. Fetal bovine serum (FBS) (LGC Biotecnologia, catalog number: 10BioPlus-500)
3. Penicillin and streptomycin (PS) (Sigma-Aldrich, catalog number: P4333)
4. DMEM low-glucose without red phenol (Sigma-Aldrich, catalog number: D2902)
5. Trichostatin A (TSA) (Sigma-Aldrich, catalog number: T1952)
6. Sodium chloride (NaCl) (Sigma-Aldrich, catalog number: S3014)
7. Magnesium chloride (MgCl2·2H2O) (Sigma-Aldrich, catalog number: M8266)
8. Calcium chloride dihydrate (CaCl2·2H2O) (Sigma-Aldrich, catalog number: 223506)
9. Potassium chloride (KCl) (Sigma-Aldrich, catalog number: P3911)
10. Sodium phosphate dibasic (Na2HPO4) (Sigma-Aldrich, catalog number: S9763)
11. Dimethyl sulfoxide (DMSO) (Sigma-Aldrich, catalog number: D2650)
12. HaltTM protease inhibitor cocktail 100× (Thermo Fisher, catalog number: 78429)
13. QubitTM Protein and Protein Broad Range (BR) Assay kits (Invitrogen, catalog number: Q33211)
14. Urea (Sigma-Aldrich, catalog number: U4884)
15. Thiourea (Sigma-Aldrich, catalog number: T8656)
16. HEPES [4-(2-hydroxyethyl)-1-piperazineethanesulfonic acid] (Sigma-Aldrich, catalog number: 5310-OP)
17. DL-Dithiothreitol (DTT) powder (Sigma-Aldrich, catalog number: 43819-5g)
18. Iodoacetamide (IAA) powder (Sigma, catalog number: I1149-25g)
19. Sequencing-grade modified trypsin (Promega, catalog number: V5111), see the product information
20. Formic acid LC–MS grade (Thermo Fisher Scientific, catalog number: 28905)
21. Acetonitrile (ACN) (Sigma-Aldrich, catalog number: 900667)
Solutions
1. Phosphate buffer saline (PBS) (see Recipes)
2. NaCl 2 M solution (see Recipes)
3. Urea lysis buffer (see Recipes)
4. DTT solution (see Recipes)
5. IAA solution (see Recipes)
6. Solvent A (ACN 5% and formic acid 0.1%) (see Recipes)
7. Solvent B (ACN 95% and formic acid 0.1%) (see Recipes)
Recipes
1. Phosphate buffer saline 10× (PBS)
Note: Dissolve all reagents in 800 mL of H2O. Adjust the pH to 7.4 (or 7.2, if required) with HCl, and then add H2O to 1,000 mL.
| Reagent | Final concentration (10×) | Quantity or Volume |
|---|---|---|
| NaCl | 137 mM | 80 g |
| KCl | 2.7 mM | 2 g |
| Na2HPO4 | 10 mM | 14.4 g |
| KH2PO4 | 1.8 mM | 2.4 g |
| CaCl2·2H2O | 1 mM | 1.33 g |
| MgCl·2H2O | 0.5 mM | 1.0 g |
| H2O MilliQ | n/a | 800 mL |
| Total | n/a | 1,000 mL |
2. NaCl 2 M solution
Note: Dissolve 116.9 g of NaCl in approximately 800 mL of H2O MilliQ, then add more water until a final volume of 1,000 mL.
| Reagent | Final concentration | Amount |
|---|---|---|
| NaCl | 2 mol/L | 116.9 g |
| H2O MilliQ | n/a | 800 mL |
| Total | n/a | 1,000 mL |
3. Urea lysis buffer
Note 1: Dissolving urea is an endothermic reaction. The preparation can be facilitated by placing a stir bar in the beaker and using a warm water bath on a stir plate. Attention, this water should not be too hot! To prevent urea from precipitating, the buffer should be used at room temperature.
Note 2: The urea lysis buffer should be prepared before each experiment. Aliquots can be stored in the -80 °C freezer for up to 6 months.
| Reagent | Final concentration | Amount |
|---|---|---|
| Urea | 7 mol/L | 42.04 g |
| Thiourea | 2 mol/L | 15.22 g |
| HEPES | 0.2 mol/L | 4.76 g |
| H2O MilliQ | n/a | 80 mL |
| Total | n/a | 100 mL |
4. DTT solution
Note: Dissolve 5 g of DTT in 324.14 mL of distilled water. After weighing the powder, store at -20 °C for up to one year. Thaw one aliquot for each experiment.
| Reagent | Final concentration | Amount |
|---|---|---|
| DTT | 100 mM | 5 g |
| H2O MilliQ | n/a | 324.14 mL |
5. Iodoacetamide (IAA) solution
Note: Dissolve 25 g of iodoacetamide in 338 mL of distilled water. After weighing the powder, store in the dark and add water only immediately before use. The iodoacetamide solution should be prepared just before use in each experiment.
| Reagent | Final concentration | Amount |
|---|---|---|
| Iodoacetamide | 400 mM | 25 g |
| H2O MilliQ | n/a | 338 mL |
6. Solvent A
| Reagent | Final concentration | Amount |
|---|---|---|
| Acetonitrile | 5% | 0.5 mL |
| Formic acid | 0.1% | 0.01 mL |
| H2O MilliQ | n/a | 10 mL |
7. Solvent B
| Reagent | Final concentration | Amount |
|---|---|---|
| Acetonitrile | 95% | 9.5 mL |
| Formic acid | 0.1% | 0.01 mL |
| H2O MilliQ | n/a | 10 mL |
Laboratory supplies
1. Pipettes (Eppendorf)
2. Tips (Eppendorf)
3. 50 mL Falcon centrifuge tubes, polypropylene, sterile (Corning, catalog number: 352070)
4. Microcentrifuge tube (Corning, Axygen, catalog number: MCT-150-C)
5. Becker
6. Water baths
7. Analytical Balance
8. 150 cm2 U-shaped canted neck cell culture flask with plug seal cap (Corning, catalog number: 430823)
9. Amicon Ultra-15 centrifugal filter unit (Meck Millipore, catalog number: UFC900324)
10. Pierce® C18 tips (87784 Pierce C18 Tips, 100 μL, 96 tips)
Equipment
1. Centrifuge
2. Centrifuge Heraeus Megafuge 8R (Thermo Fisher Scientific, catalog number: 75007214)
3. Sorvall centrifuge (Thermo Fisher Scientific, model: Lynx 4000)
4. CO2 incubator for cell culture (Thermo Fisher Scientific, model: 310 Series)
5. Speedvac (Thermo Fisher Scientific, model: SC210P1-15)
6. Thermomixer R with 1.5 mL block (Eppendorf, catalog number: Z605271)
7. -20 °C freezer (Thermo Fisher Scientific)
8. -80 °C freezer (Thermo Fisher Scientific)
9. Qubit protein assay kit, 500 assays (Thermo Fisher, catalog number: Q33238)
10. NanoLC (liquid chromatography) (Thermo Fisher Scientific, model: Easy1000)
11. Mass spectrometer (Thermo Fisher Scientific, model: Q ExactiveTM Plus)
12. Fused silica tubing (IDEX Health and Science, catalog number: FS-110)
13. PicoTipTM Emitter PicoFritTM SELF/P Capillary column (New Objective, catalog number: PF360-75-15-N-5)
14. Reprosil-Gold C18 (Dr. Maisch, catalog number: r33.9g-3g)
15. Reprosil-Pur C18 (Dr. Maisch, catalog number: r23.aq-2g)
Software and datasets
1. Software Xcalibur, Thermo Fisher Scientific, 2.2, 2011
2. Proteome Discoverer (PD), Thermo Fisher Scientific, 2.1, 2015
3. Uniprot database, 2017. Available in: https://www.uniprot.org/
4. All data have been deposited in ProteomeXchange Consortium via the PRIDE. Available at https://www.ebi.ac.uk/pride/ with the dataset identifier PXD022982 at PRIDE username: reviewer_pxd022982@ebi.ac.uk password: OBpIGRa2.
5. Microsoft Excel (Microsoft) or equivalent spreadsheet tool
Procedure
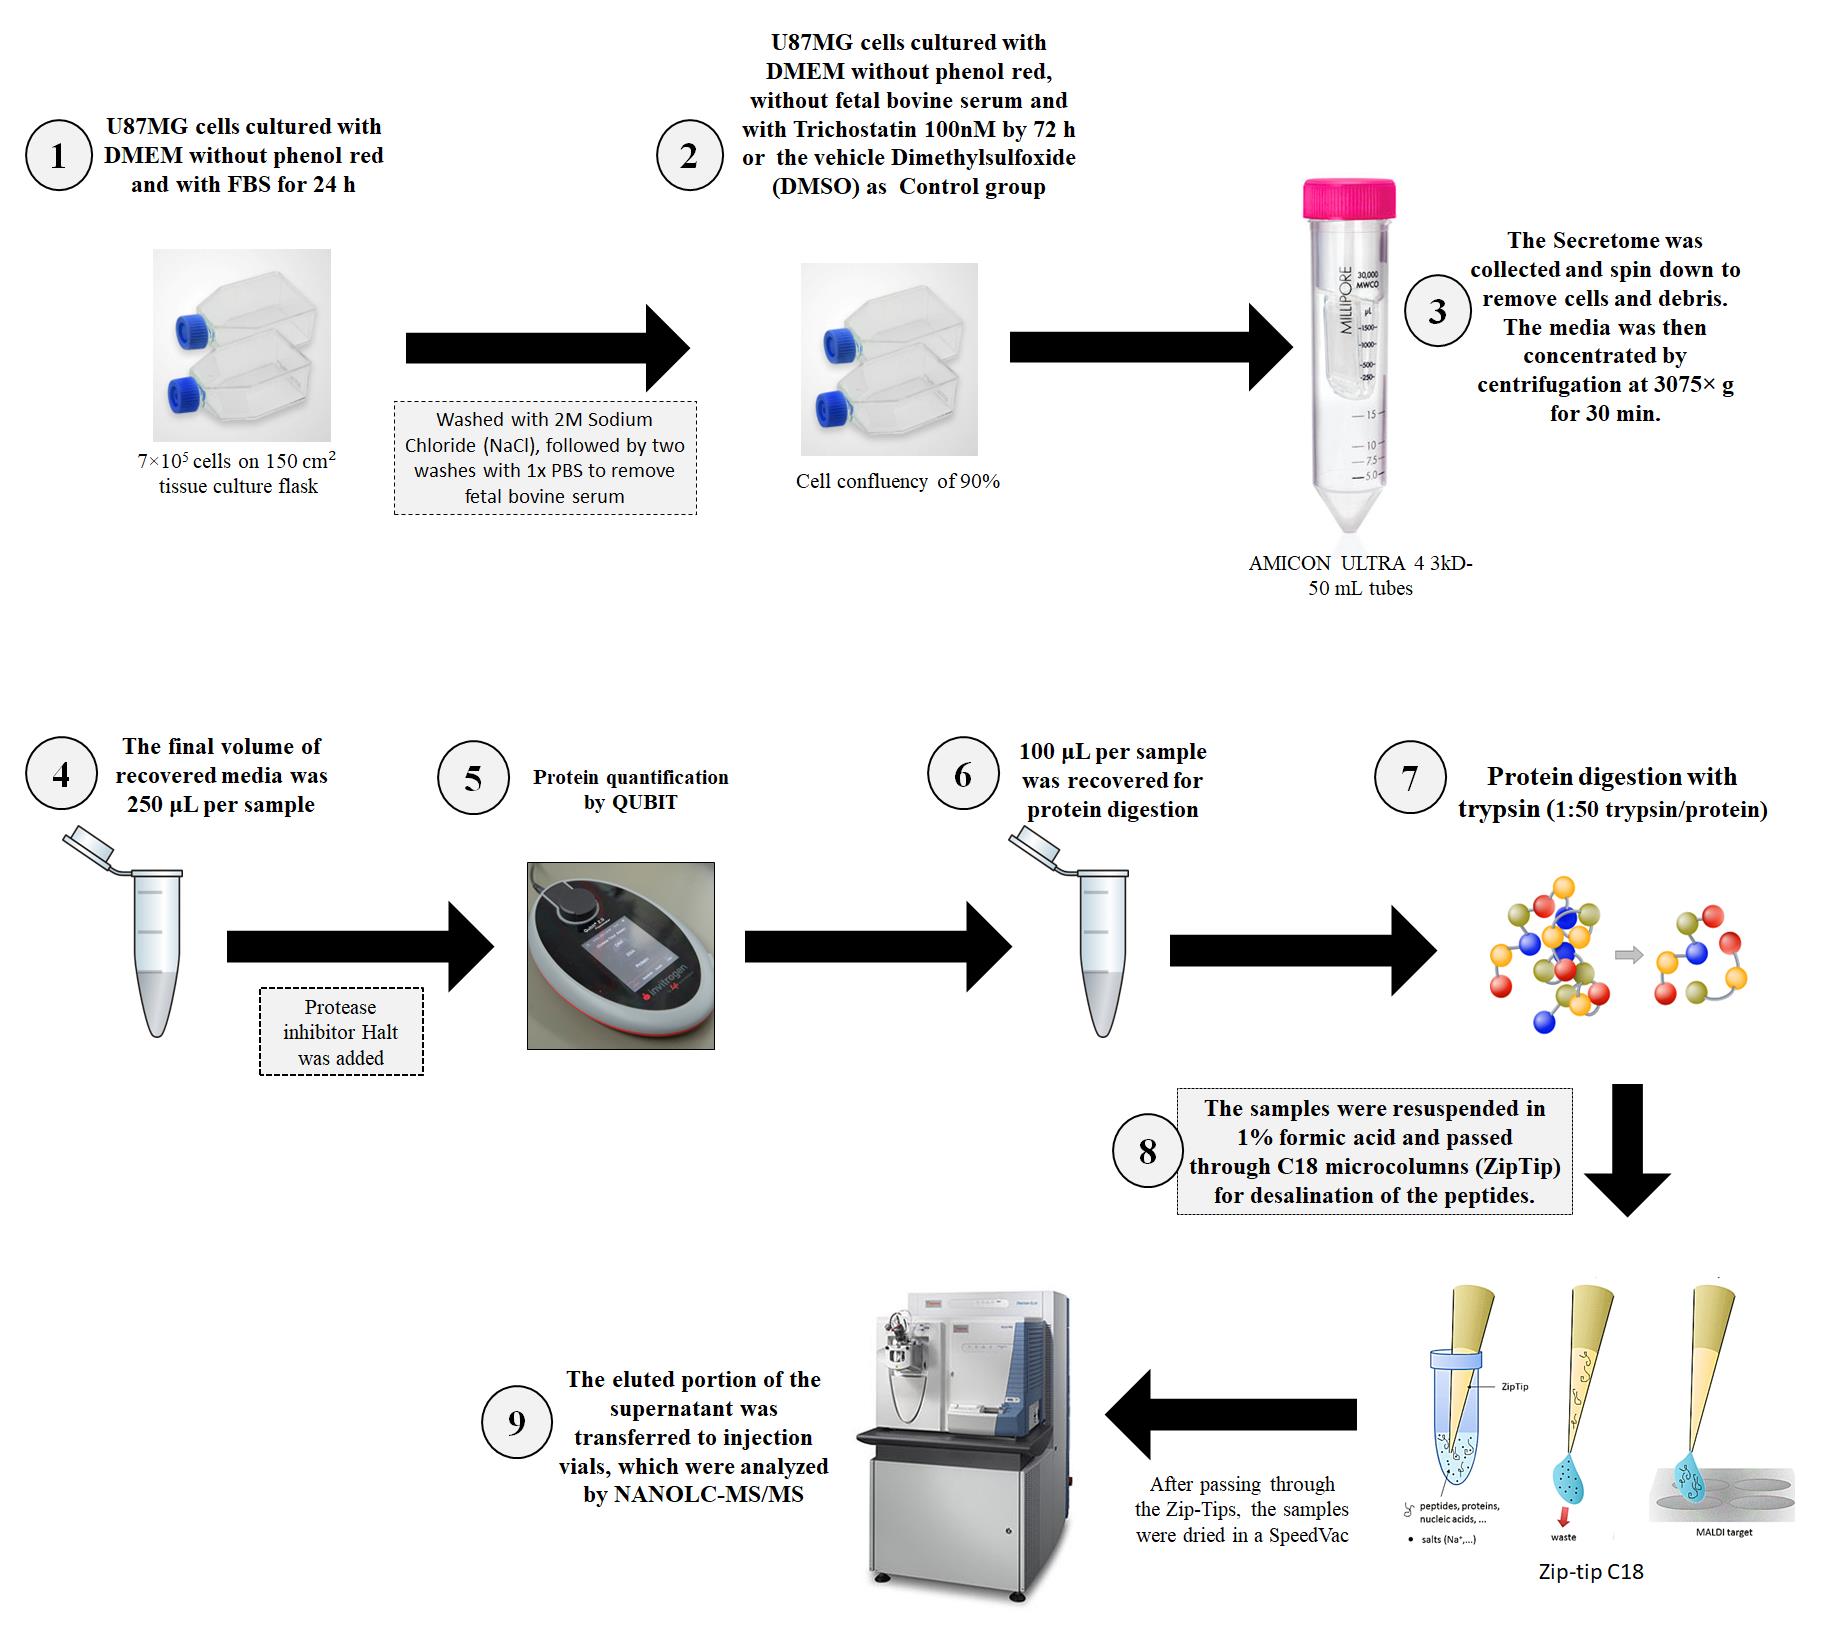
A. Preparation of conditioned medium–secretome
1. Seed U87MG GBM cells at a density of 7 × 10⁵ cells on 150 cm2 flasks with DMEM supplemented with 10% FBS and 0.1 mg/mL PS until they reach 90% confluence.
2. Maintain cultures at 37 °C with 5% CO2.
3. Wash cell cultures once with cold PBS, once with cold 2 M NaCl solution, and then twice with cold PBS to remove residues of FBS.
4. Add 50 mL of DMEM without phenol red and FBS to each 150 cm2 flask.
5. Add DMEM, low glucose, without phenol red and FBS, supplemented with trichostatin A at a concentration of 100 nM to the group under HDAC activity inhibition (here referred to as iHDAC).
6. Add the same media supplemented only with the vehicle dimethyl sulfoxide (DMSO) to the control group.
7. Carry out treatments for 72 h at 37 °C with 5% CO2.
B. Dialysis of the conditioned medium–secretome
1. Collect the conditioned media after 72 h of treatment and place in a 50 mL Falcon tube. After centrifugation at 1,200 rpm (258× g) for 10 min, collect the secretome to remove cells and debris. For secretome concentration, use AMICON ULTRA 4 3kD 50 mL tubes. Due to the limitation of volume in the AMICON tube, add only 5 mL of secretome at a time to the top of the tube and centrifuge at 5,000 rpm (3,075× g) for 30 min until the total secretome is centrifuged. At the end, concentrate the secretome until it reaches the final volume of 250 μL.
2. Add protease inhibitor Halt 1× and perform protein quantification using the Qubit Protein Assay Kit method according to the manufacturer's instructions. As a blank, use DMEM medium without phenol red.
C. Protein digestion and peptide purification
1. Dilute 100 μg of total protein in 20 μL of 7 M urea and 2 M thiourea in 0.2 M HEPES.
2. Add DTT at a final concentration of 10 mM, followed by incubation for 1 h at 30 °C in the thermomixer without stirring.
3. After incubation, add IAA at a final concentration of 40 mM and then incubate in the dark for 30 min at room temperature.
4. Dilute the solution ten-fold with standard LC–MS deionized water and add trypsin at a final concentration of 1:50 trypsin/protein (w/w). Incubate the mixture overnight at 37 °C in the thermomixer under 900 rpm rotation. (One vial of 20 μg of trypsin was diluted in 200 μL of 0.1 M acetic acid solution; this solution is provided with the trypsin.)
5. Add 1% formic acid to stop trypsin digestion and desalt the peptides using C18 microcolumns (ZipTip).
6. Transfer the purified peptides to injection vials and send to NanoLC-MS/MS analysis.
D. Analysis by NanoLC-MS/MS
1. Analyze the peptides using an Easy1000 nanoLC system coupled to a Q ExactiveTM Plus mass spectrometer.
2. Measure the concentration of peptides using the QubitTM Protein Assay kit.
3. For each sample, apply a volume of 4 μL (1 μg of peptides) to a Trap column with 200 μm of internal diameter and 2 cm long packed with Reprosil-Pur C18 with pores of 200 Å and 5 μm particle size (made at the laboratory).
4. Elute peptides in an analytical column with 75 μm diameter and 25 cm length packed with Reprosil-Gold C18 with pores of 300 Å of 3 μm granulometry (made at the laboratory).
5. For the peptide separation, use a gradient of 95% solvent A (5% ACN and 0.1% formic acid) to 20% of solvent B (95% ACN and 0.1% formic acid) for 120 min, 20%–40% solvent B for 40 min, and 40%–95% solvent B for 7 min, followed by 95% solvent B for 13 min.
6. Afterward, rebalance the column with solvent A.
7. Set the Orbitrap mass spectrometer, controlled by the Xcalibur 2.2 software, to operate with the data-dependent acquisition (DDA) mode.
8. Acquire the spectrum of MS1 with a resolution of 70,000 to 200 m/z (mass/charge).
9. Perform the reading of the MS1 spectrum using 10e6 ions (AGC) and 50 ms of Maximum IT.
10. The reading spectrum comprised ions with 375–2,000 m/z. The 15 most intense ions were fragmented and then subjected to MS2 acquisition using induced collision dissociation (HCD) and a range of 200–2,000 m/z.
11. Apply MS2 resolution at 17,500 to 200 m/z, AGC of 10e5 ions, maximum IT of 100 ms, 2 m/z ion isolation window, normalized collision energy (NCE) of 30, and dynamic exclusion time 45 s.
12. Reject peptides with undetermined charges and +1.
13. Inject peptide fractions three times to obtain three technical replicates for each one of the two biological samples of each experimental group.
E. Data analysis
1. The peptides were identified using the Sequest HT search engine.
2. Process raw files using the Proteome Discoverer (PD) 2.1 software.
3. The Uniprot database used was the Homo sapiens reference proteome (June 2017). Common contaminants of the Global Proteome machine (GPM) were used to exclude putative contaminants; after this first analysis, 42,227 protein entries were obtained.
4. The PD Sequest HT node parameters applied were: full-tryptic search space with two missed cleavages allowed, precursor mass tolerance of 10 ppm, and fragment mass tolerance of 0.05 Da.
5. Carbamidomethylation of cysteine (C) was included as a constant modification, and methionine (M) oxidation and N-terminal acetylation of proteins were included as dynamic modifications.
6. The Percolator node in Proteome Discovery 2.1 (PD 2.1) was used to estimate the false discovery rate (FDR) of <1% and protein inference using maximum parsimony.
7. A cutoff was set to accept a 1% FDR at the protein and peptide levels.
8. Protein quantification was performed using the precursor ions area detector node, with an average of up to three most intense peptides used for protein quantification, which were considered unique peptides.
9. The table of identified proteins was exported for bioinformatics and statistical studies.
10. Mass spectrometry proteomics data were submitted to the ProteomeXchange Consortium via PRIDE.
F. Statistical rationale
1. The effect of iHDAC treatment on the U87-MG GBM secretome analysis was evaluated after 72 h of treatment with 100 nM trichostatin A or DMSO as control.
2. The iHDAC and control secretomes were obtained from two biological replicates of each condition, and technical triplicates of LC–MS/MS runs were conducted for each experimental sample.
3. To check the reproducibility of the replicates, Pearson correlation was used to correlate the three technical runs of each biological sample. Next, the common proteins identified in the two biological replicates of iHDAC (TSA1 and TSA2) or in the two biological replicates of the control group (DMSO1 and DMSO2) were taken as the identified proteins in each experimental group and used to further compare the differentially secreted proteins in iHDAC and DMSO secretome.
4. Statistical analysis was carried out using Perseus v 1.6.10.50 and R. Protein area values were converted to log2 scale and normalized by subtracting the median of the sample distribution. Proteins with <50% valid values in each group (iHDAC and DMSO) were removed from the analysis.
5. The remaining proteins were subjected to missing value imputation using the default parameters (width 0.3, downshift 1.8) of the Perseus Imputation tool. GraphPad Prism (v6.0, La Jolla, CA) was used for ordinary one-way or two-way ANOVA analysis. If the ANOVA produced a significant result, post-hoc pairwise comparisons were tested for significance in which the value was adjusted (Padj < 0.05) by Tukey’s method for multiple comparisons inside each group.
6. Results were presented as mean ± SEM and statistical relevance was defined as p < 0.05.
Validation of protocol
This protocol or parts of it has been used and validated in the following research article(s):
• Menezes et al. [7]. Epigenetic Mechanisms Histone Deacetylase–Dependent Regulate the Glioblastoma Angiogenic Matrisome and Disrupt Endothelial Cell Behavior In Vitro. Molecular & Cellular Proteomics, Volume 23, Issue 3, 100722.
Acknowledgments
We thank the Unidade de Espectrometria de Massas e Proteômica (UEMP) from the Universidade Federal do Rio de Janeiro for the use of the facilities for samples preparation, Grasiella Ventura Matioszek for Confocal support, CAPES (fellowship for M.A. and J.G.), FAPERJ and Fundação do Câncer Ary Frauzino.
Funding and additional information: C.K. was supported by FAPERJ/-26/010.001760/2019 and CNPq 315751/2021-5.
Competing interests
The authors declare that they have no conflicts of interest with the contents of this article.
References
- Hosseini, A., Ashraf, H., Rahimi, F., Alipourfard, I., Alivirdiloo, V., Hashemi, B., Yazdani, Y., Ghazi, F., Eslami, M., Ameri Shah Reza, M., et al. (2023). Recent advances in the detection of glioblastoma, from imaging-based methods to proteomics and biosensors: A narrative review. Cancer Cell Int. 23(1): 98.
- Silantyev, A., Falzone, L., Libra, M., Gurina, O., Kardashova, K., Nikolouzakis, T., Nosyrev, A., Sutton, C., Mitsias, P., Tsatsakis, A., et al. (2019). Current and Future Trends on Diagnosis and Prognosis of Glioblastoma: From Molecular Biology to Proteomics. Cells. 8(8): 863.
- Bertucci, F. and Goncalves, A. (2008). Clinical Proteomics and Breast Cancer: Strategies For Diagnostic and Therapeutic Biomarker Discovery. Future Oncol. 4(2): 271–287.
- Sanders, M. E., Dias, E. C., Xu, B. J., Mobley, J. A., Billheimer, D., Roder, H., Grigorieva, J., Dowsett, M., Arteaga, C. L., Caprioli, R. M., et al. (2008). Differentiating Proteomic Biomarkers in Breast Cancer by Laser Capture Microdissection and MALDI MS. J Proteome Res. 7(4): 1500–1507.
- Shabason, J. E., Tofilon, P. J. and Camphausen, K. (2011).Grand rounds at the National Institutes of Health: HDAC inhibitors as radiation modifiers, from bench to clinic. J Cell Mol Med. 15(12): 2735–2744.
- Cornago, M., Garcia-Alberich, C., Blasco-Angulo, N., Vall-llaura, N., Nager, M., Herreros, J., Comella, J. X., Sanchis, D. and Llovera, M. (2014). Histone deacetylase inhibitors promote glioma cell death by G2 checkpoint abrogation leading to mitotic catastrophe. Cell Death Dis. 5(10): e1435.
- Menezes, A., Julião, G., Mariath, F., Ferreira, A. L., Oliveira-Nunes, M. C., Gallucci, L., Evaristo, J. A. M., Nogueira, F. C. S., Pereira, D. d. A., Carneiro, K., et al. (2024). Epigenetic Mechanisms Histone Deacetylase–Dependent Regulate the Glioblastoma Angiogenic Matrisome and Disrupt Endothelial Cell Behavior In Vitro. Mol Cell Proteomics. 23(3): 100722.
Article Information
Publication history
Received: Sep 7, 2024
Accepted: Dec 17, 2024
Available online: Jan 14, 2025
Published: Feb 5, 2025
Copyright
© 2025 The Author(s); This is an open access article under the CC BY-NC license (https://creativecommons.org/licenses/by-nc/4.0/).
How to cite
Menezes, A., Martins, Y., Nogueira, F. C. S., De Abreu Pereira, D. and Carneiro, K. (2025). Profiling the Secretome of Glioblastoma Cells Under Histone Deacetylase Inhibition Using Mass Spectrometry. Bio-protocol 15(3): e5197. DOI: 10.21769/BioProtoc.5197.
Category
Cancer Biology > Angiogenesis > Tumor microenvironment
Systems Biology > Proteomics > Secretome
Do you have any questions about this protocol?
Post your question to gather feedback from the community. We will also invite the authors of this article to respond.