- Protocols

- Articles and Issues
- For Authors
- About
- Become a Reviewer

Immunofluorescence for Detection of TOR Kinase Activity In Situ in Photosynthetic Organisms
(§Technical contact: ana.lando@inbiotec.conicet.gov.ar; gnoel@inbiotec.conicet.gov.ar) Published: Vol 14, Iss 24, Dec 20, 2024 DOI: 10.21769/BioProtoc.5140 Views: 1805
Reviewed by: Shuhei OtaMalgorzata LichockaAnonymous reviewer(s)
Original research article
The authors used this protocol in:
Oct 2024
Advertisement


Protocol Collections
Comprehensive collections of detailed, peer-reviewed protocols focusing on specific topics


Abstract
The target of rapamycin (TOR) is a central hub kinase that promotes growth and development in all eukaryote cells. TOR induces protein synthesis through the phosphorylation of the S6 kinase (S6K), which, in turn, phosphorylates ribosomal S6 protein (RPS6) increasing this anabolic process. Therefore, S6K and RPS6 phosphorylation are generally used as readouts of TOR activity. Protein phosphorylation levels are measured by a western blot (WB) technique using an antibody against one specific phosphosite in cell extracts. However, at the tissue/cell-specific level, there is a huge gap in plants due to the lack of alternative techniques for the evaluation of TOR activity as there are for other organisms such as mammals. Here, we describe an in vivo protocol to detect S6K phosphorylation in tissues/cells of model photosynthetic organisms such as Arabidopsis thaliana and Chlamydomonas reinhardtii. Our proposed method consists of the immunolocalization of a phosphorylated target of TOR kinase using a fluorescent secondary antibody by confocal microscopy. The protocol involves four main steps: tissue/cell fixation, permeabilization, and incubation with primary and secondary antibodies. It is an easy technique that allows handling different samples at the same time. In addition, different ultrastructural cell markers can also be used, such as for nucleus and cell wall detection, allowing a detailed analysis of cell morphology. To our knowledge, this is the first protocol to detect TOR activity in situ in photosynthetic organisms; we consider that it will pave the research on the TOR kinase, opening new possibilities to better understand its complex signaling.
Key features
• The protocol is an easy and non-destructive method to detect S6K phosphorylation at the cellular level for plants and algae.
• First method for in situ immunolocalization of target proteins of TOR kinase in photosynthetic organisms.
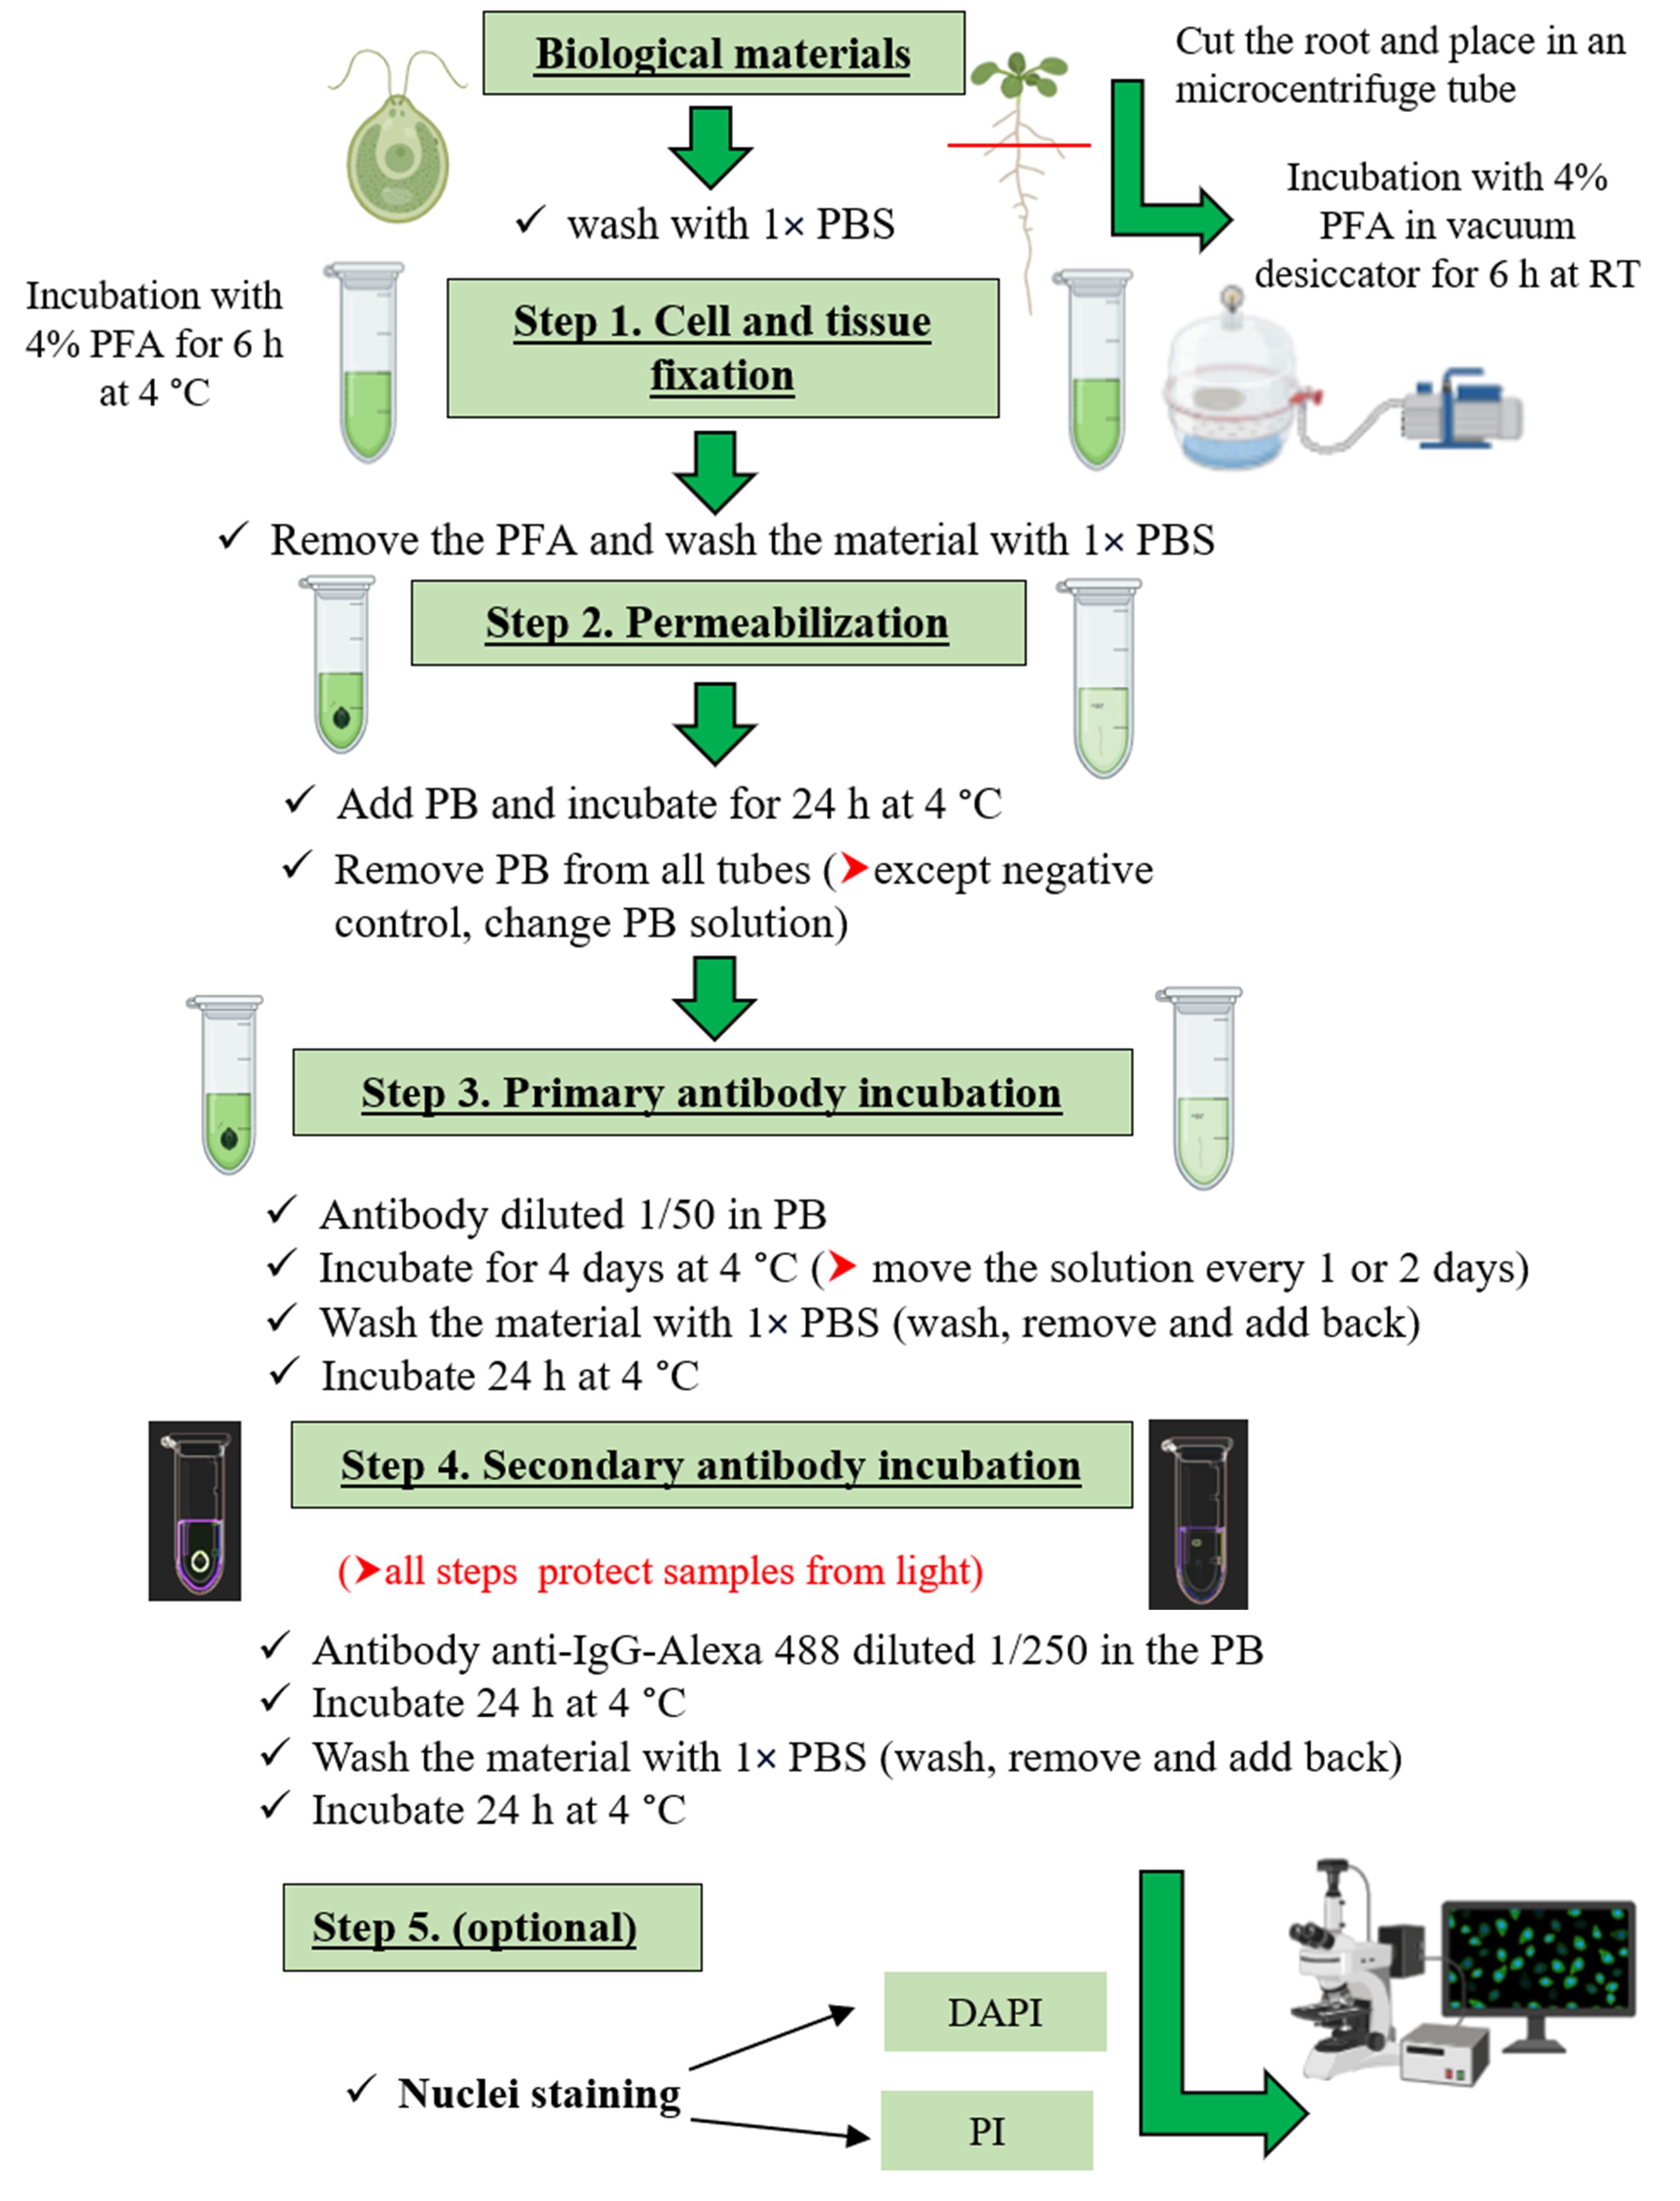
Keywords: ArabidopsisGraphical overview
Background
The target of rapamycin (TOR) kinase pathway is an ancestral signaling pathway that integrates nutrient information with translational control and growth regulation [1,2]. This conserved signaling pathway includes the S6K and its direct target, the 40S ribosomal protein S6 (RPS6) [3]. Therefore, the measurement of S6K and RPS6 phosphorylation levels through the WB technique is used as a reliable readout of TOR activity in eukaryotes including photosynthetic organisms [4,5]. The method is generally accurate in estimating TOR activity but requires cell disruption and does not permit subcellular localization or monitoring tissue specificities. Other techniques, such as immunofluorescence, have been described for mammals; however, in plants and algae, there is still a need to develop protocols for detecting TOR activity at the tissue/cell-specific level. Immunolocalization approaches can provide a great deal of information about the subcellular localization and dynamics of many plant proteins, even in vivo [6], which is particularly important when we have multi-level regulation, as is the case with the TOR kinase. We have developed, analyzed, and validated an immunofluorescence protocol for detecting TOR activity through S6K phosphorylation in situ in model photosynthetic organisms (Arabidopsis and Chlamydomonas). The main advantages of this method include its applicability to both plants and algae, its simplicity as it does not require tissue sectioning, its reproducibility due to Alexa's fluorophore stability, and the visualization in vivo due to the non-destruction of tissues/cells. Some minor limitations of the protocol include the restriction of its application to young tissues of plants, some reagents being expensive such as fluorescent antibodies, and the need for specialized personnel for the management of the confocal microscope.
This protocol will allow progress in the studies on TOR signaling at the subcellular level and tissue specificities, which are known to be essential for this pathway and where information is lacking in photosynthetic organisms, probably due to technical limitations.
To our knowledge, this is the first protocol for the analysis of TOR activity at the cellular level in plants and algae.
Materials and reagents
Biological materials
Arabidopsis thaliana Columbia ecotype (Col-0) wild-type (WT), young seedlings (5 days old)
Chlamydomonas reinhardtii CC125 (137c, mt + nit1 nit2), 15 mL of OD750nm: 0.6–0.9
Reagents
Double-distilled water (ddH2O)
Sodium phosphate dibasic (Na2HPO4) (Sigma, catalog number: 71496)
Potassium dihydrogen phosphate (KH2PO4) (Sigma, catalog number: 60220-M)
Sodium chloride (NaCl) (Anedra, catalog number: AN00716909)
Orthophosphoric acid (H3PO4) (Sigma, catalog number: 695017)
Paraformaldehyde (Agar Scientific, catalog number: R1018)
Sodium hydroxide (NaOH) (Fluka, catalog number: 71690)
Bovine serum albumin (BSA) 10 mg/mL (Promega, catalog number: R396D)
Triton X-100 (Sigma, catalog number: 9036-19-5)
Primary polyclonal antibody p-p70 S6K1 α Thr 389 (Santa Cruz, catalog number: sc-11759)
Secondary antibody anti-IgG-Alexa 488 (Invitrogen, catalog number: A11008)
Propidium iodide (PI) (Invitrogen, catalog number: P1304MP)
4',6-Diamidino-2-phenylindole dihydrochloride (DAPI) (Sigma, catalog number: D9564)
Solutions
Paraformaldehyde (PFA) 4% (see Recipes)
Phosphate buffered saline (PBS) 5× (see Recipes)
Permeabilization and blocking buffer (PB) (see Recipes)
Recipes
PFA 4%
Weigh 4 g of PFA and place in 35 mL of double-distilled water at 60 °C, add 30–50 μL of 10 N NaOH, and leave to stir on a hot plate (until the PFA dissolves well).
Add 20 mL of 5× PBS.
Check pH; it should be between 7.2 and 7.8.
Bring up to 100 mL with ddH2O.
Split into Falcon tubes and store at -20 °C for up to 3 months and protected from light.
Caution: Highly toxic. Wear protective gloves and work in the fume hood when handling the powder.
PBS (5×) (for 1 L)
Dissolve 3.62 g of Na2HPO4 (FW 141.96), 1.05 g of KH2PO4 (FW 136.1), and 38.25 g of NaCl (FW 58.44) in 800 mL of ddH2O. Adjust the pH to 7.4 with H3PO4 and then add ddH2O to the final volume. Dispense the solution into aliquots and sterilize them by autoclaving. The work solution used is 1× (final concentration 8 mM Na2HPO4, 2 mM KH2PO4, and 140 mM NaCl).
Permeabilization and blocking buffer (PB) (for 1.5 mL of PB)
Add 150 μL of 1% BSA, 45 μL of 10% Triton X-100, and 1,305 μL of 1× PBS (final concentration 1× PBS, 0.1% BSA, and 0.3% Triton X-100).
Equipment
Confocal microscope (e.g., Nikon, model: Eclipse C1 Plus)
Vacuum pump with a desiccator
Software and datasets
Confocal microscope software (e.g., EZ-C1 software Nikon)
NIH ImageJ software 1.47 for Windows (https://imagej.net/ij/)
Procedure
Tissue fixation (duration 4–6 h)
Remove Arabidopsis or Chlamydomonas samples from the growth medium and wash with 1× PBS.
Add 200 μL of 4% PFA to each tube (must cover the biological material).
Sample incubation
For algae: Incubate for 6 h at 4 °C.
For plant: Cut the root, place it in a microcentrifuge tube, and incubate the tissue in a vacuum desiccator for 6 h at room temperature (approximately 20 °C) to ensure proper tissue penetration.
Note: Leaves could also be used for the analysis (after removal of chlorophyll and other pigments).
Permeabilization and blocking (duration 24 h)
Remove the PFA solution and wash the material with 1× PBS at RT.
Add ~70 μL of PB to each tube (must cover the biological material) and incubate for 24 h at 4 °C.
Primary antibody incubation (duration 4 d)
Remove PB from all tubes (except the negative control, in which you should change the PB solution).
Add the antibody at a dilution of 1/50 in PB to a final volume of 50 μL per tube (except the negative control, in which you should change the PB solution).
Incubate for 4 days at 4 °C (move the solution every 1 or 2 days).
Wash the material with 1× PBS (wash, remove, and add back).
Incubate for 24 h at 4 °C.
Note: In the case of plants, primary antibody can be recovered for another use.
Secondary antibody incubation (duration 2 d)
Remove the PBS solution.
Add the anti-IgG-Alexa 488 antibody at a dilution of 1/250 in PB to a final volume of 50 μL per tube.
Incubate for 24 h at 4 °C.
Wash the material with 1× PBS (wash, remove, and add back).
Incubate for 24 h at 4 °C.
Note: Always protect the samples from light.
Nucleus staining (optional)
Nucleus labeling can be useful to localize the protein of interest at subcellular, cellular, and tissue level.
For propidium iodide (PI) staining:
Remove the PBS solution.
Add PI fluorophore to the samples at a dilution of 1/1,000 in 1× PBS to a final volume of 50 μL per tube (protect from light).
Incubate for 5 min at room temperature.
Wash the material four times with 1× PBS (wash, remove, and add back).
Analyze under a confocal microscope.
For DAPI staining:
Remove the PBS solution.
Add DAPI fluorophore to the samples at a dilution of 1/1,000 in 1× PBS to a final volume of 50 μL per tube (protect from light).
Incubate for 30 min for Arabidopsis or 5 min for Chlamydomonas at room temperature.
Wash the material three times with 1× PBS (wash, remove, and add back).
Analyze under a confocal microscope.
Data analysis
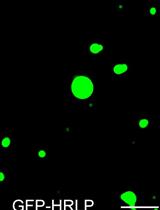
Sample images were obtained with C1 confocal laser using the following settings: green fluorescence intensity; excitation/emission wavelength = 488/561 nm. Visualization was done with the Super Fluor 40.0×/1.30/0.22 oil spring–loaded objective, and images were processed with the NIH ImageJ software. The positive signal appeared as bright spots in immunolocalization using a P-S6K antibody as was previously reported in rat and mouse tissues and human cell lines [7]. For Arabidopsis, at least eight roots were visualized (Figures 1A and 2A). For Chlamydomonas, eight coverslips were taken from each biological replicate (Figure 3A).
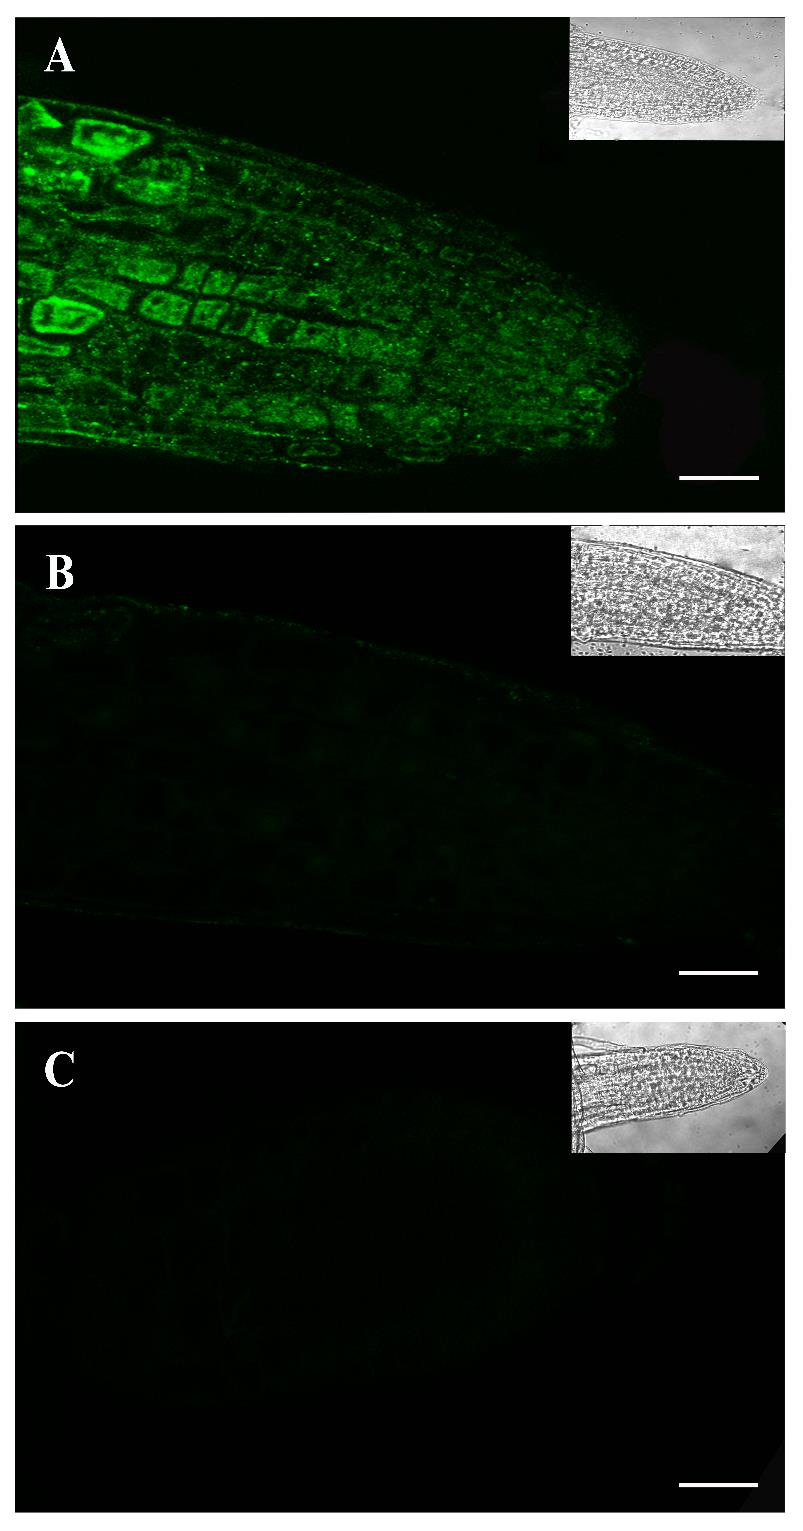
Figure 1. Immunolocalization of P-S6K in the root tip of five-day-old Arabidopsis seedlings. Confocal images of in situ immunofluorescence assays performed with the primary antibody p-p70 S6 kinase α Thr 389 and the secondary antibody anti-IgG-Alexa 488 (green fluorescence). P-S6K detection in the root tip zone of seedlings grown in control Murashige and Skoog (MS) medium (A) and treated with 2 μM AZD-8055 (TOR inhibitor) (B) for 48 h in darkness. Negative control consisted of the omission of primary antibody (C). Scale bars: 20 μm. Insets: Brightfield photos.
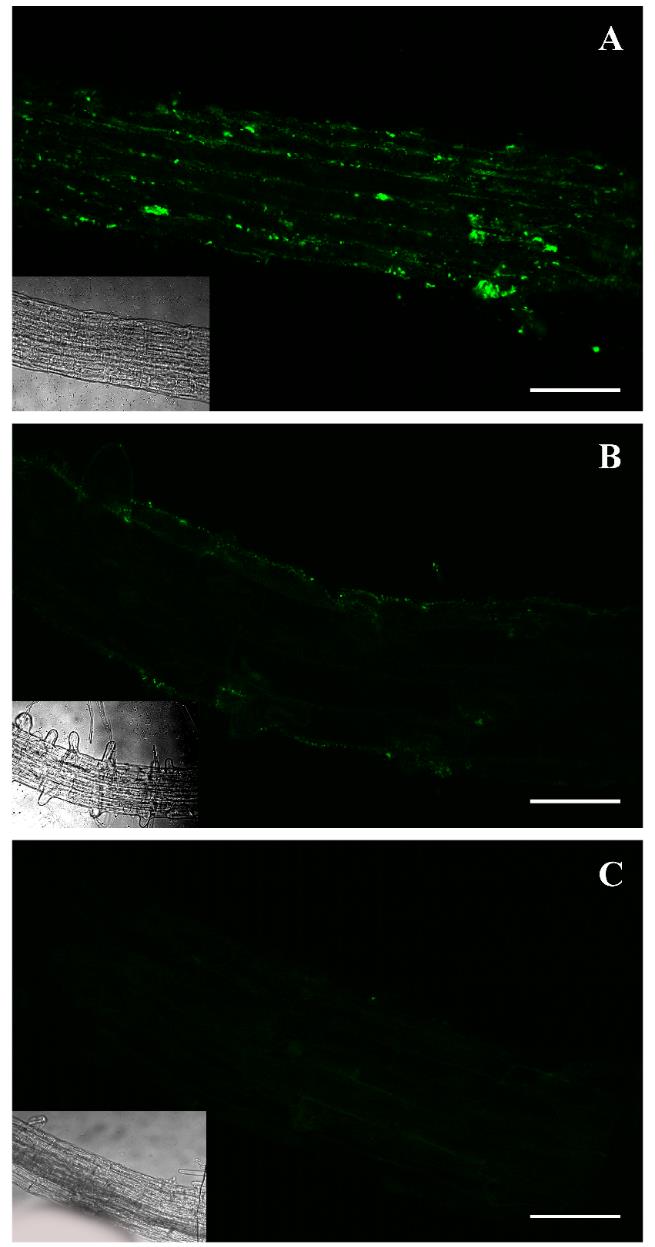
Figure 2. Immunolocalization of P-S6K in the elongation and differentiation zone of the root of five-day-old Arabidopsis seedlings. Confocal images of in situ immunofluorescence assays performed with the antibody p-p70 S6 kinase α Thr 389 and the secondary antibody anti-IgG-Alexa 488 (green fluorescence). P-S6K detection in the elongation and differentiation zone of the root of seedlings grown in control Murashige and Skoog (MS) medium (A) and treated with 2 μM AZD-8055 inhibitor (B) for 48 h in darkness. Negative control consisted of the omission of primary antibody (C). Scale bars: 50 μm. Insets: Brightfield photos.
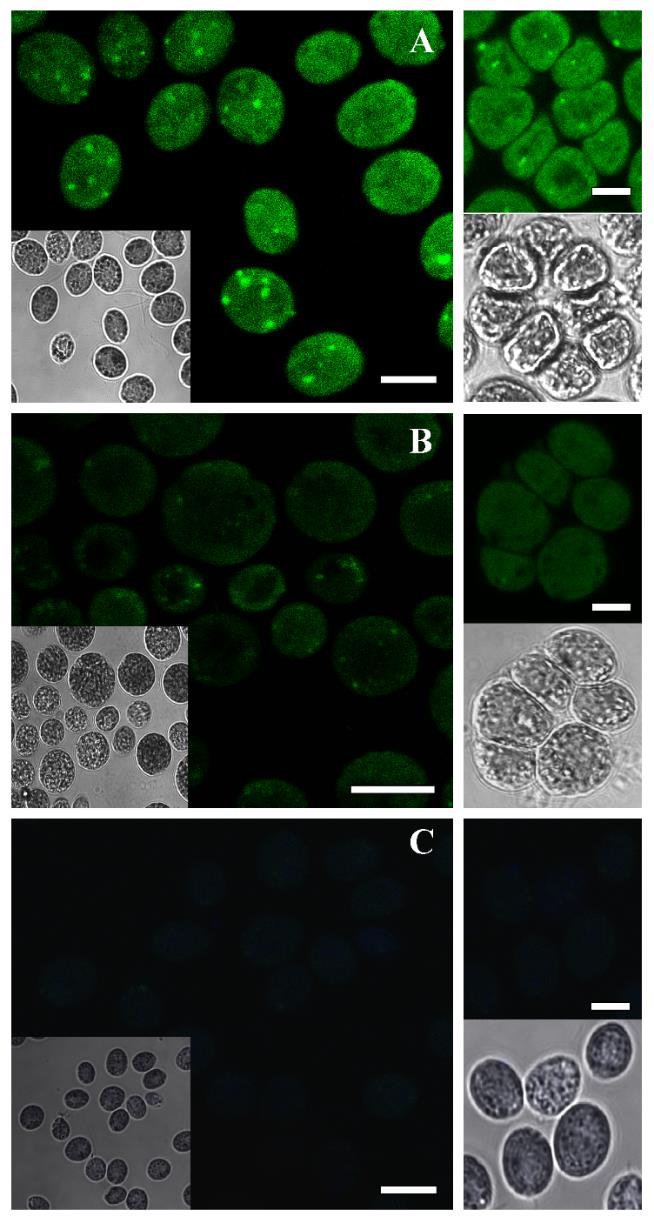
Figure 3. Immunolocalization of P-S6K from Chlamydomonas. Confocal images of in situ immunofluorescence assays performed with the antibody p-p70 S6 kinase α Thr 389 and the secondary antibody anti-IgG-Alexa 488 (green fluorescence). P-S6K detection in Chlamydomonas grown in control medium TAP (A) and treated with 700 nM AZD-8055 inhibitor (B) for 24 h. Negative control consisted of the omission of primary antibody (C). Scale bars: 10 μm. Insets: Brightfield photos.
Validation of protocol
To validate the observed fluorescence pattern of the protein under study, each immunolocalization experiment must include the correct controls. In our case, we used an ATP-competitive TOR inhibitor (AZD-8055 Cayman, catalog number: 16978) to evaluate the specificity of the protocol. The AZD treatment considerably reduced the fluorescence intensity in both Arabidopsis and Chlamydomonas samples, corroborating that the signal detected is specifically due to the TOR activity (Figures 1B, 2B, and 3B). Besides, a sample without the addition of the primary antibody was used to determine the amount of background signal caused by the secondary antibody (Figures 1C, 2C, and 3C). This negative control did not show fluorescence, demonstrating that the technique has a low background. We also corroborated this methodology in other plant tissues such as lateral and hair roots (Figures S1 and S2).
General notes and troubleshooting
Troubleshooting
Regarding plant samples, the main limitation of this protocol is its restricted applicability to young and permeable tissues. To ensure the fixation of the Arabidopsis samples, it is mandatory to make a cut in the fresh tissue, and it is critical to perform the vacuum step, also for the root tip. While this step is not essential for other plant tissues and algae samples, it improves the methodology. In the case of cotyledons and young leaves, special care must be taken with interferences caused by chlorophyll, which must be removed using solvents. For microalgae, the material quantity is a crucial factor (~2–4 mg dry weight): it must be enough to be processed (taking into account material losses due to washing) and not be in excess to avoid interferences with cell fixation and permeabilization.
Acknowledgments
This work was supported by the National Agency for Promotion of Science and Technology (ANPCyT, PICT2019-2118), National Scientific and Technical Research Council (CONICET, PIP-11220200101701CO) and National University of Mar del Plata (UNMdP, EXA1142/23). This protocol was adapted and modified from Loos et al. [8] (doi: 10.1128/AAC.01808-19, PMID: 32540980).
Competing interests
The authors declare that they have no competing interests.
References
- Pacheco, J. M., Canal, M. V., Pereyra, C. M., Welchen, E., Martínez-Noël, G. M. A. and Estevez, J. M. (2021). The tip of the iceberg: emerging roles of TORC1, and its regulatory functions in plant cells. J Exp Bot. 72(11): 4085–4101.
- Artins, A., Martins, M. C. M., Meyer, C., Fernie, A. R. and Caldana, C. (2024). Sensing and regulation of C and N metabolism – novel features and mechanisms of the TOR and SnRK1 signaling pathways. Plant J. 118(5): 1268–1280.
- Van Leene, J., Han, C., Gadeyne, A., Eeckhout, D., Matthijs, C., Cannoot, B., De Winne, N., Persiau, G., Van De Slijke, E., Van de Cotte, B., et al. (2019). Capturing the phosphorylation and protein interaction landscape of the plant TOR kinase. Nat Plants. 5(3): 316–327.
- Dobrenel, T., Mancera-Martínez, E., Forzani, C., Azzopardi, M., Davanture, M., Moreau, M., Schepetilnikov, M., Chicher, J., Langella, O., Zivy, M., et al. (2016). The Arabidopsis TOR Kinase Specifically Regulates the Expression of Nuclear Genes Coding for Plastidic Ribosomal Proteins and the Phosphorylation of the Cytosolic Ribosomal Protein S6. Front Plant Sci. 7: e01611.
- Upadhyaya, S., Agrawal, S., Gorakshakar, A. and Rao, B. J. (2020). TOR kinase activity in Chlamydomonas reinhardtii is modulated by cellular metabolic states. FEBS Lett. 594(19): 3122–3141.
- Sauer, M., Paciorek, T., Benková, E. and Friml, J. (2006). Immunocytochemical techniques for whole-mount in situ protein localization in plants. Nat Protoc. 1(1): 98–103.
- Schmidt, T., Wahl, P., Wüthrich, R. P., Vogetseder, A., Picard, N., Kaissling, B. and Le Hir, M. (2006). Immunolocalization of phospho-S6 kinases: a new way to detect mitosis in tissue sections and in cell culture. Histochem Cell Biol. 127(2): 123–129.
- Loos, J. A., Dávila, V. A., Brehm, K. and Cumino, A. C. (2020). Metformin Suppresses Development of the Echinococcus multilocularis Larval Stage by Targeting the TOR Pathway. Antimicrob Agents Chemother. 64(9): e01808–19.
Supplementary information
The following supporting information can be downloaded here:
- Figure S1. Immunolocalization of P-S6K in the root tip of five-day-old Arabidopsis seedlings
- Figure S2. Immunolocalization of P-S6K in the root of five-day-old Arabidopsis seedlings
Article Information
Publication history
Received: Jun 19, 2024
Accepted: Oct 13, 2024
Available online: Nov 5, 2024
Published: Dec 20, 2024
Copyright
© 2024 The Author(s); This is an open access article under the CC BY-NC license (https://creativecommons.org/licenses/by-nc/4.0/).
How to cite
Lando, A. P., De Marco, M. A., Cumino, A. C. and Martínez-Noël, G. M. A. (2024). Immunofluorescence for Detection of TOR Kinase Activity In Situ in Photosynthetic Organisms. Bio-protocol 14(24): e5140. DOI: 10.21769/BioProtoc.5140.
Category
Plant Science > Plant biochemistry > Protein > Activity
Biochemistry > Protein > Immunodetection > Immunostaining
Do you have any questions about this protocol?
Post your question to gather feedback from the community. We will also invite the authors of this article to respond.