- Protocols

- Articles and Issues
- For Authors
- About
- Become a Reviewer

An Autocatalytic Platform Combining a Nonlinear Hybridization Chain Reaction and DNAzyme to Detect microRNA
(*contributed equally to this work) Published: Vol 14, Iss 24, Dec 20, 2024 DOI: 10.21769/BioProtoc.5134 Views: 2089
Reviewed by: Han Deng Anonymous reviewer(s)
Original research article
The authors used this protocol in:

Jun 2023
Advertisement


Protocol Collections
Comprehensive collections of detailed, peer-reviewed protocols focusing on specific topics


Related protocols
Abstract
MicroRNAs (miRNAs) are small, non-coding RNAs that play pivotal roles in gene regulation; they are increasingly recognized as vital biomarkers for various diseases, notably cancer. Conventional methods for miRNA detection, such as quantitative PCR and microarray analysis, often entail intricate sample preparation and lack the requisite sensitivity to detect low-abundance miRNAs like miRNA-21. This protocol presents an innovative approach that combines branched hybridization chain reaction (bHCR) with DNAzyme technology for the precise detection of miRNA-21. The bHCR amplifies the target signal through a branched structure, while the DNAzyme boosts detection sensitivity through catalytic cleavage, enabling swift and specific identification of miRNA-21. This dual amplification strategy offers a highly sensitive, specific, and rapid alternative to traditional techniques, making it particularly well-suited for early-stage disease diagnosis.
Key features
• This protocol enables a sensitive detection of miRNA-21.
• The technique employs an isothermal, enzyme-free bHCR process that can be carried out using standard laboratory equipment, eliminating the necessity for specialized instruments.
• The entire protocol can be finalized in less than five hours, offering a swift and effective approach for high-throughput miRNA detection.
• Minimal input RNA is needed for the protocol, and the sample preparation steps are straightforward.
Keywords: DNAzymeGraphical overview
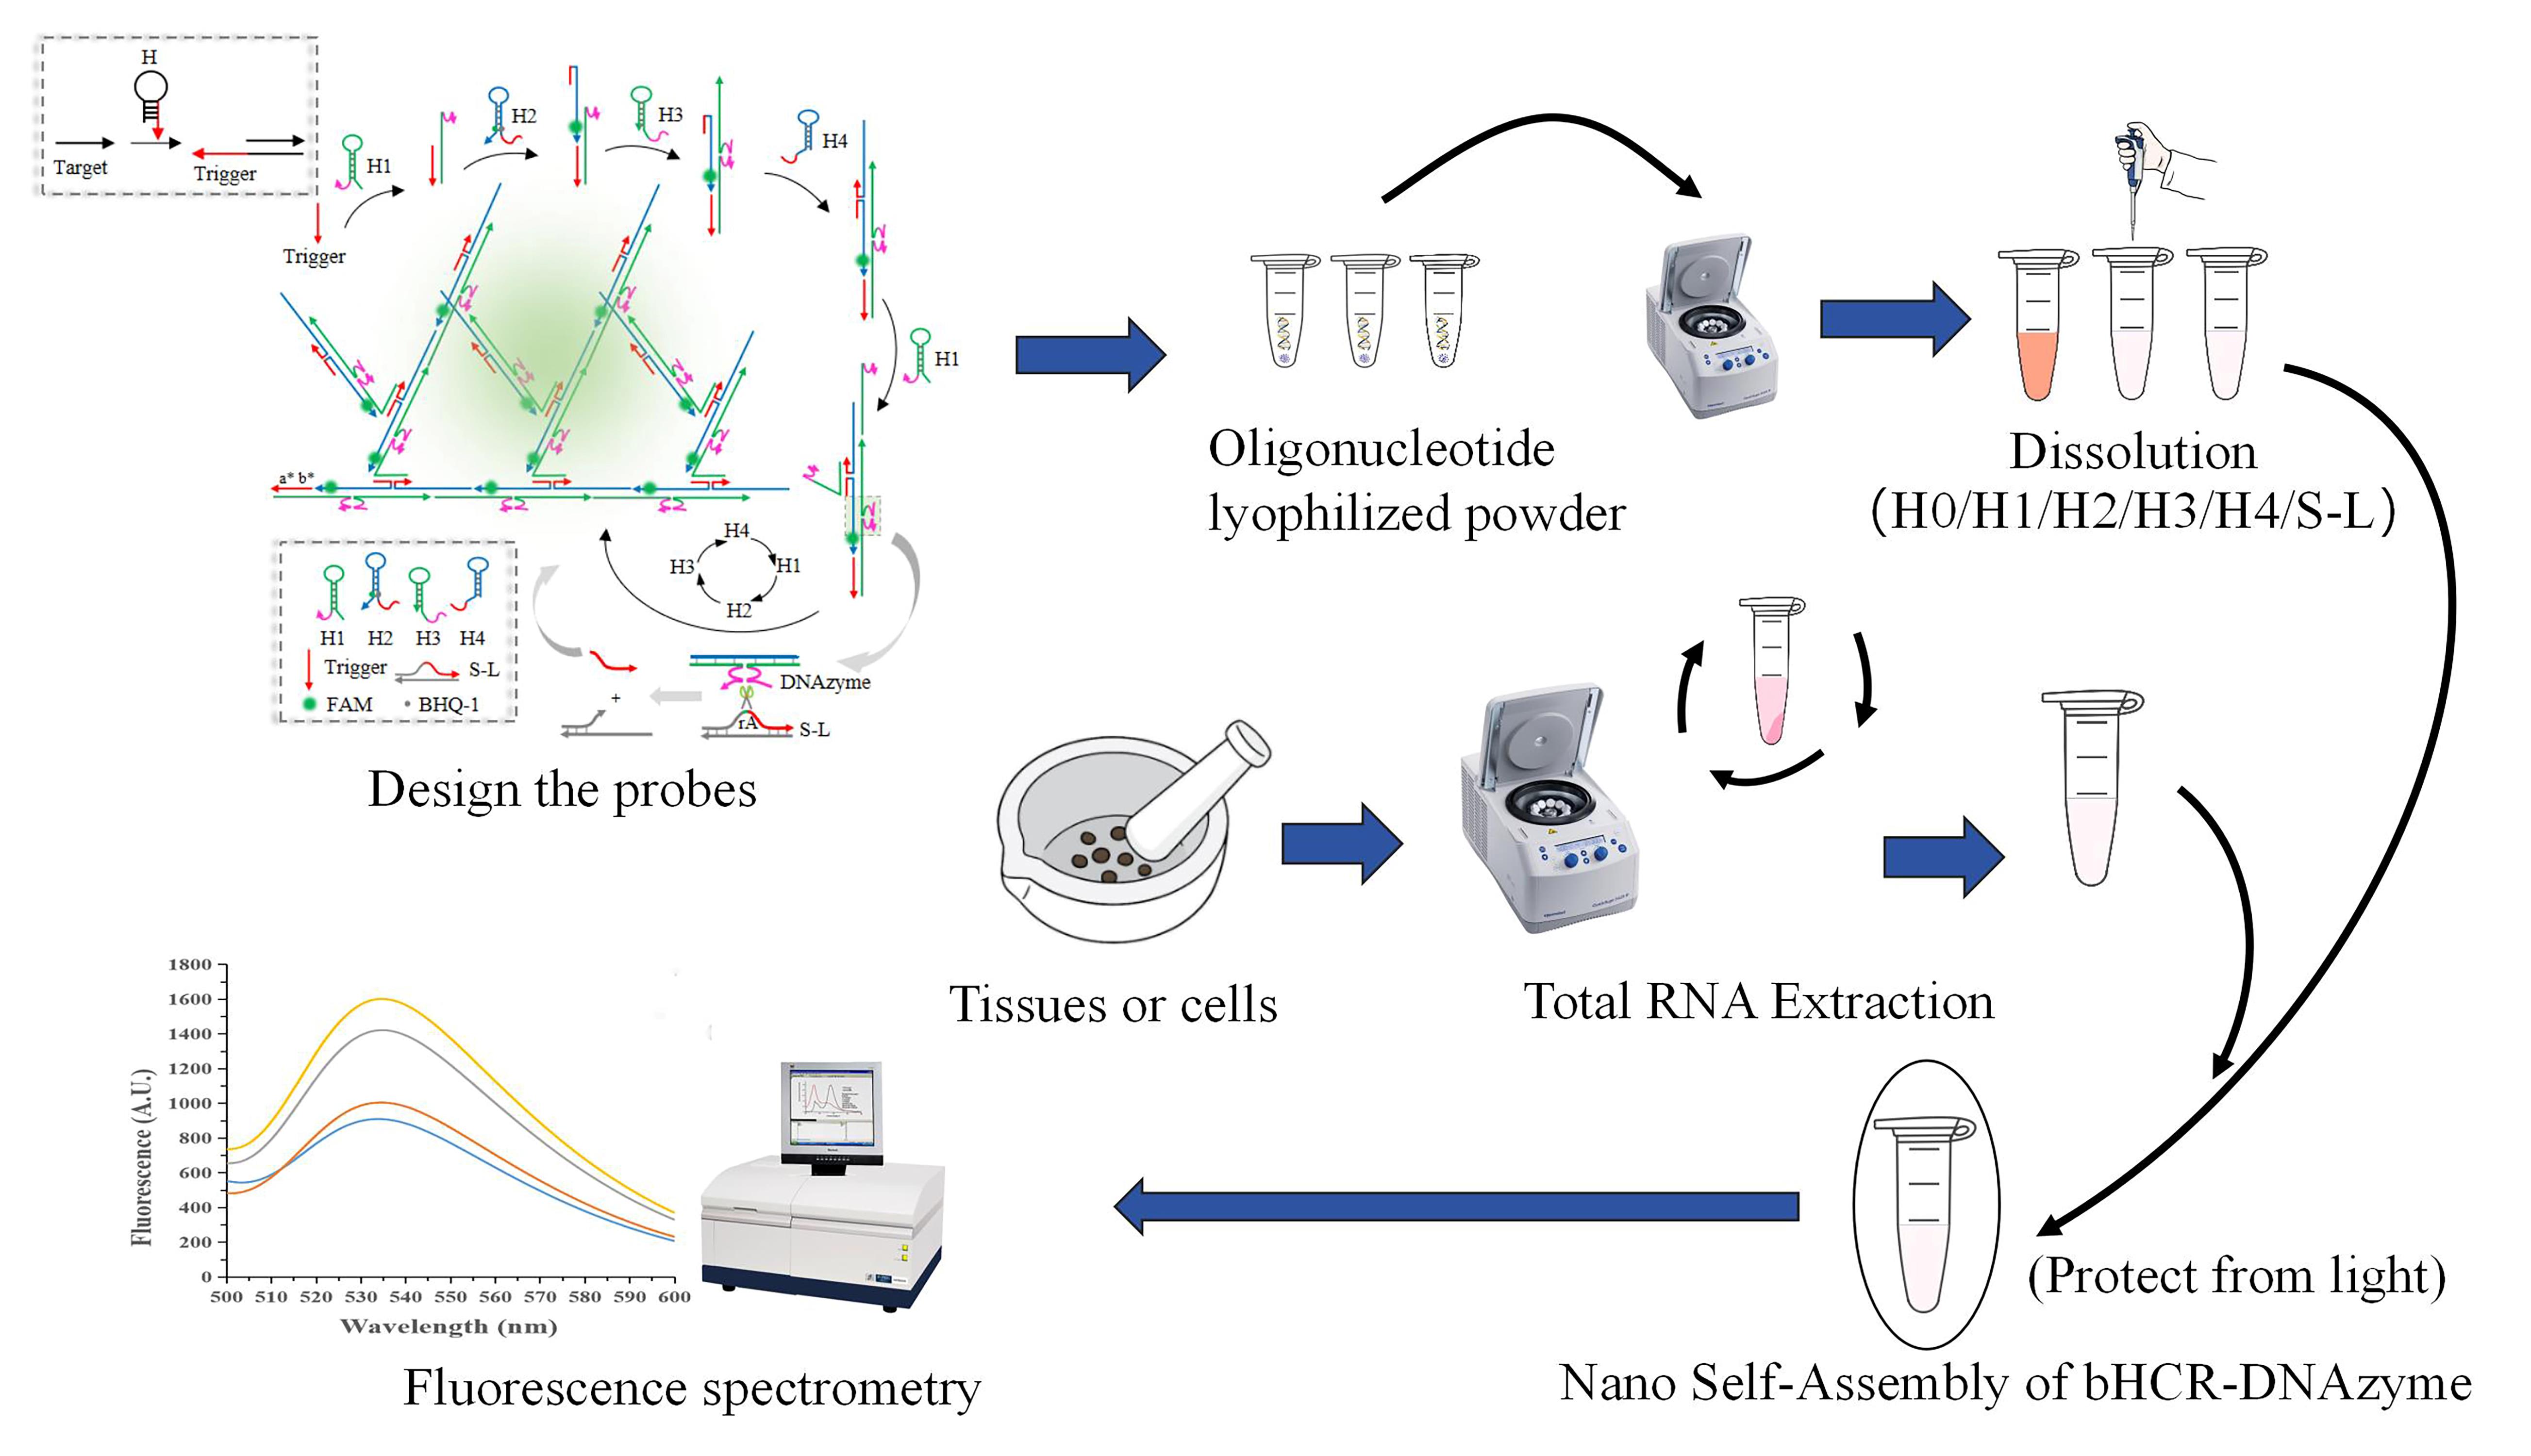
Detection of microRNA-21 based on bHCR-DNAzyme platform.
Note: For a more detailed explanation of the construction and design principles of this platform, please refer to the previously published article [1].
Background
MicroRNAs (miRNAs) are a class of small non-coding RNAs that play a crucial role in gene expression regulation by targeting messenger RNA (mRNA) for degradation or translational repression, thereby influencing various cellular processes [2]. In numerous diseases, miRNA expression patterns are dysregulated. For instance, miR-21 is upregulated in various cancers, including liver, breast, lung, and colorectal cancer. Conversely, the let-7 family of miRNAs, recognized for their tumor-suppressive roles, is often downregulated in numerous cancer types [3]. As a result, miRNAs are significant biomarkers closely associated with the development of various diseases, including cancer [4–7]. Detecting nucleic acid biomarkers is crucial for disease identification, treatment, and intervention. However, traditional miRNA detection methods face challenges due to the low abundance and high sequence homology of nucleic acid biomarkers, as well as limited detection sensitivity and complex, time-consuming procedures [8,9]. These limitations significantly impede the speed of research and clinical diagnostics. Hence, there is an urgent need to develop a novel method that combines sensitivity, specificity, and operational simplicity.
This protocol introduces a novel detection strategy that combines the synergistic effects of branched hybridization chain reaction (bHCR) and DNAzyme technology. In bHCR, fuel probes quickly assemble into networked or branched nanostructures upon the presence of an initiator, leading to exponential signal amplification. This feature enables the sensitive detection of low-abundance molecules and accelerates reaction speed [10]. However, bHCR has limitations that restrict its application, such as an upper limit to amplification, signal saturation, and increased background signal due to the spontaneous opening and self-amplification of hairpin probes [11]. On the other hand, DNAzyme is a unique nucleic acid catalytic enzyme with biological catalytic activity, such as RNA (or DNA) cleavage and ligation [12], obtained through in vitro selection [13]. It is known for its ease of synthesis, modifiability, and cost-effectiveness. With its separation of the recognition sequence and catalytic core, DNAzyme allows for flexible sequence design. Moreover, DNAzyme-catalyzed nucleic acid amplification mimics enzymatic reactions, theoretically enabling unlimited signal amplification [14,15]. However, DNAzyme exhibits a relatively slow linear amplification rate, and its enzymatic reactions can be influenced by product accumulation and enzyme inactivation [12]. By combining bHCR and DNAzyme technologies, this protocol harnesses the strengths of both methods to overcome their individual limitations, resulting in a novel nucleic acid detection approach for miRNA. Table 1 provides a comparative analysis of the advantages and disadvantages of both techniques. Among various nucleic acid biomarkers, miRNA-21 is notably upregulated in several cancers. Its elevated levels are strongly associated with tumor progression, metastasis, and poor patient prognosis [16–18], highlighting its potential as both a biomarker and a therapeutic target for early cancer detection. Therefore, this protocol uses miRNA-21 as an example to demonstrate how the bHCR-DNAzyme platform can detect miRNAs from tissues or cells. This dual amplification system offers a highly sensitive and specific method for detecting miRNA-21, even at low concentrations, in complex biological samples. The integration of bHCR and DNAzyme addresses various constraints of current miRNA detection techniques, potentially leading to more reliable and user-friendly early cancer diagnostics. The outcomes of this study could have significant clinical implications, enhancing the accessibility of clinical diagnostics and disease monitoring.
Table 1. Overview of bHCR and DNAzyme
| Branched hybridization chain reaction (bHCR) | Deoxyribozyme (DNAzyme) | |
|---|---|---|
| Concepts and principles | By triggering DNA hairpin structures, branched double-stranded DNA can be formed, enabling exponential amplification of nucleic acids. | A novel nucleic acid tool enzyme with biocatalytic activity, screened and isolated in vitro. |
| Advantages | • Isothermal amplification, requiring simple equipment. • Enzyme-free amplification, low cost, easy reagent storage, good reproducibility. • Exponential signal growth, rapid and strong signal output. | • Easy to synthesize, easy to modify, and cost-effective. • Separate recognition sequence and catalytic center, offering flexible design. • Comparable to enzymatic reactions, with no upper limit on signal amplification. |
| Disadvantages | • Amplification has an upper limit; signals can quickly saturate. • Prone to spontaneous amplification, leading to high background signals. | • Linear reaction, slower speed. • Product inhibition and enzyme inactivation require additional enzymes for long-term reactions. |
Note: The principles of the two techniques are illustrated in Figure 1.
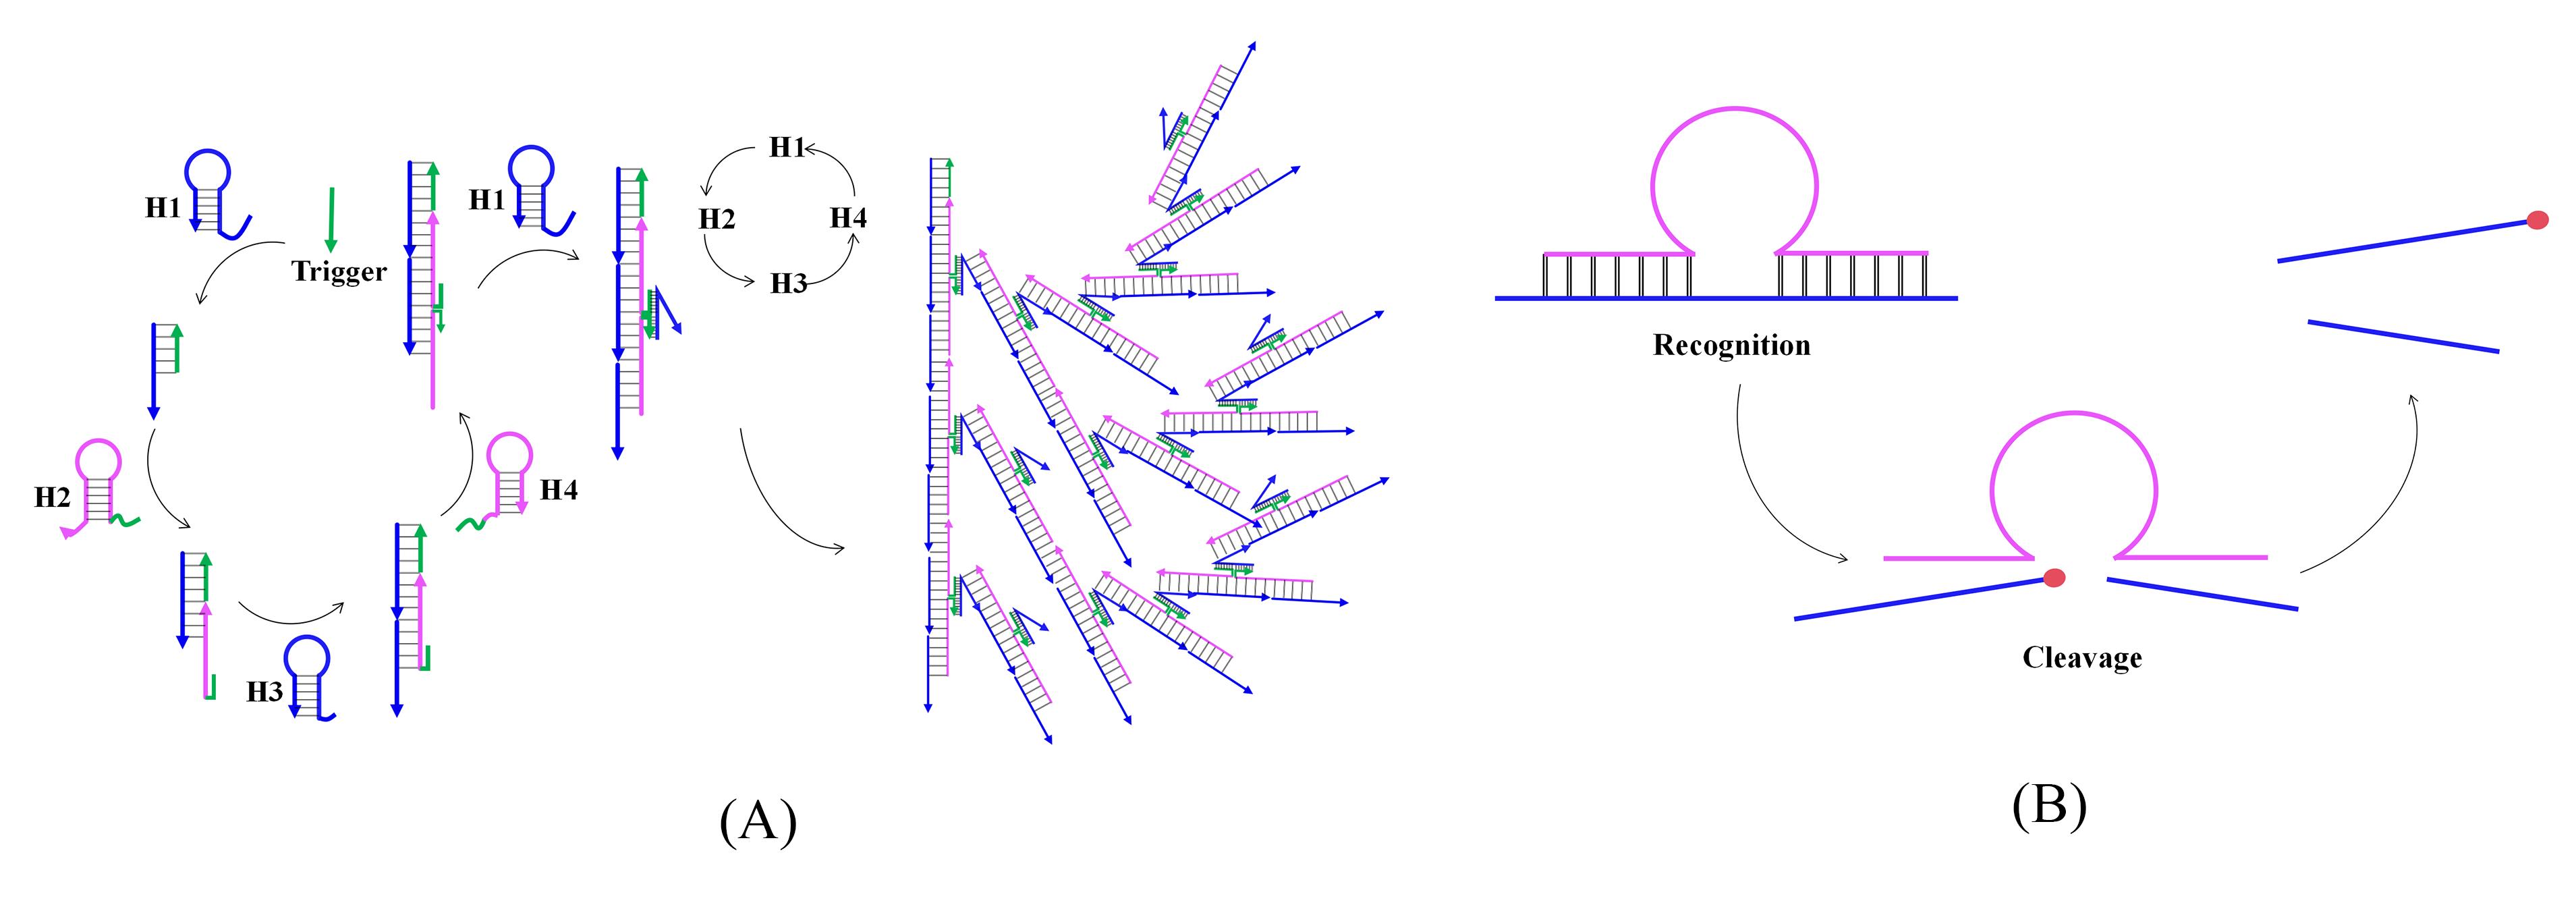
Figure 1. Principles of bHCR (A) and DNAzyme (B) techniques
Materials and reagents
Biological materials
Tumor and paratumor (PT) tissue from patients with hepatocellular carcinoma (from Third Xiangya Hospital in Central South University, Approval No: 2023009), stored in liquid nitrogen until analysis
Reagents
CaCl2 (Kermel Chemical Reagent Co Ltd., CAS: 10043-52-4)
NaCl (Kermel Chemical Reagent Co Ltd., CAS: 7647-14-5)
DEPC water (Biosharp, catalog number: BL510B)
HCl (Sinopharm, CAS: 7647-01-0)
1 M HEPES solution (Servicebio, catalog number: G4210-100ML)
Trizol (Jiangsu Cowin Biotech, catalog number: CW0580S)
Chloroform (Sinopharm, CAS: 67-66-3)
Isopropanol (Sinopharm, CAS: 67-63-0)
Ethanol (Sinopharm, Brand, CAS: 64-17-5)
MiRNA 1st strand cDNA synthesis kit (by tailing A) (Vazyme, Specification: 20rxns, catalog number: MR201-01)
Hieff® qPCR SYBR Green Master Mix (No Rox) (Yeasen, catalog number: 11201ES03)
10× TBE solution (Solarbio, catalog number: T1051)
30% Acr-Bis (29:1) (Coolaber, catalog number: SL1090)
10% APS (Coolaber, catalog number: SL1130)
TEMED (Coolaber, CAS: 110-18-9)
Labgreen (Coolaber, catalog number: SL2150)
6× loading buffer (Coolaber, catalog number: SL2210)
RNase-free water (Shanghai Promega, catalog number: SP119A)
Oligonucleotides (Beijing Tsingke Biotech, purification method: HPLC) (see Table 2 for details)
Table 2. Nucleic acid sequences used in this work
Note: The fluorescent group FAM and the quencher group BHQ-1 are both modified on the thymine (T) base; rA indicates that the DNAs were replaced by RNAs. The underlined bases in 1-mut, 2-mut, and 4-mut are mutant bases.Name Sequence (5′-3′) Trigger AGTCTAGGATTCAGCGTGGGATTA S CTCGGCACAAGTGGGTACATT rA GAGTCTAGGATTCAGCGTGGGATTA S1 CTCGGCACAAGTGGGTACATTAGAGTCTAGGATTCAGCGTGGGATTA L TAATCCGACCCTGATATACCACTTGTGCCGAG DNAzyme TAGACTTTCTCACAGCGTACTCGCTAAGGTTGTATGTAC H1 TAATCCCACGCTGAATCCTAGACTCAAAGTAGTCTAGGATTCAGCGT GCGCTAAGGTTGTATGTAC H2 AGTCTAGGATTCAGT(BHQ-1)CTAGGATTCAGCGTGCATCTCCACGCT GAATCCTAGACT(FAM)ACTTTG H3 TAGACTTTCTCACAGCGGAGATGCACGCTGAATCCTAGACTTCCA GGAGTCTAGGATTCAGCGTG H4 AGTCTAGGATTCAGCGTGGGATTACACGCTGAATCCTAGA CTCCTGGAAGCGTGGGATTA miR-21 UAGCUUAUCAGACUGAUGUUGA 1-mut UAGCUUAUCAAACUGAUGUUGA 2-mut UAACUUAUCAGACUAAUGUUGA 4-mut UAGAUUAUCAAACUGAUAUUAA H-miR-21 CTGAATCCTAGACTTCAACATCAGTCTGATAAGCTAAAAAGTCT AGGATTCAGCGTGGGATTA
Solutions
10 mM HEPES buffer (see Recipes)
75% ethanol solution (see Recipes)
1× TBE electrophoresis buffer (see Recipes)
2 µM SL initial concentration solution (see Recipes)
Recipes
10 mM HEPES buffer (100mL)
Reagent Final concentration Quantity CaCl2 100 mM 1.110 g NaCl 150 mM 0.877 g 1 M HEPES solution 10 mM n/a DEPC H2O n/a n/a Adjust the pH to 7.2 with HCl n/a n/a Total (optional) n/a 100 mL 75% ethanol solution (10 mL)
Reagent Final concentration Volume Anhydrous ethanol 75% (v/v) 7.5 mL H2O n/a see note Total n/a 10 mL Note: The water is made using an ultrapure water machine.
1× TBE electrophoresis buffer (500 mL)
Reagent Final concentration Volume 10× TBE n/a 50 mL H2O n/a see note Total n/a 500 mL Note: The water is made using an ultrapure water machine.
2 µM SL initial concentration solution (500 µL)
Reagent Final concentration Volume 100 µM S stock solutions 2 µM 2 µL 100 µM L stock solutions 2.5 µM 2.5 µL DEPC H2O n/a 95.5 µL Total n/a 100 µL Note: Prepare 100 µM stock solutions of S and L according to the provided oligonucleotide synthesis instructions. For sequence information, manufacturer and catalog number, please refer to item 19 in the Reagents section. The preparation process is outlined in step B2 of the Procedure.
Laboratory supplies
0.2 mL microcentrifuge tube (Biosharp, catalog number: BS-02-P)
1.5 mL microcentrifuge tube (Biosharp, catalog number: BS-15-M)
2 mL microcentrifuge tube (Biosharp, catalog number: BS-20-M)
15 mL centrifuge tube (Servicebio, catalog number: EP-5001-J)
50 mL centrifuge tube (Servicebio, catalog number: EP-5001-J)
10 μL pipette tip (Servicebio, catalog number: P-10)
200 μL pipette tip (Servicebio, catalog number: TP-200)
1,000 μL pipette tip (Servicebio, catalog number: TP-1250)
Pipette (China Dalong Xingchuang Experimental Instrument Co., Ltd, model: TopPette)
Cell freezing tube, 2 mL (Corning, catalog number: CLS430659)
Equipment
High-speed freezing centrifuge (Changsha Yingtai, model: TGL16)
Ultrapure water machine (Bertone, model: K.L.MINI4-T)
PCR amplifier (Bio-Rad, model: Biometra)
Ultramicro ultraviolet spectrophotometer (Qua Well, model: Q5000)
Vortex mixer (Shanghai Huxi, model: XW-80A)
Quartz fluorescent micro cuvette, 1 mm (Wuxi edge spectrum optics)
Biochemical incubator (Shanghai Boxun medical, model: SPX-150B-Z)
Electrophoresis analyzer (Beijing Liuyi Instrument Factory, model: DYY-7C)
Vertical electrophoresis tank (Beijing Junyi Oriental electrophoresis equipment Co., Ltd, model: DYCP-31BN)
Electronic balance (Shanghai Guangzheng medical, model: YP-B2002)
Fluorescence spectrophotometer (HITACHI, model: F-7100)
Real-time fluorescent quantitative gene amplification instrument (Bio-Rad, model: CFX CONNECT)
Clean bench (Suzhou Zhijing purification equipment Co., Ltd, model: SW-CJ-2FD)
Chemiluminescence imager (Bio-Rad, model: ChemiDoc XRS+)
Micro analytical balance (Shimadzu, model: AUW120D)
Software and datasets
GraphPad Prism (version 7, GraphPad Software)
Procedure
Design the probe H0 of bHCR-DNAzyme using the NUPACK website
Note: The prediction of hairpin structures and interactions between hairpins was performed using the NUPACK website (http://www.nupack.org/).
The sequences of the probes Trigger, H1, H2, H3, H4, S, and L are fixed and do not require additional design. However, the H0 sequence must be designed each time based on the specific miRNA target being detected. For example, to design H0 for detecting miRNA-21 (referred to as H-miR-21), we constructed a DNA hairpin with a stem-loop structure. In this structure, bases 15–36 (in the 5' to 3' direction) form the loop and are fully complementary to the miRNA-21 sequence, while bases 40–63 correspond to the Trigger sequence.
Use the NUPACK website to validate the rationale behind the H0 design. Input the sequences of H-miR-21 and miRNA-21 into the website to predict their binding. If bases 15–36 (in the 5' to 3' direction) of H-miR-21 form complementary pairs with miRNA-21, thereby opening the hairpin stem and exposing the Trigger sequence, then the design of H-miR-21 can be considered successful.
Note: Based on the design strategy for H-miR-21, H0 can be modified for different miRNA sequences, allowing for the detection of other miRNAs or viruses. Previous studies have demonstrated that this platform can also detect mimics of COVID-19 and classical swine fever virus (CSFV).
Construction of the bHCR-DNAzyme platform
Prepare 10 mL of 10 mM HEPES buffer according to Recipes and store at 4 °C.
Note: All reactions and dissolution are carried out in this 10 mM buffer solution. The water used here is DEPC water, which is used for subsequent DNA and RNA oligonucleotide precipitation dissolution.
Prepare the bHCR-DNAzyme hairpin probe stock solutions: Dissolve all probe oligonucleotides in the buffer according to the synthesis instructions to prepare 100 µM stock solutions. Aliquot the stock solutions into 200 µL microcentrifuge tubes and store at -20 °C to avoid repeated freeze-thaw cycles that could degrade the DNA strands.
Note: All probe oligonucleotides, including Trigger, S, S1, H1, H2, H3, H4, miRNA-21, 1-mut, 2-mut, 4-mut, and H-miR-21, are listed in the nucleic acid sequences table under the Reagents section. The H2 hairpin probe is fluorescently labeled, so protect it from light during dissolution, storage, and reactions.
Prepare the 2 µM SL initial concentration solution: Mix the S and L stock solutions in a 4:5 ratio. Incubate the mixture at 25 °C in a PCR machine for 30 min to form the SL DNA duplex before use, achieving a final S concentration of 2 µM.
bHCR-DNAzyme nano self-assembly: Add different concentrations of Trigger solution to the 0.1 µM H1/H2/H3/H4/SL solution and incubate at 37 °C for 1 h.
Note: The different concentrations of Trigger mentioned here can be chosen by researchers according to their specific needs, or they can refer to section C. This section provides a straightforward description of the experimental steps involved in the platform's self-assembly process.
Validation of bHCR-DNAzyme Nano Self-Assembly
Non-denaturing polyacrylamide gel electrophoresis (PAGE) validation
Prepare the following solutions: 0.1 μM Trigger, 0.1 μM H1, 0.1 μM H2, 0.1 μM H3, 0.1 μM H4, 0.1 μM SL, 0.1 μM H1/H2/H3/H4, 0.1 μM H1/H2/H3/H4/SL, 0.1 μM Trigger/H1/H2/H3/H4/SL, 0.1 μM DNAzyme, 0.1 μM DNAzyme/SL, and 0.1 μM DNAzyme/S1L. Incubate at 37 °C for 1 h.
Note: S1 is the same as the S sequence but without RNA modification. The contents of step C1a are presented in Table 3.
Table 3. PAGE experiment solution groups
Group Component Group Component 1 0.1 μM Trigger 7 0.1 μM H1/H2/H3/H4 2 0.1 μM H1 8 0.1 μM H1/H2/H3/H4/SL 3 0.1 μM H2 9 0.1 μM Trigger/H1/H2/H3/H4/SL 4 0.1 μM H3 10 0.1 μM DNAzyme 5 0.1 μM H4 11 0.1 μM DNAzyme/SL 6 0.1 μM SL 12 0.1 μM DNAzyme/S1L Prepare a 15% non-denaturing polyacrylamide gel: In a beaker, sequentially add 5 mL of 30% Acr-Bis (29:1), 2.5 mL of ultrapure water, 2.5 mL of 4× separating gel buffer, 100 μL of 10% APS, and 4 μL of TEMED, and mix well. Pour the solution into the gel casting plate, insert the gel comb, and let it solidify at room temperature for 20 min. Then, place the gel in an electrophoresis tank and add 400 mL of 1× TBE (see Recipes).
Note: The 4× separating gel buffer is obtained by diluting 10× TBE with ultrapure water.
Remove the gel comb and mix 10 μL of each solution prepared in C1a with 2 μL of 6× loading buffer; then, load the mixture into the wells.
Perform electrophoresis at a constant current of 20 mA for 90 min.
After electrophoresis, stain the gel with Labgreen for 30 min, then use a chemiluminescence imaging system for gel imaging to observe and record the experimental results.
Expected results: We anticipate that the band positions of group 7 will correspond to those of groups 2, 3, 4, and 5, indicating that the hairpins exist independently and have not been opened. Additionally, groups 9 and 11 are expected to produce bands with higher molecular weights and lower electrophoretic mobility compared to groups 8 and 12, confirming the success of self-assembly and the effective cleavage of SL by DNAzyme.
Fluorescence spectroscopy validation
Prepare the following solutions: 0.1 μM H2, 0.1 μM H1/H2/H3/H4, 0.1 μM H1/H2/H3/H4/SL, 50 nM Trigger + 0.1 μM H1/H2/H3/H4, and 1 nM/10 nM/50 nM Trigger + 0.1 μM H1/H2/H3/H4/SL. Incubate at 37 °C for 1 h.
Add each of the above solutions to a 1 mm quartz fluorescence microcuvette and measure the fluorescence intensity using a fluorescence spectrophotometer. Set the parameters as follows: slit width 5 nm, voltage 700 V, excitation wavelength 492 nm, emission wavelength range 500–600 nm.
Expected results: We anticipate a significant increase in the fluorescence intensity of the solution following the introduction of Trigger, with the intensity continuing to rise as the Trigger concentration increases. This will confirm the successful self-assembly of bHCR.
Detection performance of bHCR-DNAzyme for miR-21
Linear range and detection limit
H0 is designed to detect miRNA-21 and is referred to as H-miR-21. Dissolve the lyophilized H-miR-21 oligonucleotide in buffer according to the synthesis instructions to prepare a 100 μM stock solution, then dilute it to a 2 μM H-miR-21 working solution. Heat at 95 °C for 5 min and slowly cool to room temperature to form a hairpin structure. Store in the dark at 4 °C.
Prepare the following reaction systems separately: 0.01 nM miR-21 + 200 nM H1/H2/H3/H4 + 20 nM SL + 10 nM H-miR-21, 0.02 nM miR-21 + 200 nM H1/H2/H3/H4 + 20 nM SL + 10 nM H-miR-21, 0.05 nM miR-21 + 200 nM H1/H2/H3/H4 + 20 nM SL + 10 nM H-miR-21, 0.08 nM miR-21 + 200 nM H1/H2/H3/H4 + 20 nM SL + 10 nM H-miR-21, 0.1 nM miR-21 + 200 nM H1/H2/H3/H4 + 20 nM SL + 10 nM H-miR-21, and 0.2 nM miR-21 + 200 nM H1/H2/H3/H4 + 20 nM SL + 10 nM H-miR-21. Incubate at 30 °C for 1 h and measure the fluorescence intensity using a fluorescence spectrophotometer. Perform parallel detection on three samples for each group and include a blank control without miR-21. Set the parameters as follows: slit width 5 nm, voltage 700 V, excitation wavelength 492 nm, emission wavelength range 500–600 nm.
Specificity
Prepare a stock solution of miR-21 mutant oligonucleotide: Dilute the 100 μM miR-21 mutant stock solution with buffer to a final concentration of 5 μM and store at 4 °C.
Prepare the following reaction systems separately: 2 nM miR-21 + 200 nM H1/H2/H3/H4 + 20 nM SL + 10 nM H-miR-21, 2 nM 1-Mut + 200 nM H1/H2/H3/H4 + 20 nM SL + 10 nM H-miR-21, 2 nM 2-Mut + 200 nM H1/H2/H3/H4 + 20 nM SL + 10 nM H-miR-21, and 2 nM 4-Mut + 200 nM H1/H2/H3/H4 + 20 nM SL + 10 nM H-miR-21. Incubate at 30 °C for 1 h. Use the detection results from the 2 nM miR-21 group as the control and measure the fluorescence intensity using a fluorescence spectrophotometer. Perform parallel detection on three samples for each group and include a blank control without miR-21.
Total RNA extraction from tissues or cells
Note: The procedure for RNA extraction from tissues or cells has been clearly described in previous studies [19].
Treat all experimental equipment with solid-phase RNase inhibitor. Weigh 30 mg of tumor tissue (or 1.5 × 10⁷–3 × 10⁷ cells) and 30 mg of PT tissue, and place each in a mortar. Add 1 mL of Trizol and grind thoroughly. Let the mixture sit at room temperature for 5 min, then transfer it to a centrifuge tube and centrifuge at 1,609× g for 5 min.
Collect the supernatant and add 0.2 mL of chloroform. Shake for 15 s, let it sit at room temperature for 2 min, then centrifuge at 9,270× g for 15 min at 4 °C.
Caution: Use Trizol and chloroform in a well-ventilated area while wearing appropriate protective equipment, as both are hazardous chemicals.
Transfer 600 μL of the aqueous phase to a new centrifuge tube. Add 600 μL of isopropanol and mix thoroughly. Let the mixture sit at room temperature for 10 min, then centrifuge at 9,270× g for 10 min at 4 °C.
Discard the supernatant, wash the pellet with 1 mL of 75% ethanol, and centrifuge at 9,270× g for 3 min at 4 °C.
Note: Prepare the 75% ethanol with DEPC-treated water and pre-cool to 4 °C.
Discard the supernatant, air-dry the pellet at room temperature, and dissolve it in 20 μL of RNase-free water to obtain the total RNA solution.
Measure the total RNA concentration using a microvolume UV spectrophotometer and dilute it to 500 ng/μL.
Detection of miR-21 in tumor samples using bHCR-DNAzyme platform and RT-qPCR
Detection of miR-21 using bHCR-DNAzyme platform
Use the total RNA solution extracted in the previous step as the buffer to evaluate the detection capability of the bHCR-DNAzyme platform in biological samples. The experimental procedure follows the method described in section D.
Using the total RNA solution extracted in the previous step as the buffer, perform fluorescence detection of total RNA solutions from tumor tissue and PT tissue samples under the optimized conditions of the bHCR-DNAzyme platform. Perform parallel detection on three samples for each group and include a blank control.
Detection of miR-21 Using RT-qPCR
Reverse transcription: Use an RNA reverse transcription kit (miRNA 1st Strand cDNA Synthesis Kit). Mix 2 μg of total RNA (500 ng/μL, 4 μL), 10 μL of 2× miRNA RT Mix, 2 μL of HiScript miRNA Enzyme Mix, and 4 μL of RNase-free ddH2O to create a 20 μL reaction system. Mix well, then place it in a PCR machine and run the following program to obtain cDNA: 37 °C for 60 min, 85 °C for 5 min, and 4 °C for 5 min (see Table 4). Measure the concentration of cDNA using a microvolume UV spectrophotometer and dilute it to 50 ng/μL. Store at 4 °C.
Table 4. Thermocycling conditions for the reverse transcription
Step Temperature (°C) Duration Number of cycles Step 1 37 60 min 1 Step 2 85 5 min 1 Step 3 4 5 min 1 Hold 4 ∞ RT-qPCR: Prepare a 20 μL reaction system with the following components: 10 μL of qPCR Mix, 7.2 μL of nuclease-free water, 2 μL of cDNA, 0.4 μL of forward primer, and 0.4 μL of reverse primer. Set up three parallel replicates for each sample. Mix thoroughly and perform the reaction in a real-time quantitative PCR machine under the following conditions: pre-denaturation at 95 °C for 5 min, denaturation at 95 °C for 10 s, annealing/extension at 60 °C for 30 s, for a total of 40 cycles (see Table 5). Finally, calculate and analyze the resulting Ct values using the 2-ΔΔCt method.
Note: Forward primer: 5'-ACACTCCAGCTGGGTAGCTTATCAGACTGA-3'; reverse primer: 5'-TGGTGTCGTGGAGTCG-3'.
Table 5. Thermocycling conditions for the PCR reaction
Step Temperature (°C) Duration Number of cycles Pre-denaturation 95 300 s 1 Denaturation 95 10 s 40 Annealing/Extension 60 30 s Hold 4 ∞ -
Data analysis
Linear range and selectivity of the bHCR-DNAzyme platform
The fluorescence intensity data of the sample was measured using a fluorescence spectrophotometer (F-7100) at 492 nm. The y-axis value is calculated by subtracting the fluorescence value of the blank control group from the average of the fluorescence values of three parallel samples. Figure 2A displays the variances in fluorescence intensity caused by miRNA-21 and various mutants. The results showed that the fluorescence intensities of the strands containing 1 (1-mut), 2 (2-mut), and 4 (4-mut) mutated bases were 34%, 27%, and 9%, respectively, of the fluorescence intensity of the miR-21 strand, demonstrating the platform's excellent specificity. Figure 2B presents the standard curve of miRNA-21 concentration versus fluorescence signal difference. The results also indicated a linear relationship between fluorescence intensity and miR-21 concentration in the range of 0.01 to 0.2 nM. The corresponding fitted equation is y = 695.52x + 4.112 (n = 3, R2 = 0.9944), with a detection limit of 0.003 nM. Statistical significance was evaluated using one-way ANOVA followed by Tukey’s post-hoc test. Data points were selected based on the results of the statistical analysis. Outliers were excluded if their deviation from the group mean exceeded three standard deviations or if they clearly fell outside the confidence interval of the fitted line.
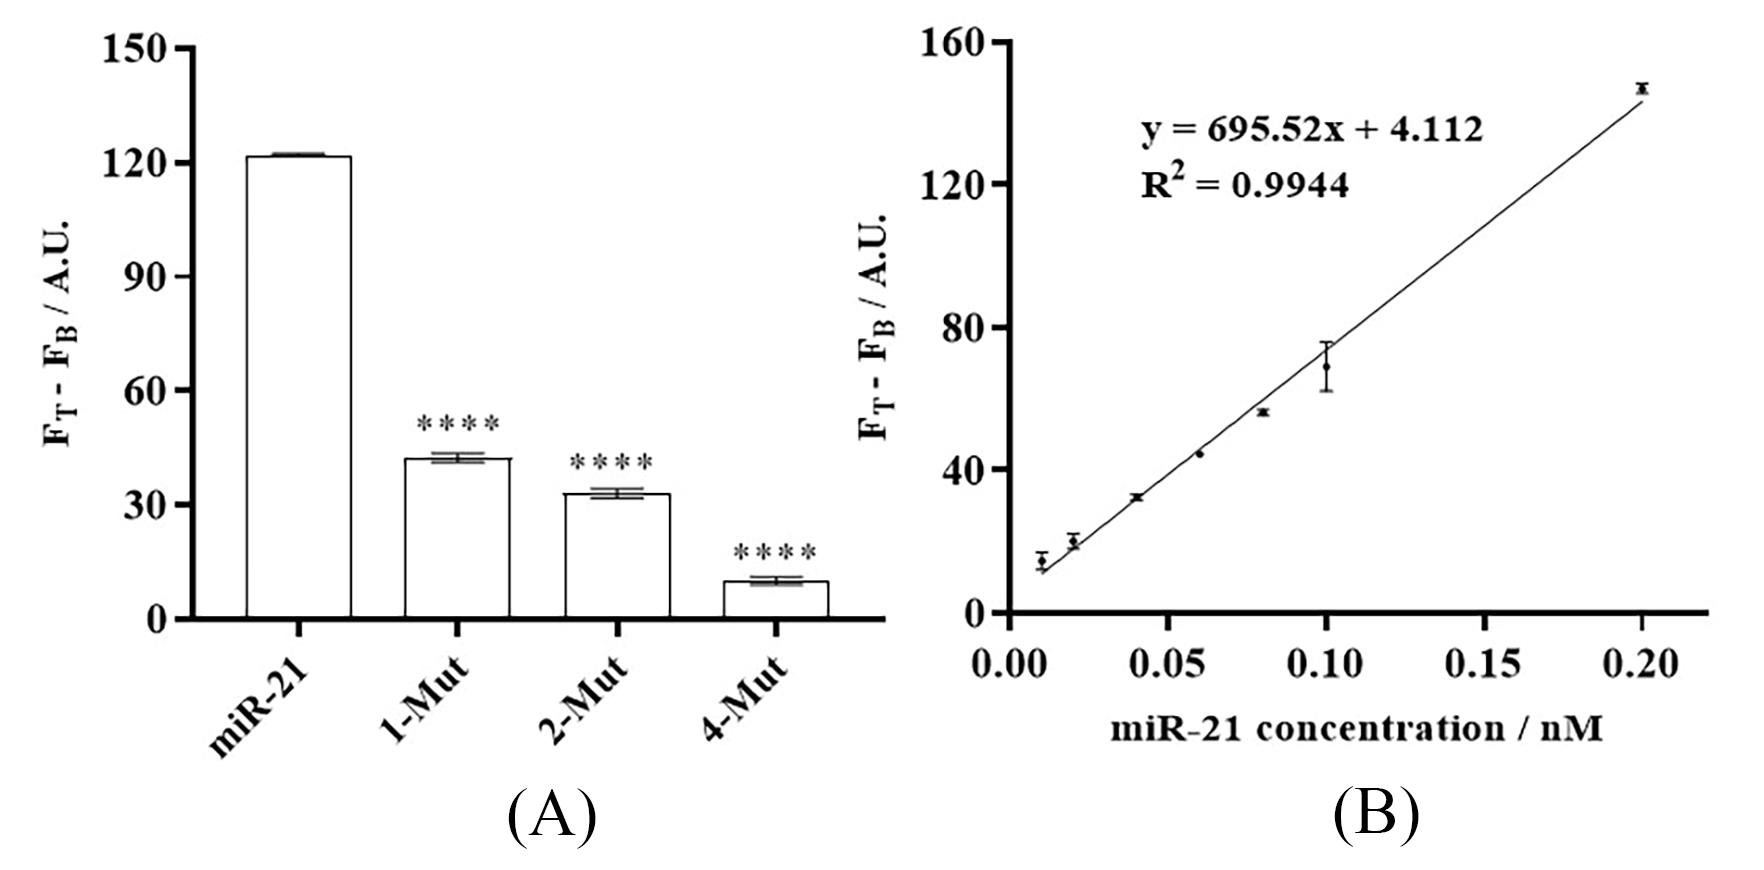
Figure 2. bHCR-DNAzyme platform for (A) specificity and (B) sensitivity detection of miRNA-21. Error bar: SD, n = 3.
Comparison of the bHCR DNAzyme platform with the traditional RT-qPCR method
Figure 3 illustrates the detection outcomes of miRNA-21 in patients’ tumor tissues utilizing the bHCR-DNAzyme platform (Figure 3A) and the RT-qPCR platform (Figure 3B). It compares the expression levels of miRNA-21 between tumor and paratumor tissues. Statistical significance was assessed using one-way ANOVA followed by Tukey’s post-hoc test. The comparison between the two platforms underscores the enhanced accuracy of the bHCR-DNAzyme platform in discriminating tumor tissues from paratumor tissues, along with its superior error margin in contrast to the RT-qPCR platform. All patient samples were considered, with data points stemming from experimental irregularities or technical glitches being omitted.
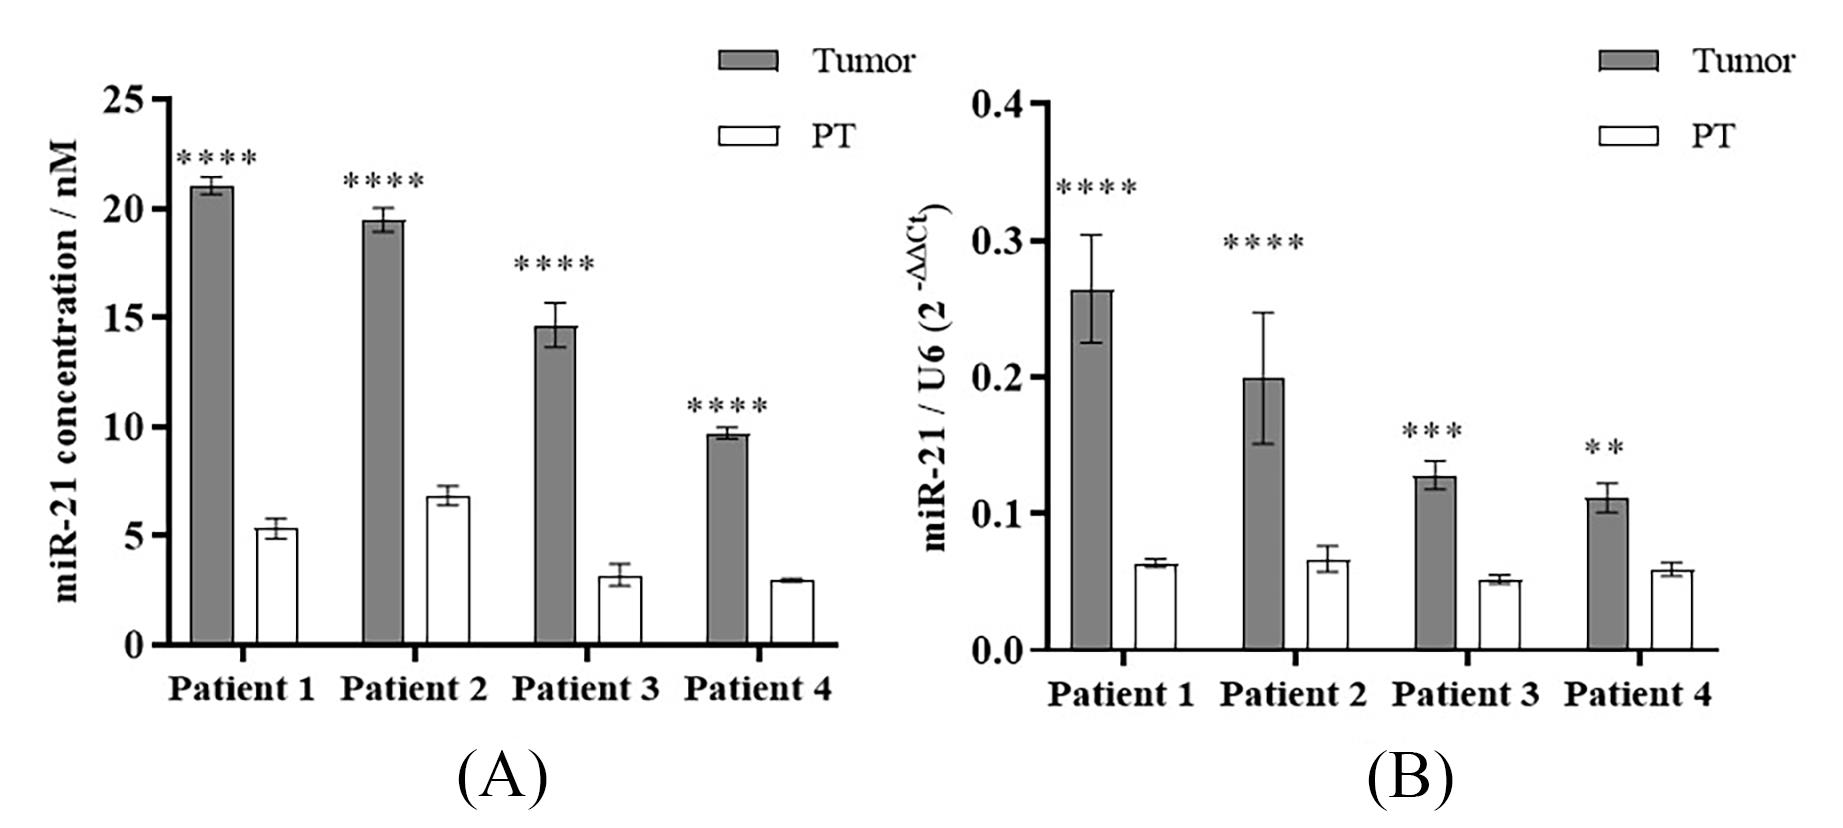
Figure 3. Comparison of miR-21 detection results in patients' tissues detected by (A) bHCR-DNAzyme and (B) RT-qPCR. Error bar: SD, n = 3.
Note: Each experiment mentioned above involved three independent biological replicates and three technical replicates. This setup ensures the statistical robustness of the data and accounts for both inter-experimental and intra-experimental variations. Data analysis, including ANOVA, standard curve plotting, and the correct interpretation and comparison of different detection methods, was performed using GraphPad Prism (version 7). A p < 0.05 was considered statistically significant (*p < 0.05, **p < 0.01, ***p < 0.001, ****p < 0.0001).
Validation of protocol
This protocol has been used and validated in the following research article:
Cao et al. [1]. A DNAzyme-enhanced nonlinear hybridization chain reaction for sensitive detection of microRNA. Journal of Biological Chemistry (Figure 4, panel A/B; Figure 5, panel C/D).
In Table 6, the detection performance of this platform is compared with other miRNA detection methods.
Table 6. Comparison of the proposed method with other microRNA detection methods
Methods Target miRNA Limit of detection Linear detection range Characteristic Ref. qPCR miRNAs 25 copies 102–106 copies Sensitive, specific, bulky equipment and trained personnel requirement [20] Northern blot miR-16 miR-18a
miR-30a
25 amol n/a Multiplexing, time consuming, and semiquantitative [21] Microarray miR let 7a 0.080 pM 0.2 pM–1.50 nM Low specificity, high-throughput, selective, and sensitive [22] RCA miR let 7a 10 fM 25 fM–2.5 pM Robustness, specificity, high sensitivity, and contains enzymes [23] SDA miRNAs 16 zM 1.0 pM–0.1 zM Wide linear range, sensitive, and contains enzymes [24] Catalytic hairpin assembly miR-21 1 pM 1 pM–100 nM Enzyme-free, stable, low cost, and sensitive [25] LAMP miR let 7a 1.0 aM 1.0 aM–1.0 pM Specific, sensitive, fast, and contains enzymes [26] bHCR-DNAzyme miR-21 0.004 nM 0.01 nM–0.2 nM Fast, convenient, low cost, specific, and enzyme-free This work Note: LAMP, loop-mediated isothermal amplification; qPCR, quantitative polymerase chain reaction; RCA, rolling circle amplification; SDA, strand-displacement amplification.
General notes and troubleshooting
General notes
When measuring the fluorescence values of the reaction system using a fluorescence spectrophotometer, ensure that the parameter settings remain consistent each time to avoid changes.
Handle systems containing the H2 probe with care to avoid light exposure. The H2 probe is labeled with a fluorescent group, so preventing it from absorbing specific wavelengths of light that could cause excitation is crucial for maintaining the stability of experimental results.
Perform hairpin formation for probes H1/H2/H3/H4 before use but be cautious not to prepare excessive amounts at once. Repeated freeze-thaw cycles can lead to degradation of the hairpin structures, potentially compromising the stability of experimental results.
Troubleshooting
Problem 1: High background signal in images when validating bHCR-DNAzyme using non-denaturing polyacrylamide gel electrophoresis (PAGE).
Possible cause: Poor quality of the electrophoresis buffer or insufficient washing time after staining.
Solution: Replace with fresh electrophoresis buffer and increase the number of washes with buffer after staining.
Problem 2: The measured fluorescence intensity value exceeds the maximum limit of the y-axis display.
Possible cause: The concentration of hairpin in the reaction system is too high, and the measured fluorescence intensity value exceeds the maximum value of the visible fluorescence intensity under the current parameter.
Solution: Measure after diluting the reaction system or change measurement parameters, such as reducing the voltage and reducing the slit width.
Acknowledgments
This work was supported by the National Natural Science Foundation of China [C0602-32270609]; the Hunan Provincial Natural Science Foundation of China [2021JJ30916]; and the Hunan Provincial Natural Science Foundation for Distinguished Young Scholars [2022JJ10091]. This protocol was described and validated in the following previous work: Cao et al. [1], J Biol Chem. 2023 Jun;299(6):104751.
Competing interests
The authors declare no competing interests.
Ethical considerations
Tumor tissue and PT tissue obtained from patients with hepatocellular carcinoma from the Third Xiangya Hospital in Central South University, Approval No: 2023009; all experiments were conducted following the Declaration of Helsinki and good clinical practice guidelines.
References
- Cao, X., Dong, J., Sun, R., Zhang, X., Chen, C. and Zhu, Q. (2023). A DNAzyme-enhanced nonlinear hybridization chain reaction for sensitive detection of microRNA. J Biol Chem. 299(6): 104751.
- Tomimaru, Y., Eguchi, H., Nagano, H., Wada, H., Kobayashi, S., Marubashi, S., Tanemura, M., Tomokuni, A., Takemasa, I., Umeshita, K., et al. (2012). Circulating microRNA-21 as a novel biomarker for hepatocellular carcinoma. J Hepatol. 56(1): 167–175.
- Berindan‐Neagoe, I., Monroig, P. d. C., Pasculli, B. and Calin, G. A. (2014). MicroRNAome genome: A treasure for cancer diagnosis and therapy. CA Cancer J Clin. 64(5): 311–336.
- Garo, L. P. and Murugaiyan, G. (2016). Contribution of MicroRNAs to autoimmune diseases. Cell Mol Life Sci. 73(10): 2041–2051.
- van Rooij, E. and Olson, E. N. (2012). MicroRNA therapeutics for cardiovascular disease: opportunities and obstacles. Nat Rev Drug Discovery. 11(11): 860–872.
- Wang, H., Taguchi, Y. H. and Liu, X. (2021). Editorial: miRNAs and Neurological Diseases. Front Neurol. 12: e662373.
- Xie, B., Ding, Q., Han, H. and Wu, D. (2013). miRCancer: a microRNA-cancer association database constructed by text mining on literature. Bioinformatics. 29(5): 638–644.
- Ayankojo, A. G., Reut, J., Ciocan, V., Öpik, A. and Syritski, V. (2020). Molecularly imprinted polymer-based sensor for electrochemical detection of erythromycin. Talanta. 209: 120502.
- Xu, W., He, W., Du, Z., Zhu, L., Huang, K., Lu, Y. and Luo, Y. (2021). Functional Nucleic Acid Nanomaterials: Development, Properties, and Applications. Angew Chem Int Ed. 60(13): 6890–6918.
- Li, P., Zhang, H., Wang, D., Tao, Y., Zhang, L., Zhang, W. and Wang, X. (2018). An efficient nonlinear hybridization chain reaction-based sensitive fluorescent assay for in situ estimation of calcium channel protein expression on bone marrow cells. Anal Chim Acta. 1041: 25–32.
- Zeng, Z., Zhou, R., Sun, R., Zhang, X., Cheng, Z., Chen, C. and Zhu, Q. (2021). Nonlinear hybridization chain reaction-based functional DNA nanostructure assembly for biosensing, bioimaging applications. Biosens Bioelectron. 173: 112814.
- McConnell, E. M., Cozma, I., Mou, Q., Brennan, J. D., Lu, Y. and Li, Y. (2021). Biosensing with DNAzymes. Chem Soc Rev. 50(16): 8954–8994.
- Silverman, S. K. (2016). Catalytic DNA: Scope, Applications, and Biochemistry of Deoxyribozymes. Trends Biochem Sci. 41(7): 595–609.
- Zhu, G. and Zhang, C. y. (2014). Functional nucleic acid-based sensors for heavy metal ion assays. Analyst. 139(24): 6326–6342.
- Zhu, L., Ling, J., Zhu, Z., Tian, T., Song, Y. and Yang, C. (2021). Selection and applications of functional nucleic acids for infectious disease detection and prevention. Anal Bioanal Chem. 413(18): 4563–4579.
- Zhang, C., Liu, K., Li, T., Fang, J., Ding, Y., Sun, L., Tu, T., Jiang, X., Du, S., Hu, J., et al. (2016). miR-21: A gene of dual regulation in breast cancer. Int J Oncol. 48(1): 161–172.
- Falzone, L., Scola, L., Zanghì, A., Biondi, A., Di Cataldo, A., Libra, M. and Candido, S. (2018). Integrated analysis of colorectal cancer microRNA datasets: identification of microRNAs associated with tumor development. Aging. 10(5): 1000–1014.
- Masoudi, M. S., Mehrabian, E. and Mirzaei, H. (2018). MiR‐21: A key player in glioblastoma pathogenesis. J Cell Biochem. 119(2): 1285–1290.
- Tan, S. C. and Yiap, B. C. (2009). DNA, RNA, and Protein Extraction: The Past and The Present. Biomed Res Int. 2009(1): 574398.
- Mohammadi-Yeganeh, S., Paryan, M., Mirab Samiee, S., Soleimani, M., Arefian, E., Azadmanesh, K., Mostafavi, E., Mahdian, R. and Karimipoor, M. (2013). Development of a robust, low cost stem-loop real-time quantification PCR technique for miRNA expression analysis. Mol Biol Rep. 40(5): 3665–3674.
- Schwarzkopf, M. and Pierce, N. A. (2016). Multiplexed miRNA northern blots via hybridization chain reaction. Nucleic Acids Res. 44(15): e129.
- Li, S., Li, R., Dong, M., Zhang, L., Jiang, Y., Chen, L., Qi, W. and Wang, H. (2016). High-throughput, selective, and sensitive colorimetry for free microRNAs in blood via exonuclease I digestion and hemin-G-quadruplex catalysis reactions based on a “self-cleaning” functionalized microarray. Sens Actuators, B. 222: 198–204.
- Cheng, Y., Zhang, X., Li, Z., Jiao, X., Wang, Y. and Zhang, Y. (2009). Highly Sensitive Determination of microRNA Using Target‐Primed and Branched Rolling‐Circle Amplification. Angew Chem Int Ed. 48(18): 3268–3272.
- Shi, C., Liu, Q., Ma, C. and Zhong, W. (2014). Exponential Strand-Displacement Amplification for Detection of MicroRNAs. Anal Chem. 86(1): 336–339.
- Li, X., Cheng, W., Li, D., Wu, J., Ding, X., Cheng, Q. and Ding, S. (2016). A novel surface plasmon resonance biosensor for enzyme-free and highly sensitive detection of microRNA based on multi component nucleic acid enzyme (MNAzyme)-mediated catalyzed hairpin assembly. Biosens Bioelectron. 80: 98–104.
- Li, C., Li, Z., Jia, H. and Yan, J. (2011). One-step ultrasensitive detection of microRNAs with loop-mediated isothermal amplification (LAMP). Chem Commun. 47(9): 2595–2597.
Article Information
Publication history
Received: Aug 27, 2024
Accepted: Oct 10, 2024
Available online: Nov 4, 2024
Published: Dec 20, 2024
Copyright
© 2024 The Author(s); This is an open access article under the CC BY-NC license (https://creativecommons.org/licenses/by-nc/4.0/).
How to cite
Readers should cite both the Bio-protocol article and the original research article where this protocol was used:
- Zhang, H., Cao, X. and Zhu, Q. (2024). An Autocatalytic Platform Combining a Nonlinear Hybridization Chain Reaction and DNAzyme to Detect microRNA. Bio-protocol 14(24): e5134. DOI: 10.21769/BioProtoc.5134.
Cao, X., Dong, J., Sun, R., Zhang, X., Chen, C. and Zhu, Q. (2023). A DNAzyme-enhanced nonlinear hybridization chain reaction for sensitive detection of microRNA. J Biol Chem. 299(6): 104751.
Category
Molecular Biology > RNA > RNA detection
Molecular Biology > RNA > qRT-PCR
Do you have any questions about this protocol?
Post your question to gather feedback from the community. We will also invite the authors of this article to respond.