- Protocols

- Articles and Issues
- For Authors
- About
- Become a Reviewer

Compartment-Resolved Proteomics with Deep Extracellular Matrix Coverage
Published: Vol 14, Iss 23, Dec 5, 2024 DOI: 10.21769/BioProtoc.5123 Views: 1992
Reviewed by: Rama Reddy GoluguriNeha NandwaniAnonymous reviewer(s)
Original research article
The authors used this protocol in:
Feb 2023
Advertisement


Protocol Collections
Comprehensive collections of detailed, peer-reviewed protocols focusing on specific topics


Abstract
The extracellular matrix (ECM) is a complex network of proteins that provides structural support and biochemical cues to cells within tissues. Characterizing ECM composition is critical for understanding this tissue component’s roles in development, homeostasis, and disease processes. This protocol describes an integrated pipeline for profiling both cellular and ECM proteins across varied tissue types using mass spectrometry–based proteomics. The workflow covers stepwise extraction of cellular and extracellular proteins, enzymatic digestion into peptides, peptide cleanup, mass spectrometry analysis, and bioinformatic data processing. The key advantages include unbiased coverage of cellular, ECM-associated, and core-ECM proteins, including the fraction of ECM that cannot be solubilized using strong chaotropic agents such as urea or guanidine hydrochloride. Additionally, the method has been optimized for reproducible ECM enrichment and quantification across diverse tissue samples. This protocol enables systematic mapping of the ECM at a proteome-wide scale.
Key features
• Improved profiling of core extracellular matrix and matrisome-associated proteins through multi-step decellularization and chemical extraction of insoluble ECM
• Extraction buffers optimized for effectiveness across a broad range of tissue types and compatibility with varied MS platforms
• Measurement of protein solubility via resistance to detergent and chaotrope extraction
• Integrated LC-MS/MS analysis and data processing pipeline for ECM-focused analysis
Keywords: proteomicsGraphical overview
ECM-focused protein extraction and analysis workflow
Background
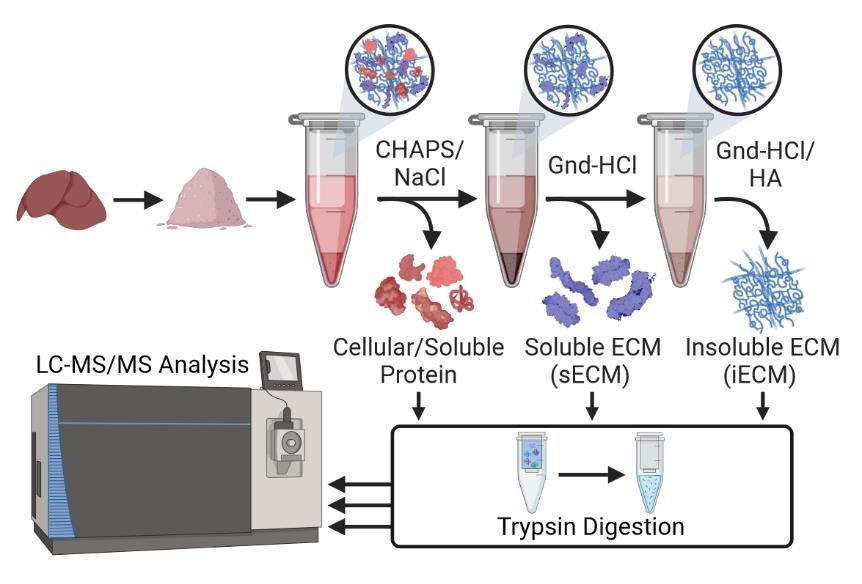
The extracellular matrix (ECM) is a complex biomolecular network composed of collagens, glycoproteins, proteoglycans, and other components that provide structural support and regulate the function of the ECM [1]. The ECM provides essential physical scaffolding for cellular constituents, as well as critical biochemical and biomechanical cues that regulate tissue development, homeostasis, and regeneration [2]. Given its fundamental roles, dysregulation of the ECM is implicated in numerous pathologies including fibrosis [3,4], cardiovascular diseases [5,6], and cancer progression [7]. Comprehensive mapping of ECM composition is crucial for understanding the diverse functions of this intricate network across different tissue microenvironments and disease states. Early efforts to catalog the ECM focused on profiling a subset of known ECM proteins [8] or employed antibody-based approaches [9], which are inherently biased and limited in coverage. More recently, mass spectrometry (MS)-based proteomics has enabled unbiased and system-wide profiling of the ECM at a proteome scale. However, technical challenges in extracting and enriching the ECM while minimizing contamination from cellular proteins have impeded comprehensive ECM characterization across a wide range of tissue types and organs. Previous analyses have shown that more than 80% of the total fibrillar collagen in many tissues resides in a chaotrope-resistant insoluble ECM fraction and is not solubilized by traditional proteomic extraction methods [10], highlighting the need for additional extraction steps when comprehensive characterization of ECM composition is a priority (Figure 1).
Figure 1. Proportion of total collagen I identified in the cellular, soluble extracellular matrix (sECM) and insoluble ECM (iECM, requiring chemical digestion) fractions of a 3-step ECM extraction via QconCAT-based absolute quantification. Adapted from Goddard et al. [10]. This protocol outlines an integrated experimental and computational pipeline tailored for deep proteomic profiling of the ECM across multiple mouse tissues and organs. The methods here have been refined across a broad range of tissue types, including 25 different mouse organs [11], and have been comprehensively benchmarked against other prominent methods in the field to validate their performance [12]. The workflow covers 1) enhanced step-wise extraction of cellular and ECM proteins facilitated by optimized extraction buffers effective across varied tissue types; 2) enzymatic digestion of proteins into peptides; 3) subsequent sample quantification and cleanup for MS analysis; 4) tandem mass spectrometry (LC-MS/MS) analysis of cellular and ECM protein fractions; and 5) bioinformatic identification of peptide sequences and computational matrisome categorization to classify ECM and associated proteins.
Materials and reagents
Reagents
Tris(hydroxymethyl)aminomethane hydrochloride (Tris-HCl) (Roche, catalog number: 10812846001)
3-((3-cholamidopropyl) dimethylammonio)-1-propanesulfonate (CHAPS) (Sigma-Aldrich, catalog number: C3023)
Ethylenediaminetetraacetic acid (EDTA) (Sigma-Aldrich, catalog number: E4884)
Sodium chloride (NaCl) (Sigma-Aldrich, catalog number: S9888)
Halt protease inhibitor cocktail (Thermo Fisher, catalog number: 78429)
Guanidine hydrochloride (Gnd-HCl) (Sigma-Aldrich, catalog number: G4505)
Hydroxylamine-HCl (NH2OH–HCl) (Sigma-Aldrich, catalog number: 159417)
Ammonium bicarbonate (ABC) (Sigma-Aldrich, catalog number: A6141)
Double-distilled water (ddH2O)
Dithiothreitol (DTT) (Sigma-Aldrich, catalog number: D9779)
Iodoacetamide (IAM) (Sigma-Aldrich, catalog number: I1149)
Potassium carbonate (K2CO3) (Sigma-Aldrich, catalog number: 209619)
Sodium hydroxide (NaOH) (Sigma-Aldrich, catalog number: S5881)
Urea (Sigma-Aldrich, catalog number: U5128)
Buffer A: 0.1% formic acid (FA) in H2O, Optima (Thermo Fisher, catalog number: LS118)
Buffer B: 0.1% FA in 80% ACN, Optima (Thermo Fisher, catalog number: LS122500)
Sequencing-grade modified trypsin (Promega, catalog number: V5111)
Lysyl Endopeptidase®, mass spectrometry grade (Lys-C) (FUJIFILM Wako Pure Chemical Corporation, catalog number: 125-05061)
Optional (if necessary based on protocol notes):
Gel-loading pipette tips (Corning, catalog number: CLS4853)
OptimaTM acetone (Thermo Fisher, catalog number: A929)
PierceTM 660 nm protein quantification assay (Thermo Fisher, catalog number: 22660)
High salt buffer (see Recipes)
Gnd-HCl solution (see Recipes)
DTT solution (see Recipes)
IAM solution (see Recipes)
Hydroxylamine (HA) buffer preparation (pH 9.0) (see Recipes)
Urea solution (see Recipes)
Digest master mix (per sample) (see Recipes)
High salt buffer
Reagent Final concentration Amount Tris-HCl (1M, pH 7.4) 50 mM 5 mL CHAPS 0.25% 25 mg EDTA (500 mM) 25 mM 5 mL NaCl 3 M 17.53 g Halt protease inhibitor (100×) 1× 1 mL Total n/a 100 mL Combine buffer components and bring to 100 mL with ddH2O. Buffer without protease inhibitors can be prepared in advance and stored at 4 °C for up to one month. Protease inhibitors must be added fresh before use.
Gnd-HCl solution
Reagent Final concentration Amount Gnd-HCl 6 M 57.32 g ABC (1 M, pH 8.0) 100 mM 10 mL Total n/a 100 mL Dissolve Gnd-HCl in ddH2O before adding 10 mL of 1 M ABC. Adjust pH to 9.0 using NaOH. Add ddH2O to 100 mL. Prepare fresh before use.
DTT solution
Reagent Final concentration Amount DTT 100 mM 15.4 mg ABC (1 M) 100 mM 1 mL Total n/a 10 mL Combine components and add ddH2O to 10 mL. Prepare fresh before use.
IAM solution
Reagent Final concentration Amount IAM 500 mM 92.5 mg ABC (1 M) 100 mM 1 mL Total n/a 10 mL Combine components and add ddH2O to 10 mL. Prepare fresh before use and store in the dark.
Hydroxylamine (HA) buffer preparation (pH 9.0)
Reagent Final concentration Amount Gnd-HCl solution (Recipe 2) 70% v/v 70 mL NH2OH–HCl 1 M 7 g NaOH (50% w/v) 4% w/v 8 mL K2CO3 (1 M) 0.2 M 20 mL Total n/a 100 mL Prepare Gnd-HCl solution according to Recipe 2. Dissolve NH2OH–HCl in 50 mL of Gnd-HCl solution. Add NaOH, mix, then add K2CO3. Add Gnd-HCl solution to 90 mL before adjusting pH to 9.0 using HCl. Add Gnd-HCl solution to 100 mL. Prepare fresh before use.
Urea solution
Reagent Final concentration Amount Urea 8 M 24.02 g ABC (1 M) 100 mM 5 mL Total n/a 50 mL Combine components and add ddH2O to 50 mL. Prepare fresh before use.
Digest master mix (per sample)
Reagent Final Concentration Amount ABC (1 M) 25 mM 2.5 μL Lys-C 1:400 enzyme:protein ratio 0.075 μg (for 30 μg protein) Total n/a 100 μL
Laboratory supplies
MS-compatible pipette tips (any brand)
Safe-Lock 1.75 mL tubes (Eppendorf, catalog number: 003012361)
2 mL snap cap tubes (any brand)
Glass beads, 1 mm diameter (Next Advance, catalog number: GB10)
10 kDa molecular weight cutoff (MWCO) filters (Sartorius, catalog number: VN01H02)
PierceTM quantitative colorimetric peptide assay (Thermo Fisher, catalog number: 23275)
Flat-bottom, clear 96-well plate (Grenier, catalog number: 655101)
Empore sealing tape for 96-well plate (Millipore Sigma, catalog number: 66881-U)
PierceTM C18 spin tips (Thermo Fisher, catalog number: 84850)
Verex 300 μL vials with pre-slit cap (Phenomenex, catalog number: AR0-39S0-13-C/AR0-8972-13-C)
Equipment
Ceramic mortar and pestle (any brand)
Measuring pipettes, p1000, p200, p10 (any brand)
FreeZone 4.5L benchtop freeze dryer (Labconco, catalog number: 7750020)
Clear complete fast-freeze flask, any size (Labconco)
Scroll vacuum pump (Labconco, catalog number: 7587000)
Bullet blender (Next Advance, model: BBX24)
Centrifuge (Eppendorf, model: 5430R)
Vortex mixer with 1.5 mL tube attachment (Labnet, model: VX-200)
Orbital shaker, Orbit M60 (Labnet, catalog number: LS-2020-M60)
Spark® microplate reader (TECAN, catalog number: 30086376)
CentriVap vacuum concentrator (Labconco, catalog number: 7810016)
Fusion Lumos Tribrid mass spectrometer (Thermo Fisher)
EASY-nLC 1200 System (Thermo Fisher, catalog number: LC140)
Analytical column made in-house: 100 μm i.d. × 150 mm fused silica capillary packed with 2.7 μm CORTECS C18 resin (Waters). Commercial alternative: EASY-Spray C18 column, 75 μm i.d. × 150 mm fused silica capillary packed with 3 μm resin (Thermo Fisher, catalog number: ES900)
Software and datasets
XCalibur Version 4.5 (Thermo Fisher)
Mascot Server Version 2.5 (Matrix Science)
Proteome Discoverer Version 2.5 (Thermo Fisher)
MSFragger (Nesvizhskii Lab) [13]
UniProtKB (https://www.uniprot.org/help/uniprotkb)
CRAPome Contaminant Database [14]
MatrisomeDB [15]
Procedure
Tissue preparation
Mill flash-frozen tissue samples in liquid nitrogen using a mortar and pestle until a fine powder is produced.
Lyophilize milled, frozen tissue samples in a clean fast-freeze flask (Labconco) of appropriate size for your sample set, ensuring that vessel pressure remains below 400 μBar during the entire lyophilization process.
Lyophilization is strongly recommended to increase the ease of sample handling and to avoid sample thawing (and subsequent enzymatic activity) during processing. However, it is required only when tissue dry weights are desired. If performing this extraction method on fresh tissue, proceed to step B1.
Once samples have been completely dried (5–16 h depending on tissue type and size), remove samples from the lyophilizer.
After lyophilization, store milled and dried samples in 1.75 mL safe-lock tubes at -80 °C until further processing. After removing samples from the -80 °C freezer, allow samples to come fully to room temperature before opening the tube lids to prevent condensation from forming on the sample and the inner tube walls.
Decellularization
Weigh approximately 5 mg (dry weight) of milled, lyophilized tissue into a 1.5 mL safe-lock tube. Record exact weights for each sample.
If performing extraction on fresh tissue, weigh approximately 20 mg of tissue to account for water content. During weighing of fresh tissue, work quickly and keep all tubes and spatulas on dry ice unless when actively being used to avoid sample thawing. Record weights quickly to avoid accumulation of condensation on the frozen sample.
Add 100 mg of 1 mm glass beads to each sample tube.
Add ice-cold high salt buffer to each sample tube at 200 μL/mg starting dry weight. Maintain cold buffer on ice during decellularization.
If using fresh tissue, add this buffer and all subsequent buffers at 50 μL/mg starting wet weight.
Homogenize samples in buffer using the bead beater (Bullet Blender) for 3 min on power 8.
Vortex samples at maximum power for 20 min at 4 °C.
Centrifuge samples at 18,000× g for 20 min in a 4 °C refrigerated centrifuge.
Remove supernatant, being careful to avoid disturbing the pellet, and reserve as fraction 1.
Keep collected supernatant on ice while completing subsequent decellularization washes.
Repeat steps B3–B7 two additional times, producing fractions 2 and 3. Combine fractions 1–3 to produce the cellular fraction.
During removal of the final supernatant, ensure that all solution is carefully removed from beneath the beads to avoid protein carryover into the next fraction. If the pellet is disturbed during collection, centrifuge again and remove all supernatant without disturbing pellet.
If the solution is difficult to completely remove without disturbing the pellet here or during subsequent fraction collection steps, use a gel-loading pipette tip to remove the last 100–200 μL of solution with greater precision.
Freeze the produced cellular fractions at -80 °C immediately after collecting the third wash and combining it with previous fractions. Store at -80 °C until digestion.
Soluble ECM extraction
Homogenize ECM-enriched pellets in Gnd-HCl solution at 200 μL/mg of the initial tissue dry weight using the Bullet Blender at power 8 for 1 min.
Vortex the homogenate at room temperature (25 °C) overnight at power 5.
After vortexing, centrifuge the homogenate at 18,000× g for 20 min at 4 °C.
Collect the supernatant and reserve it as the soluble ECM (sECM) fraction. Ensure that all solution is carefully removed from below the beads to prevent carryover into the next fraction.
Freeze sECM fractions at -80 °C and store at -80 °C until digestion.
HA buffer treatment
Treat remaining pellets with freshly prepared HA buffer at 200 μL/mg of the initial tissue dry weight.
Homogenize using the Bullet Blender at power 8 for 1 min.
Incubate at 45 °C with shaking on an orbital shaker (1,000 rpm) for 4 h.
Centrifuge at 18,000× g for 20 min at 4 °C.
Collect supernatant and reserve as the insoluble ECM (iECM) fraction.
Freeze iECM immediately alongside previous fractions to prevent further HA cleavage and store fractions at -80 °C until digestion.
Proteolytic digestion using filter-aided sample preparation (FASP)
Aliquot a volume of each extract, which corresponds to roughly 30 μg of protein for each sample, into individual 1.5 mL tubes. Protein quantification is challenging at this point due to high extraction buffer solute concentrations. Aliquot samples according to the following protein concentration estimates (based on typical tissue content) and perform peptide quantification after digestion to accurately assess protein content. Volume estimates for 30 μg of protein based on typical tissue sample:
Cellular fraction: 200 μL
sECM fraction: 100 μL
iECM fraction: 100 μL
If quantification is desired at this step, accurate results can sometimes be obtained using the PierceTM 660 nm protein quantification assay. To use this assay, dilute all buffers at a 1:3 ratio with ddH2O to ensure assay compatibility and then perform the assay according to the manufacturer’s protocol.
Add urea buffer to bring each sample to 250 μL.
Add DTT solution to a final concentration of 10 mM (28 μL of DTT solution for 250 μL of sample).
Incubate samples at 37 °C for 30 min.
While samples are reducing, prepare one 10 kDa MWCO filter for each sample by adding 100 μL of 0.1% FA to each filter.
Centrifuge filters at 14,000× g for 15 min.
Add IAM solution to a final concentration of 22 mM (12.3 μL for 250 μL of sample).
Incubate in the dark at room temperature for 15 min.
Add 100 μL of urea solution to each filter and centrifuge filters at 14,000× g for 15 min.
Load entire reduced and alkylated samples onto equilibrated 10 kDa MWCO filters.
Centrifuge filters at 14,000× g for 15 min.
Discard flowthrough from the collection tube.
Add 200 μL of urea solution to the filter unit and centrifuge at 14,000× g for 20 min.
Repeat wash with 200 μL of urea solution for a second time.
Discard flowthrough from the collection tube.
Add 100 μL of 50 mM ABC to each filter and centrifuge at 14,000× g for 15 min.
Repeat wash with 50 mM ABC two additional times for a total of three washes.
Transfer filters to clean collection tubes.
Prepare 100 μL of digest master mix using Lys-C at a 1:400 enzyme:protein ratio for your number of samples plus one to ensure sufficient digest solution for all samples.
Add 100 μL of digest master mix to each filter.
Incubate filters at 37 °C for 2 h. Ensure high humidity within the incubator by adding a tray of water to evaporate during digestion.
Remove samples from the incubator and add trypsin directly from the commercial stock solution to each sample at a 1:100 enzyme:protein ratio.
Incubate filters at 37 °C overnight for a maximum of 16 h. Ensure high humidity within the incubator by adding a tray of water to evaporate during digestion.
After overnight incubation, centrifuge samples at 14,000× g for 15 min.
Add 75 μL of 0.2% FA to each filter and centrifuge at 14,000× g for 15 min.
Repeat elution with an additional 75 μL of 0.2% FA.
Begin desalting immediately after elution or freeze samples at -80 °C for later processing.
Sample quantification
Prepare an 8-point standard curve (ranging from 1,000 to 0 μg/mL) by diluting the peptide standard included with the PierceTM quantitative colorimetric peptide assay into 0.2% FA. The last point of the standard curve should be a 0.2% FA blank.
Determine the amount of working reagent necessary for your samples (180 μL/sample, including the standard curve) and prepare working reagent by combining the included reagents A, B, and C in a 50:48:2 ratio.
Load 20 μL of each standard curve point and each sample into individual wells of a clear, flat-bottom 96-well plate.
Add 180 μL of working reagent to each sample in the 96-well plate.
Seal the plate with adhesive sealing mat and incubate at 37 °C for 15 min.
Remove sealing mat and load the 96-well plate into Spark microplate reader.
Read the absorbance of the plate at 480 nm. Record values and use the standard curve to determine the concentration of each sample.
Desalting
Load PierceTM C18 spin tips into 2 mL tubes using the provided adapters.
Wash resin using 70 μL of 0.1% FA in 80% ACN. Centrifuge at 1,000× g for 1 min.
Equilibrate resin using 70 μL of 0.1% FA in H2O. Centrifuge at 1,000× g for 1 min.
Discard flowthrough from the 2 mL tube.
Load sample (up to 70 μL) onto C18 spin tips. Use quantification values to determine the volume that corresponds to 8 μg of protein. If more than 70 μL of solution is required to reach 8 µg, load the sample in two successive rounds. Centrifuge at 1,000× g for 1 min.
Wash sample 3× with 70 μL of 0.1% FA. After each buffer addition, centrifuge at 1,000× g for 1 min.
Transfer C18 spin tips to clean 1.5 mL collection tubes using the provided adapters.
Elute peptides with two consecutive washes of 70 μL of 0.1% FA in 80% ACN. After each wash, centrifuge at 1,000× g for 1 min.
Transfer eluted samples to autosampler vials and freeze for 15 min at -80 °C.
Samples can be stored in 0.1% FA, 80% ACN at -80 °C until MS analysis. When ready for analysis, proceed with step G10 using samples directly from the freezer.
Dry samples without autosampler lids in a SpeedVac until 1–3 μL of volume remains.
Rehydrate samples in 9 μL of 0.1% FA for MS analysis. Samples in this state can be stored at 4 °C for up to one week.
LC−MS/MS analysis
Inject 8 μL of each prepared sample at a maximum pressure of 700 bar into a 20 μL sample loop on the EASY-nLC 1200 system, coupled to the Fusion Lumos Tribrid mass spectrometer through a nanoelectrospray interface.
Elute samples from the analytical column at a flow rate of 400 nL/min over a 120-min gradient consisting of 6% buffer B for the first 3 min. For cellular fractions, utilize a subsequent linear gradient from 6% to 42% buffer B over 102 min. For sECM fractions, utilize a linear gradient from 6% to 36% buffer B over 102 min. For iECM fractions, utilize a linear gradient from 6% to 24% buffer B over 102 min. After the linear elution gradient, wash the column by increasing to 95% buffer B and holding for 10 min. Re-equilibrate the column with 6% buffer B for the final 5 min. Gradient schematics and resulting elution profiles for each fraction can be found in Figure 2.
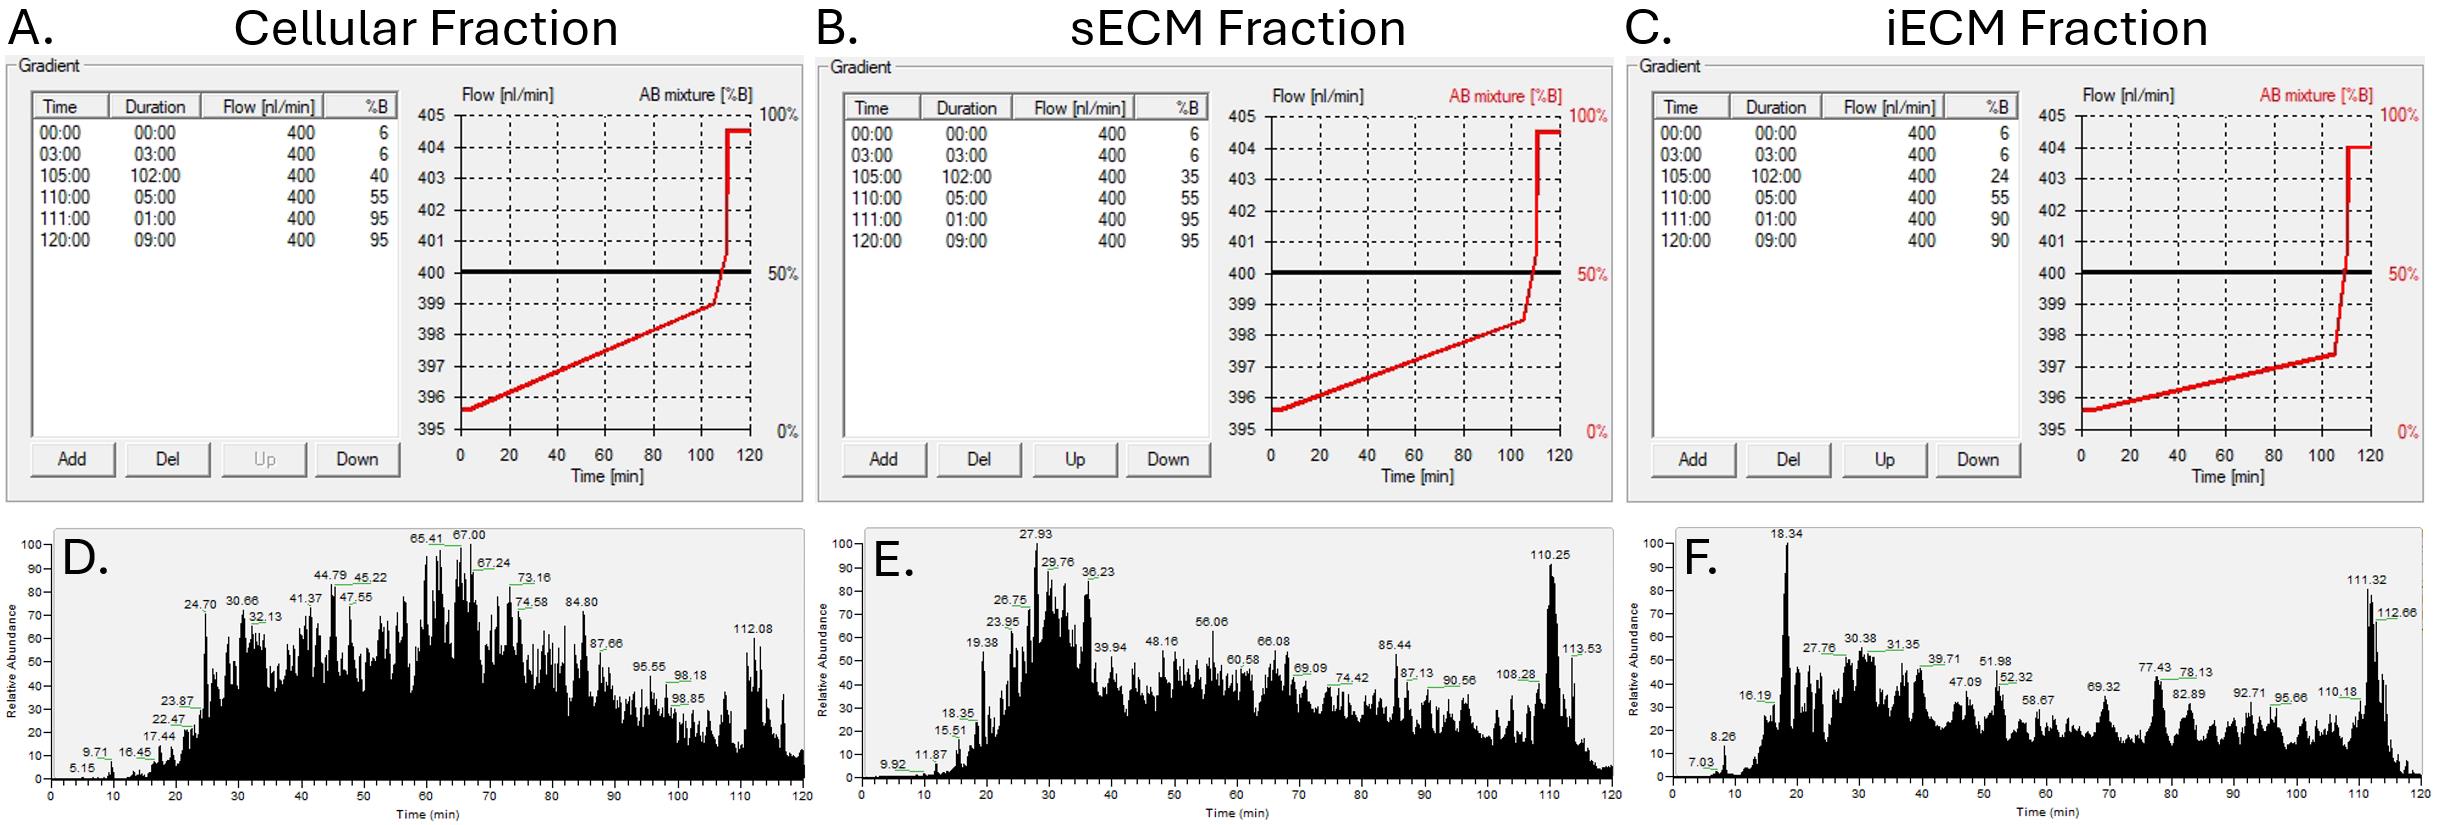
Figure 2. Schematic of elution gradients used for LC-MS/MS analysis of cellular (A), soluble extracellular matrix (sECM) (B), and insoluble extracellular matrix (iECM) (C) fractions from Mus musculus heart tissue. Elution profiles for cellular (D), sECM (E), and iECM (F) fractions using the corresponding gradients.The Fusion Lumos mass spectrometer is operated using the vendor-provided XCalibur software. Analyze the injected samples using data-dependent acquisition according to the following parameters. Perform full MS1 scans from 375–1600 m/z using the orbitrap at a resolution of 120,000. Select peptides for HCD MS/MS fragmentation (30% collision energy) using the default automatic gain control target and a 35 ms maximum ion injection time. Perform MS/MS detection in the orbitrap with an isolation window of 1/6 m/z. Enable dynamic exclusion after fragmenting a precursor 1 time for a duration of 45 s.
Data processing
Analyze data using Mascot integrated with Proteome Discoverer. Within your processing workflow, first, use Proteome Discoverer to convert the raw files to Mascot generic format (mgf) peaks lists. Search the data against the appropriate UniProt database for your organism using the following parameters: precursor tolerance of ±10 ppm, fragment tolerance of ±20 ppm, and 2 allowed missed cleavages. For cellular and sECM fractions, use fully specific trypsin as the enzyme definition. For the iECM fraction, use a fully-specific HA/Trypsin cleavage definition, defined as cleaving C-terminal of K and R but not before P, as well as C-terminal of N and before G, A, or R. Set fixed modifications as carbamidomethyl (C) and variable modifications as oxidation (M), oxidation (P) (hydroxyproline), Gln->pyro-Glu (N-term Q), deamidation (NQ), and acetyl (protein N-term). Additional modifications commonly identified on fibrillar collagen include hydroxylation (K), galactosylation (K), and galactosyl-glucosylation (K)[16]. Filter results to 1% false discovery rate (FDR) at the peptide level using the Percolator node and at the protein level using the Protein FDR Validator node. Perform label-free quantification (LFQ) using the Precursor Ions Quantifier node, including unique and razor peptides. Example data displays the percentage of total label-free quantification intensity assigned ECM and cellular proteins and summary statistics of protein identifications for each analyzed fraction (Figure 3).
Data can alternatively be processed using the open-source database search software MSFragger through the FragPipe interface [13]. Apply the settings described above to MSFragger database searches with the exception of enzyme cleavage, which should be set to semi-specific trypsin cleavage for ECM fractions. Set maximum variable modifications per peptide to 5. Apply default settings for all fields not described here.
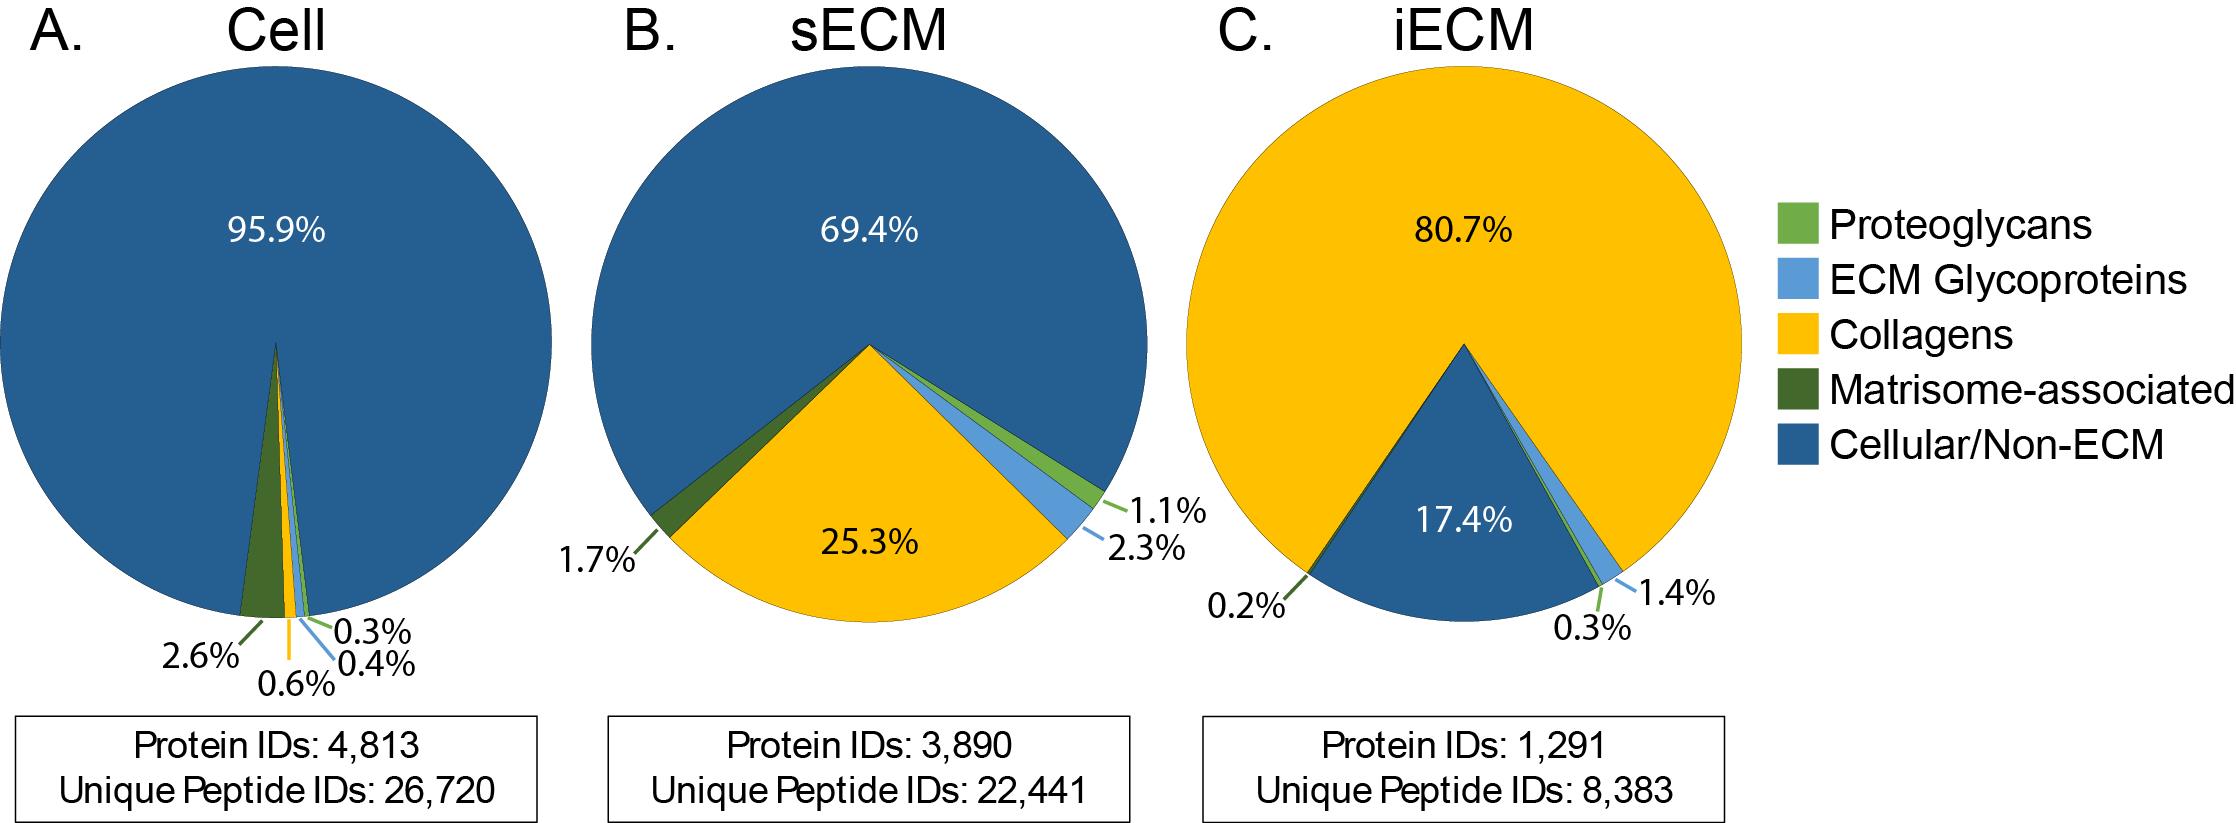
Figure 3. Composition of identified proteins across cell (A), soluble extracellular matrix (sECM) (B), and insoluble extracellular matrix (iECM) (C) fractions from 25 mouse tissues. Values are calculated as a percentage of total LFQ signal assigned to each category across all 25 analyzed tissues from McCabe et al. [11]. Total protein and unique peptide sequence identifications are displayed below the corresponding pie chart for each fraction.For many datasets, normalization to total LFQ intensity by fraction, so that the total signal in each fraction is equal across samples before fractions are aggregated for analysis, can improve intra-group variability by accounting for inaccuracies in protein load between samples.
Normalization to total LFQ intensity by fraction is not appropriate in cases when there is a significant difference in protein levels between groups.
After normalization (if applying), sum the intensity from the cellular, sECM, and iECM fractions for each sample to generate the total identified intensity across all analyzed fractions. Use this summed data for analysis of total protein composition and the data separated by fraction for analysis of protein solubility/resistance to extraction.
Protein solubility can be measured by calculating the percentage of the total identified signal detected in the iECM fraction for each protein in each sample. Adjust solubility measures based on sample load as a percentage of the total sample by dividing the intensity values for each fraction by the percentage of total extract volume that was loaded onto the mass spectrometer.
For ECM-focused analysis, annotate ECM and matrisome-associated proteins within the Excel output files using MatrisomeDB [15].
Validation of protocol
This protocol has been used and validated in the following research article:
McCabe et al. [11]. Mass Spectrometry-Based Atlas of Extracellular Matrix Proteins across 25 Mouse Organs. Journal of Proteome Research.
In the article above, the present protocol was employed for ECM-focused proteomics analysis of 25 mouse organs. All data within the article is derived from this protocol. For 12 of the analyzed tissues (reported within the article), three replicate mice (male, female, and pregnant female) were analyzed, and statistical testing was performed using multiple comparison–adjusted t-tests and ANOVA. For the remaining 13 tissues, samples were derived from a single pregnant female mouse harvested when the embryo was in the E12−16 embryonic stage.
General notes and troubleshooting
Troubleshooting
| Issue | Cause | Solution |
|---|---|---|
| Layer forms at the top of decellularization extract and will not pellet. | Tissue sample contains lipids that do not pellet or become solubilized by extraction buffer. | Perform acetone precipitation on samples before extraction to remove lipids according to the protocol from Simpson and Beynon [17]. |
| Pellet is collected during the removal of supernatant during any extraction step. | Pellet was not fully compacted by centrifugation or was disturbed during pipetting. | Return extract to tube with pellet, repeat centrifugation, and repeat supernatant removal, taking care to avoid the pellet. A gel-loading pipette tip can be used for additional precision during supernatant removal if necessary. |
| FASP filter clogs during sample loading, sample will not flow through. | Too much protein or particulate from extract fraction loaded onto filter. | Centrifuge samples at 18,000× g for 10 min before loading and pipette from the top of the solution to avoid any pelleted particulate. If this does not fix the problem, repeat with reduced extract volume. |
| Post-digest quantification does not provide reliable values or indicates that digested protein is insufficient for analysis. | 1. Tissue sample had less protein than expected, resulting in insufficient digested protein. 2. Digestion was unsuccessful/incomplete and undigested proteins remained on the FASP filter after elution. 3. Protein is distributed differently across the three extracted fractions than the estimates provided for a typical tissue, causing unsuccessful quantification for one fraction due to low protein content. For example, bone without marrow will have greater protein content in the iECM fraction and less in the cellular fraction than a typical tissue. | 1. Utilize post-digest quantification to revise amounts of extract loaded for digestion. Increase loaded volume to contain approximately 30 µg of protein. 2. Repeat digestion, ensuring that enzymes are active and that all wash buffer is fully eluted from the FASP filter before adding digest buffer. If desired, SDS-PAGE can be utilized to assess digestion efficacy. 3. Repeat FASP digest of fraction with low protein content using 2–3× the previous digest volume. Adjust content of other fractions for C18 cleanup based on quantification values. |
| Lower identification than expected after database searching. | 1. Incomplete digestion—determined by high content (>5%) of trypsin missed-cleavage identifications. 2. Carbamylation of proteins from urea adducts. | 1. Repeat digestion of extracted fractions, increasing enzyme:protein ratios to 1:200 and 1:75 for Lys-C and trypsin, respectively. If necessary, increase digestion time for Lys-C to 4 h before adding trypsin for overnight incubation. 2. Make sure that urea solution is freshly made and is not heated. Additionally, urea solutions can be passed over mixed mode resins for removal of impurities. Alternatively, switch urea solution to Gnd-HCl solution during FASP digestion. If carbamylation is a suspected issue but sample re-preparation is not possible, carbamylation (+43.005814, Unimod, catalog number: 5) can be added as a variable modification to database searches to identify carbamylated peptides. |
Acknowledgments
This work was supported by the NIH (Grant Nos. R33CA183685, RM1GM131968, P01HL152961, and R01HL146519) and the University of Colorado Cancer Center Support Grant (P30CA046934). This protocol was previously described and validated in McCabe et al., 2023 (Journal of Proteome Research)[11].
Competing interests
The authors declare that they have no known competing financial interests or personal relationships that could have appeared to influence the work reported in this paper.
Ethical considerations
Mouse tissues utilized in McCabe et al. 2023 [11], where this protocol was initially described and validated, were acquired from the Jackson Laboratory and approved by the Institutional Animal Care and Use Committee (IACUC) and Association for Assessment and Accreditation of Laboratory Animal Care, International (AAALAC) approvals for mouse research.
References
- Mecham, R. P. (2012). Overview of Extracellular Matrix. Curr Protoc Cell Biol. 57(1): ecb1001s57. https://doi.org/10.1002/0471143030.cb1001s57
- Hynes, R. O. (2009). The Extracellular Matrix: Not Just Pretty Fibrils. Science (1979). 326(5957): 1216–1219. https://doi.org/10.1126/science.1176009
- Harvey, A., Montezano, A. C., Lopes, R. A., Rios, F. and Touyz, R. M. (2016). Vascular Fibrosis in Aging and Hypertension: Molecular Mechanisms and Clinical Implications. Can J Cardiol. 32(5): 659–668. https://doi.org/10.1016/j.cjca.2016.02.070
- Wynn, T. (2007). Cellular and molecular mechanisms of fibrosis. J Pathol. 214(2): 199–210. https://doi.org/10.1002/path.2277
- Barallobre-Barreiro, J., Didangelos, A., Schoendube, F. A., Drozdov, I., Yin, X., Fernández-Caggiano, M., Willeit, P., Puntmann, V. O., Aldama-López, G., Shah, A. M., et al. (2012). Proteomics Analysis of Cardiac Extracellular Matrix Remodeling in a Porcine Model of Ischemia/Reperfusion Injury. Circulation. 125(6): 789–802. https://doi.org/10.1161/circulationaha.111.056952
- Biernacka, A., Frangogiannis, N. G., Cardiology, D., Einstein, A. and Ny, B. (2012). Aging and Cardiac Fibrosis. Aging Dis. 2(2): 158–173.
- Barrett, A. S., Maller, O., Pickup, M. W., Weaver, V. M. and Hansen, K. C. (2018). Compartment resolved proteomics reveals a dynamic matrisome in a biomechanically driven model of pancreatic ductal adenocarcinoma. J Immunol Regener Med. 1: 67–75. https://doi.org/10.1016/j.regen.2018.03.002
- Stoilov, I., Starcher, B. C., Mecham, R. P. and Broekelmann, T. J. (2018). Measurement of elastin, collagen, and total protein levels in tissues. Methods Cell Biol. 143: 133–146. https://doi.org/10.1016/bs.mcb.2017.08.008
- Rickelt, S. and Hynes, R. O. (2018). Antibodies and methods for immunohistochemistry of extracellular matrix proteins. Matrix Biol. 71–72: 10–27. https://doi.org/10.1016/j.matbio.2018.04.011
- Goddard, E. T., Hill, R. C., Barrett, A., Betts, C., Guo, Q., Maller, O., Borges, V. F., Hansen, K. C. and Schedin, P. (2016). Quantitative extracellular matrix proteomics to study mammary and liver tissue microenvironments. Int J Biochem Cell Biol. 81: 223–232. https://doi.org/10.1016/j.biocel.2016.10.014
- McCabe, M. C., Saviola, A. J. and Hansen, K. C. (2023). Mass Spectrometry-Based Atlas of Extracellular Matrix Proteins across 25 Mouse Organs. J Proteome Res. 22(3): 790–801. https://doi.org/10.1021/acs.jproteome.2c00526
- McCabe, M. C., Schmitt, L. R., Hill, R. C., Dzieciatkowska, M., Maslanka, M., Daamen, W. F., van Kuppevelt, T. H., Hof, D. J. and Hansen, K. C. (2021). Evaluation and Refinement of Sample Preparation Methods for Extracellular Matrix Proteome Coverage. Mol Cell Proteomics. 20: 100079. https://doi.org/10.1016/j.mcpro.2021.100079
- Kong, A. T., Leprevost, F. V., Avtonomov, D. M., Mellacheruvu, D. and Nesvizhskii, A. I. (2017). MSFragger: ultrafast and comprehensive peptide identification in mass spectrometry–based proteomics. Nat Methods. 14(5): 513–520. https://doi.org/10.1038/nmeth.4256
- Mellacheruvu, D., Wright, Z., Couzens, A. L., Lambert, J. P., St-Denis, N. A., Li, T., Miteva, Y. V., Hauri, S., Sardiu, M. E., Low, T. Y., et al. (2013). The CRAPome: a contaminant repository for affinity purification–mass spectrometry data. Nat Methods. 10(8): 730–736. https://doi.org/10.1038/nmeth.2557
- Shao, X., Taha, I. N., Clauser, K. R., Gao, Y. (. and Naba, A. (2019). MatrisomeDB: the ECM-protein knowledge database. Nucleic Acids Res. 48: D1136–D1144. https://doi.org/10.1093/nar/gkz849
- Yamauchi, M. and Sricholpech, M. (2012). Lysine post-translational modifications of collagen. Essays Biochem. 52: 113–133. https://doi.org/10.1042/bse0520113
- Simpson, D. M. and Beynon, R. J. (2009). Acetone Precipitation of Proteins and the Modification of Peptides. J Proteome Res. 9(1): 444–450. https://doi.org/10.1021/pr900806x
Article Information
Publication history
Received: May 1, 2024
Accepted: Sep 23, 2024
Available online: Oct 22, 2024
Published: Dec 5, 2024
Copyright
© 2024 The Author(s); This is an open access article under the CC BY-NC license (https://creativecommons.org/licenses/by-nc/4.0/).
How to cite
McCabe, M. C., Saviola, A. J. and Hansen, K. C. (2024). Compartment-Resolved Proteomics with Deep Extracellular Matrix Coverage. Bio-protocol 14(23): e5123. DOI: 10.21769/BioProtoc.5123.
Category
Systems Biology > Proteomics > Secretome
Biochemistry > Protein > Quantification
Do you have any questions about this protocol?
Post your question to gather feedback from the community. We will also invite the authors of this article to respond.