- Protocols

- Articles and Issues
- For Authors
- About
- Become a Reviewer

A Simple, Rapid, and Cost-Effective Method for Assessing Carbohydrate Partitioning in Microalgae and Arabidopsis thaliana
(§ Technical contact) Published: Vol 14, Iss 23, Dec 5, 2024 DOI: 10.21769/BioProtoc.5121 Views: 2802
Reviewed by: Abhilash PadavannilWalmik Karbhari GaikwadJoyce Chiu
Original research article
The authors used this protocol in:
Mar 2024
Advertisement


Protocol Collections
Comprehensive collections of detailed, peer-reviewed protocols focusing on specific topics


Abstract
Carbohydrates serve crucial functions in most living cells, encompassing structural and metabolic roles. Within the realms of plant and algal biology, carbohydrate biosynthesis and partitioning play pivotal roles in growth, development, stress physiology, and various practical applications. These applications span diverse fields, including the food and feed industry, bioenergetics (biofuels), and environmental management. However, existing methods for carbohydrate determination tend to be costly and time-intensive. In response to that, we propose a novel approach to assess carbohydrate partitioning from small samples. This method leverages the differential solubility of various fractions, including soluble sugars, starch, and structural polymers (such as cellulose). After fractionation, a straightforward spectrophotometric analysis allows for the quantification of sugars.
Key features
• We developed a cost-effective method to assess carbohydrate distribution in small samples based on differential solubility and spectrophotometry.
• Efficient carbohydrate partitioning methods reduce time and effort, especially for large sample sets.
• Cost-effective carbohydrate analysis method reduces expenses, promotes accessibility, and encourages adoption in research and quality control.
• Analysis of small samples from microalgal and A. thaliana seedlings has wide applicability in scientific and technological research.
Keywords: SugarsGraphical overview
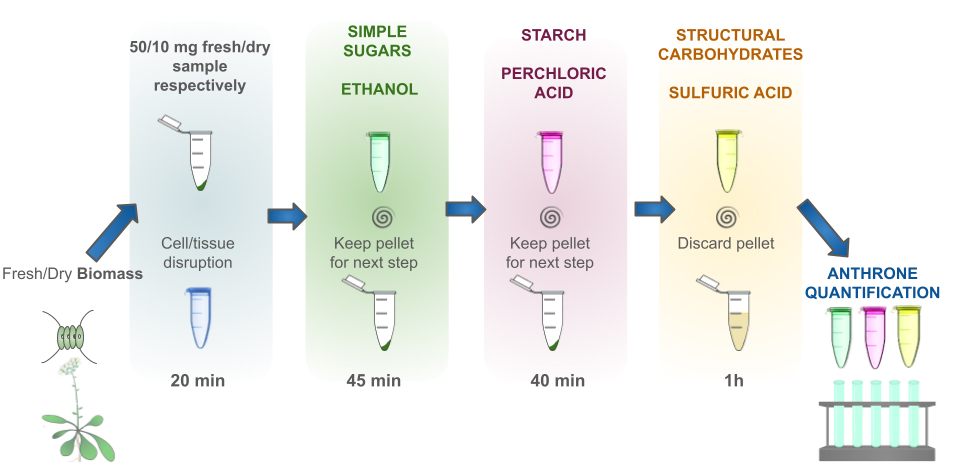
Description of the complete process. A total of 10 mg of dry sample or an equivalent quantity of fresh biomass is sufficient to carry out the extraction process. The initial step involves disruption of the samples through freezing and thawing. This is followed by the sequential extraction of simple sugars through an alcoholic extraction, which is then subjected to centrifugation to retain the supernatant. The resulting pellet is retained for starch extraction/hydrolysis by cold perchloric acid. The resulting insoluble polysaccharides from this fraction are extracted/hydrolyzed by hot sulfuric acid. Finally, sugars are determined by the anthrone method in every fraction collected, which corresponds to sugars, starch, and structural carbohydrates. The basic principles and methods for sugar extraction with ethanol, starch extraction/hydrolysis with perchloric acid, and polysaccharides hydrolysis with sulfuric acid have been described before [1,2].
Background
Carbohydrates play essential roles in most living cells, serving structural and metabolic functions. In algae and plants, soluble sugars are crucial for various metabolic processes, including osmotic regulation, energy translocation, and signal transduction. When carbon assimilation exceeds the demand for growth and maintenance, the excess is converted into starch. Moreover, starch accumulates within cells during unfavorable environmental conditions, allowing algae and plants to withstand severe challenges. Polysaccharides, in conjunction with proteins, are vital components of cell walls, influencing their conformation, resistance, and stability. While microalgae cell walls exhibit extensive diversity, they may contain cellulose, pectin, agar, or alginate [3]. Conversely, in the model plant A. thaliana, the primary cell wall primarily consists of pectin, hemicellulose, and cellulose [4].
Several techniques are currently available for the quantitative identification and determination of carbohydrates, namely chromatography methods (such as HPLC and GC–MS), enzymatic assays, colorimetric methods, and physical measurements based on a specific gravity or refractive index [5]. While these methods are highly accurate, they often require expensive equipment and high-quality reagents and can be time-consuming. Additionally, methods for determining multiple carbohydrates from the same sample remain scarce.
To address this gap, we have developed an easy, rapid, and cost-effective method for assessing carbohydrate partitioning in microalgae and plants. This approach allows high-throughput data acquisition. A modified protocol for smaller sample sizes and reduced reaction volumes is provided in the Supplementary information.
Materials and reagents
Biological materials
Chlamydomonas reinhardtii represents a valuable research organism with a sequenced genome, simple life cycle, and ability to grow in multiple metabolic states. It is a model organism for studies in areas like flagella structure, chloroplast biogenesis, photosynthesis, and cell–cell recognition. Its cell wall is composed of glycoproteins and polysaccharides in a multi-layered structure. Strain CC125 represents a popular wild-type (WT) alga for the species; strain cw15 [6] is a cell wall–deficient mutant that facilitates genetic manipulation and cellular process studies; and sta6 is a mutant strain deficient in starch accumulation, which is very useful for studies on carbon partitioning and lipid accumulation [7].
Scenedesmus obliquus and Chlorella sorokiniana are thoroughly used for biotechnological applications such as the production of biofuels and food/feed ingredients and wastewater treatment. They show very robust and prolific growth in cultivation facilities. In contrast to C. reinhardtii, they currently offer limited possibilities for genetic modification and reduced availability of mutant strains. While the S. obliquus cell wall comprises a resistant outer layer of algaenan and an inner layer of cellulosic material, the C. sorokiniana cell wall presents a thin trilaminate layer of hemicellulose and a glucosamine-based residue and produces mucilage [8].
A. thaliana, a model organism in plant biology, boasts features like a small genome, rapid life cycle, and easy genetic modification. Its cell wall, composed of cellulose, hemicellulose, and pectin, provides strength, flexibility, and porosity. Some cells even develop a secondary cell wall with lignin for rigidity. Structural proteins, enzymes, and glycoproteins contribute to cell signaling and growth. Remodeling occurs during growth and in response to environmental stress [9].
All of these organisms produce starch as a carbon and energy reserve, and sugars with different physiological roles.
Organisms' cultivation conditions
The microalgal strains C. reinhardtii CC125 (WT), cw15 (cell wall–deficient), and sta6 (starchless mutant) were kindly provided by C. Benning (Michigan State University), and strains C. sorokiniana RP and S. obliquus C1S were isolated [10] and characterized [11] by our research group. These algal strains belong to the INBIOTEC culture collection.
The microalgal strains were cultivated and induced for carbohydrate accumulation as previously described in Bader et al. [12] under nitrogen-deficient conditions.
The A. thaliana used in this study was a wild type of Columbia (Col-O) stored in our laboratory. Seeds were sown in pots and grown under 16/8 h light/dark (light 120 μmol photons m-2·s-1) at 23 °C in a growth room. Fourteen-day-old A. thaliana plants were treated with 150 mM NaCl for 14 days before leaves were collected for carbohydrate analysis.
Reagents
Distilled water (dH2O)
Double-distilled water (ddH2O) for anthrone solution
Ethanol 96% (C2H6O) (e.g., Alco Protect, Porta, Argentina)
Perchloric acid 60% (HClO4) (Fluka, catalog number: 77232)
Sulfuric acid 96%–98% (H2SO4) (Biopack, Brand, catalog number: 0303A0036)
Glucose analytical grade (C6H12O6) (Glc) (Sigma-Aldrich, catalog number: G5767)
Anthrone (C14H10O) [Fluka, catalog number: A 866 (0740)]
Thiourea (CH4N2S) (Sigma-Aldrich, catalog number: T7875-500G)
Note: Both sulfuric acid and perchloric acid are hazardous to touch and inhalation; therefore, it is necessary to work with caution and use personal protective equipment (gloves, lab coat, closed-toe shoes, and safety goggles).
Solutions
For carbohydrate quantification, the anthrone method was used, which has been widely validated and allows for the quantification of a broad range of carbohydrates, hexoses, and aldopentoses [13]. In the presence of concentrated sulfuric acid, carbohydrates are dehydrated into furfurals (or hydroxymethylfurfurals), which condense with anthrone (10-keto-9,10-dihydroxyanthracene) (Figure 1) to produce a blue-green complex. The intensity of the color is quantified by absorbance at 620 nm.
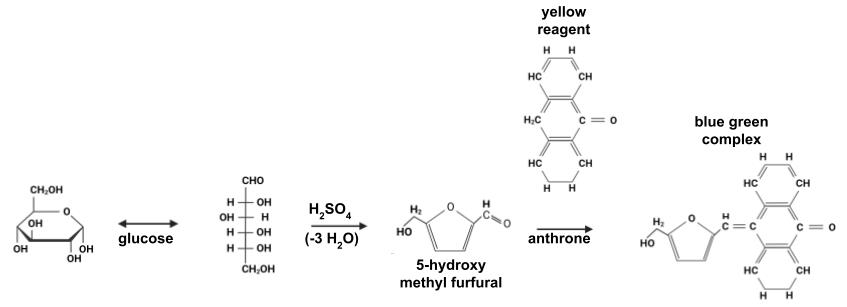
Figure 1. Reaction of the anthrone assay. Modified from Gerwig [14]. The extinction coefficient of the complex between 5-hydroxy methyl furfural and anthrone at 620 nm is 76,000 M-1·cm-1.
67% sulfuric acid solution (see Recipes)
Anthrone solution (72% sulfuric acid final concentration) (see Recipes)
10 mM glucose solution (see Recipes)
Recipes
67% sulfuric acid solution (10 mL)
Conduct the process under a fume hood and using personal protective equipment (gloves, lab coat, closed-toe shoes, and safety goggles). In a glass container, pour 3.3 mL of ddH2O. Place the container on ice and then slowly add 6.7 mL of sulfuric acid to prevent acid splashes upon contact with water.
Anthrone solution (100 mL)
Conduct the process under a fume hood and using personal protective equipment (gloves, lab coat, closed-toe shoes, and safety goggles). In a glass container, pour 28 mL of ddH2O. Place the container on ice and then slowly add 35 mL of sulfuric acid to prevent acid splashes upon contact with water, while stirring with a magnetic stir bar. Add 50 mg of anthrone and 1 g of thiourea. Complete with 37 mL of sulfuric acid. Leave to stir for 16 h in darkness.
10 mM Glc solution (10 mL)
Prepare by adding 18 mg of Glc to 10 mL of ddH2O.
Equipment
General lab supplies: microtubes, pipettes, tips, tube racks, etc.
Block heater (Thermolyne, model: Type 17600 Dri-Bath)
Bench-top vortex (Labnet, model: VX100)
Benchtop centrifuge for 2 mL tubes at room temperature and 4 °C (Thermo Scientific, model: Sorvall Legend Micro 21R)
Fume Hood (Esco, model: EFA-4UDRVW-8)
5 mL glass test tubes
Analytical balance (Sartorius, model: Entris2241-1S)
UV/VIS spectrometer (Shimadzu Corp., serial number A114548, 05789)
1 cm Pathlength quartz cuvettes; disposable or glass cuvettes can also be used
Gas mask (3M, model: 6899B, filters 3M 6003) for measuring samples with anthrone
Thermostatic water bath for laboratory (Daglef Patz, model: Hor, 18.3867)
Magnetic stirring bar and magnetic stirrer (Thermolyne, model: Nuova II)
Procedure
Fractionated carbohydrate extraction
Sample preparation
Use approximately 5–10 mg of dry and ground sample or equivalent of fresh sample. To calculate the amount of fresh biomass necessary to carry out the entire process, the pellet obtained from 1.5 mL of culture was placed in a pre-weighed microtube and centrifuged at 6,200× g for 10 min. After centrifugation, the supernatant was discarded, and the tube was weighed to calculate the fresh weight. Then, the pellet was dried at 60 °C and weighed until a constant weight was reached. The quantification was performed in triplicate, and the average was used to calculate the dry weight to fresh weight ratio and to determine the amount of fresh biomass equivalent to 10 mg of dry biomass. For a smaller sample size, reduce proportionally the volumes of extraction solvents; for example, if 1 mL of extraction volume is used for 10 mg of biomass, 200 μL would be used for 2 mg of biomass.
Resuspend the sample in 250 μL of dH2O.
For microalgae, freeze and thaw the sample three times to break the cells. For plant samples, cell disruption is performed by maceration or by grinding with nitrogen in the case of fresh biomass.
Notes:
Cell disruption by freeze and thaw: Once water is added to the biomass, place the suspension in the microtubes in a freezer at -20 °C for a few minutes until frozen. Then, thaw at room temperature, vortex, and repeat the process two more times.
The material can be macerated directly in the microtube using a Teflon tip.
Extraction of sugarsAdd 250 μL of 96% EtOH preheated in a water bath at 50 °C to extract sugars. Vortex for 30 s.
Centrifuge at 2,400× g for 10 min and keep the supernatant for sugar quantitation. Repeat step 1 three times (final volume of 1 mL).
Extraction of starchDry the pellet in a thermal block at 50 °C for 15 min to evaporate the EtOH.
Add 250 μL of dH2O, homogenize, and then add 250 μL of 60% HClO4. Vortex for 30 s.
Incubate on ice for 20 min to extract starch.
Centrifuge at 2,400× g for 10 min and keep the supernatant for starch quantification.
Add 250 μL of 60% HClO4, centrifuge (same as step 4), and keep the supernatant for starch quantitation. Repeat one more time (final extraction volume 1 mL).
Extraction of structural carbohydrates
Add 1 mL of dH2O to the pellet to rinse the HClO4. Vortex and centrifuge at 6,200× g for 10 min.
Add 500 μL of 67% H2SO4. Vortex for 30 s and let stand for 1 h. Vortex periodically three or four times during this period (since it is a thick suspension, it is very important to homogenize the sample well; otherwise, significant variation between replicates in the determination is observed).
Centrifuge at 16,200× g for 10 min and keep the supernatant for structural carbohydrates quantitation.
Note: Samples can be stored at -20 °C until quantitation.
Carbohydrate quantitation
Prepare a 1:10 dilution of the extracts (it is necessary to dilute the samples at least 1:5 to avoid interference of HClO4 with anthrone).
Take 200 μL of dilute extract and add 1 mL of anthrone reagent in a 10 mL glass tube. Vortex.
Boil for 15 min in a fume hood and cool to room temperature. Vortex.
Carefully, pour all the contents of the tube into a 1.5 mL cuvette.
Measure the absorbance at 620 nm.
Dispose of the sample in a container (do not pour it down the drain, as it must be discarded as hazardous waste), rinse the cuvette with distilled water, and clean the cuvette by removing the residual water through capillary action using vacuum before reading the next sample.
To prepare the standard curve, prepare samples containing from 50 to 400 nM Glc by adding 0, 5, 10, 20, and 40 μL of 10 mM Glc, and completing with dH2O to a final volume of 200 μL.
Note: Values for the total carbohydrates, starch, and structural carbohydrates fractions are expressed as polysaccharides, using a factor of 0.9 to convert the measured glucose value to polysaccharide [15].
Carbohydrates determination:
Calculate slope (α) and intercept (β) coefficients of the linear regression model (y = αx + β) from the calibration data as seen in Figure 2, and use these coefficients to calculate carbohydrate concentration in every sample and replicate according to the equation, where the y-axis represents the observed absorbance and the x-axis represents nanomoles of Glc.
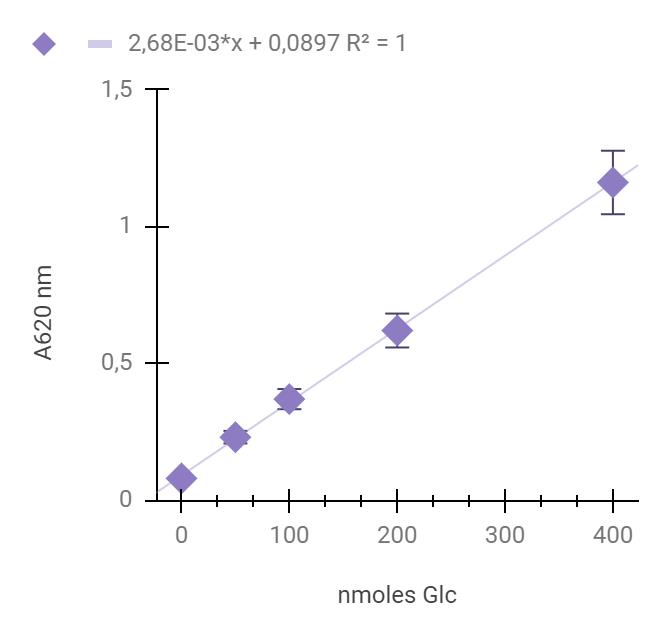
Figure 2. Representative calibration of D-glucose (dissolved in distilled water) mixed with anthrone reagent, measured at 620 nm according to this protocol. Each calibration point represents the average of four technical replicates; the error bars represent standard deviations. The line represents the linear fit of the measured points calculated by the least squares method. The linear regression equation (y = αx + β) represents calibration equation slope (α) and intercept (β). The R2 coefficient was calculated by the least squares method.Table 1 provides a generic example for performing calculations of the obtained carbohydrate quantities and extraction efficiency.
Table 1. Generic example for performing calculations of the obtained carbohydrate quantities and extraction efficiency of three methodological replicates
Sample Sample dilution A620 nm Mean abs 620 nm nmoles Glc μg Glc μg/μL Glc mg/mL * sample dilution *0.9(only in polysaccharides) Total substrate in the sample Carbohydrate percentage Replicate 1 10 (for example) y1 y1´ A6201= (y1+y1´)/2 z1= (A6201- β)/α X1=((z1*180)/1000) Value1=X1/200 r1=Value1*10 R1=r1*0.9 10 (for example)
%1=((R1*100)/10) Replicate 2 y2 y2´ A6202= (y2+y2´)/2 z2= (A6202- β)/α X2=((z2*180)/1000) Value2=X2/200 r2=Value2*10 R2=r2*0.9 %2=((R2*100)/10) Replicate 3 y3 y3´ A6203= (y3+y3´)/2 z3= (A6203- β)/α X3=((z3*180)/1000) Value3=X3/200 r3=Value3*10 R3=r3*0.9 %3=((R3*100)/10)
Validation of protocol
This protocol, or parts of it, has been used and validated in the following research articles:
Bader et al. [12]; Caló et al. [16]; and De Marco et al. [17].
Protocol validation on purified carbohydrates
The protocol was validated on purified substrates by conducting the complete process on 10 mg of sucrose, starch, or cellulose. Additionally, the complete process was carried out on two samples with different proportions of purified carbohydrates. One sample contained 10 mg of sucrose, 10 mg of starch, and 10 mg of cellulose, while the other contained 3, 5, and 2 mg, respectively. The latter ratio was used to approximate the values of each carbohydrate in biomass. For this validation, sucrose, starch, and cellulose were used to represent the fractions of simple sugars, starch, and structural carbohydrates, respectively. Subsequently, the carbohydrates present in each fraction were quantified using the anthrone method (Figure 3).
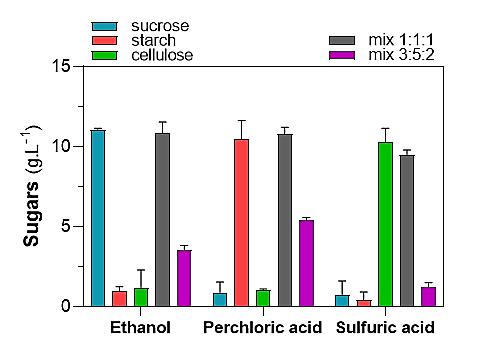
Figure 3. Validation of protocol on purified carbohydrates. 10 mg of sucrose, starch, cellulose, or 1:1:1 (total = 30 mg) or 3:5:2 (total = 10 mg) mixtures were subjected to the sequential fractionation of carbohydrates. Each fraction (1 mL) was used for sugar determination by the anthrone method. Each data represents the mean and SD of three technical replicates. In each case, the SD remained below 10% of the mean. Recovery was approximately 100%.
Protocol validation on biomass
In addition to validation on mixtures of purified carbohydrates, the protocol was validated by conducting the complete process on 10 mg of three different batches of biomass from the microalgae C. reinhardtii (strains CC125, cw15, and sta6), C. sorokiniana, and S. obliquus containing on average 40%, 39%, 6%, 53% and 50% of total carbohydrates, respectively. Additionally, the extraction process was carried out on 10 mg of A. thaliana biomass under both control growth conditions and saline stress containing 21% and 27% of total carbohydrates in the biomass, respectively. The total carbohydrates recovered after fractionated extraction (the sum of the three fractions) was 95% ± 10%; 92% ± 6%; 99% ± 27%; 94% ± 1%, and 89% ± 5% for C. reinhardtii strains CC125, cw15 and sta6, C. sorokiniana, and S. obliquus, respectively, in comparison to whole biomass carbohydrates determination by the anthrone method. For A. thaliana, the total carbohydrates recovered were 98% ± 3% and 93% ± 2% for the control treatment and the saline stress treatment, respectively (Figure 4).
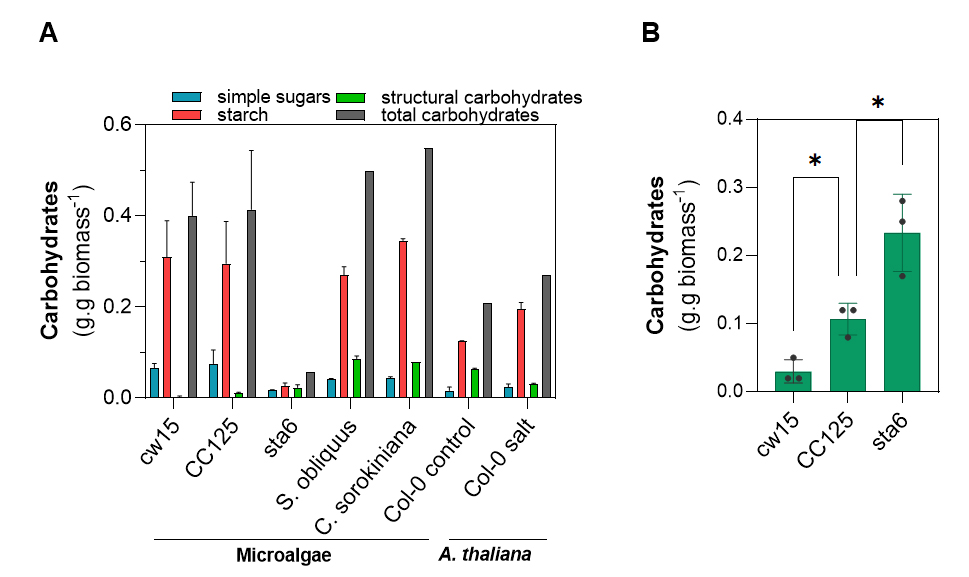
Figure 4. Validation of protocol on 10 mg of different microalgae and A. thaliana. A. Quantification of the different carbohydrates present in microalgal biomass and in A. thaliana. Samples of different microalgae and A. thaliana were subjected to the sequential extraction procedure. Strain sta6 of C. reinhardtii, which does not accumulate starch, was used as a negative control. Salt treatment is known to trigger sugars and starch accumulation in A. thaliana [18]. B. Recalcitrant carbohydrates present in the strains of C. reinhardtii. Each data represents the mean and SD of three biological replicates; statistical analysis was performed through one-way ANOVA (*, p ≤ 0.05). Recovery was typically 89%–99%.
For the validation of this protocol, three technical replicates of each sample were used. When quantifying carbohydrates with anthrone, each sample was measured in duplicate.
For the analysis of structural carbohydrates present in C. reinhardtii (Figure 4B), experimental data were statistically analyzed by one-way analysis of variance (ANOVA). Means and standard deviations were calculated and statistically examined using an analysis of variance and Dunnett’s multiple comparison test at p < 0.05.
C. reinhardtii mutant strains were particularly useful for validating this simple protocol. As expected, the most significant difference corresponded to a large decrease in the starch fraction in strain sta6 (Figure 4A). Additionally, although the cell wall of C. reinhardtii only contains a minor fraction of carbohydrates, clear differences were observed in this fraction. While the cell wall–deficient strain presented a level of carbohydrates approximately four-fold lower than the WT strain CC125, the sta6 mutant, which is impaired in starch biosynthesis, showed a level of carbohydrates approximately two-fold higher in this fraction (Figure 4B).
Fernandes et al. (2012) found very similar results for starch determination in C. vulgaris biomass by using extraction/hydrolysis by perchloric acid or amylolytic enzymes [19]. Another study conducted a more complex carbohydrate fractionation on C. vulgaris biomass. Sequential extraction with ethanol, di-ammonium oxalate (AmOx), NaOH (at two concentrations), and H2SO4 was followed by hydrolysis and sugars quantitation by HPLC. While starch was mainly recovered in the AmOx and diluted NaOH extractions, cell wall polysaccharides (likely chitin-like polymers and cellulose) were extracted/hydrolyzed by H2SO4 [20]. This protocol is recommended for an in-depth analysis of cell wall polysaccharides in microalgae. Despite differences in strains and culture conditions, carbohydrates partitioning, as determined by the method proposed here, aligns very well with these two reference studies, showing the relative abundance of carbohydrates in microalgae in the following order: starch, recalcitrant cell wall polysaccharides, and sugars.
Similarly, our protocol revealed similar induction levels of sugars and starch (approximately 50%) after salt stress in Thellungiella halophila, a plant closely related to A. thaliana. In that study, sugars were extracted in boiling water, and starch was extracted from the soluble fraction of 0.7 M perchloric acid, followed by precipitation with potassium perchlorate, and Glc determination using α-amylase and amyloglucosidase [21].
In summary, we propose a straightforward and reliable method that could be adapted for high-throughput screening to analyze carbohydrate partitioning in microalgae and plants.
Main advantages of the method
Efficiency and speed: Existing methods for carbohydrate partitioning can be time-consuming and labor-intensive. Thus, simplicity and the possibility of a high-throughput setting could significantly reduce the time and effort required for analysis. The method provides quicker results, especially when dealing with large sample sets.
Cost-effectiveness: Complex methods often involve expensive reagents, specialized equipment, and skilled personnel. Thus, this method could make carbohydrate analysis more accessible and cost-effective. Affordability could encourage broader adoption in research, quality control, and process optimization.
Wide applicability: The method was specifically optimized for determination from small samples of microalgae and A. thaliana seedlings, which are prime laboratory models in scientific and technological research that are frequently at the base of scientific and technological advances and breakthroughs.
General notes and troubleshooting
The viscosity of the acids makes it very important to vortex to achieve the desired results. In the case of cold starch extraction, it is important to adhere to incubation times and temperature to avoid extracting other carbohydrates belonging to the structural carbohydrate fraction.
Acknowledgments
Besides our own previous work, this protocol was modified from Waghmare et al. [2] and Updegraff [1].
This work was supported by grants from Agencia Nacional de Promoción Científica y Tecnológica (ANPCyT, PICT2018-3382, PICT2019-2118) to L.C., and Consejo Nacional de Investigaciones Científicas y Técnicas (CONICET PIP-11220200101701CO) and Universidad Nacional de Mar del Plata (UNMdP, EXA1051/21) to G.M.N. G.M.N, V.F.C. and L.C. are researchers at CONICET. A.N.B., L.S.R., A.D.M., and A.P.L. are Doctoral or Postdoctoral fellows at CONICET.
Competing interests
The authors declare no competing interests.
References
- Updegraff, D. M. (1969). Semimicro determination of cellulose inbiological materials. Anal Biochem. 32(3): 420–424.
- Waghmare, A. G., Salve, M. K., LeBlanc, J. G. and Arya, S. S. (2016). Concentration and characterization of microalgae proteins from Chlorella pyrenoidosa. Bioresour Bioprocess. 3(1): 16.
- Chen, C. Y., Zhao, X. Q., Yen, H. W., Ho, S. H., Cheng, C. L., Lee, D. J., Bai, F. W. and Chang, J. S. (2013). Microalgae-based carbohydrates for biofuel production. Biochem Eng J. 78: 1–10.
- Smith, A. M. and Zeeman, S. C. (2020). Starch: A Flexible, Adaptable Carbon Store Coupled to Plant Growth. Annu Rev Plant Biol. 71(1): 217–245.
- Pontis, H. G. (2016). Methods for analysis of carbohydrate metabolism in photosynthetic organisms. Plants, green algae and cyanobacteria. Academic press, Elsevier.
- Davies, D. R. and Plaskitt, A. (1971). Genetical and structural analyses of cell-wall formation in Chlamydomonas reinhardi. Genet Res. 17(1): 33–43.
- Zabawinski, C., Van Den Koornhuyse, N., D'Hulst, C., Schlichting, R., Giersch, C., Delrue, B., Lacroix, J. M., Preiss, J. and Ball, S. (2001). Starchless Mutants of Chlamydomonas reinhardtii Lack the Small Subunit of a Heterotetrameric ADP-Glucose Pyrophosphorylase. J Bacteriol. 183(3): 1069–1077.
- Baudelet, P. H., Ricochon, G., Linder, M. and Muniglia, L. (2017). A new insight into cell walls of Chlorophyta. Algal Res. 25: 333–371.
- Somerville, C., Bauer, S., Brininstool, G., Facette, M., Hamann, T., Milne, J., Osborne, E., Paredez, A., Persson, S., Raab, T., et al. (2004). Toward a Systems Approach to Understanding Plant Cell Walls. Science. 306(5705): 2206–2211.
- Ortiz-Marquez, J. C. F., Do Nascimento, M., Dublan, M. d. l. A. and Curatti, L. (2012). Association with an Ammonium-Excreting Bacterium Allows Diazotrophic Culture of Oil-Rich Eukaryotic Microalgae. Appl Environ Microbiol. 78(7): 2345–2352.
- Do Nascimento, M., Ortiz-Marquez, J. C. F., Sanchez-Rizza, L., Echarte, M. M. and Curatti, L. (2012). Bioprospecting for fast growing and biomass characterization of oleaginous microalgae from South–Eastern Buenos Aires, Argentina. Bioresour Technol. 125: 283–290.
- Bader, A. N., Sanchez Rizza, L., Consolo, V. F. and Curatti, L. (2020). Efficient saccharification of microalgal biomass by Trichoderma harzianum enzymes for the production of ethanol. Algal Res. 48: 101926.
- Dreywood, R. (1946). Qualitative Test for Carbohydrate Material. Ind Eng Chem Anal Ed. 18(8): 499–499.
- Gerwig, G. J. (2021). Detection of Carbohydrates by Colorimetric Methods. In: The art of carbohydrate analysis. Techniques in Life Science and Biomedicine for the non-expert. Springer, Cham.
- Englyst, K. N., Hudson, G. J. and Englyst, H. N. (2000). Starch Analysis in Food. In: Meyers, R. A. (Ed.). Encyclopedia of Analytical Chemistry: ea1029.
- Caló, G., De Marco, M. A., Salerno, G. L. and Martínez-Noël, G. M. A. (2022). TOR signaling in the green picoalga Ostreococcus tauri. Plant Sci. 323: 111390.
- De Marco, M. A., Curatti, L. and Martínez-Noël, G. M. A. (2024). High auxin disrupts expression of cell-cycle genes, arrests cell division and promotes accumulation of starch in Chlamydomonas reinhardtii. Algal Res. 78: 103419.
- Dong, S., Zhang, J. and Beckles, D. M. (2018). A pivotal role for starch in the reconfiguration of 14C-partitioning and allocation in Arabidopsis thaliana under short-term abiotic stress. Sci Rep. 8(1): 9314.
- Fernandes, B., Dragone, G., Abreu, A. P., Geada, P., Teixeira, J. and Vicente, A. (2011). Starch determination in Chlorella vulgaris—a comparison between acid and enzymatic methods. J Appl Phycol. 24(5): 1203–1208.
- Weber, S., Grande, P. M., Blank, L. M. and Klose, H. (2022). Insights into cell wall disintegration of Chlorella vulgaris. PLoS One. 17(1): e0262500.
- Wang, X., Chang, L., Wang, B., Wang, D., Li, P., Wang, L., Yi, X., Huang, Q., Peng, M., Guo, A., et al. (2013). Comparative Proteomics of Thellungiella halophila Leaves from Plants Subjected to Salinity Reveals the Importance of Chloroplastic Starch and Soluble Sugars in Halophyte Salt Tolerance. Mol Cell Proteomics. 12(8): 2174–2195.
Supplementary information
The following supporting information can be downloaded here:
- Supplementary information
Article Information
Publication history
Received: Jun 19, 2024
Accepted: Sep 26, 2024
Available online: Oct 16, 2024
Published: Dec 5, 2024
Copyright
© 2024 The Author(s); This is an open access article under the CC BY-NC license (https://creativecommons.org/licenses/by-nc/4.0/).
How to cite
Bader, A. N., Rizza, L. S., De Marco, M. A., Lando, A. P., Martínez-Noël, G. M. A., Consolo, V. F. and Curatti, L. (2024). A Simple, Rapid, and Cost-Effective Method for Assessing Carbohydrate Partitioning in Microalgae and Arabidopsis thaliana. Bio-protocol 14(23): e5121. DOI: 10.21769/BioProtoc.5121.
Category
Microbiology > Microbial biochemistry > Carbohydrate
Plant Science > Plant biochemistry > Carbohydrate
Biochemistry > Carbohydrate
Do you have any questions about this protocol?
Post your question to gather feedback from the community. We will also invite the authors of this article to respond.