- Protocols

- Articles and Issues
- For Authors
- About
- Become a Reviewer

PEPITA: Parallelized High-Throughput Quantification of Ototoxicity and Otoprotection in Zebrafish Larvae
Published: Vol 14, Iss 21, Nov 5, 2024 DOI: 10.21769/BioProtoc.5105 Views: 1865
Reviewed by: Ivonne SehringAlberto RissoneAnonymous reviewer(s)
Original research article
The authors used this protocol in:

Mar 2024
Advertisement


Protocol Collections
Comprehensive collections of detailed, peer-reviewed protocols focusing on specific topics


Abstract
Drug-induced hearing injury (ototoxicity) is a common, debilitating side effect of many antibiotic regimens that can be worsened by adverse drug interactions. Such adverse drug interactions are often not detected until after drugs are already on the market because of the difficulty of measuring all possible drug combinations. While in vivo mammalian assays to screen for ototoxic damage exist, they are currently time-consuming, costly, and limited in throughput, which limits their utility in assessing drug interaction outcomes. To facilitate more rapid quantification of ototoxicity and assessment of adverse drug interactions that impact ototoxicity, we have developed a high-throughput workflow we call parallelized evaluation of protection and injury for toxicity assessment (PEPITA). PEPITA uses zebrafish larvae to quantify ototoxic damage and protection. Previous work has shown that hair cells (HCs) in the zebrafish lateral line are very similar to human inner ear HCs, meaning zebrafish are a viable model to test drug-induced ototoxicity. In PEPITA, we expose zebrafish larvae to different combinations of drugs, fluorescently label the HCs, and subsequently use microscopy to quantify the brightness of the fluorescently labeled HCs as an assay for ototoxic damage and hair-cell viability. PEPITA is a reproducible, low-cost, technically accessible, and high-throughput assay. These advantages allow many experiments to be conducted in parallel, paving the way for systematic evaluation of drug-induced hearing injury and other multidrug interactions.
Key features
• Analysis of drug-induced hair cell damage associated with ototoxicity using Danio rerio
• Ototoxicity assessment performed in vivo
• Uses microscopy to generate images to assay ototoxicity quantitatively
• Enables testing of various combinations of drugs at various doses to determine toxicity-associated drug–drug interaction outcomes (synergy, antagonism)
Keywords: ZebrafishGraphical overview
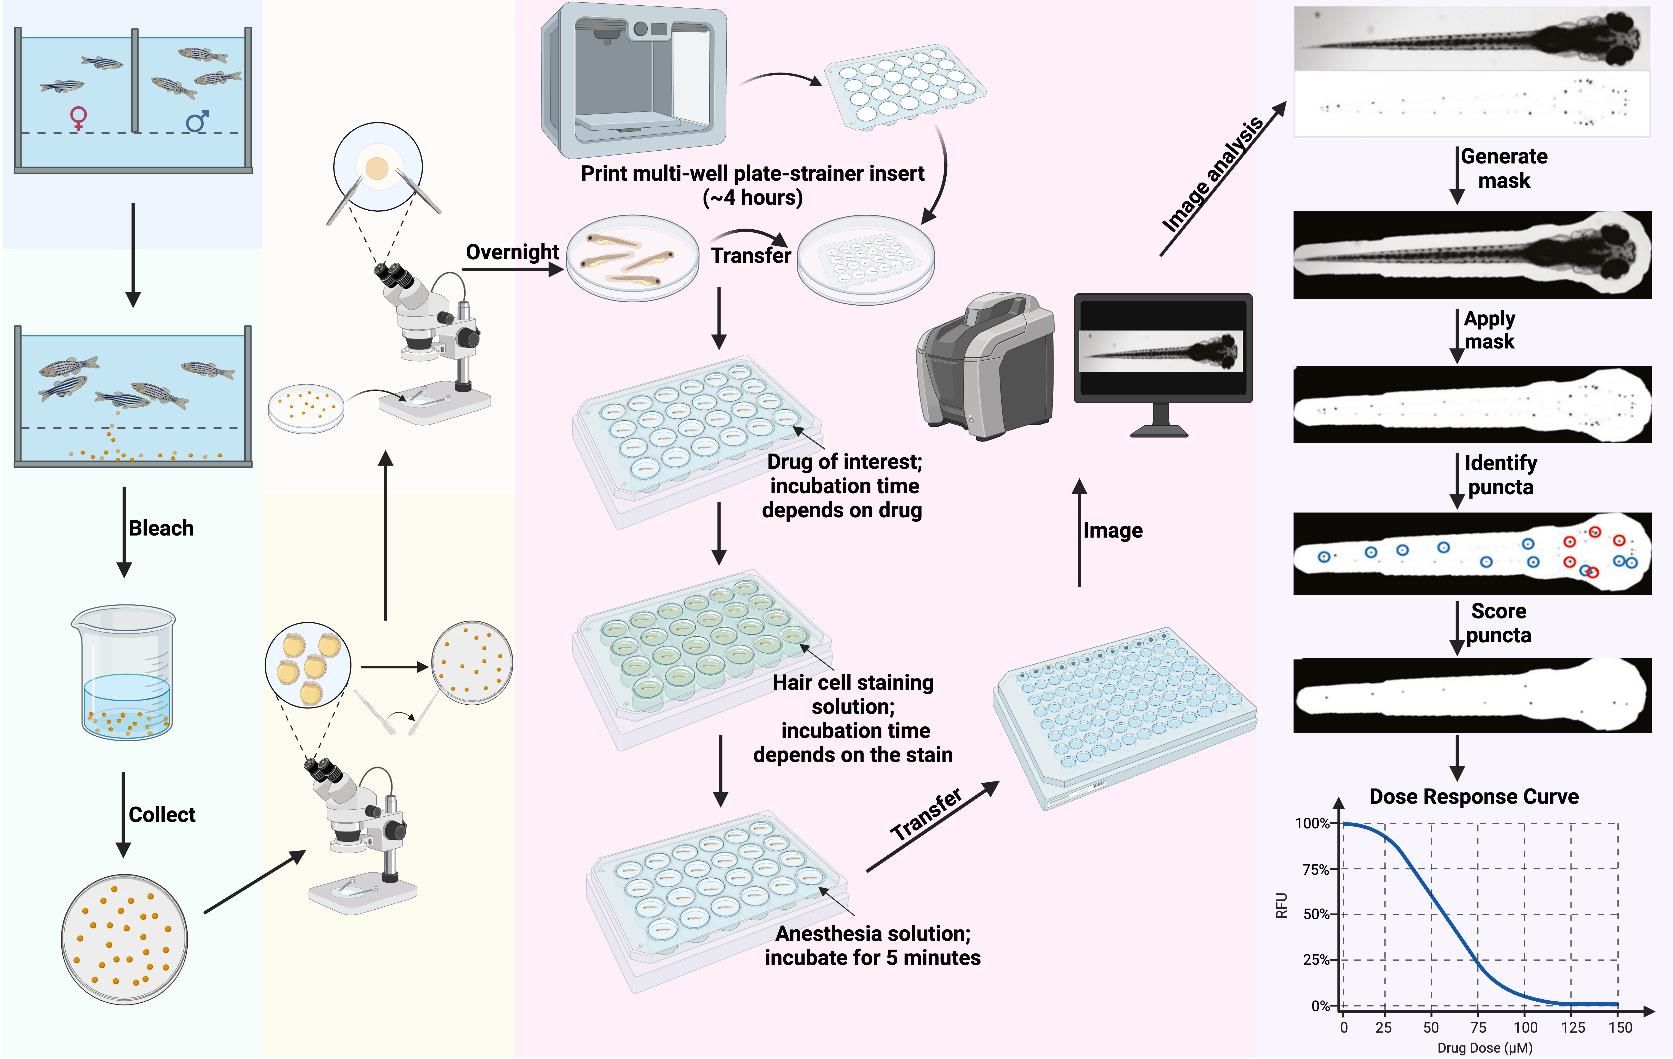
Overview of PEPITA workflow for fish handling. Day 1 (day before fertilization): Set up crossing and incubate overnight. Day 0 (day of fertilization): Execute crossing, bleach the collected embryos for 10 min, transfer embryos into Petri dishes, and incubate overnight. Day 1 (1 day post-fertilization (dpf)): Transfer viable embryos into new Petri dishes under a microscope and incubate overnight. Day 3–4 dpf: Dechorionate the larvae and incubate overnight. Day 5 dpf: Place a 3D-printed multi-well plate-strainer insert into a large Petri dish and transfer the larvae into each well of the insert. Transfer the larvae-containing insert to its respective drug treatment plate for the desired drug exposure time (this varies depending on the drug and the goal of the experiment; we have used treatment durations of 1 min to 24 h). Following this, transfer the inserts into a plate with hair cell staining solution and incubate (this varies depending on the type of stain; we have used staining durations of 1–20 min), then transfer them into a plate with anesthesia solution and incubate until larvae stop moving. Then, transfer the larvae to a 96-well imaging plate and image whole fish in brightfield and relevant fluorescence channels. Imaging time depends on the instrument and settings; our imaging workflow typically takes ~30 min to image a single 96-well plate. Data analysis: The PEPITA software package accepts brightfield (top) and fluorescence (bottom) images, creates and applies a mask to each fluorescence image to focus analysis on the fish. The package next identifies the top 15 brightest local maxima and creates a second mask around ten puncta (blue circles). Then, it applies the second mask and automatically scores each image according to the relative fluorescence intensity of the identified 10 puncta. Relative fluorescence intensities scored from drug-exposed fish can be compared quantitatively to untreated fish to calculate individual dose-response curves or pairwise drug interaction outcome reports. Figure generated in BioRender.
Background
Hearing loss is one of the most common chronic diseases, affecting approximately 30% of individuals aged 65–74 years old and 50% of individuals more than 75 years old (both hearing and balance disorders) [1]. Drug-induced injury to hearing and balance (ototoxicity) is a significant concern, with over 150 medications associated with ototoxicity [2]. Adverse drug–drug interactions (DDIs) pose a challenge in drug treatment, as interactions among medications can amplify the potential for hearing damage. New approaches for preclinical drug screening to assess ototoxicity and identify DDIs are needed for developing safer therapeutic options.
Zebrafish are a well-established vertebrate model for high-throughput profiling and studying ototoxicity. While their tissues and organs share many similarities with those of humans, zebrafish grow rapidly, produce hundreds of embryos per spawn, and are optically transparent as larvae, making them a powerful preclinical tool. Zebrafish have been utilized to assess drug toxicity in many organs and tissues, including cardiovascular, gastrointestinal, and mechanosensory systems [3]. Within the mechanosensory system, zebrafish possess the lateral line, which contains hair cells (HCs) that are homologous to the sensory HCs found in the inner ear of humans. Previous work has demonstrated that ototoxic drugs (e.g., aminoglycoside antibiotics and chemotherapeutics) induce similar HC damage and death in both zebrafish lateral lines and human inner ears [4,5]. Established lateral line damage quantification methods involve confocal microscopy of individual HC clusters (i.e., neuromasts) and manual HC counting. While these approaches provide subcellular resolution on damage phenotypes, they are effort-intensive and thus limited in the number of neuromasts, fish, and conditions that can be profiled per experiment. DDIs quantification would not be tractable with standard neuromast-centric characterization methods.
Here, we describe a high-throughput, semi-automated method for drug screening to assess ototoxicity in vivo using zebrafish, named parallelized evaluation of protection and injury for toxicity assessment (PEPITA). This method is tailored for large-scale drug screening and investigation of DDIs in zebrafish larvae. PEPITA enables efficient quantification of lateral line phenotypes using whole-fish fluorescence microscopy of hundreds of fish per day. Fish can be imaged in multi-well plates after being treated with multiple drugs and fluorescent dyes that report on the phenotype of stained HCs. For example, to measure HC viability, we have used the fluorescent stain oxazole yellow with propidium iodide (YO-PRO-1). Because YO-PRO-1 can only enter through HCs with functioning mechanotransduction channels, it gives a qualitative proxy for HC viability [6,7]. Alternatively, myo6b::gfp fish (transgenic fish that express GFP in their HCs) can be used in place of YO-PRO-1 stained fish as a more cost-effective option for assessing ototoxic damage that also enables longitudinal assessment. PEPITA also includes a software package for quantitatively analyzing images to study the dose-response and DDIs characteristics of individual and pairwise treatment conditions based on the neuromast-specific fluorescence intensity of chemical stains or transgenically expressed fluorescent proteins. Collectively, PEPITA enables semi-automated quantification of lateral line phenotypes measurable with fluorescence readouts. The workflow is amenable to simultaneous quantification of multiple fluorescence channels, and the underlying image analysis pipeline is amenable to adaptation for quantifying toxicity in other zebrafish organs and tissues with fluorescence-based assays.
Materials and reagents
Biological materials
AB strain zebrafish (Danio rerio) (Zebrafish International Resource Center, European Zebrafish Resource Center, China Zebrafish Resource Center)
Tg
; myo6b::gfp zebrafish [8]
Reagents
Note: Azithromycin and neomycin are listed as examples of antibiotics used, but any drugs of interest can be used here.
Azithromycin dihydrate (Thermo Fisher, catalog number: AAJ6674006) (store at 4 °C)
Neomycin sulfate hydrate (Thermo Fisher, catalog number: AAJ6149914)
Texas red-X succinimidyl ester (Thermo Fisher, catalog number: T20175) (store at –20 °C)
Tricaine (3-aminobenzoic acid ethyl ester, methanesulfonate salt) (Pentair, catalog number: TRS5)
YO-PRO-1 Iodide (Thermo Fisher, catalog number: Y3603) (store at –20 °C)
Instant Ocean (Spectrum Brands Product, catalog number: SS15-10)
Bleach (Clorox, catalog number: 30966)
Reverse osmosis (RO) filtered water
Antibiotic super-concentrated stock solution (see Recipes for neomycin example)
YO-PRO-1 stain solution (2 μM) (see Recipes)
Tricaine: stock solution (15 mM) (see Recipes)
Tricaine: euthanasia solution (1.35 mM) (see Recipes)
Tricaine: anesthesia solution (0.675 mM) (see Recipes)
ICS water (see Recipes)
Neomycin super-concentrated stock solution
Note: This is an example of an antibiotic solution. The super-concentrated stock solution concentrations and solvents used will vary between drugs. Store at -20 °C or -80 °C.
Reagent Final concentration Quantity or Volume Neomycin sulfate hydrate 200 mM 36 mg Molecular-grade water 200 μL Total 200 μL YO-PRO-1 solution (2 μM)
Note: The recipe is for one 12-well plate, using 3,500 μL of YO-PRO-1 solution per well. Adjust volumes as needed, depending on the size of the multi-well plate being used. Store at -20 °C.
Reagent Stock concentration Final concentration Quantity or Volume YO-PRO-1 Iodide 1 mM 2 μM 84 μL ICS water (Recipe 6) N/A 42 mL Total 42 mL Tricaine: stock solution (15 mM)
Reagent Stock concentration Final concentration Quantity or Volume Tricaine powder N/A 15 mM 400 mg Nano-pure water N/A 97.9 mL 1 M Tris or 1 M sodium bicarbonate 1 M 21 mM 2.1 mL HCl as needed to reach pH of ~7 Total ~100 mL Store at -20 °C.
Tricaine: euthanasia solution (1.35 mM)
Reagent Stock concentration Final concentration Quantity or Volume Tricaine: stock solution (Recipe 3) 15 mM 1.35 mM 4.5 mL ICS water (Recipe 6) N/A 45.5 mL Total 50 mL Tricaine: anesthesia solution (0.675 mM)
Note: The recipe is for one 12-well plate, using 3,500 μL of tricaine solution per well. Adjust volumes as needed, depending on the size of the multi-well plate being used.
Reagent Stock concentration Final concentration Quantity or Volume Tricaine: euthanasia solution (Recipe 4) 1.35 mM 0.675 mM 25 mL ICS water (Recipe 6) N/A 25 mL Total 50 mL ICS water
Note: Any type of “fish water” or embryo medium safe for use with zebrafish embryos and larvae can be used in place of ICS water. However, bear in mind that differing water composition may cause hair cell sensitivity to damage to vary.
Reagent Final concentration Quantity or Volume Instant Ocean 0.25 g/L 5.0 g Calcium chloride 0.05 g/L 1.0 g Sodium bicarbonate 0.07 g/L 1.3 g Reverse osmosis (RO) filtered water 20 L Total (optional) 20 L
Laboratory supplies
Note: Supplies indicated with an asterisk are brand-specific because the Tinkercad design for the multi-well plate-strainer inserts may not fit multi-well plates from other manufacturers.
Breeding tanks with dividers (Carolina Biological Supply, catalog number: 161937)
12-well plates, non-treated* (Corning Costar, catalog number: 07-201-589)
24-well plates, non-treated* (Corning Costar, catalog number: 07-201-590)
96-well plates, non-treated, black, flat-bottom, for imaging (Thermo Fisher, catalog number: 37000-550)
3D printer filament, PLA (Amazon, catalog number: B084XS2TS9)
Nylon mesh, 125 micron (ELKO Filtering Co., catalog number: 03-125/39)
Wide-bore Pasteur pipettes* (Fisherbrand, catalog number: 13-678-30)
Note: Wide-bore Pasteur pipettes are necessary because the embryos will not fit into standard Pasteur pipets.
100 μm cell strainers (Corning, catalog number: 07-201-432)
Petri dishes (100 mm × 15 mm) (Falcon, catalog number: 08-757-100D)
Large Petri dishes (150 mm × 15 mm) (VWR, catalog number: 25384-326)
Compressed air duster cleaner (Inovera, catalog number: IVR10012)
Fine-tipped tweezers (Dumont Tweezer, Style 5, catalog number: 0203-5-PO)
Equipment
All-in-one fluorescence microscope (Keyence, model: BZ-X710)
3D printer (Dremel, model: Digilab 3D45 3-D printer)
Hot plate (Fisher Scientific, Thermix Stirring Hot Plate, model: 210T)
Vortex mixer (VWR, catalog number: 10153-838)
Digital dry bath (BioRad, catalog number: 1160562)
Software and datasets
Tinkercad design for multi-well plate-strainer inserts (freely available at https://www.thingiverse.com/thing:5676024)
PEPITA-tools software package can be found on GitHub at https://github.com/ma-lab-cgidr/PEPITA-tools
ImageJ (version 1.54f, 06/29/2023)
Procedure
Multi-well plate strainer insert preparation
Note: Movie S1 shows how steps 4–11 of this procedure are executed.
3D-print the Tinkercad design for the appropriately sized multi-well plate strainer insert. We used the Dremel Digilab 3D45 3-D printer.
Set a hot plate to medium heat and let it heat up.
While heating, cut rectangles of nylon mesh, approximately 9 cm × 12 cm.
Fold a piece of aluminum foil over itself so that it forms a double-layer piece of foil that is slightly bigger than the nylon mesh pieces.
Once at temperature, place the double layer of aluminum foil on the hot plate. Place a rectangle of nylon mesh on top of the aluminum foil.
Immediately press the 3D-printed multi-well insert into the nylon mesh, applying enough pressure for the bottom of the insert to melt onto the nylon mesh (Figure 1a, b). Apply pressure for 3 s, then quickly press around the edge of each well to form a complete seal between the bottom of the 3D-printed insert and the nylon mesh (Figure 1c). Immediately remove the foil-nylon-insert contraption from the hot plate.
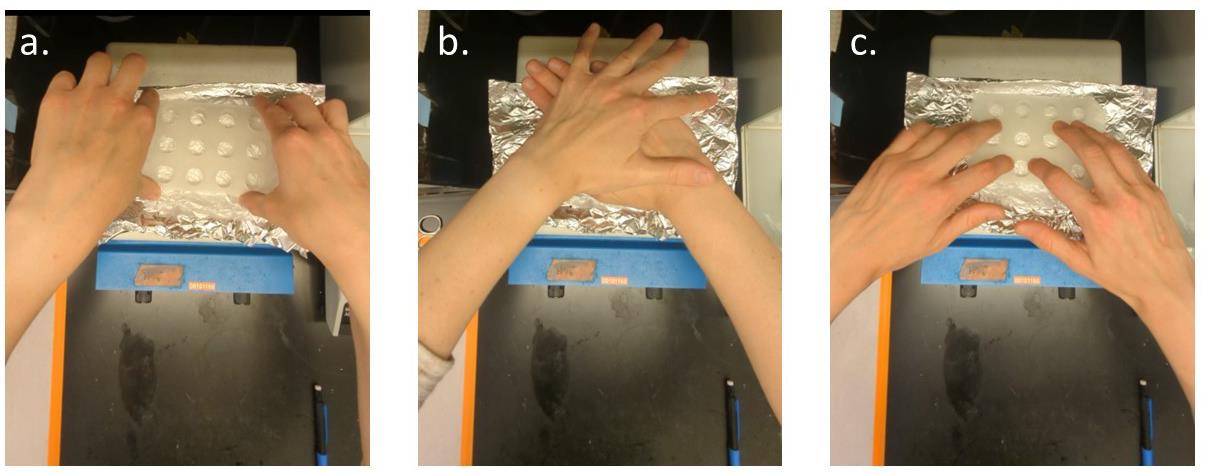
Figure 1. Procedure for adhering the nylon mesh to the 3D-printed multi-well plate insert. (A) Place the 3D-printed insert on top of nylon mesh and aluminum foil. (B) Firmly press the 3D-printed insert onto the mesh for 3 s. (C) Press around the perimeter of each well to form a complete seal around the base of the well with the nylon mesh.Once off the hot plate, immediately press the insert into the nylon mesh for 3 more seconds on the benchtop to further adhere the 3D-printed insert to the nylon mesh. Press around the edge of each well to further solidify the seal.
Gently peel off the foil from the insert.
Check to ensure the bottom of each well of the insert forms a complete seal with the nylon mesh. If necessary, repeat steps A6–8 several more times until this is achieved.
Note: When repeating steps A6–8, it may only be necessary to selectively apply pressure to just the wells of the insert with incomplete seals.
Once each well is completely sealed by nylon mesh, use small scissors to cut away the excess nylon mesh remaining between wells.
Feel around the bottom of each well to ensure that the seal with the mesh has not been compromised during the trimming process. It may also be helpful to gently poke the bottom of the well with the eraser end of a pencil to ensure the seal is intact.
If necessary, repeat steps A6–8 for the wells that need repair.
Prepare a container of 10% bleach solution and completely submerge the completed multi-well inserts in the bleach solution for at least 20 min and no longer than 24 h.
Prepare a container of distilled water. Transfer the multi-well inserts from the bleach solution to the distilled water and let soak for up to 24 h.
After soaking, remove the multi-well inserts from the distilled water and let air dry. Store in a clean plastic bag until ready to use.
Zebrafish embryo preparation
Day –1: Set up crosses (day before fertilization)
Select healthy zebrafish from a stock population and place into breeding tanks—females on one side of each tank and males on the other.
Day 0: Water change, execute crossing, collect embryos (day of fertilization)
When the tank room lights turn on, promptly refresh the water in the breeding tanks, remove the breeding dividers, and execute crossing. Observe fish until they start spawning, and clear, viable embryos are produced.
When spawning is complete, prepare a bleach solution in a beaker: 100 μL of bleach, 150 mL of ICS water (do this before straining eggs). Bleaching the eggs helps to remove mites and other potential biological contaminants from the water.
Recover all embryos from the tank by straining out embryos with a strainer. Rinse embryos into bleach solution using an ICS water squirt bottle. Add ICS water until the final volume of water is 170 mL.
Leave embryos in the bleach solution for 10 min. Swirl eggs intermittently.
After 10 min, strain the embryos in the bleach solution by pouring the bleach solution with embryos back through the strainer into the sink.
Rinse embryos in the strainer thoroughly with ICS water.
Partition embryos into Petri dishes. Aim for ~100 embryos per Petri dish (for enough dissolved oxygen and enough water to dilute nitrogenous waste being produced). Use as many Petri dishes as needed. Using a dissecting microscope, remove all unviable embryos (usually cloudy or malformed). Incubate overnight at 28.5 °C.
Day 1: Sort embryos (1 day post-fertilization, dpf)
Under a dissecting microscope, find all viable embryos and transfer them with a wide-bore Pasteur pipette into new Petri dishes with new ICS water. Aim for ~50 (no more than 60) embryos per Petri dish.
Place Petri dishes in an incubator overnight at 28.5 °C.
Day 3–4: Dechorionate (3–4 dpf)Note: By 4 dpf, most larvae will be hatched already and will not need to be manually dechorionated.
For larvae that have not yet emerged, remove their chorions using fine-tipped tweezers.
Note: While we use manual dechorionation, alternative methods that do not damage hair cells, such as enzymatic dechorionation, are also viable options and can be used for this purpose.
Place remaining larvae (in Petri dishes) in an incubator overnight at 28.5 °C.
Drug treatment and imaging (5 dpf)
Sanitize lab space with ethanol.
Prepare appropriate working concentrations of the drugs of interest. Transfer appropriate drug treatments into their respective wells in a multi-well plate. Label each plate.
Caution: Make sure to read the Safety Data Sheet for the given drug and follow appropriate PPE and disposal guidelines.
Make sure to check the solubility of the given drug in water before starting this. Some drug classes, like macrolides, are notoriously insoluble in water. So, having a baseline of solubility can help guide what doses to choose.
Pour larvae into a cell strainer and place in a Petri dish (100 mm × 15 mm) with ICS water.
Place the appropriate multi-well plate-strainer insert in a large Petri dish (150 mm × 15 mm) full of water. Transfer the appropriate number of larvae from the cell strainer into each well of the insert. (Maximum 100 larvae per 35 mL [9]; up to 11 larvae per well for a 12-well plate and up to 6 larvae per well for a 24-well plate.)
Look at the number of larvae needed for each well, and add n+1 (an extra) larva to each well to account for accidental pipetting damage (e.g., if 10 larvae are being exposed to a given treatment, add 11 larvae to that well).
Once each well of the insert has the appropriate number of larvae, transfer the larvae-containing insert into its respective drug treatment plate.
Incubate the larvae in the drug treatment for the desired drug exposure time.
While larvae are in drug treatment, warm the ICS water to 28 °C in an incubator and thaw the Tricaine stock.
One hour before the larvae come out of drug treatment, turn off lights and thaw YO-PRO-1 solution (YO-PRO-1 is light sensitive). Make sure the YO-PRO-1 stock is covered with foil while in storage and while using.
Note: If using myo6b::gfp, then skip this step (step C9), as well as steps C11–C12, C16–C17.
Prepare Tricaine: euthanasia solution (see Recipes) and Tricaine: anesthesia solution (see Recipes). Transfer Tricaine: anesthesia solution into each well of a new multi-well plate. Place the multi-well plate with Tricaine: anesthesia solution in a 28 °C incubator until the end of the drug treatment.
Use 3,500 μL per well for a 12-well plate and 1,800 μL per well for a 24-well plate.
Prepare YO-PRO-1 solution (see Recipes) in a glass bottle or 50 mL tube covered in foil.
Transfer YO-PRO-1 solution into each well of a new multi-well plate, cover with foil, and place in a 28 °C incubator until the end of drug treatment.
Use 3,500 µL per well for a 12-well plate and 1,800 μL per well for a 24-well plate.
Fill a tub (any type of water-proof receptacle that can hold > 50 mL of ICS water and with dimensions > 130 mm × 90 mm; a new large Petri dish > 130 mm in diameter can also be used here) with about 1 cm (no higher than the height of each multi-well strainer insert) of fresh ICS water for washing.
After the desired length of drug treatment, promptly remove the drug treatment plate from the incubator.
Dunk each multi-well strainer insert into the same ICS washing tub mentioned in step C13 three times to wash off residual drug treatment, ensuring that the larvae stay in their respective wells. (See Movie S2 for a video showing the transfer of a strainer insert between containers of solution to a reagent-containing multi-well plate. During experiments, each strainer will contain zebrafish larvae.)
Transfer the multi-well strainer inserts into the plate with YO-PRO-1 solution. Cover with foil and incubate for 20 min.
After 20 min, remove the insert from the YO-PRO-1 solution and dunk it into the ICS washing tub 3× to wash off residual YO-PRO-1 stain.
Transfer to the plate with Tricaine: anesthesia solution.
Wait about 5 min or until the larvae stop moving. Then, transfer larvae one by one to an untreated 96-well imaging plate using a P200 with a cut tip set at 75 μL.
Using a regular P200 tip, remove 32 μL of liquid from each well.
Image larvae using a fluorescence microscope with a robotics-assisted stage. For example, we use a Keyence model BZ-X710 microscope.
Use the compressed air duster to clean the bottom of the 96-well plate.
Select High Quality (14-bit) if using Keyence.
Set one point for each larva, making sure to focus on the head of each larva (focus near eye area when in plane, focus near ear area when out of plane).
Capture 2× images.
Note: Microscope settings should be optimized for each individual experiment to ensure capturing clear and well-focused images (refer to Figure 5B for an example). For imaging AB larvae on the Keyence, we use the following reference settings for three fluorescent channels: Brightfield: 1/7500s exposure; 50% light intensity; 80% aperture stop.
Note: PEPITA can effectively quantify lateral line phenotypes from images of larvae from a broad range of orientations. Variations associated with differences in positioning can be accounted for with the inclusion of sufficient replicate numbers to yield technically reproducible results.
After imaging, transfer extra larvae into empty wells of the imaging plate, then add about 200 μL of Tricaine euthanasia solution to each fish-containing well to euthanize.
After at least 10 min in Tricaine: euthanasia solution, put the plates in a 20 °C freezer for secondary euthanasia (please adhere to the specific guidelines outlined in your animal protocols for proper euthanasia, as approved practices may vary).
Data analysis
Image analysis and ototoxicity quantification are performed using the PEPITA software package, implemented in Python, which can be found on GitHub (https://github.com/ma-lab-cgidr/PEPITA-tools). This package contains two primary sets of scripts:
“pipeline.py” and related Python scripts: These scripts process fluorescence microscopy images to generate numeric values and plots, including image scores and dose-response curves. These scripts analyze fluorescence data through the following steps, illustrated in the Graphical Overview:
Accepts brightfield and fluorescence images as input.
Identifies and masks fish larvae in each image by contrast, size, and shape from the brightfield image to exclude noise present in the image away from the immediate proximity of the fish.
Adjusts for autofluorescence using a non-signal-containing channel.
Identifies the top 15 brightest local maxima within the masked region, discards the top 5 to exclude potential noise (e.g., small plastic artifacts that often appear as the brightest points), and creates a second mask around the other ten puncta.
Scores each image based on the sum of the pixel values of the masked image.
Standardizes the image scores based on experimental control condition(s) [negative control(s), e.g., untreated larvae and positive control(s), e.g., larvae treated with a dose of ototoxic drug known to elicit complete hair cell ablation] for each plate. These control conditions should be included in the design and setup of the drug dilution plates and imaging plates.
Fits dose-response curves for single treatments and/or interaction parameters for combination treatments.
ImageJ Macro scripts in ImageJ_scripts/: these can help with the creation of mask files, an optional step in the quantification workflow (see “Mask fish larvae” section below).
A comprehensive introduction to using this package is provided in “README” on GitHub. This method was also described in [10] (Section 2.3). The package was developed to be used as a command-line program or a Python library invoked either in a Notebook or in custom Python scripts. Below is a step-by-step protocol for data analysis using the PEPITA package both with the CLI locally and with a provided Notebook.
Package Installation
For command-line execution:
Clone the “PEPITA-tools” repository in GitHub.
Install Python if not already installed. Visit https://www.python.org/downloads/ for more information.
Ensure script dependencies are installed with requirements.txt. This can be done by running the following command: python -m pip install -r requirements.txt
For Notebook environment:
Note: Here is an example of PEPITA running in Notebook: https://colab.research.google.com/github/ma-lab-cgidr/zebrafish-quantification/blob/master/interactive_pipeline.ipynb. Users are encouraged to download and edit this notebook for ease of use.
Run the code under “Get GitHub repository” in the example notebook to download the latest zebrafish pipeline code from GitHub and print out the script version being used.
Run the following command to ensure all the dependencies listed in the requirement file are installed: !pip install -r /tmp/zebrafish-quantification-master/requirements.txt.
Import pipeline and all necessary packages to run the pipeline.
Getting relevant data
Change configurations: configure necessary settings to match the experiment being analyzed.
For command-line execution: set the log_dir setting in the config-ext.ini file.
i. A default configuration can be found at https://github.com/ma-lab-cgidr/PEPITA-tools/blob/master/config.ini. This file defines both the available configuration settings and their default values.
ii. Create a new config-ext.ini file in the repository directory if one does not yet exist. Set the desired values within it to override default values.
Note: Each configuration setting is explained under the “Configuration” section in “README.”
iii. Set this setting to a location where you have write privileges and where logging information can be conveniently written. If the supplied path does not exist, a new directory will be created.
For Notebook environment:
Edit the downloaded notebook under “Making Configuration Changes,” following the guidance provided in comments.
Prepare image data: Save the brightfield and fluorescent microscopy images in a location accessible to this script.
For command-line execution:
Create a folder locally containing all the images you want to analyze.
For Notebook environment:
i. Connect the Notebook to Google Drive.
ii. Create a folder containing all images that you want to analyze.
[optional] Mask fish larvae
Note: This should only be done if particular images need to be excluded or require custom masking. By default, the PEPITA-tools pipeline will analyze each brightfield image, identifying a fish larva and drawing a mask around it. If a pre-existing mask is provided, the pipeline will use it instead of generating a new one.
Custom masks are commonly necessary in any of the following situations:
i. Excluding an image where a larva is partly off the image or extremely out of plane, such that the object detection algorithm fails to identify it.
ii. Excluding non-lateral line portions of larvae if transgenic strains of zebrafish being used harbor fluorescence outside of the lateral line or if damaged tissues in larvae distal from the lateral line cause non-specific staining with vital dye. For example, we exclude the inner ear for myo6b::gfp strains expressing fluorophores in all HCs.
Using ImageJ macros is a feasible way to mask images. Some are provided in the GitHub repository under ImageJ_scripts/. For detailed information, please refer to the ImageJ section in “README.”
Prepare CSV plate template.
A plate template must be supplied to provide meaningful labels to the images being analyzed by the system. The pipeline will apply labels to images by matching them up in order from the top left to the right and then down.
An example template file is available at raw.githubusercontent.com/ma-lab-cgidr/zebrafish-quantification/master/examples/plate-layout.csv.
Run the pipeline
Run the analysis pipeline with appropriate runtime arguments, providing the package with experiment-specific data and context. Details on how to use these arguments can be found under the “Runtime arguments” section in “README.”
Validation of protocol
This protocol has been used and validated in the following research article:
Bustad et al. [10]. In vivo screening for toxicity-modulating drug interactions identifies antagonism that protects against ototoxicity in zebrafish. Front Pharmacol.
We have validated that the PEPITA workflow produces reproducible and reliable results for single-drug screening and drug interaction studies. Its robust performance ensures consistent outcomes, making it a valuable tool for high-throughput ototoxicity assessments and the investigation of adverse drug–drug interactions.
PEPITA enables the quantification of hundreds of individual fish per experiment. To evaluate the system’s ability to produce granular and reproducible results, we tested the viability of neomycin dose-response curves obtained by PEPITA. YO-PRO-1-fluorescently labeled AB fish and myo6b::gfp fish were treated with neomycin at concentrations ranging from 0 to 128 μM for 4 h, followed by imaging and quantification of relative residual brightness using PEPITA. Figure 2 shows the dose-response measurements of 27 YO-PRO-1-labeled AB fish experiments and 7 myo6b::gfp fish experiments, plotted with estimated log-logistic dose-responses (see Figure S1 for the experimental data plotted with experiment-specific dose-response curves). The 95% confidence intervals of the EC50 (drug dose that elicited 50% HC damage) estimated across each of the fish lines were within a 2-fold dose value (2.526–3.113 μM estimated from YO-PRO-1-stained AB fish and 9.0–19.4 μM estimated from myo6b::gfp fish; EC50 values were estimated from log-logistic curves fitted to the experimental data points). PEPITA enables approximately 80% power to detect 2-fold changes in HC damage with 10 biological replicates (fish) per condition, for experienced users.
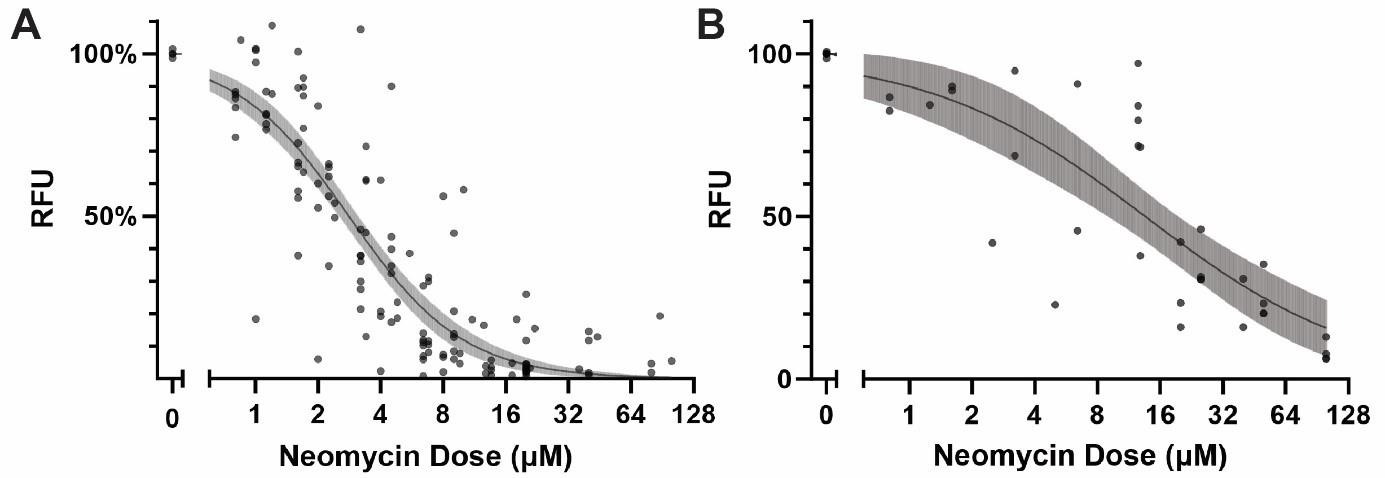
Figure 2.Overview of the variability in neomycin dose-response curves obtained by PEPITA. (A) YO-PRO-1-stained AB fish (27 experiments). (B) myo6b::gfp fish (7 experiments). Each point represents a different condition measured in a different experiment. The line and shaded area indicate the log-logistic curve and 95% confidence interval of the estimated dose-response.To validate the accuracy and reliability of PEPITA, we compared PEPITA’s ototoxic dose-response characterization with the gold-standard approach of counting HCs from individual neuromasts imaged by confocal microscopy. YO-PRO-1-fluorescently labeled AB fish and myo6b::gfp fish were treated with neomycin at concentrations ranging from 0 to 20 μM for 4 h. The neomycin dose response was then quantified using both PEPITA and the standard approach. The neomycin dose-response curve derived by PEPITA, based on relative fluorescence units (RFU), closely matched the estimates calculated by manual HC counting in both fish lines, yielding estimated EC50s that were within 2-fold in value (Figure 3, Figure S2).
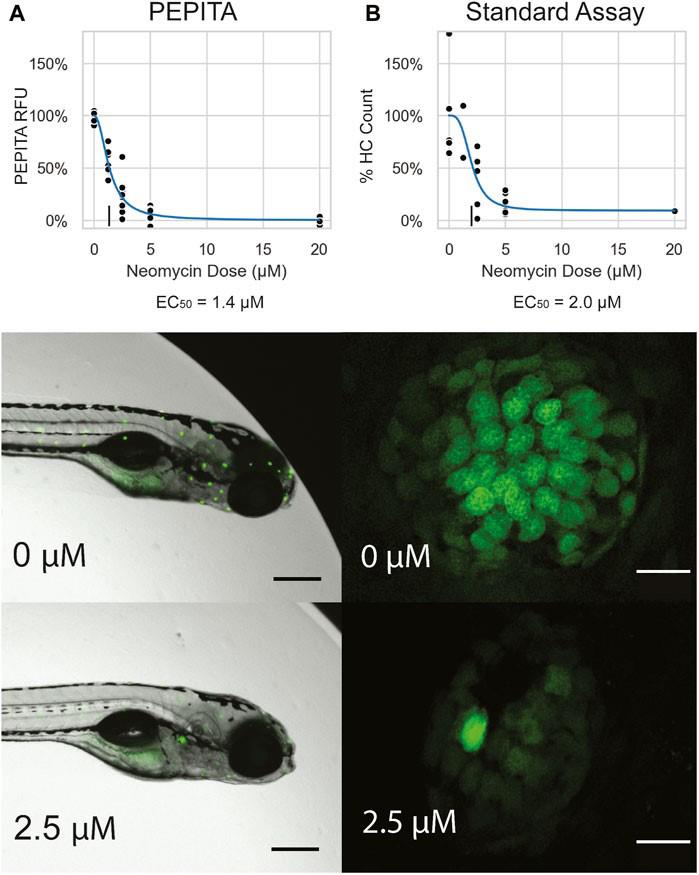
Figure 3. Neomycin dose response in YO-PRO-1-stained AB fish. (A) Top: Representative neomycin dose-response curve generated by PEPITA with relative fluorescence units (RFU) (EC50 = 1.4 μM). Middle and bottom: Representative image of a fish exposed to no drug (middle) and exposed to 2.5 μM neomycin (bottom), both used for PEPITA quantification. (B) Top: representative neomycin dose-response curve generated by standard approach of counting HCs from individual neuromasts (EC50 = 2.0 μM). Middle and bottom: Representative image of an individual neuromast from a fish exposed to no drug (middle) and exposed to 2.5 μM neomycin (bottom), used for HC counting. Note that PEPITA uses whole-fish images for quantification; images have been cropped for better visualization of the stained neuromasts. Scale bars: fish images = 300 μm; neuromast images = 10 μm.After confirming the reliability of single-drug dose response using PEPITA, we further validated the feasibility of investigating drug–drug interactions by screening ototoxic interactions with combinations of drug treatments. Four drug combinations with neomycin were examined and scored using PEPITA to assess the potential ototoxic drug interactions (Figure 4). Negative wEOB scores indicate antagonism between neomycin and the tested drugs. Benzamil showed antagonism with neomycin, which is consistent with its known role as a potent mechanoelectrical transduction channel inhibitor that inhibits neomycin uptake. Neomycin interactions with other aminoglycosides had wEOB scores close to zero, indicating additivity, which is consistent with the drugs of the same chemical class exhibiting shared modalities of HC damage.
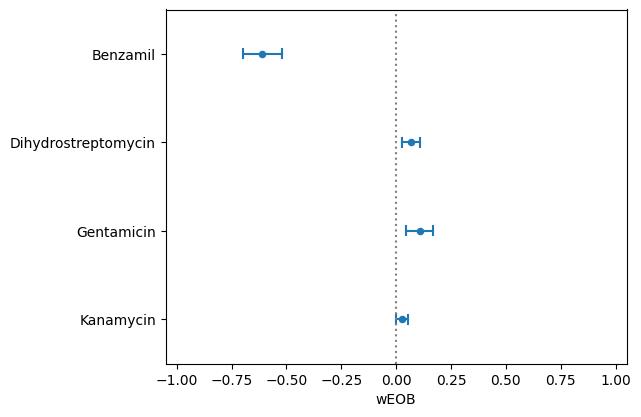
Figure 4. Drug interaction scores [represented as windowed excess over Bliss (wEOB), x-axis] between neomycin and other drugs screened for ototoxic drug interactions, indicated in y-axis. wEOB is calculated for each well exposed to both drugs using a similar equation as excess over bliss (EOB) metric [11], with the formula EOB = Ra × Rb -Rab, where Ra and Rb are the responses of the individual drug dose exposures, and Rab is the response of the combined drug dose exposure. Wells with expected and observed responses outside 10%–90% were excluded from the aggregated calculation of the score across dose combinations for a particular drug pair, and the remaining data were averaged to yield the composite wEOB interaction score, intended to represent the overall trend of interaction between two drugs across a range of dose combinations.
General notes and troubleshooting
General notes
Using transgenic fish
Users are encouraged to use transgenic fish in place of or in addition to wild-type counterparts. For example, the myo6b::gfp strain of zebrafish expresses GFP in their HCs and can be used to assess HC viability without YO-PRO-1 staining. If using myo6b::gfp zebrafish, the protocol is the same as for AB wild-type zebrafish, except that any steps involving YO-PRO-1 stain can be omitted (steps C9, C11–12, C16–17). The myo6b:: gfp fish embryos will also need to be screened for fluorophores between 1 and 4 dpf after the larvae begin expressing GFP. To execute fluorophore screening, inspect the embryos under a fluorescent microscope and remove any embryos that appear dim or do not fluoresce at all. It is worth noting that using cohorts of either purely homozygous or purely heterozygous larvae for experiments is recommended to reduce technical variance in fluorescence intensity.
It should also be noted that transgenic fish may have different drug tolerances than their wild-type counterparts, so doses may need to be adjusted accordingly [12]. In addition, transgenic fish may be less fecund than wild-type fish. To compensate for this, try any of the following techniques to increase fecundity: adding plastic plants to breeding tanks, elevating one end of the breeding tank to form a slope, setting up a single, large “group spawn” in a big tank, and outcrossing with wild-type fish. If none of these techniques increase fecundity, a large number of crosses should be set up to ensure that at least some eggs will be produced.
Using fluorescently conjugated drugs
Users are encouraged to use fluorescently labeled antibiotics or drugs to enable the use of PEPITA to quantify lateral line uptake of the drug. Fluorescently conjugated drug stock solutions should be prepared at the same molar concentrations as their non-fluorescing counterparts but should be kept in the dark because they are light-sensitive and will become photo-bleached if stored under direct light. Turn off the lights and cover any drug-containing aliquots, tubes, and plates with foil when working with fluorescently conjugated drugs. When imaging, capture the additional fluorescent channel that targets the conjugated fluorophore, in addition to the channel capturing the fluorophore to assay HC viability (e.g., the GFP channel, when using YO-PRO-1 or a GFP-expressing recombinant strain). For example, if using neomycin labeled with TexasRed, put a TexasRed filter cube in the microscope and add the TexasRed channel when imaging. Make sure the excitation and emission spectra of each assayed fluorophore are sufficiently non-overlapping to facilitate concurrent image capture.
Troubleshooting
Problem 1: Drug solubility.
Possible cause: Low solubility of certain drug classes in water (e.g., macrolides).
Solution: If the drugs are not going into solution and/or the working concentration is cloudy, try preparing the solution in a 5 mL centrifuge tube and vortexing vigorously. If this does not work, try adding heat via a dry bath. As a last resort, titrate nonpolar solvents, such as DMSO, into the working concentration until the drug goes into solution. However, it is important to note that DMSO concentrations above 1% can harm developing zebrafish larvae [13], so caution should be exercised.
Problem 2: “Halo” effect on the imaging plate.
Possible cause: Inappropriate volume of water in the well.
Solution: If the view of the larva is obscured due to a shadow around the inner ring of the well (see Figure 5A), double-check to make sure the 96-well imaging plates are non-treated. Using cell culture or tissue culture-treated plates will cause the water to pull more strongly against the sides of the well and produce a shadow over the top of the larva. If using non-treated plates and the issue persists, try adjusting the volume of water in the well. The protocol states to transfer the larva into the well with 75 μL of water, then remove 32 μL of water, resulting in a final volume of 43 μL. Try adjusting the final volume of water to be slightly more, perhaps around 50 μL. Be mindful of adding too much water, though, as this will increase the risk of larvae not resting flat at the bottom of the well. If the shadowing issue persists, try gently pushing excess droplets of water sticking to the sides of the wells to the bottom of the wells, being careful not to disturb the larvae. Gently tapping the plate two to three times on a benchtop can also help flush down excess water into the bottom of the wells. An example of an ideal larva-containing well is shown in Figure 5B.
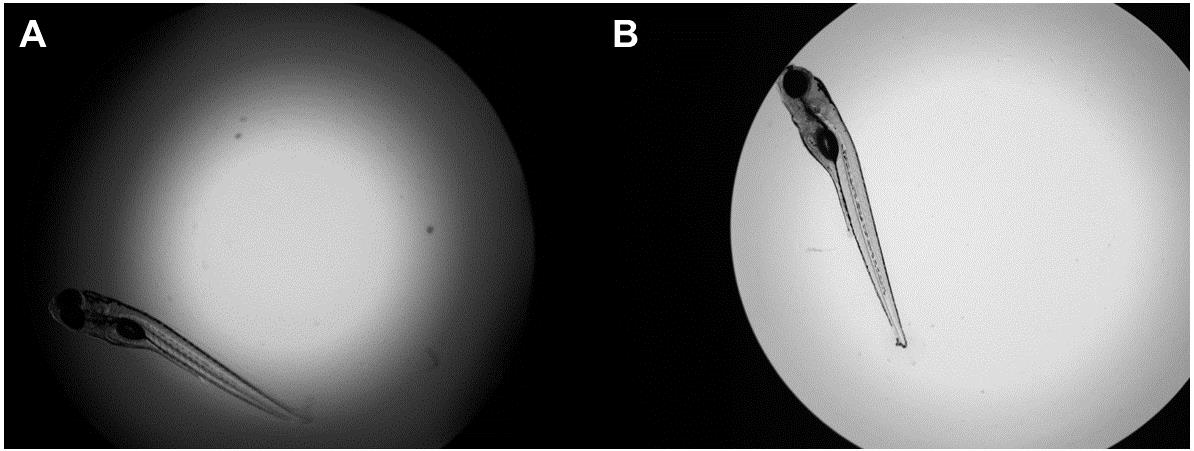
Figure 5. Example of improper and proper view of larvae in the 96-well imaging plate. (A) Halo ring effect obscuring view of larva. The volume of water in this well is inappropriate, resulting in a shadow cast toward the inside of the well that hinders the view of the fish. (B) Clear image of the zebrafish. Using an appropriate volume of water in the well results in a clear, unobstructed view of the larva.
Acknowledgments
The authors declare financial support was received for the research, authorship, and publication of this article. This study was supported by the National Institute of Health (Grant: R21 DC018341) and the Lura Cook Hull Trust. The original research paper in which this protocol was described and validated was published in Front. Pharmacol. (2024), DOI: 10.3389/fphar.2024.1363545. We gratefully acknowledge Mackenzie Phan, Natalie Gleason, Rina Yan, Patricia Wu, Andrea McQuate, and David Raible for their technical advice and assistance. The Graphical Overview Figure was generated in BioRender.com.
Competing interests
The authors declare that the research was conducted in the absence of any commercial or financial relationships that could be construed as a potential conflict of interest.
Ethical considerations
All animal work was approved by the Seattle Children’s Research Institute Institutional Animal Care and Use Committee (protocol number ACUC00658).
References
- Ries, P. W. (1994). Prevalence and characteristics of persons with hearing trouble: United States, 1990–91. Vital Health Stat. 10(188): 1–75. https://pubmed.ncbi.nlm.nih.gov/8165784/
- Lanvers-Kaminsky, C., Zehnhoff-Dinnesen, A. A., Parfitt, R. and Ciarimboli, G. (2017). Drug-induced ototoxicity: Mechanisms, Pharmacogenetics, and protective strategies. Clin Pharmacol Ther. 101(4): 491–500. https://doi.org/10.1002/cpt.603.
- Raldua, D. and Pina, B. (2014). In vivo zebrafish assays for analyzing drug toxicity. Expert Opin Drug Metab Toxicol. 10(5): 685–697. https://doi.org/10.1517/17425255.2014.896339.
- Ton, C. and Parng, C. (2005). The use of zebrafish for assessing ototoxic and otoprotective agents. Hear Res. 208(1–2): 79–88. https://doi.org/10.1016/j.heares.2005.05.005.
- Harris, J. A., Cheng, A. G., Cunningham, L. L., MacDonald, G., Raible, D. W. and Rubel, E. W. (2003). Neomycin-induced hair cell death and rapid regeneration in the lateral line of zebrafish (Danio rerio). J Assoc Res Otolaryngol. 4(2): 219–234. https://doi.org/10.1007/s10162-002-3022-x.
- Santos, F., MacDonald, G., Rubel, E. W. and Raible, D. W. (2006). Lateral line hair cell maturation is a determinant of aminoglycoside susceptibility in zebrafish (Danio rerio). Hear Res. 213(1–2): 25–33. https://doi.org/10.1016/j.heares.2005.12.009.
- Ou, H. C., Santos, F., Raible, D. W., Simon, J. A. and Rubel, E. W. (2010). Drug screening for hearing loss: using the zebrafish lateral line to screen for drugs that prevent and cause hearing loss. Drug Discov Today. 15(7–8): 265–271. https://doi.org/10.1016/j.drudis.2010.01.001.
- Hailey, D. W., Esterberg, R., Linbo, T. H., Rubel, E. W. and Raible, D. W. (2017). Fluorescent aminoglycosides reveal intracellular trafficking routes in mechanosensory hair cells. J Clin Invest. 127(2): 472–486. https://doi.org/10.1172/JCI85052.
- Aleström, P., D’Angelo, L., Midtlyng, P. J., Schorderet, D. F., Schulte-Merker, S., Sohm, F. and Warner, S. (2020). Zebrafish: Housing and husbandry recommendations. Laboratory Animals. 54(3): 213–224. https://doi.org/10.1177/0023677219869037.
- Bustad, E., Mudrock, E., Nilles, E. M., McQuate, A., Bergado, M., Gu, A., Galitan, L., Gleason, N., Ou, H. C., Raible, D. W., et al. (2024). In vivo screening for toxicity-modulating drug interactions identifies antagonism that protects against ototoxicity in zebrafish. Front Pharmacol. 15: 1363545. https://doi.org/10.3389/fphar.2024.1363545.
- Berenbaum, M. C. (1989). What is synergy? Pharmacol Rev. 41(2): 93–141. https://pubmed.ncbi.nlm.nih.gov/2692037/
- Monroe, J. D., Manning, D. P., Uribe, P. M., Bhandiwad, A., Sisneros, J. A., Smith, M. E. and Coffin, A. B. (2016). Hearing sensitivity differs between zebrafish lines used in auditory research. Hear Res. 341: 220–231. https://doi.org/10.1016/j.heares.2016.09.004.
- Hoyberghs, J., Bars, C., Ayuso, M., Van Ginneken, C., Foubert, K. and Van Cruchten, S. (2021). DMSO Concentrations up to 1% are Safe to be Used in the Zebrafish Embryo Developmental Toxicity Assay. Front Toxicol. 3: 804033. https://doi.org/10.3389/ftox.2021.804033.
Supplementary information
The following supporting information can be downloaded here:
- Movie S1: Multi-well strainer instruction video
- Movie S2: Plate transfer instruction video
- Figure S1: Dose response data measuring ototoxicity of neomycin across experiments
- Figure S2: Neomycin dose response in myo6b::gfp fish
Article Information
Publication history
Received: Jul 14, 2024
Accepted: Sep 13, 2024
Available online: Oct 12, 2024
Published: Nov 5, 2024
Copyright
© 2024 The Author(s); This is an open access article under the CC BY-NC license (https://creativecommons.org/licenses/by-nc/4.0/).
How to cite
Nilles, E. M., Bustad, E., Qin, M., Mudrock, E., Gu, A., Galitan, L., Ou, H. C., Hernandez, R. E. and Ma, S. (2024). PEPITA: Parallelized High-Throughput Quantification of Ototoxicity and Otoprotection in Zebrafish Larvae. Bio-protocol 14(21): e5105. DOI: 10.21769/BioProtoc.5105.
Category
Biological Sciences > Biological techniques
Drug Discovery
Cell Biology > Cell imaging > Live-cell imaging
Do you have any questions about this protocol?
Post your question to gather feedback from the community. We will also invite the authors of this article to respond.