- Protocols

- Articles and Issues
- For Authors
- About
- Become a Reviewer

Optimizing Transmembrane Protein Assemblies in Nanodiscs for Structural Studies: A Comprehensive Manual
(*contributed equally to this work) Published: Vol 14, Iss 21, Nov 5, 2024 DOI: 10.21769/BioProtoc.5099 Views: 3503
Reviewed by: Beatrice LiAnonymous reviewer(s)
Original research article
The authors used this protocol in:
Dec 2022

Protocol Collections
Comprehensive collections of detailed, peer-reviewed protocols focusing on specific topics


Related protocols
Abstract
Membrane protein structures offer a more accurate basis for understanding their functional correlates when derived from full-length proteins in their native lipid environment. Producing such samples has been a primary challenge in the field. Here, we present robust, step-by-step biochemical and biophysical protocols for generating monodisperse assemblies of full-length transmembrane proteins within lipidic environments. These protocols are particularly tailored for cases where the size and molecular weight of the proteins align closely with those of the lipid islands (nanodiscs). While designed for single-span bitopic membrane proteins, these protocols can be easily extended to proteins with multiple transmembrane domains. The insights presented have broad implications across diverse fields, including biophysics, structural biology, and cryogenic electron microscopy (cryo-EM) studies.
Key features
• Overview of the sample preparation steps from protein expression and purification and reconstitution of membrane proteins in nanodiscs, as well as biobeads and lipids preparation.
• Focus on single-span bitopic transmembrane proteins.
• Includes protocols for validation procedures via characterization using biochemical, biophysical, and computational techniques.
• Guide for cryogenic electron microscopy data acquisition from vitrification to image processing.
Keywords: NanodiscGraphical overview
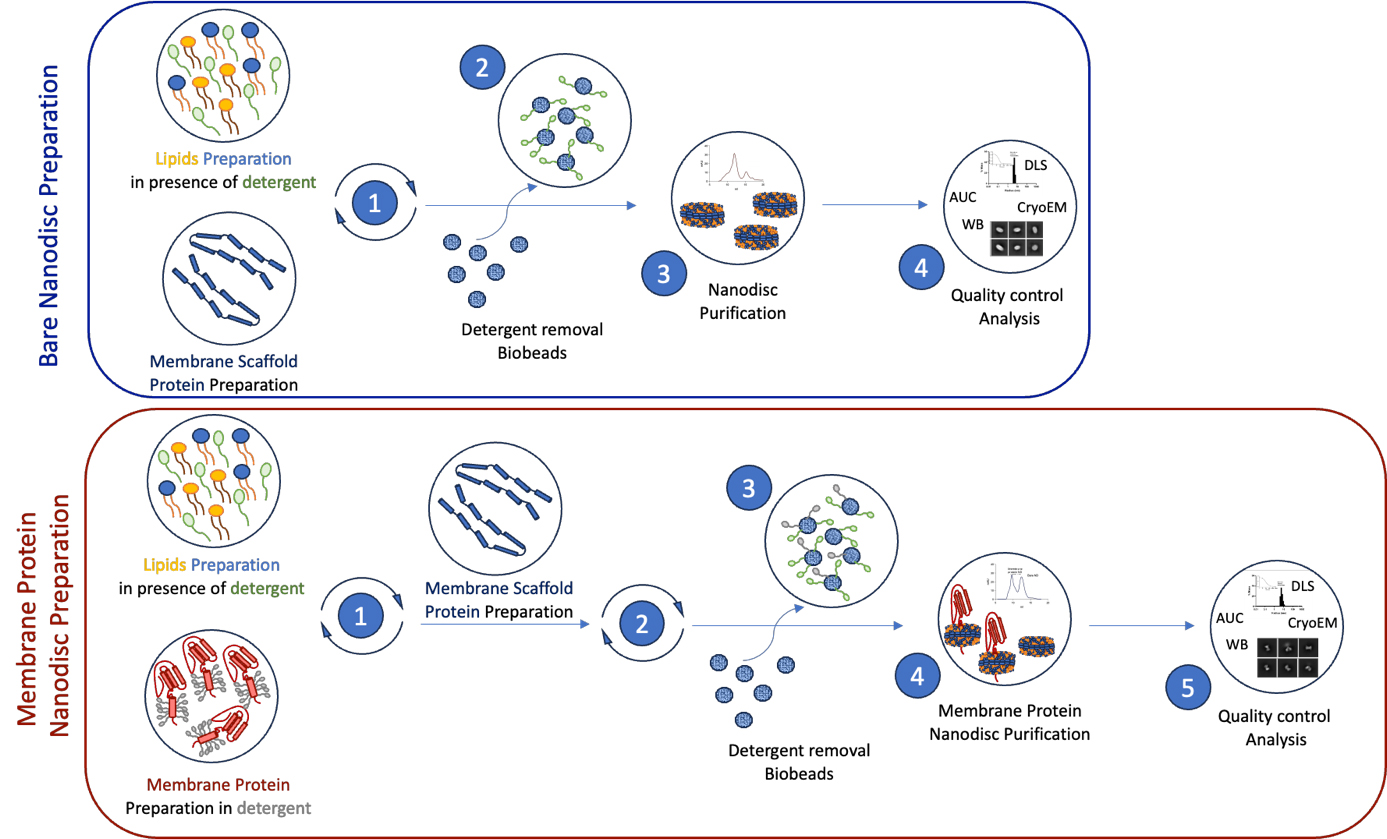
Schematic representation of the workflow for membrane protein reconstitution in nanodiscs. The upper blue box illustrates the key steps involved in preparing bare nanodiscs from lipid and membrane scaffold protein preparations (1), removal of detergent (2), and purification of nanodiscs (3). The quality of the samples is verified through various biochemical and imaging approaches (4). The lower red box outlines the step-by-step membrane protein-nanodiscs reconstitution process. Detergent-solubilized and purified membrane protein samples are mixed with the chosen lipid sample (1), followed by the addition of membrane scaffold proteins (2). Dialysis in the presence of bio-beads allows for detergent removal (3), leading to the reconstitution of membrane protein-nanodiscs complexes, followed by size exclusion chromatography purification (4). Finally, we present various biophysical and screening methods to assess the quality and homogeneity of the samples before structural analysis (5).
Background
Transmembrane proteins play a pivotal role in the interactions of cells with their environment. Their significance in pharmacology is underscored by their targeting over 50% of available drugs [1]. A more profound comprehension of the structure and function of these proteins can greatly enhance our understanding of disease development and the creation of effective medications. However, exploring the structure of membrane proteins poses a significant challenge due to the hydrophobic nature of their transmembrane domains, which play crucial functional roles. A comprehensive study necessitates examining these proteins in their entirety, including their transmembrane domains, within stable lipid environments close to their native conditions in the cell. Meeting these prerequisites calls for the development of specialized biochemical tools tailored for the study of transmembrane proteins.
One such tool is the nanodisc (ND), a nanoscale disc-shaped lipid bilayer encircled by a belt formed by two membrane scaffold proteins (MSPs). Nanodiscs provide numerous advantages compared to traditional solubilization methods, including enhanced stability, uniformity, and the ability to explore membrane proteins in their native lipid environment. Since the pioneering work of Sligar and colleagues, MSPs have revolutionized various fields including structural biology and biophysics [2–6]. MSP nanodiscs maintain the solubilization of full-length transmembrane proteins, preventing detergent-induced denaturation. When the size and molecular weight (MW) of the transmembrane protein significantly exceed that of the NDs or when the transmembrane domain size approaches that of the nanodisc and displaces a large fraction of the lipids, the system serves as a potent tool for structural biology investigations. For example, NDs have been instrumental in exploring the structure and function of membrane proteins such as G protein–coupled receptors, ion channels, and transporters [7–9]. However, this scenario changes when the NDs and the transmembrane protein share a similar MW range and the transmembrane displaces only a small fraction of the nanodisc lipids, for example, single-spanning membrane receptors such as integrin. Under the premises where the nanodiscs make a substantial contribution to the overall structural analysis, imperfections in the nanodisc preparations directly translate into lower resolution in cryo-EM structural studies.
Here, we detail comprehensive and reliable biochemical and biophysical protocols that enable the structural examination of transmembrane proteins, particularly when their size and MW are similar to the nanodiscs, and they occupy only a small fraction of the nanodisc. Our focus is a thorough manual for researchers concerning the use of MSPs and MSP-based NDs in the structural and biophysical examination of single-pass alpha-helix transmembrane proteins, often referred to as bitopic transmembrane proteins. While this publication is tailored for bitopic transmembrane proteins, the principles outlined can be applied to the study of proteins with multiple transmembrane domains.
Materials and reagents
Biological materials
E. coli BL21(DE3) chemically competent cells (Sigma-Aldrich, catalog number: CMC0014)
Expression vectors of membrane scaffold proteins (MSP) from Addgene: MSP1D1 (Addgene, catalog number: 20061), MSP1E3D1 (Addgene, catalog number: 20066), and MSP2N2 (Addgene, catalog number: 29520) for 9, 12, and 15 nm nanodiscs, respectively
Purified and monodisperse target membrane protein of your interest. Here, we use ACE2 protein as an example of single-pass transmembrane protein, which was purified in 50 mM HEPES pH 8, 250 mM NaCl, 0.5% DDM, and 2.5 mM desthiobiotin (adapted from Yan et al. [10])
Reagents
POPC lipids in chloroform, 25 mg/mL (Avanti Polar Lipids, catalog number: 850457C)
2× YT medium (Sigma-Aldrich, catalog number: Y2377)
94 mm Petri dish (Grenier Bio-One, catalog number: 633180) containing 20 mL of LB agar media
Kanamycin at 50 µg/mL for selecting bacteria carrying vectors of MSPs (Sigma-Aldrich, catalog number: K0254)
Trizma base (purity ≥ 99.7%) (Sigma-Aldrich, catalog number: 93350)
Hydrochloric acid 37% vol/vol (HCl) (Sigma-Aldrich, catalog number: 258148)
Sodium chloride (NaCl); purity ≥ 99% (Sigma-Aldrich, catalog number: 793566)
Ethylenediaminetetraacetic acid (EDTA) (Sigma-Aldrich, catalog number: 03677)
Imidazole (purity ≥ 99.5%) (Sigma-Aldrich, catalog number: 56750)
Ethanol absolute (99.8% analytical reagent grade) (Fisher Chemical, catalog number: E/0650DF/15)
CAUTION: Ethanol is harmful if swallowed, inhaled, or by skin absorption. Wear appropriate protective glasses, gloves, and lab coat. Handle under a chemical hood.
MilliQ H2O
Buffer components required by the target membrane protein of your interest
Methanol (Sigma-Aldrich, catalog number: 322415)
CAUTION: Methanol is toxic if swallowed, inhaled, or in contact with skin. Wear appropriate protective glasses, gloves, and lab coat. Handle under a chemical hood.
Chloroform (99.5%) (Sigma-Aldrich, catalog number: C2432)
CAUTION: Chloroform is toxic if swallowed or inhaled. Always wear googles, gloves, and lab coat. Carry operations under a chemical hood.
Sodium cholate (NaCholate) (Sigma-Aldrich, catalog number: C6445)
Triton X-100 (Sigma-Aldrich, catalog number: T9284)
PMSF (Roche, catalog number: 10837091001)
Anti-proteases cocktail (Roche, catalog number: 11836170001)
Benzonase® (Sigma-Aldrich, catalog number: 1016970001)
Lysozyme (Sigma-Aldrich, catalog number: 1052810500)
Isopropyl b-D-1-thiogalactopyranoside (IPTG) (Sigma-Aldrich, catalog number: I6758)
Bio-Beads SM-2 adsorbents (Bio-Rad, catalog number: 1528920)
Antibody for His-tag detection (Thermo Scientific, catalog number: 15547466)
4–15% Mini-PROTEAN® TGXTM precast protein gels (Bio-Rad, catalog number: 4561086)
Liquid nitrogen (pure from Air Liquide ALPHAGAZ)
CAUTION: Liquid nitrogen can cause severe burns. Always wear required personal safety equipment such as safety glasses, lab coat, and insulated gloves when handling.
Nitrogen (N2) gas (purity ≥ 99,999%) (Air Liquide ALPHAGAZ)
Ethane gas (pure from Air Liquide ALPHAGAZ)
CAUTION: Ethane gas is extremely flammable. Store in tightly closed containers in a cool, well-ventilated area.
Solutions
Lipid solubilization buffer (see Recipes)
Size exclusion chromatography buffer (see Recipes)
Lysis buffer (see Recipes)
MSP wash buffer (see Recipes)
Elution buffer (see Recipes)
Recipes
Lipid solubilization buffer
Reagent Final concentration Quantity or Volume Trizma pH 7.4 20 mM 1.21 g NaCl 100 mM 2.92 g EDTA pH 7.4 0.5 mM 93.06 mg NaCholate 70 mM 15.07 g H2O n/a Final volume to 500 mL Note: Small increments of HCl are used to bring the solution to pH 7.4.
Size exclusion chromatography buffer
Reagent Final concentration Quantity or Volume Trizma pH 7.4 20 mM 1.21 g NaCl 100 mM 2.92 g EDTA pH 7.4 0.5 mM 93.06 mg H2O n/a Final volume to 500 mL Note: Small increments of HCl are used to bring the solution to pH 7.4.
Lysis buffer
Reagent Final concentration Quantity or Volume Trizma pH 8.0 50 mM 454.28 mg NaCl 300 mM 1.31 g Triton X-100 1% 750 µL PMSF 1 mM 13.06 mg Tablet anti-protease cocktail 1 tablet Benzonase® 250 unit 1 µL Lysozyme 0.7 mg per mL of lysis buffer 52.5 mg H2O n/a Final volume to 75 mL per L of E. coli culture Note: Small increments of HCl are used to bring the solution to pH 8.0. Initially, a larger volume of solution containing only Trizma, NaCl, and Triton X-100 can be made. On the day of the experiment, use 75 mL of this solution and supplement with PMSF, anti-protease cocktail, benzonase, and lysozyme to perform bacterial lysis.
MSP wash buffer
Reagent Final concentration Quantity or Volume Trizma pH 8.0 50 mM 3.03 g NaCl 300 mM 8.77 g H2O n/a Final volume to 500 mL Note: Small increments of HCl are used to bring the solution to pH 8.0.
Elution buffer
Reagent Final concentration Quantity or Volume Trizma pH 8.0 50 mM 3.03 g NaCl 300 mM 8.77 g Imidazole 500 mM 17.02 g H2O n/a Final volume to 500 mL Note: Small increments of HCl are used to bring the solution to pH 8.0.
Laboratory supplies
Cryo-EM grids such as Quantifoil 1.2/1.3 400 mesh copper (Quantifoil, catalog number: N1-C14nCu40-01)
Filter paper for VitroBot (Grade 595, 50 mm, AA00420S) (Fisher Scientific, catalog number: 09-924-170)
Hamilton syringe 500 Ul (Merck, catalog number: 24523)
Spectra/Por 3 dialysis tubing, 3.5 kD MWCO (Repligen, catalog number: 13272)
Costar® Spin-X® centrifuge tube filters, 0.22 µm pore CA membrane, nonsterile, 100/case (Corning, catalog number: 8161)
Parafilm (Bemis, catalog number: PM996)
10 mL glass tubes (Kimble Chase, catalog number: A407511500611)
His-trap column 5 mL affinity chromatography (Cytiva, catalog number: 17524802 or similar)
Size-exclusion Superdex 200 increase 24 mL chromatography column (Cytiva, catalog number: 28990944 or similar)
Amicon concentrators cutoff 50 kDa (Millipore, catalog number: UFC505096)
InstantBlue® Coomassie protein stain (Abcam, catalog number: ab119211)
Storage dewar for EM grids (Worthington LD Series Liquid Nitrogen Dewars, catalog number: F9143-1EA)
Laboratory glassware and plasticware for preparation, storage, and handling of reagents and samples
NalgeneTM single-use PETG Erlenmeyer flasks with baffled bottom 2 L (Nalgene, catalog number: 4113-2000)
PES (Polyethersulfone) syringe filters (Thermo Scientific, catalog number: CH2213-PES)
Micropipette tips and plastic pipettes cut at about 1/3 from the tip to be used when manipulating Bio-Beads
Equipment
Spectrophotometer NanoDrop (Thermo Scientific, or similar) for OD600 bacterial density and absorbance at 280 (A280) protein concentration measurements
Incubator with temperature control for Erlenmeyer flasks
Rotator TR Series TR-200 (Stuart/Cole-Palmer, model: TR-200)
Mini-PROTEAN Tetra Vertical electrophoresis cell (Bio-Rad, catalog number: 1658004)
Batch sonicator (Fisher Scientific, catalog number: FB15046)
pH meter (Thermo Scientific, catalog number: STARA1115) and calibration reagents (Thermo Scientific, catalog number: 910199)
Dry bath with temperature control such as Eppendorf ThermoMixer F2.0 (Eppendorf, catalog number: 5387000013)
FPLC Equipment, Akta System (Cytiva) or similar
Western blot device iBind and accessories (Thermo Scientific, catalog number: SLF2000)
Imaging system for SDS-Page and western blot (Bio-Rad, model: Gel DocTM EZ System)
Lab bench centrifugation equipment such as Eppendorf centrifuge 5424 R (Eppendorf, model: 5424 R)
Bench microcentrifuge such as Scientific D1008 Palm microcentrifuge (DLAB, catalog number: 9031001012)
Sample storage equipment at -80 °C, -20 °C, and 4 °C
Chemical hood
VitroBot Mark IV (or similar) (Thermo Scientific)
Software and datasets
Chromatography Akta software: Unicorn 6.3 or later version, Cytiva
Imaging software for western blot and SDS page: Image Lab 6.0 or later version, Bio-Rad
DLS software: DYNAMICS software 7.9 or later version, Waters
Data Acquisition software for single particle analysis: EPU 3.3.0.5176REL or later SerialEM 3 or higher version
Data analysis software for single particle analysis: CryoSPARC version 4.3.0 or higher, Relion 4 or equivalent
Procedure
Our protocol describes the reconstitution of single-span, bitopic transmembrane proteins, although it can easily be extended to proteins with multiple transmembrane domains. We begin by outlining the sample preparation steps required before reconstituting nanodisc samples. These steps can be completed several days to weeks in advance. We provide a detailed description of each step, along with essential precautions to ensure success. Finally, we present various methods to evaluate the quality and homogeneity of the samples before structural analysis.
Lipids preparation for reconstituting nanodiscs assemblies
Prepare a 10 mL glass tube by washing it with H2O MilliQ and ethanol at least three times each step, then dry it with N2 gas.
Add 2 mL of chloroform to the tube and rotate it so the inside walls can be washed. Discard all chloroform. Dry the tube with N2 gas stream.
Use a glass syringe of 500 µL and wash it using the same procedure as for the glass tube.
Gently transfer 500 µL of the POPC lipids chloroform stock (25 mg/mL) to the prepared glass tube (on the bottom of the tube, without touching the walls) using the syringe.
Close the glass tube with parafilm.
Add a gentle stream of N2 gas inside the commercial vial to protect the lipids stock from oxidation. Seal the vial and store it at -20 °C.
Dry the POPC lipids with a gentle stream of N2 gas (10–15 min).
Remove residual chloroform by desiccation under vacuum for at least 2 h. The lipids will form a film at the bottom of the glass tube.
Resolubilize the lipids in 500 µL of lipid solubilization buffer to obtain a solution of POPC at 32.9 mM concentration (Note 2).
Perform a gentle agitation (max. 100 rpm) for 5–10 min until all lipids are well resuspended.
Pursue the lipids resuspension by bath sonicating using a power of 37 kHz and cycles of 1 min of the bottom of the glass tube until the lipid solution becomes transparent (Note 3).
Transfer the new lipid stock to an Eppendorf and keep it at 4 °C for long-term storage.
Preparation of Bio-Beads-SM2 for detergent removal during nanodiscs reconstitution
Weigh 1 g of Bio-Beads-SM2 from the commercial vial into a 50 mL Falcon tube.
Add up to 50 mL of methanol to the solution of Bio-Beads.
Rotate gently (max. 20 rpm) for 2 h at room temperature (RT) using rotator TR-200 under the hood. Make sure the solution of Bio-Beads is well homogenized.
After decanting the Bio-Beads, eliminate the methanol.
Add 50 mL of MilliQ H2O and rotate gently (max. 20 rpm) for 1 h at RT to wash Bio-Beads from methanol.
After decanting the Bio-Beads, eliminate H2O (Note 4).
Repeat this wash two times, to be sure all methanol is eliminated.
Eliminate 30 mL of H2O from your Falcon tube.
Transfer Bio-Beads solution (Bio-Beads + 20 mL of H2O) into the Spectra/Por 3 dialysis tubing membrane (Note 5).
Perform the buffer exchange with 1 L of size exclusion chromatography buffer with agitation (max. 100 rpm) O/N at 4 °C.
Recover all Bio-Beads into a 50 mL Falcon tube (Note 6).
Wait 5–10 min for the beads to sediment in the bottom of the Falcon tube.
Adjust the Bio-Beads concentration for 200 mg of beads per milliliter by eliminating the buffer volume.
Store at 4 °C until use.
Membrane scaffold protein preparation (Note 7)
Perform a bacterial transformation with the desired MSP plasmid (for this protocol, we used the plasmid encoding for MSP1D1 (Note 8) by a heat-shock method at 42 °C for 45 s using the E. coli strain BL21(DE3) Gold (Note 9).
Plate the bacteria after transformation using the antibiotic resistance conditions of the MSP expression vector used, and incubate O/N at 37 °C.
Take one bacterial colony to inoculate 100 mL of 2× YT medium in an Erlenmeyer flask (for a final 2 L culture production).
Incubate O/N at 37 °C with agitation (between 160 and 180 rpm) to saturate the bacterial culture.
Prepare 2 L of 2× YT medium culture using the respective antibiotic resistance conditions (Note 10).
Split the 2 L culture medium into two 2 L Erlenmeyer flasks to ensure good oxygenation of bacteria (1 L in each Erlenmeyer).
Measure the OD600 of the overnight culture.
Dilute the overnight culture into 2 L of 2× YT medium to get an OD600 = 0.2.
Incubate the culture at 37 °C with agitation at 180 rpm.
Induce protein expression with 1 mM final concentration of IPTG when the E. coli cultures are between 0.6 and 0.75 OD600.
Incubate the culture for 4 h at 37 °C as previously.
Collect the bacterial pellets by centrifuging the bacterial culture at 4,000× g for 30 min (Note 11).
Collect all samples to test protein expression via SDS-PAGE analysis.
Resuspend the pellet in 75 mL of lysis buffer.
Incubate the lysis resuspension for 1 h with agitation at 4 °C.
Clarify the lysate by centrifugating at 9,000× g minimum for 1 h at 4 °C.
Recover the soluble fraction.
Filter supernatant through 0.22 µm pore size syringe filters.
Apply the filtered supernatant on a His-tag affinity chromatography using a 5 mL column, previously equilibrated with lysis buffer without detergent.
Wash with 10 column volumes (CV) of lysis buffer and then with 10 CV of MSP wash buffer.
Conduct MSP elution using an imidazole gradient ranging from 0 to 500 mM at a flow rate of 2 mL/min for 7.5 min by adding the elution buffer imidazole to achieve a final imidazole concentration of 500 mM.
Collect all samples of the purification for SDS-PAGE analysis.
Pool the elution fraction with the higher MSP quantity and purity.
Perform dialysis O/N using Spectra/Por 3 dialysis membrane tubing against 1 L of size exclusion chromatography buffer at 4 °C (Note 12).
Recover the sample, centrifuge, and filter it through a 0.22 µm membrane pore.
Measure MSPs concentration by absorbance at 280 nm (Note 13).
Analyze the purity of the purified and dialyzed MSPs by loading an SDS-PAGE 4%–15% acrylamide with 1–2 µg of protein.
Scan the gel using imaging equipment and save the image’s raw data. Then, using image analysis software, evaluate the purity percentage of your MSPs (Note 14).
Aliquot MSP proteins in 100 µL samples of 1–2 mg/mL to avoid multiple freeze-thaw cycles and store them at -80 °C after flash-freezing in liquid nitrogen (Note 15).
Bare-nanodiscs preparation and reconstitution
Thaw MSP purified protein aliquots.
Centrifuge at 12,000× g for 5 min at 4 °C.
Determine the protein concentration of the supernatant by measuring absorbance at 280 nm using Nanodrop equipment or equivalent (Note 16).
Calculate the MSP volume you need for a minimal amount of 20 nmol (Note 17).
Calculate the volume of lipids corresponding to the desired molar ratio (Note 18).
Mix both MSP and lipid using the determined volumes.
Incubate the sample for 1 h at 4 °C with 12 rpm agitation.
During that time, calculate the amount of Bio-Beads needed to completely remove detergents present in the sample used previously to solubilize lipids (Note 19).
Add Bio-Beads and incubate your nanodiscs preparation overnight at 4 °C with 12 rpm agitation.
The following day, transfer the mix to 1 mL filter centrifuge tubes and centrifuge samples using a bench microcentrifuge for a fast spin of 5 s to remove Bio-Beads (Note 20).
Recover nanodiscs sample in the flowthrough of the tube. Be sure that all Bio-Beads are correctly removed from the sample and that you recovered the entire sample.
Using concentrators with a cutoff of 50 kDa, concentrate your nanodiscs preparation to a final volume of 500 µL by centrifugation cycles of 5 min at 5,000× g and 4 °C.
Recover reconstituted nanodisc from the top part of the concentrators.
Resuspend carefully between each centrifugation cycle by up-down pipetting.
Centrifuge samples at 12,000× g for 10 min at 4 °C to eliminate possible protein aggregates.
Keep 10 µL for SDS-PAGE analysis.
Perform a size exclusion chromatography using a 24 mL Superdex 200 increase 10/300 GL.
Pre-equilibrate with size exclusion chromatography buffer at 4 °C.
Set one run per sample, injecting 490 µL with a flow rate of 0.35 mL/min.
Start to collect all samples before the elution volume of 8 mL (Figure 1A). Samples are collected in 500 µL elution fractions (Note 21).
Test all samples on SDS-PAGE to evaluate the purity of your samples (Figure 1C).
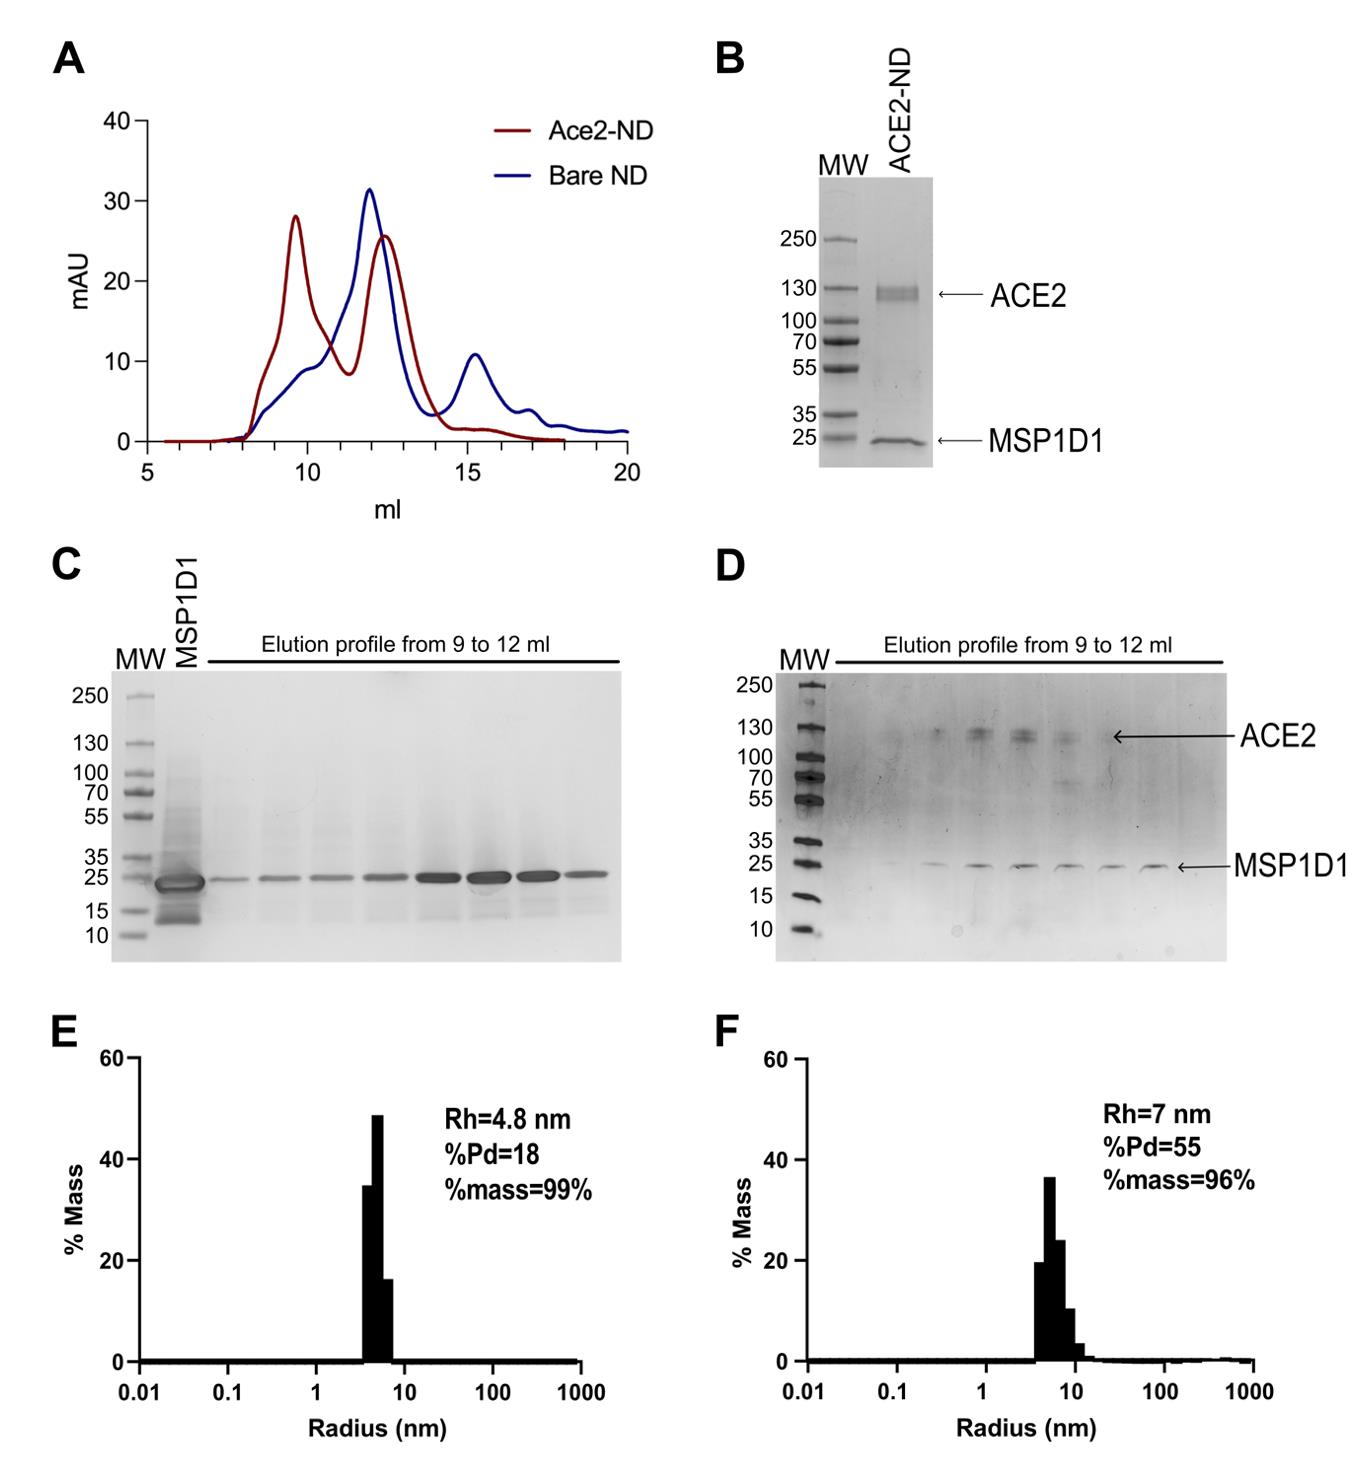
Figure 1. Characterization of bare nanodiscs and transmembrane protein nanodiscs assemblies. A. Size exclusion chromatography of bare nanodiscs (MSP1D1-POPC, blue line) and ACE2 nanodiscs (red line). The ACE2 nanodisc chromatogram shows two species corresponding to bare nanodiscs and ACE2-ND. B. SDS-PAGE of the pooled ACE2-ND fraction after gel filtration chromatography. C. SDS-PAGE of the bare nanodiscs. MSP1D1 was loaded first, followed by the MSP1D1-POPC NDs elution, demonstrating a high degree of purity of bare nanodiscs. D. SDS-PAGE of ACE2 nanodiscs purification and the resulting elution. E. Dynamic light scattering (DLS) distribution and its associated autocorrelation curve, showing a hydrodynamic radius of 4.8 nm for MSP1D1-POPC, confirming a monodisperse sample. F. DLS distribution and its associated autocorrelation curve, showing a hydrodynamic radius of 7 nm for ACE2-NDs, also confirming a monodisperse sample.Pool fractions corresponding to the elution volume peak at 12 mL (Note 22).
Calculate the protein concentration based on the molecular weight (MW) and the measured absorbance at 280 nm of an MSP monomer.
Concentrate your nanodiscs preparations to a final volume of 50 µL using concentrators cutoff of 50 kDa by centrifugation cycles of 5 min at 5,000× g and 4 °C (Note 23).
Resuspend carefully between each centrifugation cycle by up-down pipetting before characterization. If nanodiscs cannot be analyzed directly, they can be stored at 4 °C for a maximum of 2 weeks.
Reconstitution of nanodiscs containing transmembrane proteins
Before proceeding, it is highly advisable to refine the purification protocols to achieve high purity of the transmembrane protein (> 98% on SDS-PAGE), verify monodispersity, and use a detergent compatible with Bio-Beads adsorption (e.g., sodium cholate, Tween 20) [11,12]. Additionally, it is necessary to generate 10–50 nmol of protein to proceed with incorporation experiments.
Define the molar ratios for the overall reconstitution. From our experience, a membrane protein molar ratio of 1:5 to 1:10 is a good starting point (Note 24).
Membrane protein:MSPs.
MSPs:lipids (previously optimized for bare-nanodiscs).
The amount of Bio-Beads per reconstitution.
Incubate the defined amount of membrane protein with lipids for 1 h at 4 °C and 12 rpm agitation.
Add the chosen MSP in the mix of membrane protein and lipids.
Incubate for 1 h at 4 °C with 12 rpm agitation.
Add the needed amount of Bio-Beads to remove the detergents from the sample completely.
Incubate the nanodiscs preparation for 12–15 h at 4 °C with 12 rpm agitation.
The next day, transfer the mix to 1 mL filter centrifuge tubes and centrifuge samples using a bench microcentrifuge for a fast spin of 5 s to remove Bio-Beads.
Using concentrators with a cutoff at 50 kDa, concentrate the nanodiscs preparation to a final volume of 500 µL, through centrifugation cycles of 5 min at 5,000 g at 4 °C.
Resuspend carefully between each centrifugation cycle by up-down pipetting.
Recover reconstituted nanodiscs from the upper quarter of the concentrators.
Centrifuge reconstituted nanodiscs at 12,000× g for 5 min at 4 °C.
Keep 10 µL for SDS-PAGE analysis.
Perform size exclusion chromatography using a 24 mL Superdex 200 increase 10/300 GL.
Pre-equilibrate with size-exclusion chromatography buffer at 4 °C (Note 25).
Set up one run per sample, injecting 490 µL with a flow rate of 0.35 mL/min.
Collect all samples prior to elution volume of 8 mL (Figure 1A). Samples are collected in 500 µL elution fractions.
Test all samples on SDS-PAGE to evaluate their purity and to identify the nanodiscs-incorporated transmembrane protein fractions (Figure 1B, D) (Note 26).
Define the elution volume of your sample (transmembrane proteins nanodiscs’ assemblies) by the elution volume of the elution peak (Note 27).
Pool the fractions corresponding to the elution volume nanodiscs peak.
Measure the protein concentration based on MWs and the extinction coefficient at A280 of an MSP monomer and a monomer of the target membrane protein if your protein is monomeric.
Concentrate your nanodiscs’ assembly preparations to a final volume of 50 µL using concentrators with a cutoff of 50 kDa by performing centrifugation cycles of 5 min at 5,000× g at 4 °C (Note 28).
Resuspend carefully between each centrifugation cycle by up-down pipetting.
Characterization of the quality of the reconstituted nanodiscs’ assemblies
Here, we present a variety of biophysical and biochemical methods to assess sample homogeneity, dispersity, and structural integrity before proceeding with structural studies.
Protein characterization
After reconstitution, a western blot can be employed to confirm the presence of both the His-tagged MSP and the membrane protein in the nanodiscs. Specific antibodies targeting the membrane protein can be used for detection. However, if these are unavailable, adding a tag to the membrane protein should be considered. In such cases, careful selection of the tag is important. Using the same tag, such as His, for both the MSP and the membrane protein could complicate distinguishing the membrane protein, especially if there is not a significant molecular weight difference between the membrane protein and the MSP.
If the concentration of nanodiscs allows, using a native gel can effectively show the ratio of incorporated vs. bare nanodiscs. This method maintains the native state, enabling observation without denaturation. In studies involving integrins, native gels have been particularly useful for accurately distinguishing between different forms [13].
Dynamic light scattering
Dynamic light scattering (DLS) experiments can be used to evaluate the extent of nanodiscs reconstitution. A comparative analysis of the hydrodynamic radius values between bare nanodiscs (NDs) and those incorporating membrane proteins can be performed (Figure 1E, F). The presence of the membrane protein should increase or match the hydrodynamic radius values of the bare NDs [14]. Depending on the instrument, DLS experiments can be conducted with minimal sample consumption, as samples are often recoverable from the plate. Combining DLS results with prior chromatography and western blot data should offer high confidence in determining whether reconstitution was successful or if further optimization is required. Ideally, samples should be monodispersed in terms of the percentage of mass in the sample [15] ensuring that the particles are uniform in size and distribution. This uniformity is crucial for reliable results in downstream experiments.
Analytical ultracentrifugation
Analytical ultracentrifugation (AUC) experiments can also be considered for characterizing reconstituted nanodiscs assemblies. These experiments are particularly valuable in specific cases (for more details, see Inagaki and Ghirlando [16]):
When the membrane protein contains only transmembrane domains and is fully embedded within the lipidic bilayer of the nanodiscs. AUC can differentiate bare-NDs from membrane protein nanodiscs complexes by distinguishing between the densities of the different species, thereby revealing their composition.
When studying membrane protein complexes that exhibit conformational changes, interaction affinities, or stoichiometries.
Cryogenic electron microscopy (cryoEM) of membrane proteins in nanodiscs
For quality control of nanodisc samples, homogeneity and size can be visually inspected using electron microscopy techniques. While negative staining is a convenient method, it requires drying the samples and embedding them in heavy metal salt layer, which can cause sample flattening. We recommend using cryoEM to image, acquire, and analyze the assemblies in their fully hydrated state (for more details, see Cianfrocco and Kellogg [17], Passmore and Russo [18]).
CryoEM sample preparation
i. Turn on Vitrobot [we used Vitrobot Mark IV model (Thermo Fisher)].
ii. Set the parameters to 4 °C and 100% humidity and prepare filter papers.
iii. While the Vitrobot reaches the target temperature, render the TEM substrates (grids) hydrophilic using a glow discharge apparatus (such as PELCO easiGlowTM Glow Discharge Cleaning System or Cordouan Technologies ELMO glow discharge system) or plasma cleaner (such as Gatan/Ametek Solarus II Plasma Cleaner).
iv. Enter the vitrification parameters: 30-s wait before blotting; blot for 3 s at force 2; no drain time (Note 29).
v. Liquefy ethane (Note 30).
vi. Apply 4 µL of the sample solution at the approximate 0.5 mg/mL to the EM grids (Note 31).
vii. Proceed with the plunge freezing in liquid ethane.
viii. Store the vitrified samples in a grid storage container at LN2 temperature.
CryoEM data acquisition
i. Screen the grids before starting data collection (Figure 2).
ii. On a 200 kV or 300 kV cryo-electron microscope, verify the integrity of the grids and the quality and thickness of the vitrified layer [18].
iii. Assess the concentration and homogeneity of nanodiscs assemblies (Figure 2A–G) (Notes 32 and 33).
v. For the selected grids, proceed with data acquisition using the following parameters:
1) Use parallel beam condition on a 200 kV or 300 kV cryo-electron microscope, such as Titan Krios G3i (Thermos Scientific) or a Glacios (Thermos Scientific), preferably equipped with a direct electron detection device (e.g., Falcon4i) in movie mode. If an energy filter is available (e.g., a SelectrisX or Selectris, Thermo Scientific), set the slit width to 10 eV.
2) Use data collection software like EPU (Thermo Scientific) or Serial EM [19].
3) Set magnification to achieve a pixel size of around 1 Å with a defocus range between -0.8 and -3 µm with a step of 0.2 µm; the total dose should be 50 e/Å2.
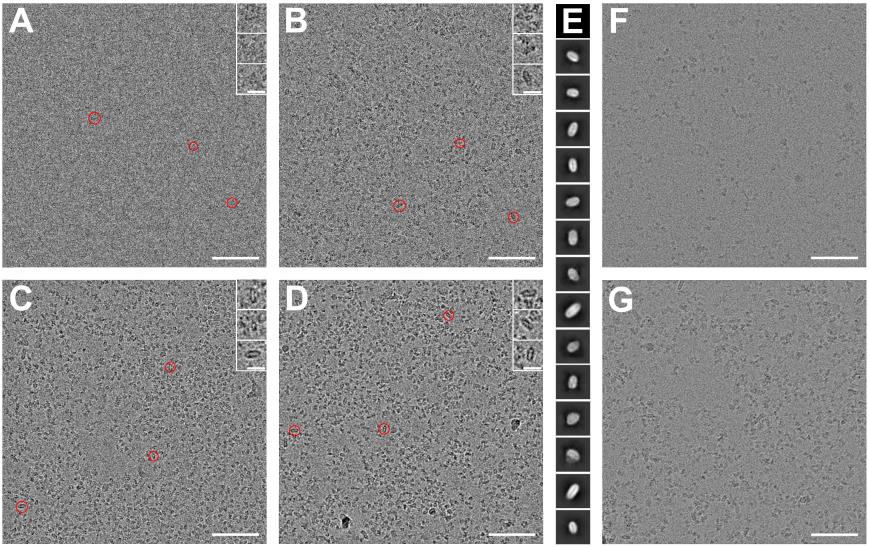
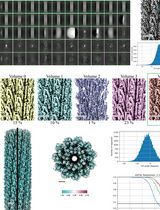
Figure 2. CryoEM sample and imaging assessment. (A–D) CryoEM micrograph of bare nanodisc samples taken at different defocus values, and (E) the associated 2D classes corresponding to a box size of 256 px with a pixel size of 0.96 Å. A. Defocus 0.5 µm. B. Defocus 1 µm. C. Defocus 1.5 µm. D. Defocus 2 µm. Scale bar 50 nm. Red circles highlight bare nanodiscs visible in the micrographs, with zoomed-in inserts showing the highlighted particles (scale bar: 10 nm). It should be noted that the nanodiscs are easier to identify at higher defocus. (F and G) CryoEM micrographs of nanodiscs at different concentrations: 0.3 mg/mL (F), 0.8 mg/mL (G). Scale bar 50 nm. Ideally, each micrograph should contain approximately 400 particles, aiming for about 1 million particles per dataset. Lower particle concentrations, as seen in (F) will result in a more costly data collection process compared to (G). Therefore, in cases like (F), efforts should be made to optimize the particle concentration.Feret signature analysis
To assess the homogeneity of nanodisc preparations, we refer to the Feret signature analysis described in our recent publication [14]. This analysis should be done at the onset of data collection, as Feret signature methodology can identify a lack of nanodisc-sample homogeneity with only about 1,000 particles per set. This method enables real-time adjustments of data acquisition parameters for optimizing data collection strategies or aiding in decisions to discontinue ineffective imaging sessions. Feret signatures can also help to detect orientation bias, conformational diversity, and 3D misclassification in samples other than pure nanodiscs [20].
CryoEM data processing
Once data acquisition details are optimized and datasets have been acquired, pursue with initial data processing steps:
i. Import all the movies to CryoEM analysis software such as CryoSPARC [21] or Relion [22].
ii. Follow the Motion Correction and CTF Estimation steps.
iii. Pick particles manually or with software such as Blob Picker in CryoSPARC [23] or in Relion. Then, extract particles with a box size of 400 px corresponding to 384 Å box size for 9 nm nanodiscs.
iv. Generate 2D classes (Figure 2E) (Note 34).
v. Follow by a few rounds of selecting the best 2D class particles.
vi. Repeat steps F4d.iii–v using automatic picker such as Template Picker.
vii. Generate 3 Ab-initio models with the chosen software.
viii. Perform a 3D refinement with all the several generated Ab-initio models created.
ix. Generate 3D reconstruction and perform postprocessing.
Validation of protocol
Membrane scaffold protein (MSP) nanodiscs offer numerous advantages for investigating membrane proteins in biophysics and structural biology [24]. Establishing a robust biochemical workflow is essential to ensure reproducibility. Some of our work has focused on studying challenging systems of membrane proteins embedded in nanodiscs under cryogenic conditions. The protocol described here was indispensable for producing structures for several of these systems. One such system is the B-cell lymphoma 2 (Bcl-2)-associated X protein (Bax) nanodisc assemblies [25–27]. Bax, a 21 kDa protein, is a member of the Bcl-2 family and plays a crucial role in apoptotic regulation. When triggered, Bax assembles into an oligomer and inserts itself into the outer mitochondrial membrane to induce apoptosis [28]. We examined the structural properties of Bax nanodisc assemblies, despite its small molecular weight being closely correlated to those of nanodiscs, mostly fully incorporated within the lipid islands. We have also resolved structures of bitopic membrane proteins using this protocol, such as the integrin protein family, which are bidirectional, allosteric transmembrane receptors playing a pivotal role in hemostasis and arterial thrombosis [29]. The conformational landscape of human integrin αIIbβ3, while bound to its effectors, is strongly affected by the presence of the lipid bilayer [13,30]. Another example of a bitopic membrane protein resolved using our protocol is the B-cell lymphoma xL protein (Bcl-xL; 23 kD), a major suppressor of apoptosis [14]. These systems differ substantially from high-molecular-weight channels, where nanodiscs primarily serve as small solubilizers [31]. When the size of the embedded protein closely matches the size of the nanodisc, heterogeneity in nanodisc preparation can significantly impact alignment and classification accuracy during the structure determination process. Preferred orientation and conformational diversity can further complicate image analysis [32,33]. The proposed biochemical and biophysical characterization protocols, image acquisition, and real-time feedback [14] can advance preparations and lead to superior high-resolution structural determination of these challenging samples.
General notes and troubleshooting
Choosing biologically relevant lipids that closely resemble the natural membrane composition is essential for stabilizing membrane proteins and preserving their structure and function in nanodiscs [24,34]. The physical and chemical properties of the lipids, such as headgroup and tail length, can influence nanodisc size, shape, stability, and rigidity [35]. Additionally, the phase behavior of lipids, including those with high phase-transition temperatures, can enhance nanodisc stability under harsh conditions like elevated temperatures or low pH [4]. Lipid composition also affects interactions between nanodiscs and other biomolecules, which is crucial for certain applications. Specific lipids, such as cholesterol or sphingolipids, can increase the affinity of nanodiscs for other membrane proteins or lipids [24,36]. Therefore, the careful selection of lipids is vital for successful nanodisc formation and functionality.
The concentration of the detergent sodium cholate was prepared at twice the expected concentration of lipids [4]. Thus, we used a concentration slightly above the value demanded to ensure the full solubilization of the lipids. For a final concentration of lipids at 32.9 mM, 70 mM of NaCholate was used.
Once solubilization has been achieved, ensure that all lipids are fully resuspended. The appearance of a film along the wall of the tube typically indicates that some lipids have not yet been properly resuspended.
Exercise caution when handling the supernatant, as it contains a significant amount of methanol dissolved in water.
Use cut micropipette tips and plastic pipettes at about 1/3 from the tip to prevent Bio-Beads from being blocked inside the tips and the pipettes. The loss of Bio-Beads should be limited to the dialysis membrane transfers.
Bio-Beads can stick to the dialysis membrane. To recover more than 99% of the Bio-Beads, add buffer to wash the membrane, allowing retrieving the remaining beads.
It is important to consider the below parameters before selecting the MSP proteins for experiments:
Transmembrane domains: The number of transmembrane domains in the protein is crucial for selecting the appropriate MSP protein for nanodisc reconstitution. Proteins with multiple transmembrane domains may need larger nanodiscs to accommodate the protein and allow proper interaction with the lipid bilayer. Proteins with fewer domains may require smaller nanodiscs to ensure complete protein embedding.
Nanodisc size determination: The optimal size of nanodiscs for a particular protein can be determined experimentally and may vary based on the specific protein and lipid composition [2–4]. The size of nanodiscs is defined by the amount of lipid used and the belt protein incorporated. A range of MSP constructs allows the generation of nanodiscs from 9 to 17 nm in diameter [37]. The desired size of the nanodisc governs the considerations for MSP selection; the diameter of the transmembrane region of the protein can be estimated based on the number of transmembrane domains. Longer MSPs may generate more heterogeneous nanodisc types.
Transformed bacteria are less stable and express less MSP. It may be due to the toxicity of MSP expression. To ensure efficient expression of MSPs, a new bacterial transformation should be conducted prior to each purification.
If the protein is not incorporated into nanodiscs, it may be because the nanodiscs diameter is too small to support the protein (Note 7). We suggest experimenting with the other MSPs listed, which will result in different sizes of nanodiscs.
Use Erlenmeyers flasks that allow a high rate of oxygenation with a ratio between the volume of culture and the maximum volume of at least 1:5.
At this stage, bacteria can be stored at -20 °C or below. If bacteria pellets were previously stored for a long term, the pellet will need to be thawed before resuspension.
Precipitation can eventually occur after changing the buffer.
At the end of the purification, one can aim to obtain between 5 and 10 mg of MSPs per liter of E. coli culture.
The presence of proteolyzed fragments in MSP preparations does not invalidate the successful use of those batches for nanodiscs reconstitution. While proteolytic fragments of MSPs may be present after purification, our study and others have shown that their presence does not significantly affect the reconstitution efficiency. However, it is still essential to consider the ratio percentage of full-length vs. proteolyzed fragments of MSP to ensure accurate quantification of nanodisc components and as importantly to reduce background in cryoEM images.
The volume of aliquots should be optimized depending on the concentration of proteins and the volume needed for nanodisc reconstitution to avoid unnecessary freeze-thaw cycles and degradation of the samples.
Please note that the percentage of proteolyzed MSP present in the sample will not contribute to the effective reconstitution of bare nanodiscs. Therefore, ensure that the 20 nmol amount corresponds to the full-length MSPs. We recommend adjusting the concentration based on the quantity of full-length MSP observed on the SDS-PAGE gel.
The total volume of the nanodisc preparation should not exceed 2 mL [4]. Thus, you may consider setting your initial concentrations of MSPs according to the amount and volumes needed.
To find the best experimental MSP molar ratio for your conditions, we advise testing three different ratios for the reconstitution of bare nanodiscs. For 9 nm nanodiscs using MSP1D1 protein and POPC lipids, you can start with the ratio published by Ritchie et al. (1:65) and also test 1:55 and 1:75 [4]. Perform these experiments in parallel using the same MSP and lipids stocks to compare your preparations.
The amount of Bio-Beads to use is based on their adsorption capacity, which depends on the nature of the detergents. Refer to the values in the papers by Horigome and Sugano (1983) and Rigaud and colleagues (1998) to determine the required volume [11,12]. To ensure efficient detergent removal, consider using double the calculated amount of Bio-Beads. Choosing the right detergents for solubilizing and extracting membrane proteins is crucial for effective detergent removal and stable nanodisc formation. During nanodisc reconstitution, sodium cholate is commonly used. It is important to note that Bio-Beads need to absorb both the detergent used for protein solubilization and extraction as well as the one used for nanodisc reconstitution. Thus, ensure that sodium cholate is compatible with the protein of interest.
Avoid bubbles.
Bare nanodiscs should be eluted at approximately 12 mL.
Nanodisc reconstitution depends on various factors; notably, the amount of full-length MSPs and lipids. Keeping the MSP amount constant, an excess of lipids maximizes the use of MSPs to reconstitute nanodiscs. Low lipid concentration results in fewer nanodiscs and leaves "free" MSPs in the solution. Conversely, excess lipids can form liposomes of different sizes that are not detected on SDS-PAGE.
Bare nanodiscs at a final concentration of 0.5–1 mg/mL are suitable for characterization by biophysical methods. Bare nanodisc concentration is calculated based on the measured absorbance at 280 nm, the extinction coefficient, as well as the molecular weight of one monomer of MSP.
Once the molar ratio between MSPs and lipids for bare nanodiscs is established, the same conditions can be used for initial protein integration attempts. Further optimization of the membrane protein quantity per nanodisc reconstitution may be necessary. The described purification strategy accounts for the increased hydrodynamic radius of nanodiscs incorporating the target membrane protein compared to bare nanodiscs, which will also be present in the mixture.
Buffer conditions should be optimized based on the protein's characteristics, such as pH, stability-improving additives, and salt concentration, as these can impact cryoEM experiments. We recommend starting with buffer conditions used in previous nanodiscs research studies and in our laboratories as a starting baseline [2–4,13,14,25,27].
Carefully analyze the size exclusion chromatography profile to identify contaminants such as free MSPs, liposomes of different sizes, bare nanodiscs, membrane proteins in different-size liposomes, and detergents, compared to your membrane protein nanodiscs of interest.
If your membrane protein has transmembrane domains and an ectodomain, it should elute before 12 mL under the given size exclusion chromatography conditions. If it has only transmembrane domains, its elution volume can be around 12 mL, like bare nanodiscs.
The final concentration of membrane protein nanodiscs samples that can be obtained is around 0.5–1 mg/mL, which is suitable for SDS-PAGE and western blot characterization.
These parameters need to be optimized for each protein-nanodisc preparation and plunge-freezing apparatus. Here, we provide parameters that have worked under our conditions, which can be used as a starting point.
Liquid ethane may cause cryogenic burns, frostbite, or injury and may form explosive mixtures with air. Follow all safety data sheets (SDS) before use.
The concentration of the ND solution should be between 0.17 and 0.8 mg/mL with an optimum concentration around 0.5 mg/mL.
If the Protein-ND is not visible during screening on the cryoEM session, it can be due to a low concentration of samples or the vitrified layer being too thick. It is best to look back to your ND preparation and increase ND concentration before freezing (Figure 2F, G). It is important to try several regions with different thicknesses of the vitrified layer to find the NDs. You can also use a higher defocus or Phase Plate to reenforce the contrast (Figure 2A–D).
During size exclusion chromatography, liposomes and micelles of similar size to nanodiscs may not be fully separated and can still be present in the sample. As a result, these liposomes and/or micelles can be observed during cryoEM screening. Additional purification steps, such as affinity chromatography or ultracentrifugation, may be necessary to reduce these types of contamination and enhance the purity of nanodisc preparations.
To address preferred orientations in vitrified samples, various buffers can be tested, adjusting the vitrification process itself or apparatus, or testing various grids’ types and support films, and possibly adding an extra graphene layer (e.g., a 2 nm graphene film) [38]. If everything else fails, a second tilted data collection can be performed to provide additional orientations [39,40], or sub-tomogram averaging can be considered [33].
Acknowledgments
This work was funded by institutional funds from the Institut Pasteur and the CNRS (D.H. and N.V.). D.H. acknowledges funding from the U.S. Army Research Office under contract W911NF-19-D-0001 for the Institute for Collaborative Biotechnologies award. The authors thank Nicolas Wolff, Sébastien Brûlé, and Bertrand Raynal (Institut Pasteur) for discussions about nanodiscs and membrane proteins, and for support on biochemical and biophysical experiments. The authors acknowledge the biophysical platform (PFBMI) and the NanoImaging Core (NCF) at Institut Pasteur for the provision of the equipment (DLS, Vitrobot, cryo-electron microscope). The NanoImaging Core was created with the help of a grant from the French Government’s Investissements d’Avenir program (EQUIPEX CACSICE - Centre d’analyse de systèmes complexes dans les environements complexes, ANR-11-EQPX-0008).
Competing interests
The authors declare that they have no competing interests.
References
- Arinaminpathy, Y., Khurana, E., Engelman, D. M. and Gerstein, M. B. (2009). Computational analysis of membrane proteins: the largest class of drug targets. Drug Discov. 14: 1130–1135.
- Bayburt, T. H., Grinkova, Y. V. and Sligar, S. G. (2002). Self-Assembly of Discoidal Phospholipid Bilayer Nanoparticles with Membrane Scaffold Proteins. Nano Lett. 2(8): 853–856.
- Denisov, I. G., Grinkova, Y. V., Lazarides, A. A. and Sligar, S. G. (2004). Directed Self-Assembly of Monodisperse Phospholipid Bilayer Nanodiscs with Controlled Size. J Am Chem Soc. 126(11): 3477–3487.
- Ritchie, T., Grinkova, Y., Bayburt, T., Denisov, I., Zolnerciks, J., Atkins, W. and Sligar, S. (2009). Reconstitution of Membrane Proteins in Phospholipid Bilayer Nanodiscs. Meth Enzymol. 464: 211–231.
- Seddon, A. M., Curnow, P. and Booth, P. J. (2004). Membrane proteins, lipids and detergents: not just a soap opera. Biochim Biophys Acta. 1666: 105–117.
- Sligar, S. G. and Denisov, I. G. (2021). Nanodiscs: A toolkit for membrane protein science. Protein Sci. 30(2): 297–315.
- Denisov, I. G. and Sligar, S. G. (2016). Nanodiscs for structural and functional studies of membrane proteins. Nat Struct Mol Biol. 23(6): 481–486.
- Dijkman, P. M. and Watts, A. (2015). Lipid modulation of early G protein-coupled receptor signalling events. Biochim Biophys Acta. 1848(11): 2889–2897.
- Redhair, M., Clouser, A. F. and Atkins, W. M. (2019). Hydrogen-deuterium exchange mass spectrometry of membrane proteins in lipid nanodiscs. Chem Phys Lipids. 220: 14–22.
- Yan, R., Zhang, Y., Li, Y., Xia, L., Guo, Y. and Zhou, Q. (2020). Structural basis for the recognition of SARS-CoV-2 by full-length human ACE2. Science. 367(6485): 1444–1448.
- Horigome, T. and Sugano, H. (1983). A rapid method for removal of detergents from protein solution. Anal Biochem. 130(2): 393–396.
- Rigaud, J. L., Levy, D., Mosser, G. and Lambert, O. (1998). Detergent removal by non-polar polystyrene beads. Eur Biophys J. 27(4): 305–319.
- Xu, X. P., Kim, E., Swift, M., Smith, J. W., Volkmann, N. and Hanein, D. (2016). Three-Dimensional Structures of Full-Length, Membrane-Embedded Human αIIbβ3 Integrin Complexes. Biophys J. 110(4): 798–809.
- Vilela, F., Bezault, A., Rodriguez de Francisco, B., Sauvanet, C., Xu, X. P., Swift, M. F., Yao, Y., Marrasi, F. M., Hanein, D., Volkmann, N., et al. (2022). Characterization of heterogeneity in nanodisc samples using Feret signatures. J Struct Biol. 214(4): 107916.
- Raynal, B., Brûlé, S., Uebel, S. and Knauer, S. H. (2021). Assessing and Improving Protein Sample Quality. Methods Mol Biol. 2263: 3–46.
- Inagaki, S. and Ghirlando, R. (2017). Nanodisc characterization by analytical ultracentrifugation. Nanotechnol Rev. 6(1): 3–14.
- Cianfrocco, M. A. and Kellogg, E. H. (2020). What Could Go Wrong? A Practical Guide to Single-Particle Cryo-EM: From Biochemistry to Atomic Models. J Chem Inf Model. 60(5): 2458–2469.
- Passmore, L. and Russo, C. (2016). Specimen Preparation for High-Resolution Cryo-EM. Meth Enzymol. 579: 51–86.
- Mastronarde, D. N. (2003). SerialEM: A Program for Automated Tilt Series Acquisition on Tecnai Microscopes Using Prediction of Specimen Position. Microsc Microanal. 9: 1182–1183.
- Nottelet, P., Van Blerkom, P., Xu, X.-P., Hanein, D. and Volkmann, N. (2024). CryoEM Workflow Acceleration with Feret Signatures. Int J Mol Sci. 25(14): 7593.
- Punjani, A., Rubinstein, J. L., Fleet, D. J. and Brubaker, M. A. (2017). cryoSPARC: algorithms for rapid unsupervised cryo-EM structure determination. Nat Methods. 14(3): 290–296.
- Scheres, S. H. (2012). RELION: Implementation of a Bayesian approach to cryo-EM structure determination. J Struct Biol. 180(3): 519–530.
- Punjani, A., Zhang, H. and Fleet, D. J. (2020). Non-uniform refinement: adaptive regularization improves single-particle cryo-EM reconstruction. Nat Methods. 17(12): 1214–1221.
- Efremov, R. G., Gatsogiannis, C. and Raunser, S. (2017). Lipid Nanodiscs as a Tool for High-Resolution Structure Determination of Membrane Proteins by Single-Particle Cryo-EM. Meth Enzymol.: 1–30.
- López, C. A., Swift, M. F., Xu, X. P., Hanein, D., Volkmann, N. and Gnanakaran, S. (2019). Biophysical Characterization of a Nanodisc with and without BAX: An Integrative Study Using Molecular Dynamics Simulations and Cryo-EM. Structure. 27(6): 988–999.e4.
- Volkmann, N., Marassi, F. M., Newmeyer, D. D., and Hanein, D. (2014). The rheostat in the membrane: BCL-2 family proteins and apoptosis. Cell Death Differ. 21: 206–215.
- Xu, X. P., Zhai, D., Kim, E., Swift, M., Reed, J. C., Volkmann, N. and Hanein, D. (2013). Three-dimensional structure of Bax-mediated pores in membrane bilayers. Cell Death Dis. 4(6): e683–e683.
- Westphal, D., Dewson, G., Czabotar, P. E. and Kluck, R. M. (2011). Molecular biology of Bax and Bak activation and action. Biochim Biophys Acta Mol Cell Res. 1813(4): 521–531.
- Huang, J., Li, X., Shi, X., Zhu, M., Wang, J., Huang, S., Huang, X., Wang, H., Li, L., Deng, H., et al. (2019). Platelet integrin αIIbβ3: signal transduction, regulation, and its therapeutic targeting. J Hematol Oncol. 12(1): 26.
- Hanein, D. and Volkmann, N. (2018). Conformational Equilibrium of Human Platelet Integrin Investigated by Three-Dimensional Electron Cryo-Microscopy. Subcell Biochem. 87: 353–363.
- Piao, J., Zhao, C. and Dong, Y. (2022). DNA nanostructure-assisted nanodiscs provide a toolbox to investigate membrane proteins. Cell Rep Phys Sci. 3(6): 100897.
- Naydenova, K. and Russo, C. J. (2017). Measuring the effects of particle orientation to improve the efficiency of electron cryomicroscopy. Nat Commun. 8(1): 629.
- Noble, A. J., Dandey, V. P., Wei, H., Brasch, J., Chase, J., Acharya, P., Tan, Y. Z., Zhang, Z., Kim, L. Y., Scapin, G., et al. (2018). Routine single particle CryoEM sample and grid characterization by tomography. eLife. 7: e34257.
- Rouck, J. E., Krapf, J. E., Roy, J., Huff, H. C. and Das, A. (2017). Recent advances in nanodisc technology for membrane protein studies (2012–2017). FEBS Lett. 591(14): 2057–2088.
- Schachter, I. and Harries, D. (2023). Capturing Lipid Nanodisc Shape and Properties Using a Continuum Elastic Theory. J Chem Theory Comput. 19(4): 1360–1369.
- Zhang, M., Gui, M., Wang, Z. F., Gorgulla, C., Yu, J. J., Wu, H., Sun, Z. y., Klenk, C., Merklinger, L., Morstein, L., et al. (2021). Cryo-EM structure of an activated GPCR–G protein complex in lipid nanodiscs. Nat Struct Mol Biol. 28(3): 258–267.
- Grinkova, Y. V., Denisov, I. G. and Sligar, S. G. (2010). Engineering extended membrane scaffold proteins for self-assembly of soluble nanoscale lipid bilayers. Protein Eng Des Sel. 23(11): 843–848.
- Naydenova, K., Peet, M. J. and Russo, C. J. (2019). Multifunctional graphene supports for electron cryomicroscopy. Proc Natl Acad Sci USA. 116(24): 11718–11724.
- Radermacher, M., Wagenknecht, T., Verschoor, A. and Frank, J. (1987). Three‐dimensional reconstruction from a single‐exposure, random conical tilt series applied to the 50S ribosomal subunit of Escherichia coli. J Microsc. 146(2): 113–136.
- Tan, Y. Z., Baldwin, P. R., Davis, J. H., Williamson, J. R., Potter, C. S., Carragher, B. and Lyumkis, D. (2017). Addressing preferred specimen orientation in single-particle cryo-EM through tilting. Nat Methods. 14(8): 793–796.
We describe the preparation of POPC lipids for nanodisc reconstitution, though similar protocol can be applied to other lipids or mixed samples (Note 1). This protocol builds on the work of Sligar and colleagues, with contributions from researchers from various fields [2–4].
Article Information
Publication history
Received: May 29, 2024
Accepted: Sep 1, 2024
Available online: Sep 28, 2024
Published: Nov 5, 2024
Copyright
© 2024 The Author(s); This is an open access article under the CC BY-NC license (https://creativecommons.org/licenses/by-nc/4.0/).
How to cite
Vilela, F., Sauvanet, C., Bezault, A., Volkmann, N. and Hanein, D. (2024). Optimizing Transmembrane Protein Assemblies in Nanodiscs for Structural Studies: A Comprehensive Manual. Bio-protocol 14(21): e5099. DOI: 10.21769/BioProtoc.5099.
Category
Biophysics > Microscopy > Cryogenic microscopy
Biochemistry > Protein > Structure
Do you have any questions about this protocol?
Post your question to gather feedback from the community. We will also invite the authors of this article to respond.