- Protocols

- Articles and Issues
- For Authors
- About
- Become a Reviewer

Single Cell Isolation from Human Diabetic Fibrovascular Membranes for Single-Cell RNA Sequencing
Published: Vol 14, Iss 20, Oct 20, 2024 DOI: 10.21769/BioProtoc.5096 Views: 1971
Reviewed by: Pilar Villacampa AlcubierreYu LiuPreeti Yadav
Original research article
The authors used this protocol in:
Nov 2023
Advertisement


Protocol Collections
Comprehensive collections of detailed, peer-reviewed protocols focusing on specific topics


Abstract
Single-cell transcriptomic analyses have emerged as very powerful tools to query the gene expression changes at the single-cell level in physiological and pathological conditions. The quality of the analysis is heavily dependent on tissue digestion protocols, with the goal of preserving thousands of single live cells to submit to the subsequent processing steps and analysis. Multiple digestion protocols that use different enzymes to digest the tissues have been described. Harsh digestion can damage certain cell types, but this might be required to digest especially fibrotic tissue as in our experimental condition. In this paper, we summarize a collagenase type I digestion protocol for preparing the single-cell suspension from fibrovascular tissues surgically removed from patients with proliferative diabetic retinopathy (PDR) for single-cell RNA sequencing (scRNA-Seq) analyses. We also provide a detailed description of the data analysis that we implemented in a previously published study.
Key features
• Single-cell suspension from fibrovascular membranes isolated from PDR patients.
• Single-cell RNA sequencing analyses performed using Seurat package in RStudio.
• Trajectory analyses or pseudotime analyses to study the trajectory over (pseudo)time of specific cell types.
• This protocol requires Illumina HiSEQ4000 instrument and knowledge of R and RStudio language for the analyses.
Keywords: scRNA-SeqGraphical overview
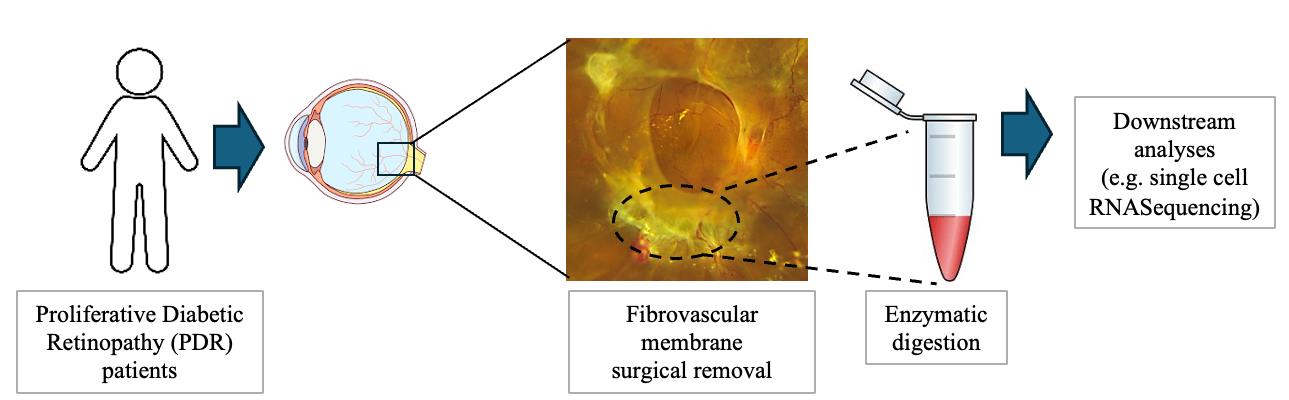
Fibrovascular membrane isolation and sequencing
Background
Proliferative diabetic retinopathy (PDR) is a late-stage complication of diabetes, responsible for vision loss in diabetic patients. The formation of fibrovascular membranes and scar tissue in the pre-retinal space leads to retinal traction and detachment [1]. Understanding the molecular features of the cells contributing to fibrovascular membrane formation and the cell–cell interactions is crucial for identifying new therapeutic targets that improve treatment approaches and patients’ quality of life.
scRNA-Seq is a powerful technique that allows us to study the molecular profile of each single cell. Since the first paper on scRNA-Seq was published in 2009, studies on this technique have provided insightful information in several fields, followed by exponential growth in the last decade [2–8]. In the context of retinal biology, this approach was fundamental for building a comprehensive transcriptome atlas of fetal and adult retinas and for dissecting the retinal developmental stages [9–11]. scRNA-Seq assays have also revealed the complexity and heterogeneity of the different cell types in the retina and aided in uncovering cell-specific gene expression changes in pathological conditions [12–17]. Single-cell transcriptomics also enables the study of individual pathogenic cell populations in the context of fibrosis at quite high resolution [18–22].
Despite significant improvements, scRNA-Seq is still a challenging technique [23]. Generating high-quality single-cell suspensions from any tissue is critical to preserve their expression profile and ensure meaningful downstream transcriptome data analysis. Several parameters in the dissociation protocol can compromise the viability of the cells and potentially impact the quality of the scRNA-Seq data. Preparing cell suspensions might be difficult for tissue samples, especially for fibrotic tissue, where gentle dissociation might not be sufficient to break the fibers of scar tissue, leading to inefficient cell yield after processing. On the other hand, an excessively harsh digestion might differentially damage cells that are more fragile [23,24].
Papain-based protocols have been shown to successfully dissociate retinal tissue and have been described in several scRNA-Seq studies of retina tissue and organoids [16,23,25]. Another enzyme described for tissue digestion is Collagenase (I and IV), which was described to digest fibrovascular membranes from proliferative diabetic retinopathy patients as well as mouse retinas and other tissues into single-cell suspensions [18,21,26–28]. In our experiments, we used a Collagenase I–based protocol [29].
Another important factor in the scRNA-Seq experiments is the downstream data analyses. Throughout the analysis, it is important to include filtering steps in data analysis processing with the aim of excluding low-quality cells or empty droplets that have very few genes and cell doublets that may exhibit an aberrantly high gene count.
Our protocol is quite efficient in digesting the fibrovascular membranes from PDR patients [29], and we were able to preserve a lot of cell types with a high number of genes detected per cell.
Materials and reagents
Biological materials
Fibrovascular membranes surgically removed from proliferative diabetic retinopathy (PDR) patients
Reagents
Collagenase Type I (Worthington, catalog number: LS004194)
Bovine serum albumin (BSA) (Sigma-Aldrich, catalog number: A7906)
Ethylenediaminetetraacetic acid (EDTA) (Amresco, catalog number: E522)
Illumina TruSeq stranded mRNA (Illumina, catalog number: 20020594)
Chromium Single Cell 3' v3 kit (10X Genomics, catalog number: PN-1000268)
Hank's balanced salt solution (HBSS) (Thermo Fisher Scientific, catalog number: 14025092)
1× Dulbecco’s phosphate-buffered saline (DPBS) with calcium and magnesium (Thermo Fisher Scientific, catalog number: 14040133)
1× Dulbecco’s phosphate-buffered saline (DPBS) without calcium and magnesium (Thermo Fisher Scientific, catalog number: 14190094)
Solutions
Collagenase I solution (see Recipes)
Bovine serum albumin (BSA)-EDTA (see Recipes)
Recipes
Collagenase I solution
Reagent Final concentration Quantity or Volume Collagenase type I 2 mg/mL 500 µL/sample PBS with Ca2+ and Mg2+ Bovine serum albumin (BSA)-EDTA
Reagent Final concentration Quantity or Volume Bovine serum albumin (BSA) 1% 500 µL/sample EDTA 2 mM PBS w/o Ca2+ and Mg2+
Laboratory supplies
1.5 mL microcentrifuge tubes (Eppendorf, catalog number: 022431021)
1 mL pipette (USA Scientific, catalog number: 7110-1000)
Laboratory tips (TipOne, catalog number: 1111-2720)
Equipment
Agilent 2100 Bio-analyzer
Illumina HiSEQ4000
Microcentrifuge (Eppendorf, model: 5424R)
Software and datasets
R software (free download from https://cran.r-project.org/bin/windows/base/) (R version 4.3.2, 2023-10-31)
RStudio (free download from https://posit.co/download/rstudio-desktop/) (Version 2023.03.1+446 (2023.03.1+446)
Seurat (version 5.1.0) and Monocle (Version 2.32.0) packages for RStudio
All raw data have been deposited to GEO (accession no. GSE245561) and trajectory inference analysis code was deposited on GitHub (https://github.com/katiacoranoscheri/PDR-trajectory-analysis).
Procedure
Fibrovascular membrane collection
Patients with fibrovascular traction diabetic detachments undergo standard 23-gauge pars plana vitrectomy. Using a combination of microsurgical instruments, dissect the epiretinal fibrovascular membranes and extract large pieces from the eye. These extracted membranes need to be immediately transferred in HBSS on ice.
Tissue digestion, single-cell suspension preparation, and sequencing
After surgery, place the PDR fibrovascular membranes in HBSS and store them on ice.
Prepare a solution of 1× DPBS with calcium and magnesium containing 2 mg/mL Collagenase Type I for tissue digestion (Figure 1).
Pipette 500 μL of the digestion solution to each sample and dissociate them for 30 min at 37 °C, shaking the tubes manually every 5 min.
Gently triturate the samples by pipetting the solution 20 times with a p1000 pipette.
After digestion and trituration, use a 70 μm filter to remove any clumps and debris.
After dissociation, spin down the cell suspension at 400× g for 8 min at 4 °C and carefully discard the supernatant (Figure 1).
Resuspend the cell pellet in 500 μL of 1× DPBS without calcium and magnesium with 1% BSA and 2 mM EDTA and keep the samples on ice until further processing (Figure 1).
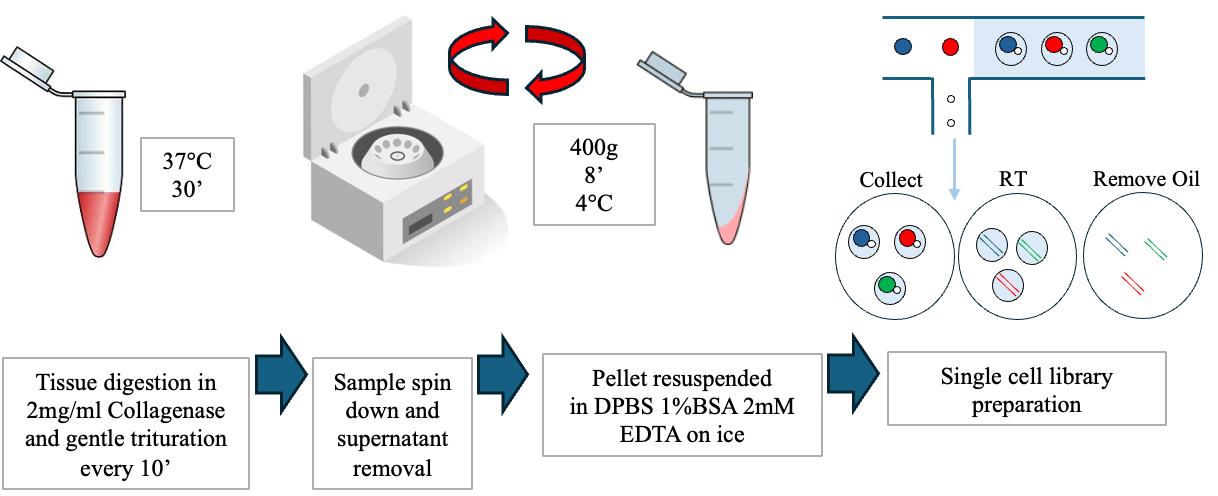
Figure 1. Overview of the dissociation procedure for single-cell suspension preparationBefore sequencing, the cell number and viability need to be assessed using an automated cell counter with AO/PI dye.
All our scRNA-Seq experiments were performed at the Functional Genomics Core at the University of Chicago (Chicago, Illinois, USA). Single-cell libraries were generated using a Chromium Single Cell 3' v3 kit (10× Genomics) and RNA quality and quantity were assessed using an Agilent Bio-analyzer. RNA-Seq libraries were prepared using Illumina mRNATruSEQ kits following manufacturer instructions (Illumina). Library quality and quantity were checked using an Agilent Bioanalyzer. In our study, we implemented the scRNA-Seq analysis based on the Drop-Seq method that was first published in 2015 [30] and sequenced using the Illumina HiSEQ4000 (paired-end 100 bp) following the manufacturer’s reagents and instructions.
Data analysis
Pre-processing workflow and quality check
Raw sequencing data need to be converted into a FASTQ format, and the files need to be aligned to the hg38 reference genome (for human data) provided by 10× Genomics. Seurat package (Satija Lab, NYGC) is used to analyze the data.
If using multiple samples, preprocess, normalize, and scale each individual raw data sample following the Seurat pipeline (https://satijalab.org/seurat/articles/pbmc3k_tutorial).
Consider as outlier cells with <500 or >5000 unique features as well as cells with >25% mitochondrial RNA.
Perform a doublet detection analysis and remove the doublet using the scDblFinder pipeline [31].
Doublet detection and removal can be performed using the standard parameters of 1% doublets per 1000 droplets sequenced. Copy the scDblFinder metadata from the new object into the original dataset.
Droplets identified as "singlets" can be used for subsequent analysis and doublets are discarded.
Sample integration, scaling, and clustering
Integrate the samples using the canonical correlation analysis (CCA) with the integration pipeline in Seurat (https://satijalab.org/seurat/articles/integration_introduction.html). Only variable features present in all samples are selected for dataset integration.
Following CCA integration, scale the dataset and calculate the principal components for plotting and clustering of the integrated dataset. Use ElbowPlot() to estimate the selection of which principal components can be included.
Following dimensionality estimation, “r full.dataset.dims” dimensions are used for UMAP projection and cluster identification of the integrated dataset. Cluster the CCA-aligned data using a Louvain algorithm implemented in Seurat at a resolution of 0.1 and r full.dataset.dims dimensions.
Implement the functions FindNeighbors and FindClusters to cluster the cells that you can then visualize with the function RunUMAP.
Calculate the percentage of cells in each cluster for each sample and, for statistical analysis, perform the hypergeometric distribution analysis using the phyper function [phyper (q=, m=, n=, k=, lower.tail = TRUE, log.p = TRUE)]. In the phyper function, # q = cells in cluster from sample, # m = total cells from that sample, # n = total cells from all other samples, # k = total cells in cluster. Consider P < 0.001 for statistical significance.
Differential gene expression analysis and re-clustering
Perform a differential expression analysis using “FindAllMarkers” function (min.pct = 0.25, log2FC > 1) to identify the cell clusters.
For the visualization of specific markers, use the data visualization methods from Seurat pipeline (https://satijalab.org/seurat/articles/visualization_vignette). DotPlot, VlnPlot, and FeaturePlot are examples of visualization of the data (Figure 2, first output, DotPlot).
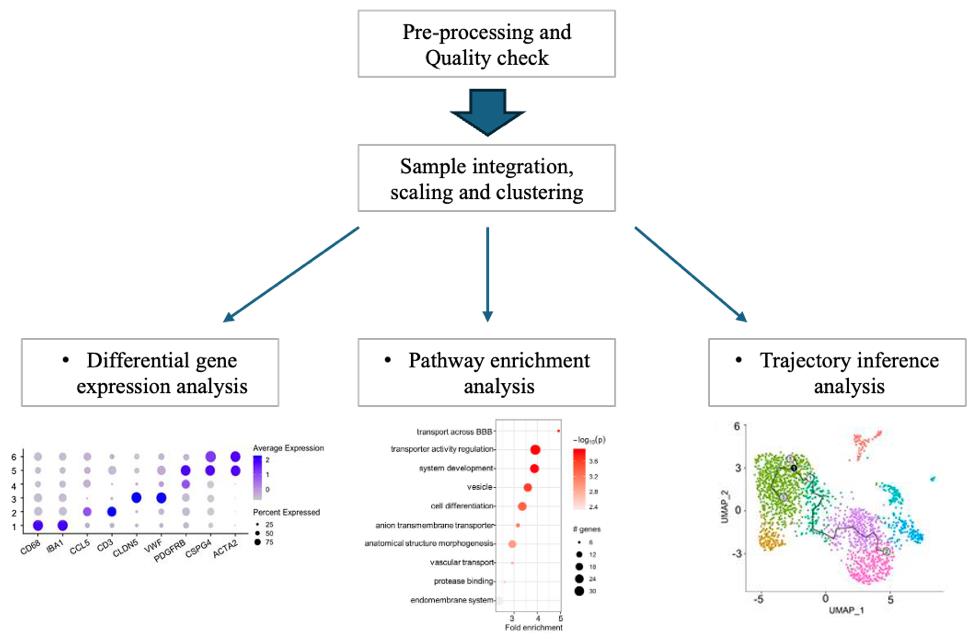
Figure 2. Workflow of the scRNA-Seq data analysis and expected output. Images from Corano Scheri et al. [29].Save the object with the SaveRDS function.
After identification of all cell clusters, re-cluster each cell type individually with the “subset” function indicating the number of the cluster to analyze separately [e.g., stromal <- (subset(original Seurat object, idents = 4))].
Run PCA again, then implement the functions FindNeighbors and FindClusters to find the subclusters of each cell type and visualize them with the function RunUMAP.
Perform a differential gene expression analysis to identify the subclusters in each cell type.
Save the object of each cell cluster individually with the SaveRDS function.
Pathway enrichment, inference, and ligand-receptor analyses
Select the most significant differentially upregulated and downregulated genes (log2FC > 1, logFC<-1 and p-adj < 0.01) to perform a pathway enrichment analysis in each subcluster.
Use the g: GOSt functional profiling tool available on the g: Profiler web server (version e99_eg46_p14_f929183) to identify significant pathways upregulated or downregulated in the clusters.
Generate the dotplots in R using PathFindR package in RStudio (Figure 2, second output).
Monocle3 workflow (https://cole-trapnell-lab.github.io/monocle3/docs/trajectories/) (Becht, Cao, Qiu, Trapnell) can now be used to perform cell inference trajectory analysis or pseudotime analysis. We implemented this workflow to perform the pseudotime analysis on the stromal cluster.
Import the Seurat object (previously saved as .rds file) into Monocle with the Monocle3 conversion tool as. cell_data_set () function.
Use Monocle tools to order the cells.
The differentialGeneTest function can be used to identify the differentially expressed genes among clusters along the trajectory and then generate a UMAP graph to illustrate the trajectory across the clusters (Figure 2, third output).
Perform a ligand-receptor analysis and evaluate the interactions between the cell types using CellphoneDB module.
Calculate the mean gene expression values and p-values from the cell barcode and counts extracted from the Seurat object and use it in conjunction with the statistical_analysis module.
Use the dot_plot module of CellphoneDB with the statistical analysis to generate the dot plots.
The description of these analyses can be found in the “Methods” section of the paper Corano Scheri et al. [29] JCI Insight. The raw data are available on GEO under accession number GSE245561. The code for the inference analysis has been uploaded on GitHub ((https://github.com/katiacoranoscheri/PDR-trajectory-analysis).
Validation of protocol
This protocol has been used in the following research article:
Corano Scheri et al. [29] JCI Insight. Single-cell transcriptomics analysis of proliferative diabetic retinopathy fibrovascular membranes reveals AEBP1 as fibrogenesis modulator.
General notes and troubleshooting
General notes
Limitations of our study might include a small sample size, which may reflect a general limitation of certain cells’ ability to withstand the technical process of single-cell isolation. It is recommended to have a minimum of 10,000 cells with > 90% viability to sequence and allow subsequent further analyses.
Troubleshooting
Problem 1: Cell number and viability can be low throughout the experiment.
Solution(s): It is recommended to use as many specimens as possible and to optimize the protocol, time, and reagents based on the tissue to maximize the yield and viability of the cells. It is important to take into consideration that different cell types and tissues might respond differently to single-cell digestion protocols that need to be changed accordingly.
Acknowledgments
The present work was supported by the following grants: NIH-R01-EY30121-A1 and Juvenile Diabetes Research Foundation Grant INO-2022-1112-A-N (AAF).
This protocol was described and validated in the following research article: Corano Scheri et al. [29], JCI Insight (2023), DOI: 10.1172/jci.insight.172062.
Competing interests
A.A.F. is a consultant to Regeneron, Roche/Genentech, Boehringer Ingelheim, RegenXbio, and T.T. is currently employed at Regeneron, but these entities did not have any relevant role in this article.
Ethical considerations
All human samples were collected at Northwestern, and the study was considered by our Institutional Review Board as exempt from informed consent and exception was granted from Northwestern University (detailed information about the patients are reported in the original paper Corano Scheri et al. [29], JCI Insight).
References
- Antonetti, D. A., Silva, P. S. and Stitt, A. W. (2021). Current understanding of the molecular and cellular pathology of diabetic retinopathy. Nat Rev Endocrinol. 17(4): 195–206.
- Guo, G., Huss, M., Tong, G. Q., Wang, C., Li Sun, L., Clarke, N. D. and Robson, P. (2010). Resolution of Cell Fate Decisions Revealed by Single-Cell Gene Expression Analysis from Zygote to Blastocyst. Dev Cell. 18(4): 675–685.
- Islam, S., Kjällquist, U., Moliner, A., Zajac, P., Fan, J. B., Lönnerberg, P. and Linnarsson, S. (2011). Characterization of the single-cell transcriptional landscape by highly multiplex RNA-seq. Genome Res. 21(7): 1160–1167.
- Miranda, A. M. A., Janbandhu, V., Maatz, H., Kanemaru, K., Cranley, J., Teichmann, S. A., Hübner, N., Schneider, M. D., Harvey, R. P., Noseda, M., et al. (2023). Single-cell transcriptomics for the assessment of cardiac disease. Nat Rev Cardiol. 20(5): 289–308.
- Piwecka, M., Rajewsky, N. and Rybak-Wolf, A. (2023). Single-cell and spatial transcriptomics: deciphering brain complexity in health and disease. Nat Rev Neurol. 19(6): 346–362.
- Svensson, V., Natarajan, K. N., Ly, L. H., Miragaia, R. J., Labalette, C., Macaulay, I. C., Cvejic, A. and Teichmann, S. A. (2017). Power analysis of single-cell RNA-sequencing experiments. Nat Methods. 14(4): 381–387.
- Svensson, V., Vento-Tormo, R. and Teichmann, S. A. (2018). Exponential scaling of single-cell RNA-seq in the past decade. Nat Protoc. 13(4): 599–604.
- Tang, F., Barbacioru, C., Wang, Y., Nordman, E., Lee, C., Xu, N., Wang, X., Bodeau, J., Tuch, B. B., Siddiqui, A., et al. (2009). mRNA-Seq whole-transcriptome analysis of a single cell. Nat Methods. 6(5): 377–382.
- Li, J., Choi, J., Cheng, X., Ma, J., Pema, S., Sanes, J. R., Mardon, G., Frankfort, B. J., Tran, N. M., Li, Y., et al. (2024). Comprehensive single-cell atlas of the mouse retina. bioRxiv: e577060.
- Lukowski, S. W., Lo, C. Y., Sharov, A. A., Nguyen, Q., Fang, L., Hung, S. S., Zhu, L., Zhang, T., Grünert, U., Nguyen, T., et al. (2019). A single‐cell transcriptome atlas of the adult human retina. EMBO J. 38(18): e2018100811.
- Mao, X., An, Q., Xi, H., Yang, X. J., Zhang, X., Yuan, S., Wang, J., Hu, Y., Liu, Q., Fan, G., et al. (2019). Single-Cell RNA Sequencing of hESC-Derived 3D Retinal Organoids Reveals Novel Genes Regulating RPC Commitment in Early Human Retinogenesis. Stem Cell Rep. 13(4): 747–760.
- Karademir, D., Todorova, V., Ebner, L. J. A., Samardzija, M. and Grimm, C. (2022). Single-cell RNA sequencing of the retina in a model of retinitis pigmentosa reveals early responses to degeneration in rods and cones. BMC Biol. 20(1): 86.
- Kumari, A., Ayala-Ramirez, R., Zenteno, J. C., Huffman, K., Sasik, R., Ayyagari, R. and Borooah, S. (2022). Single cell RNA sequencing confirms retinal microglia activation associated with early onset retinal degeneration. Sci Rep. 12(1): 15273.
- Liao, D., Fan, W., Li, N., Li, R., Wang, X., Liu, J., Wang, H. and Hou, S. (2024). A single cell atlas of circulating immune cells involved in diabetic retinopathy. iScience. 27(2): 109003.
- Lyu, P., Hoang, T., Santiago, C. P., Thomas, E. D., Timms, A. E., Appel, H., Gimmen, M., Le, N., Jiang, L., Kim, D. W., et al. (2021). Gene regulatory networks controlling temporal patterning, neurogenesis, and cell-fate specification in mammalian retina. Cell Rep. 37(7): 109994.
- Menon, M., Mohammadi, S., Davila-Velderrain, J., Goods, B. A., Cadwell, T. D., Xing, Y., Stemmer-Rachamimov, A., Shalek, A. K., Love, J. C., Kellis, M., et al. (2019). Single-cell transcriptomic atlas of the human retina identifies cell types associated with age-related macular degeneration. Nat Commun. 10(1): 4902.
- Sun, L., Wang, R., Hu, G., Liu, H., Lv, K., Duan, Y., Shen, N., Wu, J., Hu, J., Liu, Y., et al. (2021). Single cell RNA sequencing (scRNA-Seq) deciphering pathological alterations in streptozotocin-induced diabetic retinas. Exp Eye Res. 210: 108718.
- Ahsanuddin, S. and Wu, A. Y. (2023). Single-cell transcriptomics of the ocular anterior segment: a comprehensive review. Eye. 37(16): 3334–3350.
- Corano Scheri, K., Liang, X., Dalal, V., Le Poole, I. C., Varga, J. and Hayashida, T. (2022). SARA suppresses myofibroblast precursor transdifferentiation in fibrogenesis in a mouse model of scleroderma. JCI Insight. 7(21): e160977.
- Dobie, R. and Henderson, N. C. (2019). Unravelling fibrosis using single-cell transcriptomics. Curr Opin Pharmacol. 49: 71–75.
- Gautam, P., Hamashima, K., Chen, Y., Zeng, Y., Makovoz, B., Parikh, B. H., Lee, H. Y., Lau, K. A., Su, X., Wong, R. C. B., et al. (2021). Multi-species single-cell transcriptomic analysis of ocular compartment regulons. Nat Commun. 12(1): 5675.
- Humphreys, B. D., Lin, S. L., Kobayashi, A., Hudson, T. E., Nowlin, B. T., Bonventre, J. V., Valerius, M. T., McMahon, A. P. and Duffield, J. S. (2010). Fate Tracing Reveals the Pericyte and Not Epithelial Origin of Myofibroblasts in Kidney Fibrosis. Am J Pathol. 176(1): 85–97.
- Fadl, B. R., Brodie, S. A., Malasky, M., Boland, J. F., Kelly, M. C., Kelley, M. W., Boger, E., Fariss, R., Swaroop, A. and Campello, L. (2020). An optimized protocol for retina single-cell RNA sequencing. Mol Vis. 26: 705–717.
- Santiago, C. P., Gimmen, M. Y., Lu, Y., McNally, M. M., Duncan, L. H., Creamer, T. J., Orzolek, L. D., Blackshaw, S. and Singh, M. S. (2023). Comparative Analysis of Single-cell and Single-nucleus RNA-sequencing in a Rabbit Model of Retinal Detachment-related Proliferative Vitreoretinopathy. Ophthalmol Sci. 3(4): 100335.
- Clark, B. S., Stein-O’Brien, G. L., Shiau, F., Cannon, G. H., Davis-Marcisak, E., Sherman, T., Santiago, C. P., Hoang, T. V., Rajaii, F., James-Esposito, R. E., et al. (2019). Single-Cell RNA-Seq Analysis of Retinal Development Identifies NFI Factors as Regulating Mitotic Exit and Late-Born Cell Specification. Neuron. 102(6): 1111–1126.e5.
- Bhakuni, T., Norden, P. R., Ujiie, N., Tan, C., Lee, S. K., Tedeschi, T., Hsieh, Y. W., Wang, Y., Liu, T., Fawzi, A. A., et al. (2024). FOXC1 regulates endothelial CD98 (LAT1/4F2hc) expression in retinal angiogenesis and blood-retina barrier formation. Nat Commun. 15(1): 4097.
- Hu, Z., Mao, X., Chen, M., Wu, X., Zhu, T., Liu, Y., Zhang, Z., Fan, W., Xie, P., Yuan, S., et al. (2022). Single-Cell Transcriptomics Reveals Novel Role of Microglia in Fibrovascular Membrane of Proliferative Diabetic Retinopathy. Diabetes. 71(4): 762–773.
- Norden, P. R., Sabine, A., Wang, Y., Demir, C. S., Liu, T., Petrova, T. V. and Kume, T. (2020). Shear stimulation of FOXC1 and FOXC2 differentially regulates cytoskeletal activity during lymphatic valve maturation. eLife. 9: e53814.
- Corano Scheri, K., Lavine, J. A., Tedeschi, T., Thomson, B. R. and Fawzi, A. A. (2023). Single-cell transcriptomics analysis of proliferative diabetic retinopathy fibrovascular membranes reveals AEBP1 as fibrogenesis modulator. JCI Insight. 8(23): e172062.
- Macosko, E. Z., Basu, A., Satija, R., Nemesh, J., Shekhar, K., Goldman, M., Tirosh, I., Bialas, A. R., Kamitaki, N., Martersteck, E. M., et al. (2015). Highly Parallel Genome-wide Expression Profiling of Individual Cells Using Nanoliter Droplets. Cell. 161(5): 1202–1214.
- Germain, P. L., Lun, A., Macnair, W. and Robinson, M. D. (2021). Doublet identification in single-cell sequencing data using scDblFinder. F1000Research. 10: 979.
Article Information
Publication history
Received: Jun 5, 2024
Accepted: Sep 5, 2024
Available online: Sep 29, 2024
Published: Oct 20, 2024
Copyright
© 2024 The Author(s); This is an open access article under the CC BY-NC license (https://creativecommons.org/licenses/by-nc/4.0/).
How to cite
Scheri, K. C., Tedeschi, T. and Fawzi, A. A. (2024). Single Cell Isolation from Human Diabetic Fibrovascular Membranes for Single-Cell RNA Sequencing. Bio-protocol 14(20): e5096. DOI: 10.21769/BioProtoc.5096.
Category
Cell Biology > Single cell analysis
Bioinformatics and Computational Biology
Molecular Biology > RNA > RNA sequencing
Do you have any questions about this protocol?
Post your question to gather feedback from the community. We will also invite the authors of this article to respond.