- Protocols

- Articles and Issues
- For Authors
- About
- Become a Reviewer

Sorghum bicolor Extracellular Vesicle Isolation, Labeling, and Correlative Light and Electron Microscopy
(*contributed equally to this work) Published: Vol 14, Iss 19, Oct 5, 2024 DOI: 10.21769/BioProtoc.5083 Views: 2120
Reviewed by: Xiaofei LiangAnuradha SinghMasayoshi Nakamura
Original research article
The authors used this protocol in:
Feb 2024
Advertisement


Protocol Collections
Comprehensive collections of detailed, peer-reviewed protocols focusing on specific topics


Abstract
Extracellular vesicles are membrane-bound organelles that play crucial roles in intercellular communication and elicit responses in the recipient cell, such as defense responses against pathogens. In this study, we have optimized a protocol for isolating extracellular vesicles (EVs) from Sorghum bicolor apoplastic wash. We characterized the EVs using fluorescence microscopy and correlative light and electron microscopy.
Key features
• Allows the isolation of extracellular vesicles from the monocot plant Sorghum bicolor.
• Labels isolated extracellular vesicles with fluorescent dyes for easy characterization with light microscopy.
• Validates dye labeling and further characterizes extracellular vesicles using a correlative light and electron microscopy approach.
Keywords: Sorghum bicolorBackground
Extracellular vesicles (EVs) are membrane-bound organelles secreted by cells [1,2]. Many studies have shown that EVs are packaged with RNA, lipids, proteins, and other metabolites; these EV contents play an important role in mediating intercellular signaling [1–3].
The observation of plant and fungal EVs deposited at fungal infection sites suggested a possible mediation of the plant–pathogen interaction by EVs [4–6]. The notion of EVs mediating plant–pathogen interactions is supported by multiple studies showing enhanced plant EVs secretion after fungal infection, silencing of host plant’s immunity genes by sRNA packaged in fungal EVs, and modulation of fungal gene expression by host plant mRNAs [6–12]. Proteomic analysis of isolated plant EVs revealed they contain plant defense proteins [13–15], and a non-canonical secretory pathway has been proposed as the route for secretion of defense factors and virulence factors by the plants and fungal pathogens, respectively [16,17]. However, despite plant EVs having been described since the 1960s [5], methods for their isolation were only developed fairly recently for eudicot plants. Eudicot plant EVs have been largely isolated from the apoplastic wash of leaves through differential centrifugation, immuno-affinity capture, and density gradient centrifugation [3,15,18].
Here, we provide a detailed protocol that we used previously [19] for the isolation and characterization of EVs from the monocot plant Sorghum bicolor. To detect EVs by fluorescence microscopy, we designed a method for staining the EVs using an esterified dye, Calcein AM Green, and a lipophilic dye, Potomac Gold. To further characterize EVs, we developed a correlative light and electron microscopy method to examine the morphology of EVs stained with our fluorescent labeling approach. The new methods developed here complement standard EV characterization methods, such as nanoparticle tracking analysis and transmission electron microscopy.
Materials and reagents
Pro-mix BK55 soil (Premier Tech Horticulture, catalog number: 5060055RG)
6” standard pot (Grower’s, catalog number: 03EJ-SP600)
Sorghum bicolor seeds (BTx623 inbred line)
Scissors (W.B. Mason, catalog number: ACM13529)
Parafilm®, 4 in. × 250 ft (Bemis, catalog number: PM999)
Pyrex dish (Corning, catalog number: 3160100)
60 mL syringe (BD medical, catalog number: BD301036)
8-inch half-round file (Harbor Freight, catalog number: 96629)
Open-top thick-wall polypropylene tubes, 50 mL, 29 mm × 104 mm (Beckman Coulter, catalog number: 357007)
250 mL Nalgene bottles, (Millipore Sigma, catalog number: B9157)
2-(morpholin-4-yl)ethane-1-sulfonic acid (MES) hydrate (Sigma-Aldrich, catalog number: M8250)
Sodium chloride (NaCl) (Sigma-Aldrich, catalog number: SS7653)
Calcium chloride (CaCl2) (Sigma-Aldrich, catalog number: C1016)
1 L Glass beaker (Pyrex, catalog number: 100-1L-PK)
Miracloth 475855-1R (Millipore, catalog number: 3446249)
1 M Tris-Hydrochloride (Tris-HCl), pH 7.5 (Fisher Bioreagents, catalog number: BP1757-500)
KimwipesTM (Kimberly-Clark, catalog number: 34120)
25 ml serological pipettes (Thermo Fisher Scientific, catalog number: 170357N)
OptiPrep density gradient (60% iodixanol) (Sigma-Aldrich, catalog number: D1556)
Thin-walled ultra-clear centrifuge tubes (14 mm × 89 mm) (Beckman Coulter, catalog number: 344059)
Calcein Green, AM (Thermo Fisher Scientific, catalog number: C34852)
Potomac Gold (Lavis Lab, HHMI Janelia)
Poly-L-lysine (Sigma-Aldrich, catalog number: P4707)
Trypan blue (Sigma-Aldrich, catalog number: T6146)
HPLC grade water (Thermo Fisher Scientific, catalog number: 022934)
Microscopes slides, 75 mm × 25 mm × 1 mm (Thermo Fisher Scientific, catalog number: 12-544-2)
Cover glass, 22 mm × 22 mm, No. 1.5 (Thermo Fisher Scientific, catalog number: 12541B)
Secure seal spacer, 9 mm diameter (Thermo Fisher Scientific, catalog number: S24737)
Isopropyl alcohol (IPA) (Millipore Sigma, catalog number: W292907)
5% (3-aminopropyl)triethoxysilane (APTES) (Millipore Sigma, catalog number: 440140-100ML)
25% Glutaraldehyde (Electron Microscopy Supplies, catalog number: 16220)
1.5 mL Polypropylene microfuge tubes (Beckman Coulter, catalog number: 357448)
Ethanol 200 proof (Thermo Fisher Scientific, catalog number: T038181000)
Molecular-grade ethanol (Electron Microscopy Sciences, catalog number: 15055)
HPLC-grade ethanol (Thermo Scientific Chemicals, catalog number: AS611050040)
Ibidi Grid-50 cover glasses (Ibidi, catalog number: 10817)
Attofluor cell chamber (Thermo Fisher, catalog number: A7816)
Aluminum mounts to fit in SEM (Electron Microscopy Sciences, catalog number: 75185)
Ultra-smooth carbon adhesive tabs, 25 mm diameter (Electron Microscopy Sciences, catalog number: 778727-25)
PELCO conductive silver paint (Ted Pella, Inc, catalog number: 16062-15)
Wash-N-DryTM coverslip rack (VWR, catalog number: 490007-150)
Dimethyl sulfoxide (DMSO) (Sigma-Aldrich, catalog number: D4540)
Solutions
Vesicle isolation buffer (VIB) (see Recipes)
Calcein AM stain (see Recipes)
Potomac gold stain (see Recipes)
Trypan blue (see Recipes)
Glutaraldehyde fixative (see Recipes)
Ethanol dehydration solutions (see Recipes)
Recipes
Vesicle isolation buffer (VIB)
20 mM MES
2 mM CaCl2
0.1 M NaCl
Adjust pH to 6.0. Autoclave at 121 °C for 30 min
Calcein AM Stain
Resuspend 50 µg of Calcein Green, AM in 50 µL of DMSO.
Dilute to 1 µM in HPLC water.
Potomac gold stain
Resuspend 100 µg of Potomac Gold in 100 µL of DMSO.
Make 5 µL aliquots.
Dilute to 1 µM in HPLC water.
Trypan blue
Make a 100 nM stock solution in HPLC water.
Glutaraldehyde fixative
Make fresh.
Filter 50 mL of 20 mM glutaraldehyde, pH 7.5, through a 0.2 µm filter into a 50 mL conical tube.
Make 1% and 2% glutaraldehyde in filtered 20 mM Tris-HCl, pH 7.5.
Ethanol dehydration solutions
Make a 25%, 50%, 75%, and 95% ethanol concentration series by diluting HPLC-grade ethanol in HPLC water.
Equipment
Light meter (Li-Cor, model: Quantum LI-190-R and LI-350)
Vacuum pump (Cole Parmer Welch, model: 2585B-50)
Vacuum desiccator chamber (Millipore Sigma, model: F42400-2221, catalog number: BAF424002221)
Avanti J-20 centrifuge (Beckman Coulter, catalog number: 368608)
JA-14 fixed-angle rotor (Beckman Coulter, model: JA-14, catalog number: 339247)
JA-17 fixed angle rotor (Beckman Coulter, model: JA-17, catalog number: 369691)
OptimaTM L-90k ultracentrifuge (Beckman Coulter, catalog number: 2043-30-1191)
SW 41 Ti rotor, swinging bucket, titanium, 6 × 13.2 mL (Beckman Coulter, catalog number: 331362)
OptimaTM MAX tabletop ultracentrifuge (Beckman Coulter, catalog number: 393315)
TLA 55 fixed-angle rotor package (Beckman Coulter, catalog number: 366725)
Total internal reflection fluorescence microscope (TIRF) (Oxford Instruments, model: Andor Dragonfly 600)
Note: Other sensitive microscopes can be used; however, TIRF and spinning disk confocal microscopes are recommended. Here, we used Borealis TIRF on an Andor Dragonfly 600 microscope with an Andor Zyla 4.2 PLUS sCMOS camera and a Leica Plan Apo 63× oil immersion TIRF objective (numerical aperture, 1.47). We used a 2,000mW, 488nm excitation laser, and 521/38nm bandpass (BP) filter for Calcein AM and a 1,000mW, 561nm excitation laser, and 594/43nm BP filter for Potomac Gold.
Stainless steel tweezers (Tronex, catalog number: SA316L)
Cover glass drying rack (Millipore Sigma, catalog number: Z743684)
Sonicator (Elma, catalog number: 51000065766)
Critical point dryer (Tousimis, model: Autosamdri®-815B, Series A, catalog number: 8780B)
Apreo VolumeScopeTM scanning electron microscope with Maps 3.9 software
Software and datasets
ImageJ
Procedure
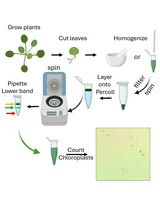
Note: An overview of the sorghum EV isolation workflow can be found in Figure 1.
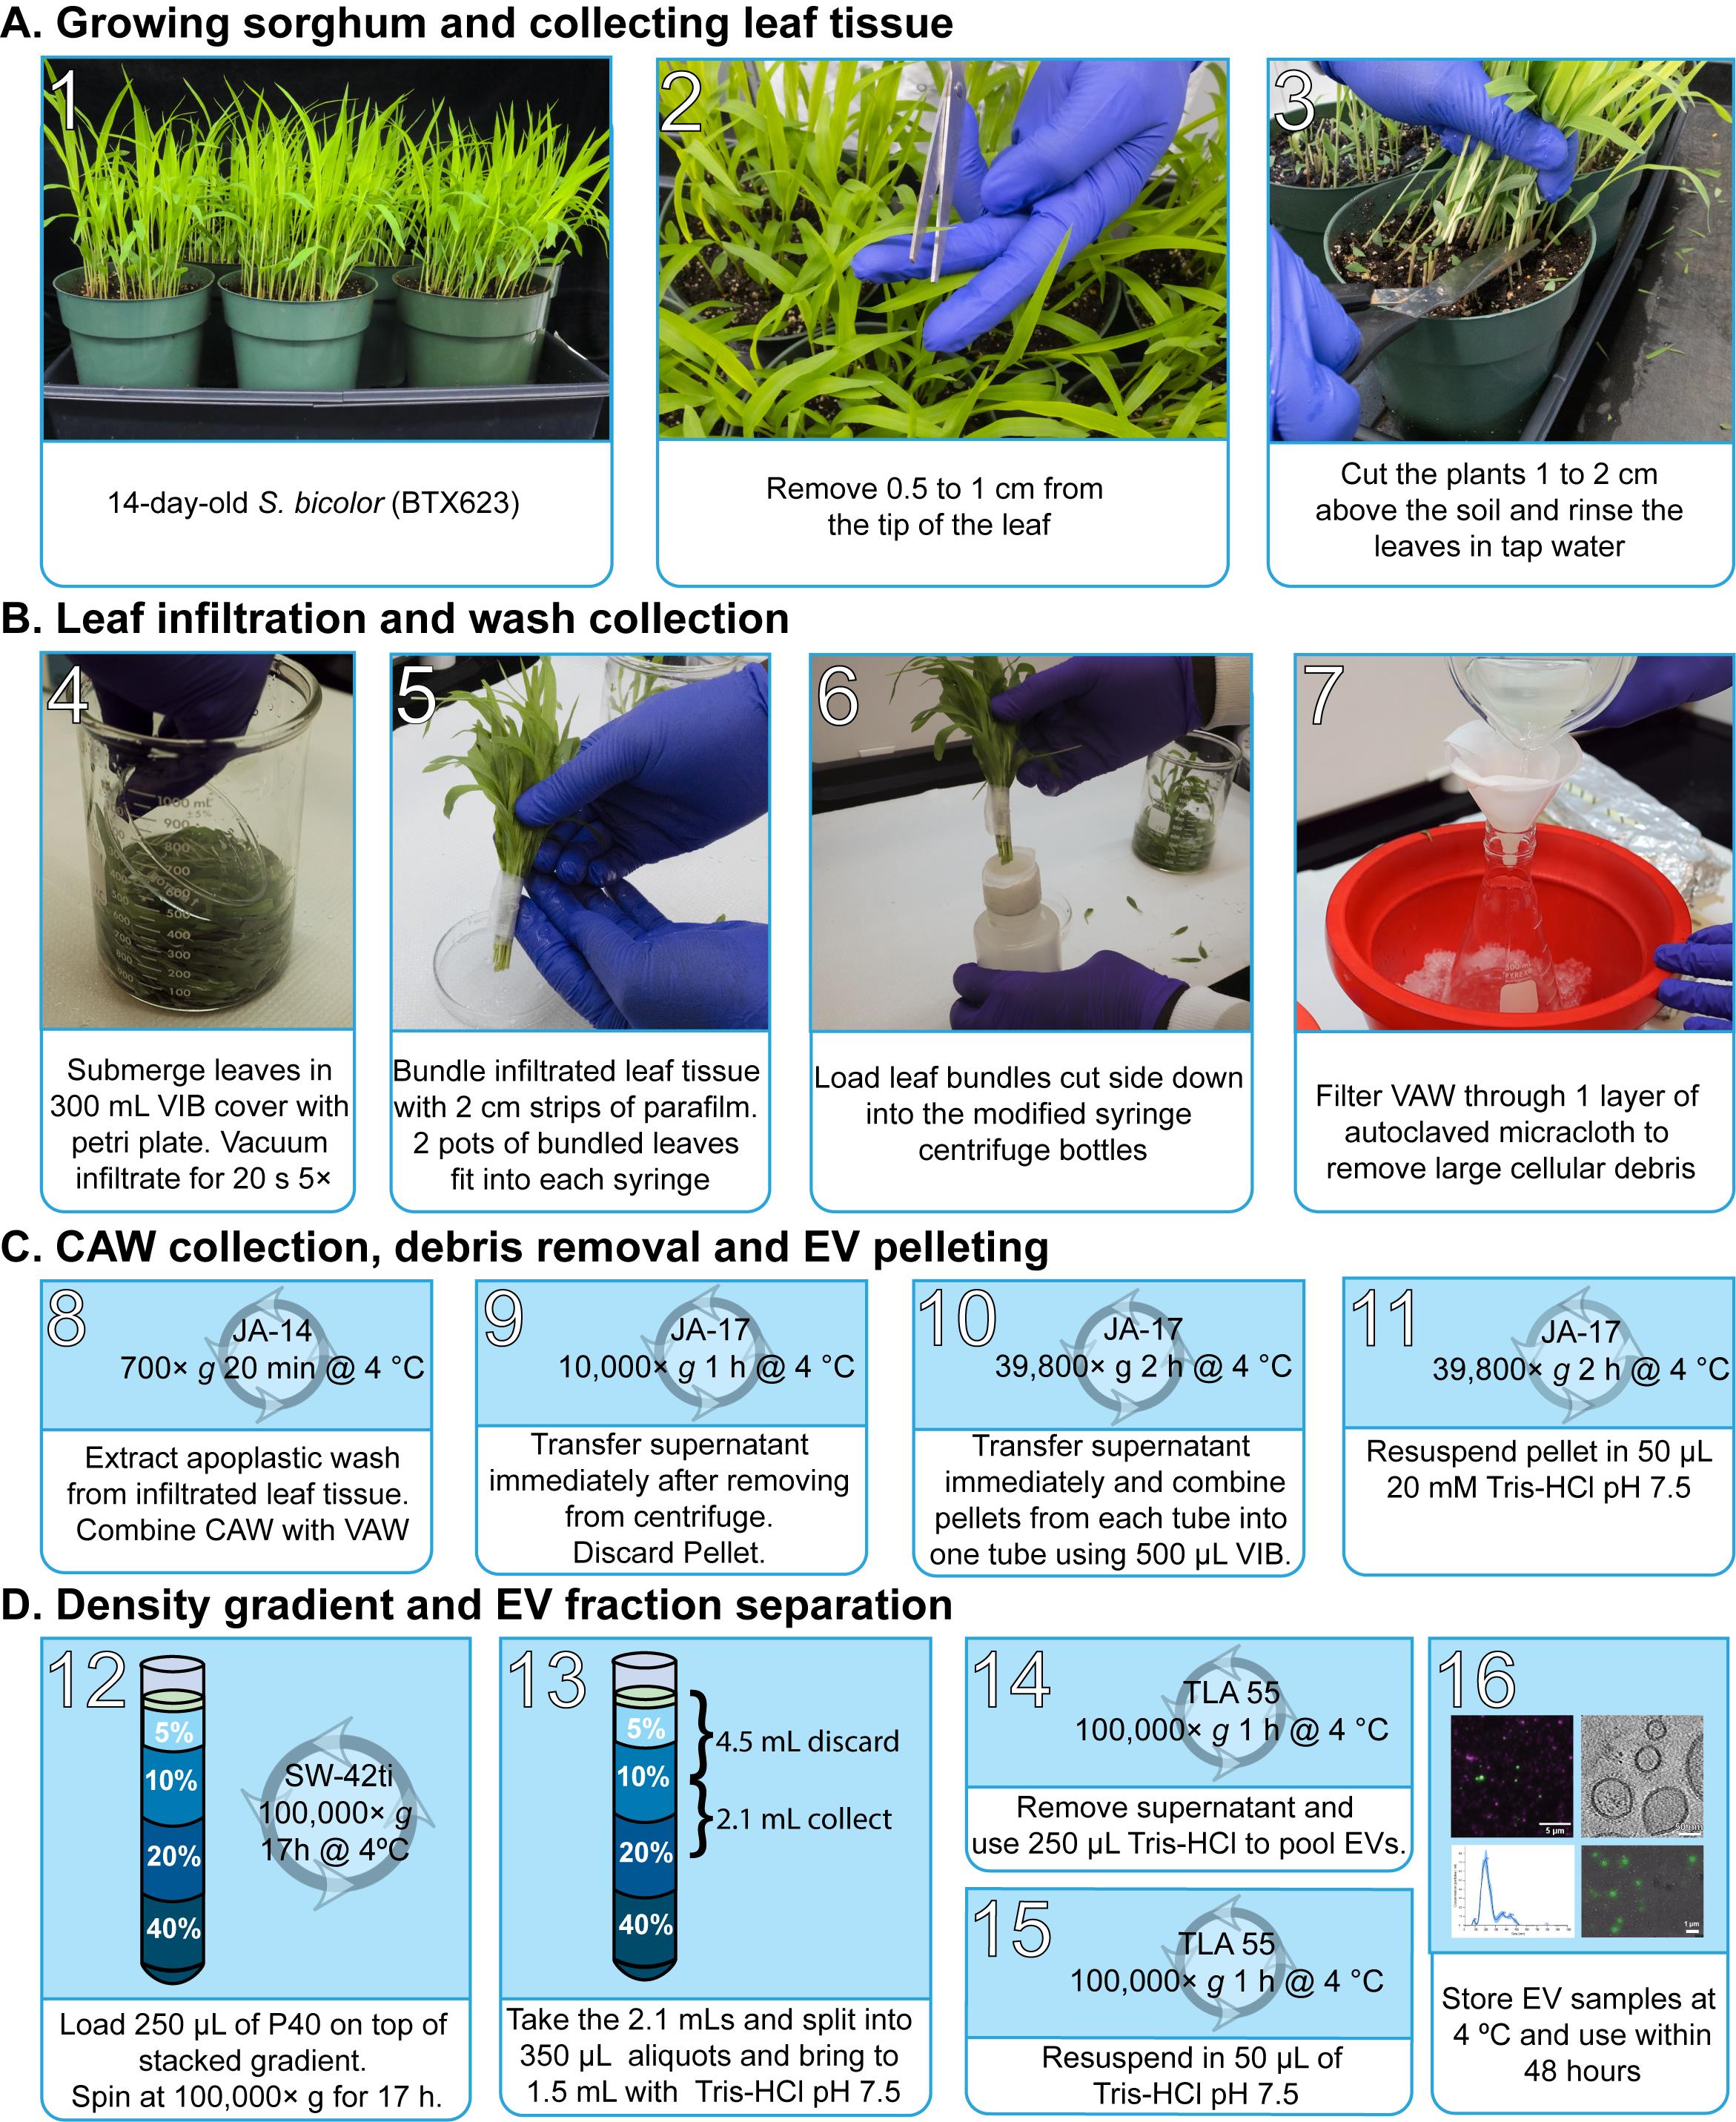
Figure 1. General workflow. Images showing the continuous processes for sorghum extracellular vesicles (EV) isolation and subsequent density gradient purification. Total process time is ~24 h. Vesicle isolation buffer (VIB), vacuum apoplastic wash (vAW), centrifuge apoplastic wash (cAW).
Growing sorghum and collecting leaf tissue
Sow sorghum seeds in a 6” pot containing pro-mix BK55 growing medium.
Grow for 14 days in a greenhouse or growth chamber with 16/8 h light/dark cycle at a temperature of 27 and a light intensity of 350 µmol/m2/s. Maintain 65% relative humidity.
Before harvesting leaves, cut 0.5 cm of the leaf tips of each plant to allow for better vacuum infiltration of the VIB buffer.
Harvest the plants above the soil with scissors and then rinse in water twice to remove damaged plant materials and soil residue.
Leaf infiltration and vacuum apoplastic wash collection
Plants should be submerged in batches for vacuum infiltration in a 1 L beaker containing 300 mL of VIB buffer. Place the beaker inside the vacuum chamber at -0.1 MPa for 20 s; this should be repeated five times, shuffling the leaves after every cycle.
Note: Ensure all the plants are fully submerged in VIB buffer. Place a glass Petri dish on the plant to keep the leaves fully submerged.
Collect the plants in small batches and wrap them into bouquets with a small strip of parafilm.
Filter the remaining buffer through Miracloth to remove debris and store the vacuum apoplastic wash (vAW) on ice.
Centrifugal apoplastic wash collection, debris removal, and EV pelleting
Modify a 60 mL syringe by cutting off the end and wrapping it with 3 cm of parafilm (Figure 2).
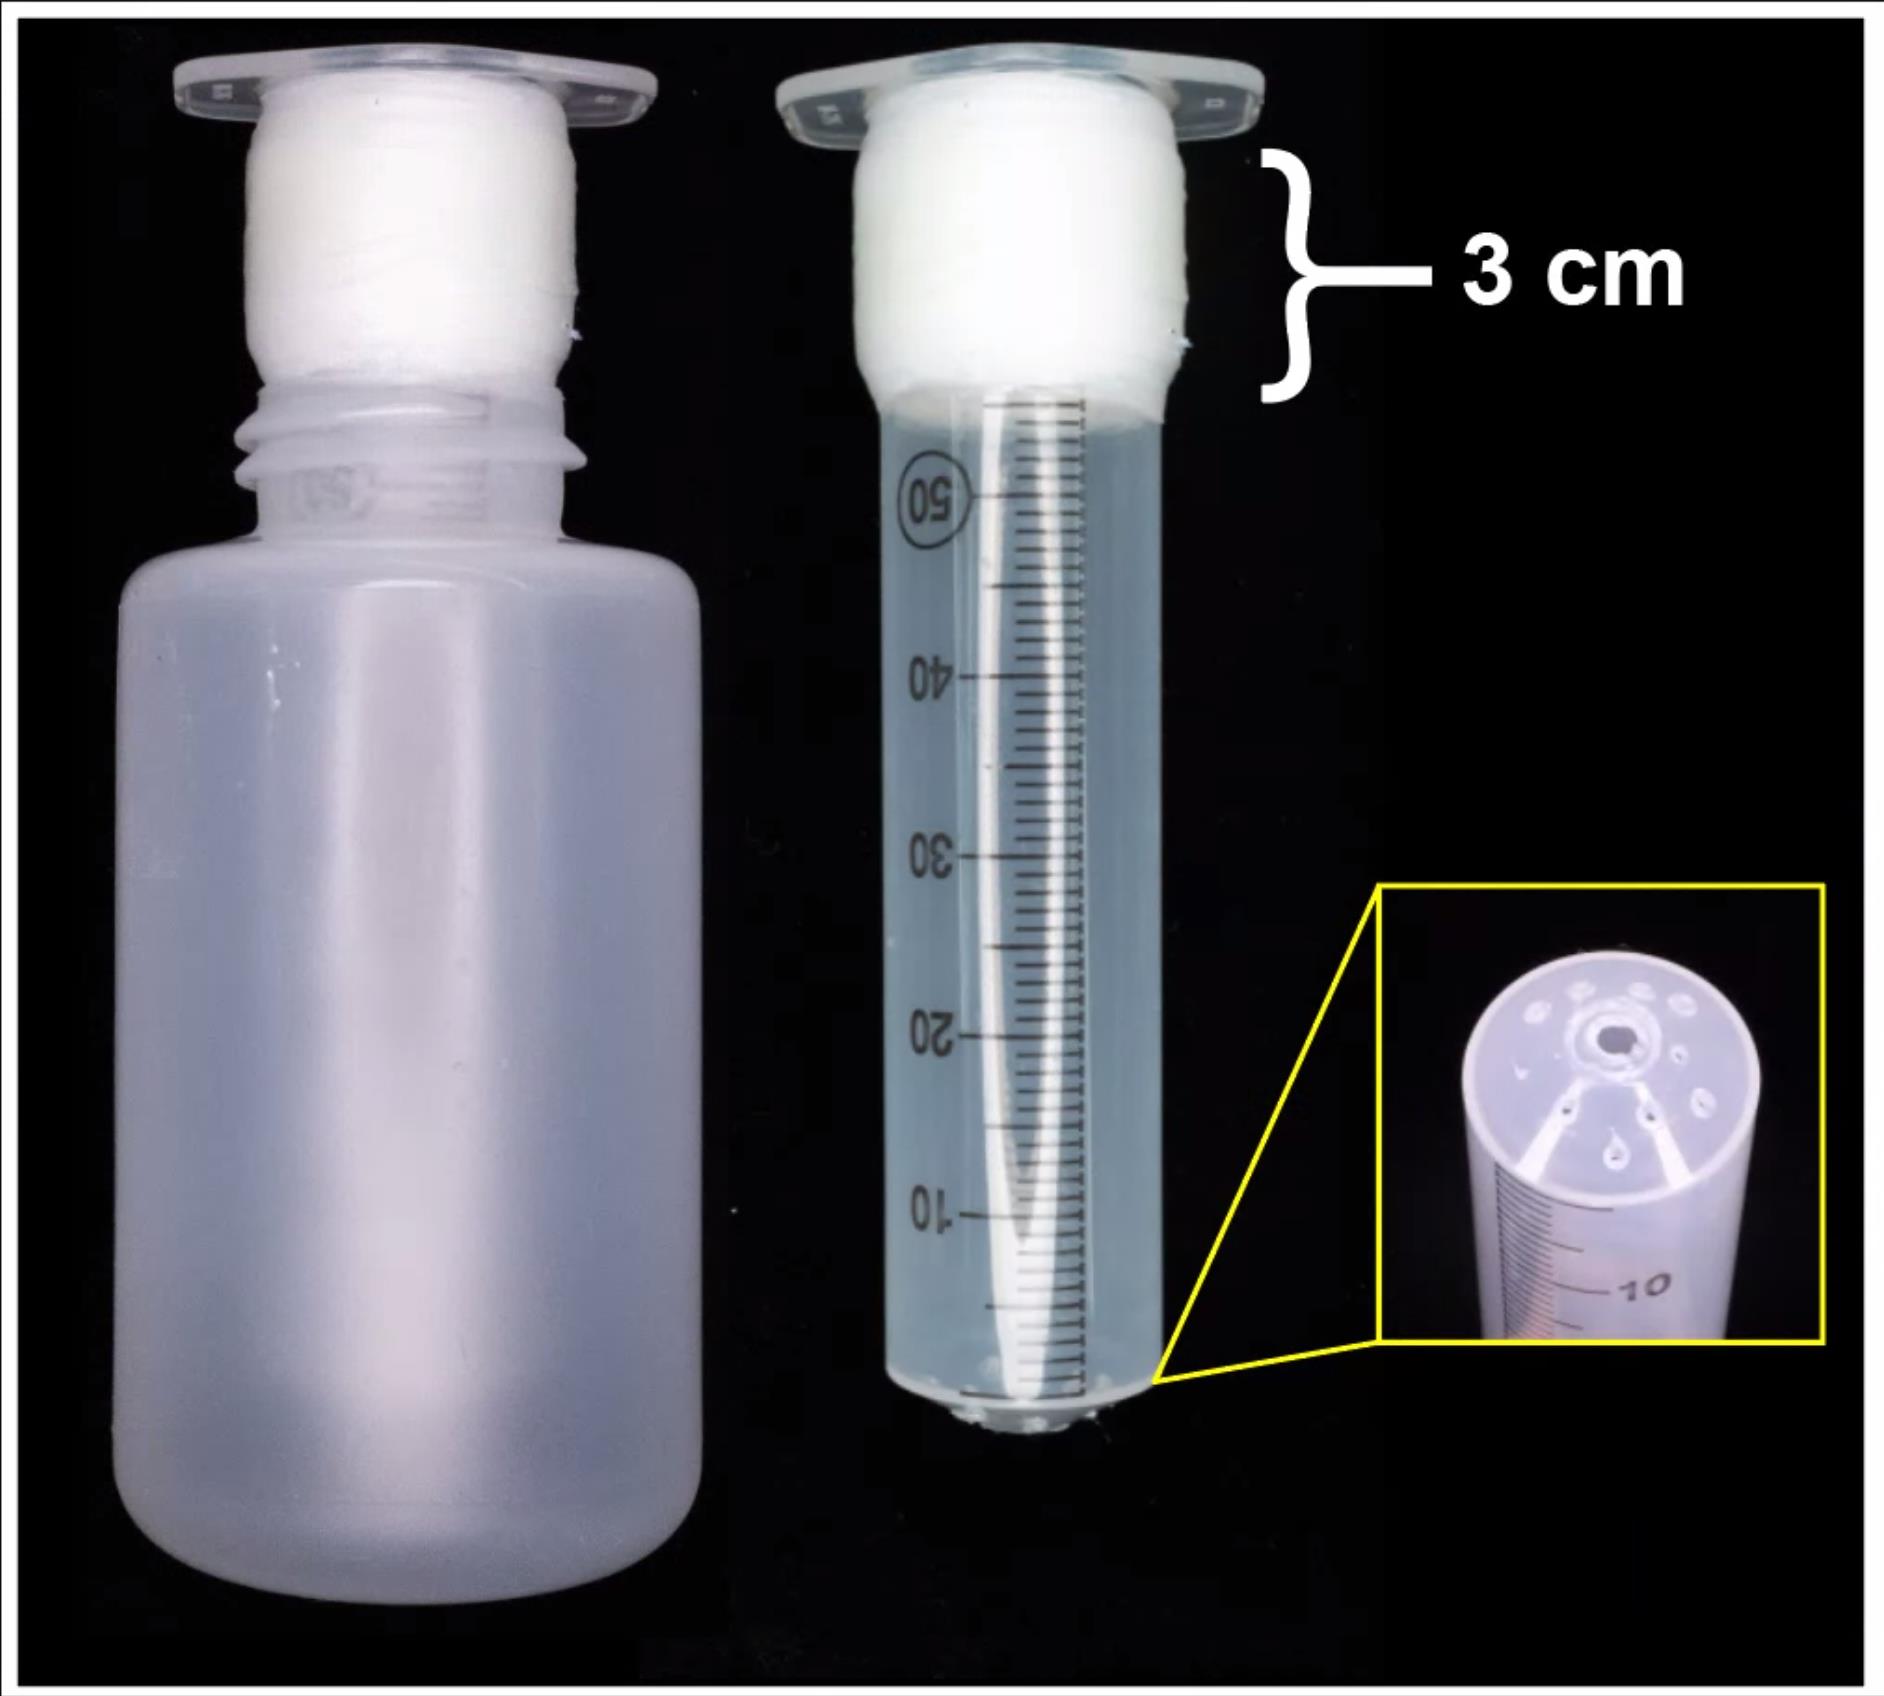
Figure 2. Apoplastic wash collection. Image showing 250 mL Nalgene bottles with 60 mL syringe modification for centrifuge apoplastic wash (cAW) isolation from Sorghum bicolor plants. The syringe is wrapped with parafilm (3 cm) to create a stopper between the tube and the syringe. The layer of parafilm is approximately 3 mm thick.Widen the opening of the 250 mL Nalgene bottle with an 8-inch half-round file until the 60 mL syringe smoothly slides into the bottle.
Place the bouquets of infiltrated leaves stem down inside 60 mL syringes and load them into 250 mL centrifuge bottles.
Centrifuge the 250 mL bottles containing the infiltrated leaves at 700× g for 30 min at 4 to generate the centrifuge apoplastic wash (cAW) using a JA-14 rotor in an Avanti J-26S XP centrifuge.
Combine the cAW with the vAW and load into 50 mL polypropylene centrifuge tubes.
Centrifuge at 10,000× g for 1 h at 4 using the JA-17 rotor in an Avanti J-26S XP centrifuge.
Decant the supernatant as soon as the tubes are removed from the rotor into new 50 mL polypropylene centrifuge tubes.
Centrifuge at 39,800× g for 2 h at 4 °C. Carefully decant the supernatant and discard, resuspend the pellets in chilled VIB buffer, and pool together.
Note: Before decanting, mark the side of the tube close to the wall of the rotor with a sharpie; that is where the majority of the pellets are settled. This step is done beside the centrifuge to prevent agitation of the pellet settled on the side of the tube.
Centrifuge the resulting solution at 39,800× g for 2 h at 4 °C.
Decant the supernatant and resuspend the pellet (P40) in 100–250 µL of 0.2 µm-filtered 20 mM Tris-HCl, pH 7.5.
Density gradient and EV fraction separation
Using 60% aqueous iodixanol stock solution, prepare 40% (v/v), 20% (v/v), 10% (v/v), and 5% (v/v) iodixanol dilutions in VIB buffer.
Prepare a discontinuous density gradient column by carefully layering 3 mL of 40% solution, 3 mL of 20% solution, 3 mL of 10% solution, and 2 mL of 5% solution in a 14 mm × 89 mm (13.2 mL) thin-walled ultra-clear centrifuge tube.
Add 100–250 µL of the crude EV pellet resuspended in 20 mM Tris-HCl, pH 7.5 to the top of the discontinuous density gradient.
Centrifuge at 100,000× g for 17 h at 4 °C and at the maximum acceleration and deceleration using a SW 41 Ti rotor in an Optima L-90K.
After ultracentrifugation, discard 4.5 mL of the solution from the top of the gradient and collect the next 2.1 mL fraction from the gradient. Divide this fraction into six 350 µL aliquots in Beckman Coulter 1.5 mL microfuge tubes. Bring the volume in each tube up to 1.5 mL using VIB buffer.
Centrifuge the tubes at 100,000× g for 1 h at 4 °C using a TLA 55 rotor and an Optima Max ultracentrifuge.
Resuspend the pellets from the tubes and pool them together with 250 µL of Tris-HCl, pH 7.5. Bring the volume up to 1.5 mL using Tris-HCl, pH 7.5.
Centrifuge again at 100,000× g for 1 h at 4 °C. The final pellet containing the gradient-purified EV (GPEV) fraction will be resuspended in 50 µL of 20 mM Tris-HCl, pH 7.5. Keep the purified EVs at 4 °C and ensure downstream assays are done within 48 h.
Labeling and imaging of EVs
Prior to imaging, place 0.5 mL of poly-L-lysine on a clean cover glass and incubate for 30 min at room temperature (RT) (see cover glass cleaning protocol in Section F).
Aspirate poly-L-lysine off the cover glass.
Note: Ensure this is done from the edge of the cover glass to avoid scratching the surface of the cover glass after poly-L-lysine has been added.
Wash the cover glass three times with copious HPLC-grade water.
Note: This can be done by dipping the cover glass in HPLC-grade water using forceps.
Arrange the cover glass in a dish with the coated side up.
Bake at 50 °C for 1 h. Let the cover glass cool to RT.
Cut a secure seal spacer in half, remove the paper backing, and mount on a cover glass (Figure 3).
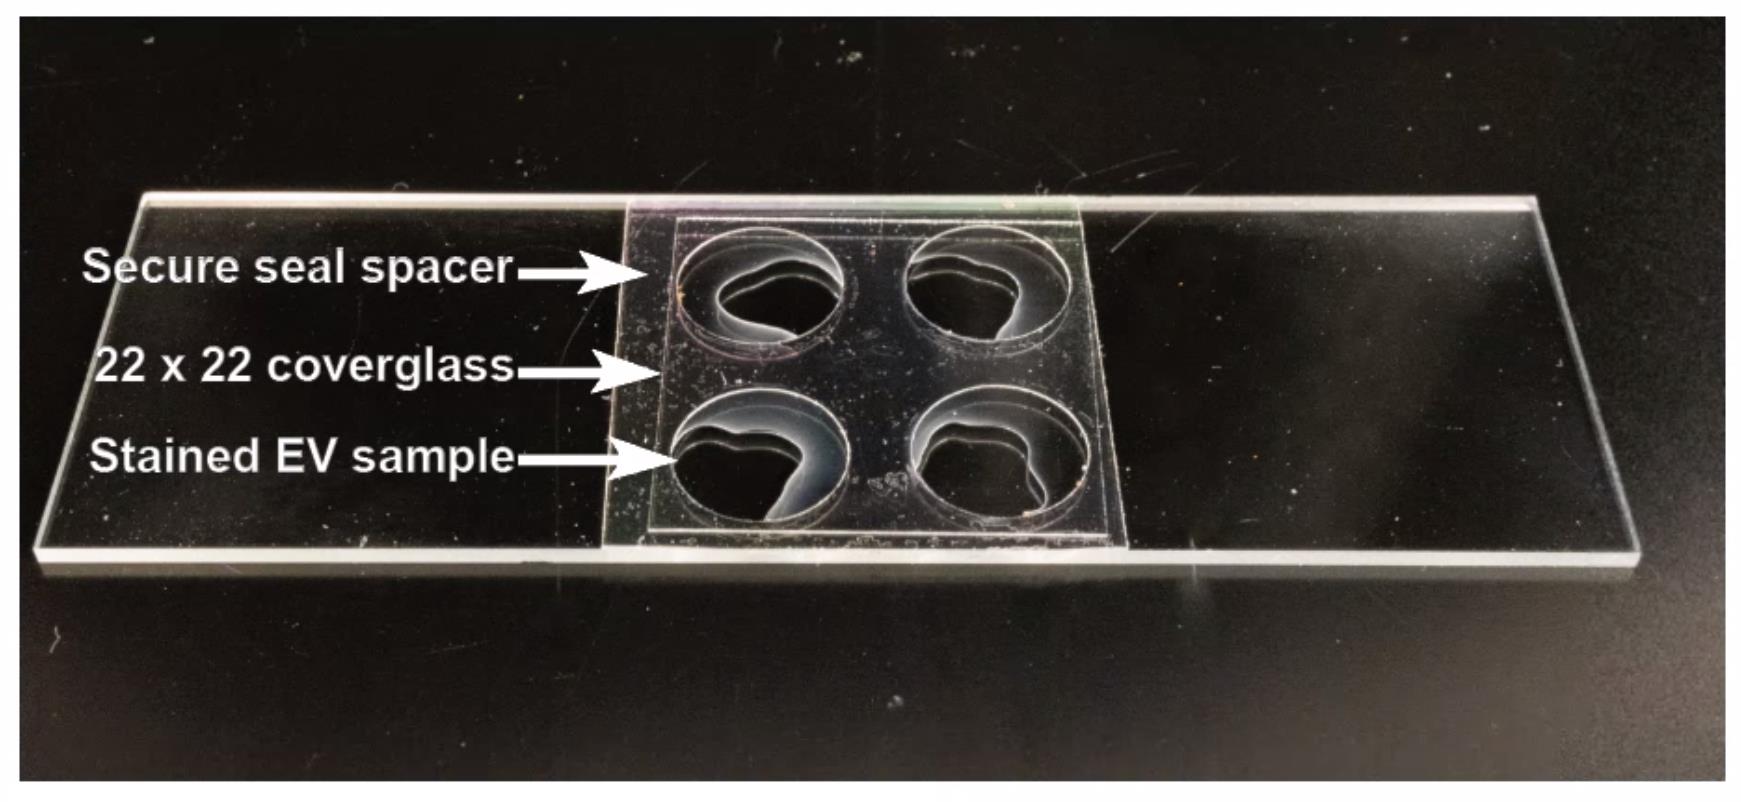
Figure 3. Picture showing stained extracellular vesicle (EV) samples mounted on a microscope slide partitioned with a secure seal spacer and sealed with a poly-L-lysine-treated 22 × 22 cover glass. EV samples were stained with Calcein AM and Potomac Gold. Trypan blue was added to quench unbound Potomac Gold dye.In a 1.5 mL tube, mix 5 µL of EVs with 5 µL of 1 µM Calcein AM stain. Incubate at RT for 30 min.
Apply 1 µL of labeled EVs to an individual secure seal spacer well on the poly-L-lysine-coated cover glass.
Add 1 µL of 1 µM Potomac Gold stain to a final concentration of 500 nM.
Quench the background fluorescence of Potomac Gold adding an equal volume of 100 nM trypan blue for a final concentration of 50 nM.
Note: Using only 4 µL prevents mixing between wells.
Remove the waxed paper secure seal spacer cover to expose the other side of the adhesive sticker and apply a clean microscope slide on top.
Image the samples using total internal reflection fluorescence (TIRF) or spinning disk confocal microscopy (Figure 4). Use typical excitation and emission settings for green-fluorescent dyes for Calcein AM and red-fluorescent dyes for Potomac Gold.
Note: See Figure 4 for green and red fluorescent imaging parameters we used on the Andor Dragonfly 600. Standard 488 nm and 561 nm excitation can be used for green and red, respectively, and the fluorescence signal should be excited and collected sequentially.
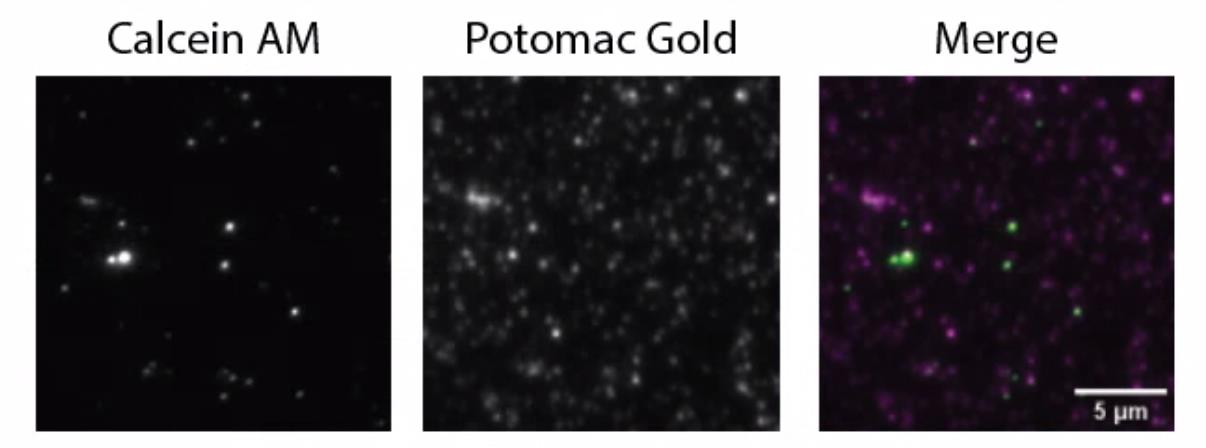
Figure 4. Calcein AM and Potomac Gold staining of extracellular vesicles (EVs) isolated from Sorghum bicolor. Trypan blue (50 nM) was added to quench the unbound Potomac Gold. Samples were imaged on an Andor Dragonfly 600 microscope with total internal reflection fluorescence (TIRF) using a 500 ms exposure time and four averaging on a Zyla 4.2 PLUS sCMOS camera. For Calcein AM, 3% 488nm excitation (3.3 mW) and a 521/38 nm bandpass (BP) filter (TR-DFLY-F521-038) were used. For Potomac Gold, 5% 561 nm laser (4.0 mW) and 594/43 nm BP filter (TR-DFLY-F594-043) were used.
Cover glass cleaning and modification for correlative light and electron microscopy
Put the cover glasses in a Wash-N-DryTM coverslip rack and change the solutions in a 100 mL glass beaker.
Sonicate cover glasses for 30 min in 95% IPA, covering the beaker with parafilm to reduce evaporation.
Wash five times with 10 mL of Milli-Q H2O for a total of 50 mL.
Sonicate with 5 N NaOH and cover with parafilm.
Note: Do not use aluminum foil for this step. The NaOH will react with the foil and create aluminum oxide and hydrogen gas.
Wash five times with Milli-Q H2O.
Sonicate with 100% EtOH for 30 min.
Wash with copious amounts of HPLC water and place in a drying rack, skipping spaces between cover glasses to allow for airflow.
Air dry at RT for at least 1 h or bake at 50 °C for 30 min.
Place the cover glass grid side up (arrow on the left-hand side pointing away from you) on standard microscope slides that are taped to a 10 cm Pyrex Petri dish (Figure 5).
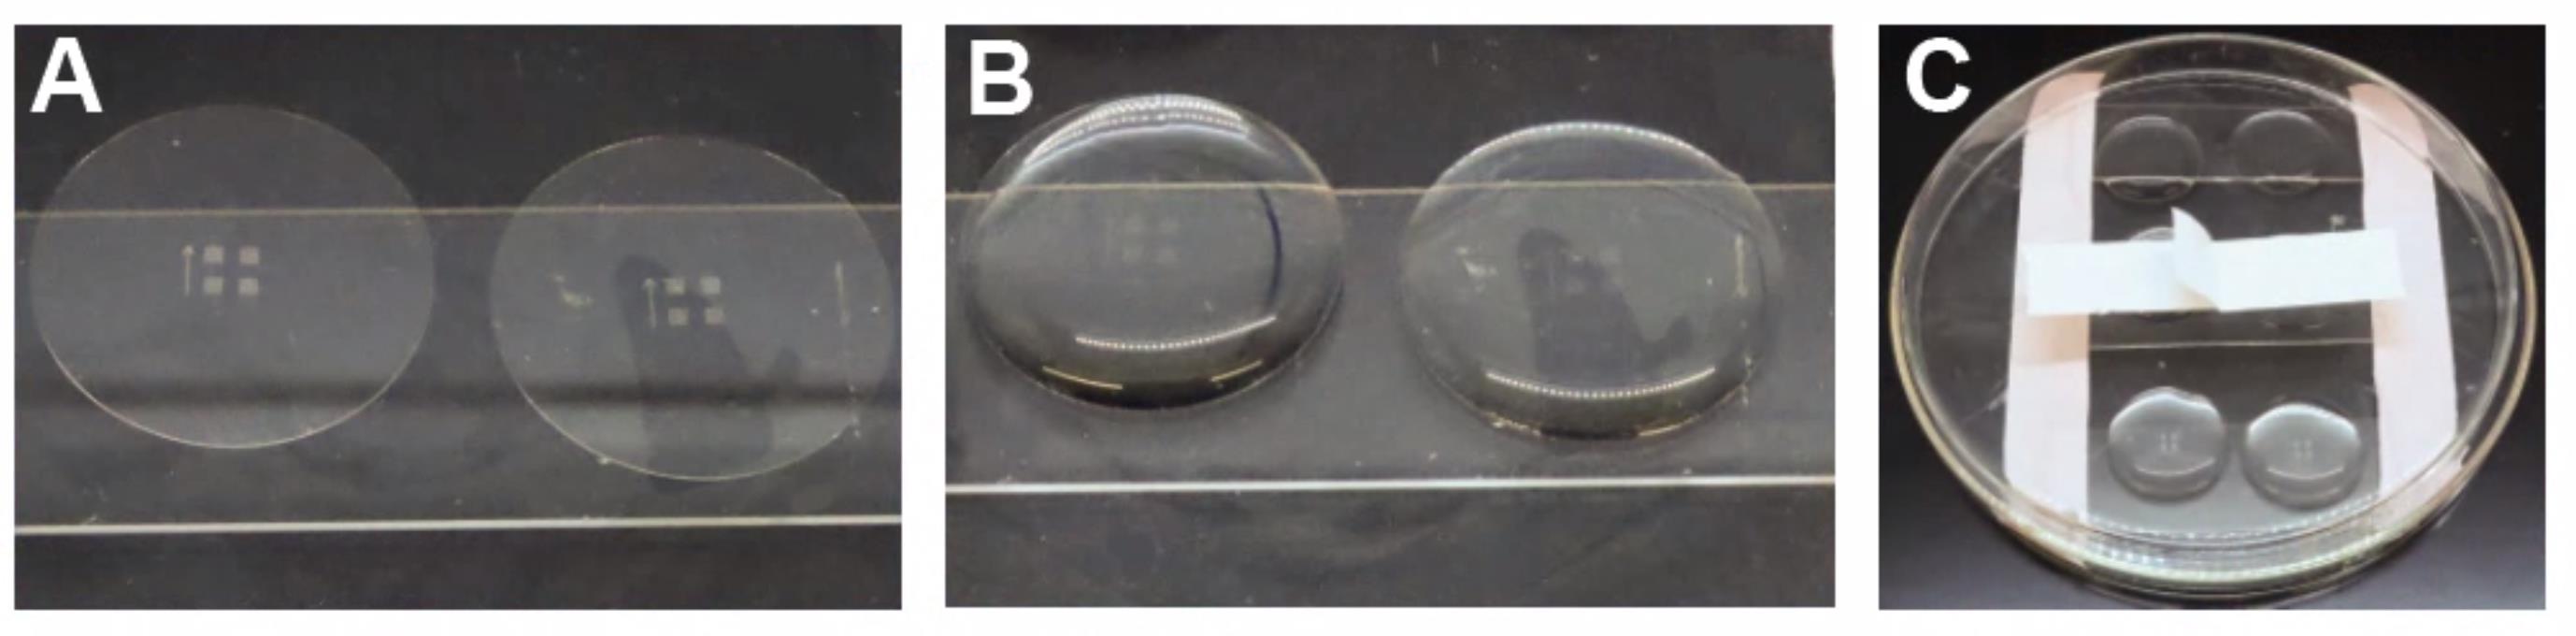
Figure 5. A 10 cm glass Pyrex Petri dish with standard microscope glass slides taped in place. A) Ibidi cover glasses with an edge hanging off of a slide to allow for easier manipulation with forceps. B) Representative image showing solutions added to the top of the cover glass. C) Petri dish covered during incubation steps to reduce evaporation. Cover the cover glass with 1 mL of 100% IPA. Incubate for 1 min and remove.Bake off the excess IPA at 50 °C for 30 min and cool the dried cover glass to RT.
Passivate the clean cover glasses with 0.2 µm-filtered 0.1 N NaOH for 20 min.
Hold the cover glass with forceps and rinse three times with 15 mL of HPLC water.
Remove excess water.
Bake at 50 °C and let cool to RT.
Apply 5% APTES in 95% IPA for 10 min.
Using a pipette, aspirate off the remaining APTES solution.
Hold the cover glass with forceps and rinse 5× with 15 mL of HPLC water. Between rinses, put down the cover glass and pick up from a different location to ensure no APTES is left behind.
Notes:
If modification was successful, water should slide off the cover glass.
If APTES is not washed off completely, the residual will generate a brown precipitate that will interfere with imaging.
Let the cover glass dry completely for at least 1 h at RT.
Apply 1 mL of 1% glutaraldehyde fixative (see Recipes). Incubate for 1 h at RT.
Remove glutaraldehyde fixative.
EV attachment and imaging by light microscopy
Add 5 µL of 1 µM Calcein AM stain to 5 µL of EVs and incubate at RT for 30 min.
Add 5 µL of 1 µM Potomac Gold. Incubate for 5 min.
Add 10 µL of 100 nM trypan blue. Incubate for 5 min.
Remove excess and gently wash 3× with 20 mM Tris-HCl, pH 7.5.
Note: This will remove the vesicles that have not covalently attached to the cover glass. Unattached vesicles will show up on light microscopy but will vanish in electron microscopy processing.
Immediately add 0.5 mL of additional Tris-HCl, pH 7.5 to prevent drying.
Note: Do not let vesicles dry to glass, it will change the morphology.
Place into an Attofluor cell chamber and add additional Tris-HCl, pH 7.5 as necessary.
Use total internal reflection microscopy (TIRFM) or spinning disc confocal with a 63× 1.4 NA oil objective, taking a tiled z-stack to capture the grid location on the cover glass.
Deconvolve and stitch the images.
Carefully remove most of the Tris-HCl and slowly add 200 µL of 2% glutaraldehyde fixative.
Note: For all of the remaining steps, do not pipette over the sample to prevent dislodging the EVs.
Incubate for 30 min.
Remove glutaraldehyde fixative and gently wash 3× with HPLC water.
Critical point drying
Remove HPLC water and gently add 25% HPLC-grade ethanol. Incubate for 5 min.
Remove solution and add 50% HPLC-grade ethanol. Incubate for 5 min.
Remove solution and add 75% HPLC-grade ethanol. Incubate for 5 min.
Remove solution and add 95% HPLC-grade ethanol. Incubate for 5 min.
Remove solution and add 100% molecular-grade ethanol. Incubate for 5 min.
Remove solution and add 100% molecular-grade ethanol. Keep in ethanol until loaded into a critical point dryer.
Fill the Tousimis Autosamdri critical point dryer with 100% molecular grade ethanol.
Run samples following the manual with the purge timer set to 3.
Scanning electron microscopy (SEM) correlative imaging
Mount samples on an aluminum SEM stub with ultra-smooth carbon adhesive tabs and coat with a 5 nm layer of platinum using a sputter coater (Leica ACE600 coater) (Figure 6).
Brush conductive silver paint on the edge of the coated cover glass to reduce charging on the glass.
Load the sample into the SEM and image (Figure 6).
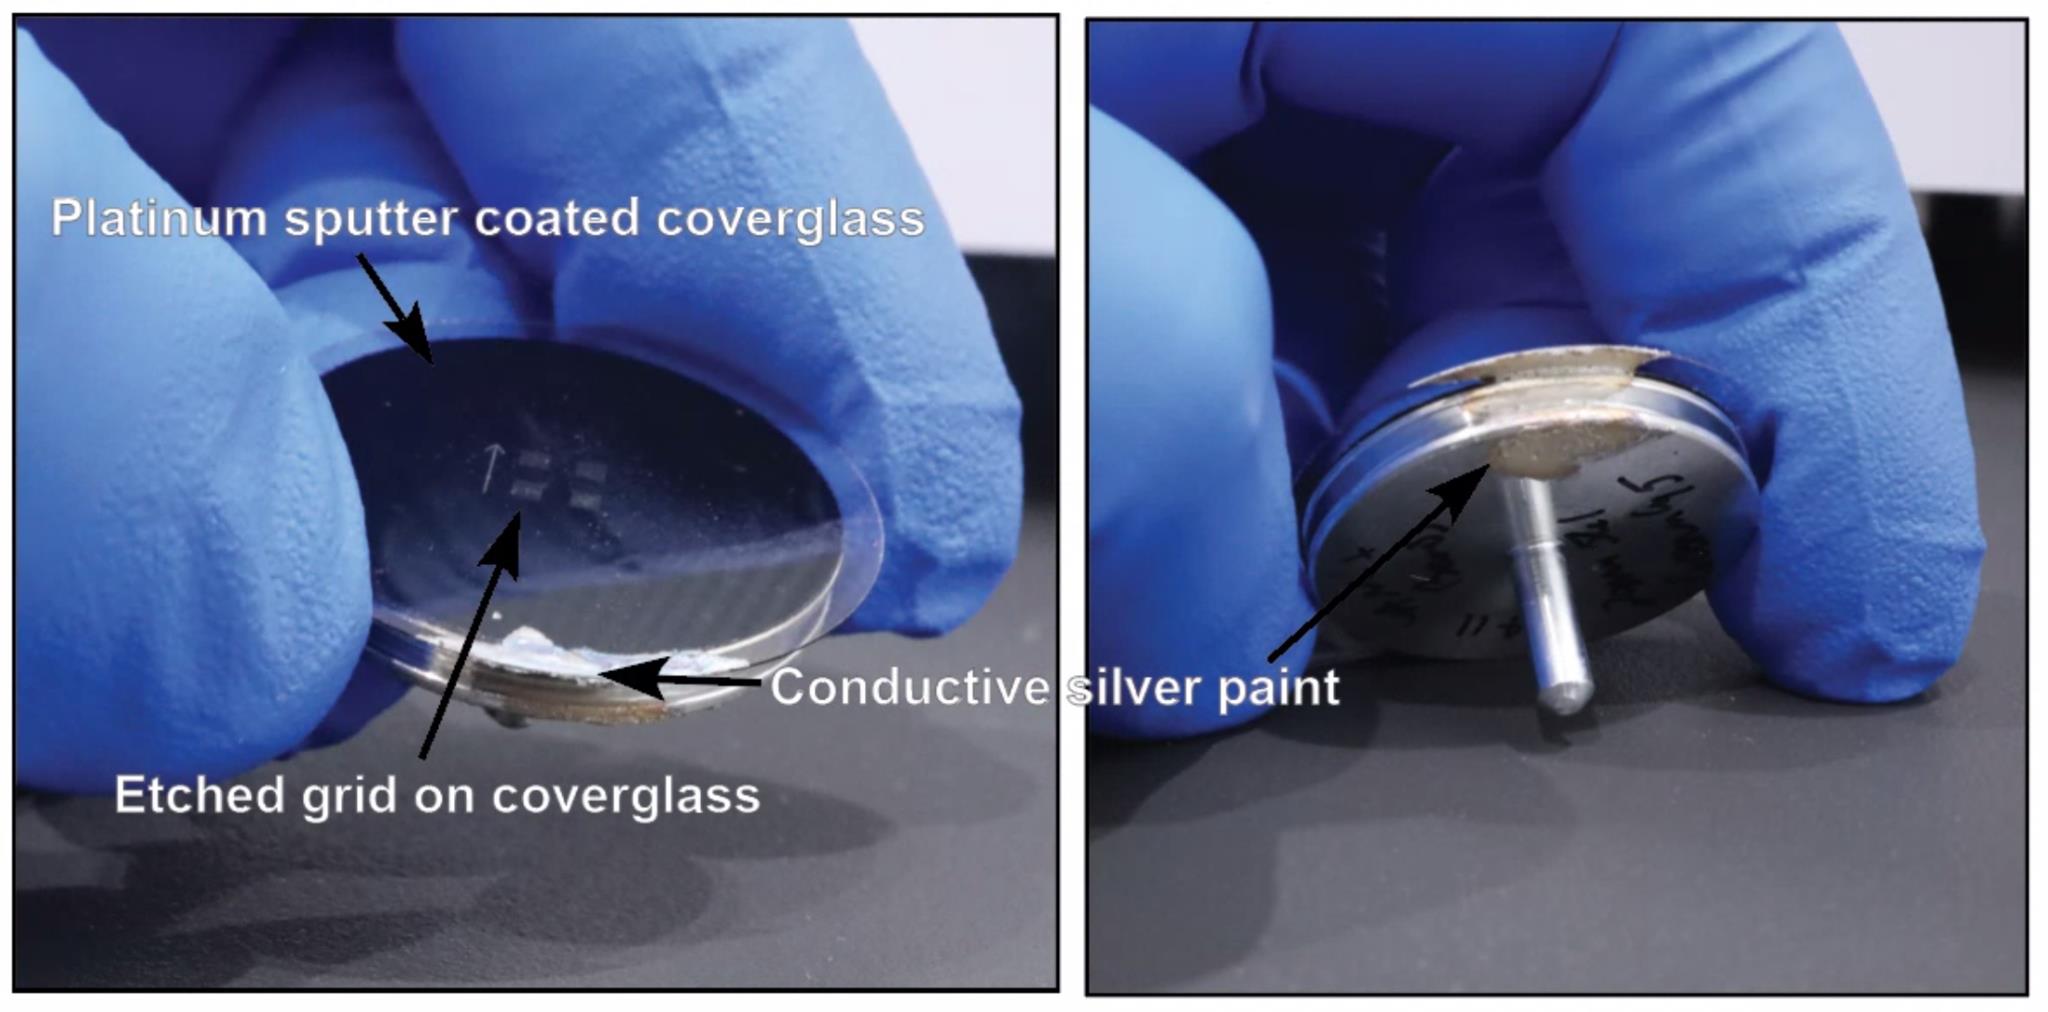
Figure 6. Sputter-coated and mounted cover glass. PELCO conductive silver paint was brushed on to connect the top and bottom of the glass to prevent charging on the sample.
Image processing and correlation
Load the .ims image file taken on the Dragonfly microscope and stitch them using the Imaris Stitcher 9.0. Save the merged image as a new file.
Open the .ims file in FIJI and find the five slices of the Z-stack that contain Calcein AM and Potomac Gold stained EVs. Subset these slices.
Run Z project, select Max intensity, and hit OK.
Adjust the brightness and contrast to clearly show the vesicles.
If this is a multichannel image, save both the merged as well as splitting each channel individually.
Select each individual channel image and merged channels and run Flatten. This will set the display settings and merge the channels into a single flat image. This is necessary to view the image in the MAPS software.
Save the new image as a .tif.
Mount the cover glass on a stub (Figure 6) and load into the SEM. Put under vacuum, image with a fast scan to navigate, and find the grid. Select a region that has a good distribution of EVs and take a tiled high-resolution image with a 4,096 × 4,096 image size, a 2 nm pixel, and 1 µs dwell time.
Note: For increased correlation success, ensure the tiled region overlaps with the laser-etched portions of the grid.
Import the maximum intensity projection from ImageJ into MAPS 3.9
In the MAPS software (v3.9) on the Apreo SEM, follow the correlation wizard. Use the corners of the LM and SEM grid squares for the first rough alignment, and then refine the alignment using the EVs (Figure 7).
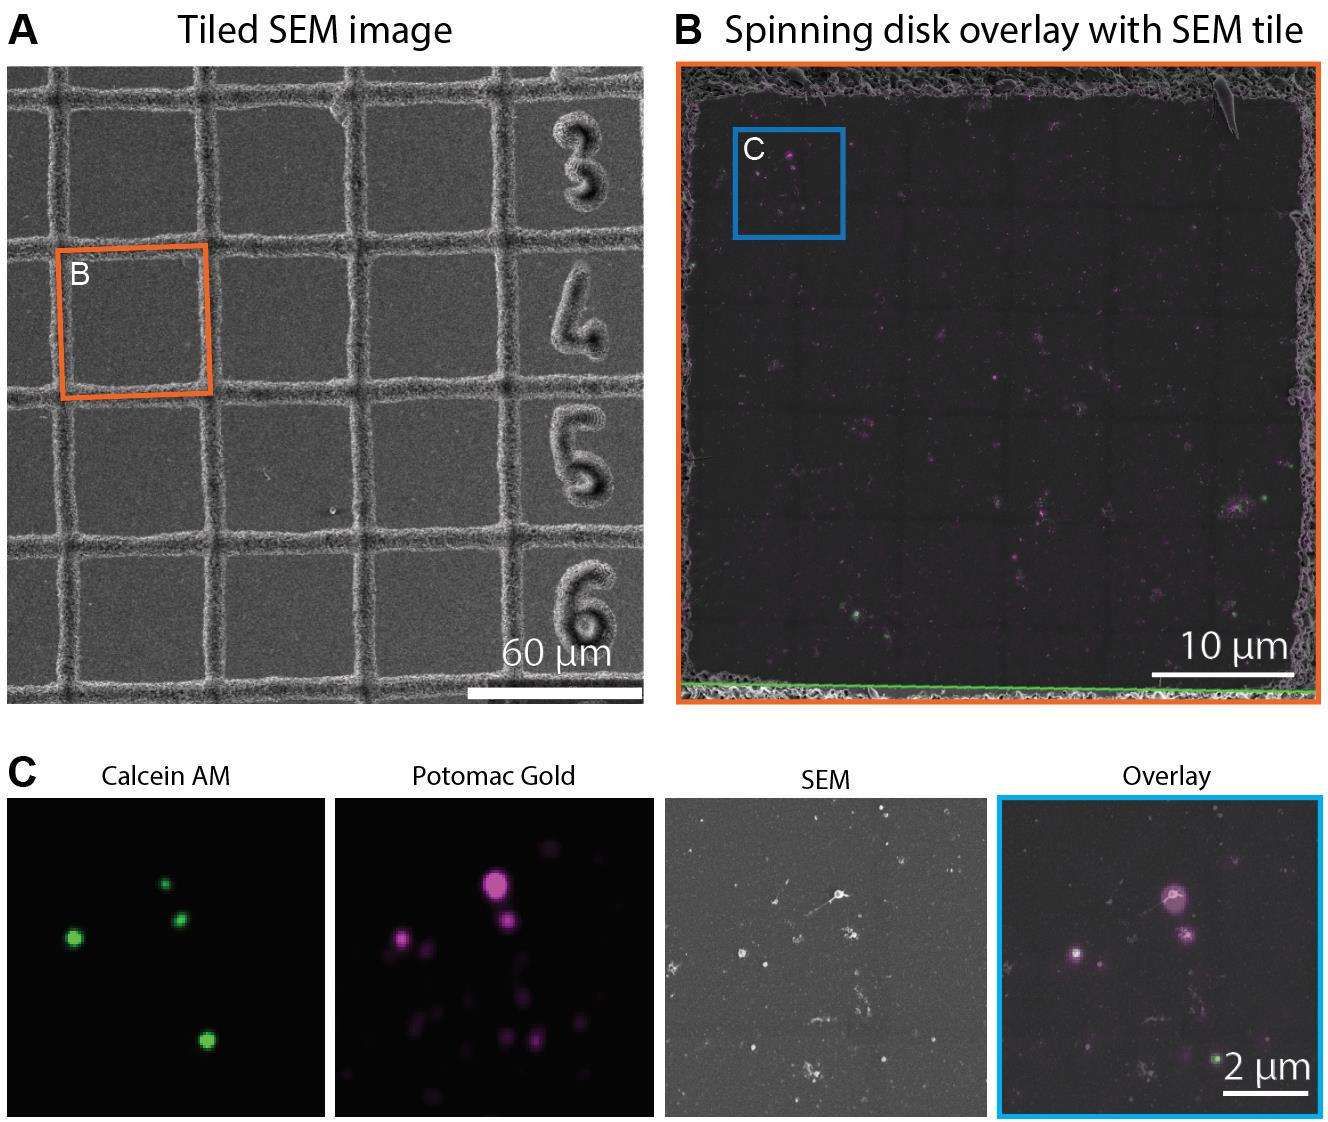
Figure 7. Correlative light and electron microscopy with Calcein AM and Potomac Gold labeled extracellular vesicles (EVs). A) Large overview scanning electron microscopy (SEM) image gridded section that was previously imaged via spinning disk or total internal reflection fluorescence (TIRF) microscopy. B) An overlay image showing the TIRF image of Calcein AM (Green) and Potomac Gold (magenta) labeled EVs data aligned with the SEM image. Images were aligned in MAPS software version 3.9. C) Inset showing a magnified view of the boxed area in (B).
Image correlation with FIJI ImageJ (alternate protocol)
Note: For our analysis, we used the MAPS software as described in section J (steps 7–10). However, the MAPS software is limited to Thermo Fisher SEMs and, therefore, we have provided an alternate protocol for image correlation using FIJI ImageJ.
Load both the SEM and light microscopy images into FIJI.
Convert both images to 16-bit.
Using the line tool, draw a line connecting two points in each image that should correlate.
Run Align image by ROI. Set the LM image as the source and the SEM image as the target. Select Scale and Rotate. Click OK. This will generate a 32-bit grayscale image in a new window.
Convert the new image to 16-bit.
Run Merge Channels.
Set the aligned image as a colored channel and the SEM image as gray. Check Create composite and Keep source images. Keeping the source images is necessary if you want to go back and refine the aligned image.
Repeat using the line tool and Align image by ROI to refine the alignment.
Validation of protocol
This protocol or a part of it has been used and validated in the following research articles:
Chaya et al. [19]. The extracellular vesicle proteomes of Sorghum bicolor and Arabidopsis thaliana are partially conserved. Plant Physiology (Figures 1–5).
Acknowledgments
This protocol was adapted from Chaya et al. [19]. This work was supported by a grant from the Department of Energy (DOE) Office of Biological and Environmental Research (BER) program DOE (DE-SC0020348) and in part by a seed grant from the College of Agriculture and Natural Resources at the University of Delaware. Microscopy equipment and data storage was acquired by shared instrumentation grants from the National Institutes of Health (S10 OD030321, S10 OD025165, and NIH S10 OD028725), and microscopy access was supported by grants from the National Institute of General Medical Sciences (P20 GM103446 and P20 GM139760) and the State of Delaware.
Competing interests
There are no conflicts of interest or competing interest.
References
- Baldrich, P., Rutter, B. D., Karimi, H. Z., Podicheti, R., Meyers, B. C. and Innes, R. W. (2019). Plant Extracellular Vesicles Contain Diverse Small RNA Species and Are Enriched in 10- to 17-Nucleotide “Tiny” RNAs. Plant Cell. 31(2): 315–324.
- Cui, Y., Gao, J., He, Y. and Jiang, L. (2020). Plant extracellular vesicles. Protoplasma. 257(1): 3–12.
- Cai, Q., Qiao, L., Wang, M., He, B., Lin, F. M., Palmquist, J., Huang, S. D. and Jin, H. (2018). Plants send small RNAs in extracellular vesicles to fungal pathogen to silence virulence genes. Science. 360(6393): 1126–1129.
- Abubakar, Y. S., Sadiq, I. Z., Aarti, A., Wang, Z. and Zheng, W. (2023). Interplay of transport vesicles during plant-fungal pathogen interaction. Stress Biol. 3(1): 35.
- Halperin, W. and Jensen, W. A. (1967). Ultrastructural changes during growth and embryogenesis in carrot cell cultures. J Ultrastruct Res. 18: 428–443.
- Rutter, B. D. and Innes, R. W. (2023). Extracellular Vesicles in Phytopathogenic Fungi. Extracell Vesicles Circ Nucl Acids. 4(1): 90–106.
- Hua, C., Zhao, J. H. and Guo, H. S. (2018). Trans-Kingdom RNA Silencing in Plant–Fungal Pathogen Interactions. Mol Plant. 11(2): 235–244.
- Huang, C. Y., Wang, H., Hu, P., Hamby, R. and Jin, H. (2019). Small RNAs – Big Players in Plant-Microbe Interactions. Cell Host Microbe. 26(2): 173–182.
- Iwakawa, H. o. and Tomari, Y. (2013). Molecular Insights into microRNA-Mediated Translational Repression in Plants. Mol Cell. 52(4): 591–601.
- Wang, S., He, B., Wu, H., Cai, Q., Ramírez-Sánchez, O., Abreu-Goodger, C., Birch, P. R. and Jin, H. (2024). Plant mRNAs move into a fungal pathogen via extracellular vesicles to reduce infection. Cell Host Microbe. 32(1): 93–105.e6.
- Weiberg, A., Wang, M., Lin, F. M., Zhao, H., Zhang, Z., Kaloshian, I., Huang, H. D. and Jin, H. (2013). Fungal Small RNAs Suppress Plant Immunity by Hijacking Host RNA Interference Pathways. Science. 342(6154): 118–123.
- Ghosh, S., Regmi, K. C., Stein, B., Chen, J., O’Connell, R. J. and Innes, R. W. (2024). Infection of Alfalfa Cotyledons by an Incompatible but Not a Compatible Species of Colletotrichum Induces Formation of Paramural Bodies and Secretion of EVs. bioRxiv. doi.org/10.1101/2024.04.28.591504.
- De Palma, M., Ambrosone, A., Leone, A., Del Gaudio, P., Ruocco, M., Turiák, L., Bokka, R., Fiume, I., Tucci, M., Pocsfalvi, G., et al. (2020). Plant Roots Release Small Extracellular Vesicles with Antifungal Activity. Plants. 9(12): 1777.
- Garcia-Ceron, D., Lowe, R. G. T., McKenna, J. A., Brain, L. M., Dawson, C. S., Clark, B., Berkowitz, O., Faou, P., Whelan, J., Bleackley, M. R., et al. (2021). Extracellular Vesicles from Fusarium graminearum Contain Protein Effectors Expressed during Infection of Corn. J Fungi. 7(11): 977.
- Rutter, B. D. and Innes, R. W. (2016). Extracellular Vesicles Isolated from the Leaf Apoplast Carry Stress-Response Proteins. Plant Physiol. 173(1): 728–741.
- Robatzek, S. (2007). Vesicle trafficking in plant immune responses. Cell Microbiol. 9(1): 1–8.
- Rodrigues, M. L., Nosanchuk, J. D., Schrank, A., Vainstein, M. H., Casadevall, A. and Nimrichter, L. (2011). Vesicular Transport Systems in Fungi. Future Microbiol. 6(11): 1371–1381.
- Liu, Y., Wu, S., Koo, Y., Yang, A., Dai, Y., Khant, H., Osman, S. R., Chowdhury, M., Wei, H., Li, Y., et al. (2020). Characterization of and isolation methods for plant leaf nanovesicles and small extracellular vesicles. Nanomed Nanotechnol Biol Med. 29: 102271.
- Chaya, T., Banerjee, A., Rutter, B. D., Adekanye, D., Ross, J., Hu, G., Innes, R. W. and Caplan, J. L. (2023). The extracellular vesicle proteomes of Sorghum bicolor and Arabidopsis thaliana are partially conserved. Plant Physiol. 194(3): 1481–1497.
Article Information
Publication history
Received: Jun 7, 2024
Accepted: Aug 19, 2024
Available online: Sep 10, 2024
Published: Oct 5, 2024
Copyright
© 2024 The Author(s); This is an open access article under the CC BY-NC license (https://creativecommons.org/licenses/by-nc/4.0/).
How to cite
Readers should cite both the Bio-protocol article and the original research article where this protocol was used:
- Adekanye, D., Chaya, T. and Caplan, J. L. (2024). Sorghum bicolor Extracellular Vesicle Isolation, Labeling, and Correlative Light and Electron Microscopy. Bio-protocol 14(19): e5083. DOI: 10.21769/BioProtoc.5083.
- Chaya, T., Banerjee, A., Rutter, B. D., Adekanye, D., Ross, J., Hu, G., Innes, R. W. and Caplan, J. L. (2023). The extracellular vesicle proteomes of Sorghum bicolor and Arabidopsis thaliana are partially conserved. Plant Physiol. 194(3): 1481–1497.
Category
Plant Science > Plant cell biology > Organelle isolation
Plant Science > Plant biochemistry > Lipid
Biochemistry > Lipid > Extracellular lipids
Do you have any questions about this protocol?
Post your question to gather feedback from the community. We will also invite the authors of this article to respond.