- Protocols

- Articles and Issues
- For Authors
- About
- Become a Reviewer

Detection and Quantification of Programmed Cell Death in Chlamydomonas reinhardtii: The Example of S-Nitrosoglutathione
Published: Vol 14, Iss 15, Aug 5, 2024 DOI: 10.21769/BioProtoc.5043 Views: 1615
Reviewed by: Luis Alberto Sánchez VargasAdrian Pascal NievergeltShuhei Ota
Original research article
The authors used this protocol in:
Apr 2024
Advertisement


Protocol Collections
Comprehensive collections of detailed, peer-reviewed protocols focusing on specific topics


Related protocols
Abstract
Chlamydomonas (Chlamydomonas reinhardtii) is a unicellular model alga that has been shown to undergo programmed cell death (PCD) that can be triggered in response to different stresses. We have recently shown that Chlamydomonas is particularly well suited to the study and quantification of PCD. We have shown for the first time that S-nitrosoglutathione (GSNO), a nitric oxide (NO) donor, is able to induce PCD and can be used as a study system in Chlamydomonas. In this article, we provide a simple and robust protocol for quantifying GSNO-induced PCD, which can be adapted to any other treatment. We explain how to detect NO production in the cell following GSNO treatment. We show how PCD can be identified simply by analyzing the degradation profile of genomic DNA. We also provide an easy and reproducible cell death quantification protocol, which makes it possible to follow the course of PCD over time and highlight very fine differences in the number of affected cells between different samples.
Key features
• Use of S-nitrosoglutathione (GSNO) as a means to study programmed cell death (PCD) in Chlamydomonas.
• Discrimination of PCD vs. necrosis.
• In vivo determination of NO production in the cell.
• A simple, robust protocol for PCD quantification.
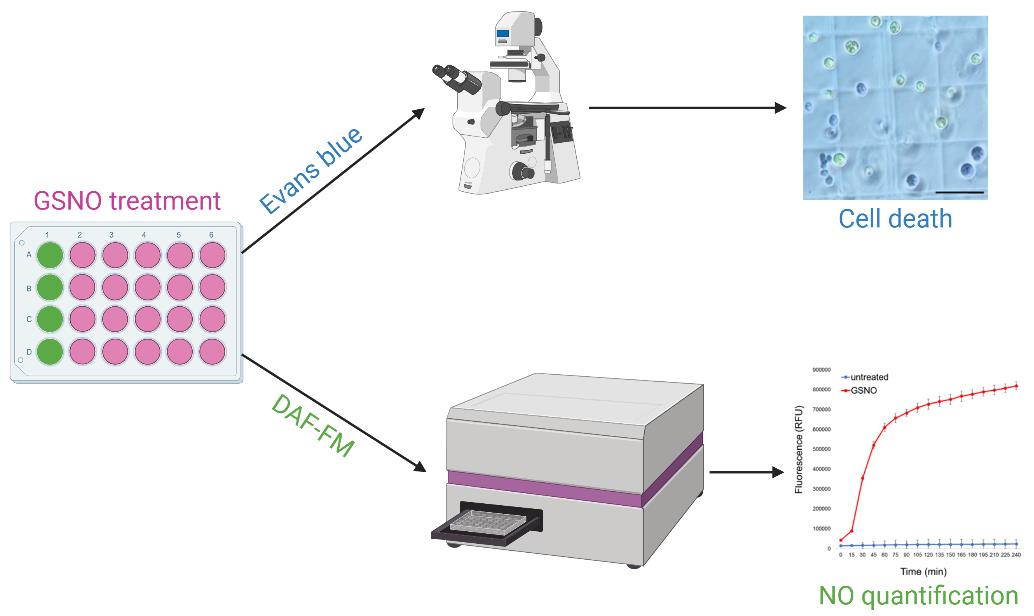
Keywords: Chlamydomonas reinhardtiiGraphical overview
Background
Programmed cell death (PCD) is a crucial process identified in animals in 1972 [1], which plays a role in a wide range of biological processes. Understanding targeted disappearance of cells whose presence is no longer desired is straightforward in multicellular organisms. However, the concept of PCD is more difficult to apply to a unicellular organism, since the death of the cell corresponds to the death of the organism. In recent years, however, it has been shown that PCD does exist in unicellular organisms such as Chlamydomonas, where it was found to be an altruistic mechanism that allows the survival of the population [2,3]. Nitric oxide (NO) has been shown in several studies to be an important molecule for PCD in Chlamydomonas [4,5]; this is why we used the main source of NO in the cell, S-nitrosoglutathione (GSNO), as a system for studying PCD in Chlamydomonas [3]. Several specific criteria can be used to discriminate programmed cell death from necrosis; one of the simplest is to analyze the DNA degradation profile during death [6]. If PCD occurs, DNA migrates as multiples of 180 bp in gel electrophoresis, resulting in a DNA ladder; in the case of necrosis, continuous DNA degradation represented by a smear will be observed [7]. We describe how to analyze the DNA degradation profile in Chlamydomonas, as well as a simple and robust method for calculating the percentage of dead cells in a population. In the case of GSNO-induced PCD, it is important to be able to quantify NO in the cell after treatment; here, we explain how to implement a method for doing so in vivo, using a fluorescent probe. Our protocol outlines the steps to detect and quantify PCD in Chlamydomonas using Evans blue staining, whether you are using GSNO as an inducer or any other treatment.
Materials and reagents
Biological material
We used Chlamydomonas reinhardtii D66 (CC-4425) [8] and CLiP library (CC-4533) [9] strains, but any strain could be used
Reagents
Note: Unless specified otherwise, the reagent can be stored at room temperature.
TAP (tris-acetate-phosphate) solution (Life Technologies, catalog number: T8050)
S-nitrosoglutathione (GSNO) produced in our laboratory but also available for purchase (Sigma, catalog number: N4148), stored at -20 °C
Evans blue powder (Sigma, catalog number: E2129)
Phenol:chloroform:isoamyl (25:24:1) (Sigma, catalog number: 77617), stored at 4 °C
Ethanol 100% (Sigma, catalog number: 32205-M)
Trizma® base (Sigma, catalog number: 93350)
Hydrochloric acid (HCl) (Sigma, catalog number: 258148)
Sodium chloride (NaCl) (Sigma, catalog number: S7653)
Ethylenediaminetetraacetic acid tetrasodium (EDTA) (Sigma, catalog number: E6511)
Sodium dodecyl sulfate (SDS) 20% (Sigma, catalog number: 05030)
Sodium acetate (Sigma, catalog number: S2889)
RNase A, 10 mg/mL (Thermo Scientific, catalog number: EN0531), stored at -20 °C
Agarose (Sigma, catalog number: A9539)
Tris borate EDTA (TBE) buffer (Sigma, catalog number: T4415)
Ethidium bromide solution (Sigma, catalog number: 46067)
GeneRuler 100 bp Plus DNA ladder (Thermo Scientific, catalog number: SM0321), store at 4 °C
DAF-FM diacetate (4-amino-5-methylamino-2’,7’-difluorescein diacetate) (Invitrogen, catalog number: D-23844), store at -20 °C, protected from light
Solutions
50 mM GSNO solution (see Recipes)
DNA extraction buffer (see Recipes)
Sodium acetate 3.3 M (see Recipes)
TBE 0.5× solution (see Recipes)
Evans blue solution (see Recipes)
Recipes
50 mM GSNO solution
Weigh 20 mg of GSNO and dissolve it in 800 µL of TAP medium [10] in a 1.5 mL tube.
Verify the concentration of the 100-fold diluted solution using the molar extinction coefficient of GSNO (922 M-1·cm-1 at 335 nm) [11].
Note: It is better to prepare fresh GSNO for each experiment to avoid its oxidation.
DNA extraction buffer (for 500 mL)
Reagent Final concentration Amount Tris-HCl (1 M, pH 7.5) 200 mM 100 mL NaCl (1 M) 250 mM 125 mL EDTA (0.5 M, pH 8) 25 mM 25 mL SDS (20%) 0.5% 12.5 mL MilliQ water n/a 262.5 mL Total n/a 500 mL Note: It is recommended to autoclave extraction buffer (add SDS after autoclaving) before proceeding to DNA extraction.
Sodium acetate 3.3 M (for 100 mL)
Reagent Final concentration Amount Sodium acetate 3.3 M 27 g MilliQ water n/a 100 mL Total n/a 100 mL Dissolve using a magnetic stirrer and stir bar.
Filter sterilize (0.22 µm).
TBE 0.5× solution
Reagent Final concentration Amount TBE (10×) 0.5× 100 mL MilliQ water n/a 1.9 L Total n/a 2 L Evans blue solution
Reagent Final concentration Amount Evans blue powder 0.5 % 0.5 g TAP n/a 100 mL Total n/a 100 mL Filter sterilize (0.22 µm).
Laboratory supplies
Spectrophotometer semi-micro cuvette (Biosigma, catalog number: BSA002)
24-well plates (Evergreen Labware, Medical Caplugs, catalog number: 222-8044-01F)
Surgical tape (MicroporeTM, catalog number: 1530-0)
Counting chamber Neubauer (Blaubrand, catalog number: BR717805)
Equipment
Spectrophotometer (Implen Nanophotometer)
Microplate reader (ClarioStar Plus, BMG LABTECH)
Orbitron Rotary shaker (Infors)
Olympus BX43 microscope
Thermomixer (Eppendorf, catalog number: 5382000015)
Vortex (Dutsher Vortex Genie 2, catalog number: 079008)
Electrophoresis tanks (Embitec® runOneTM, model: EP-2000)
Camera (Q-IMAGING Micropublisher 3.3 RTV)
NanoDrop One (Thermo Scientific)
GelDoc Go Imaging System (Bio-Rad)
Software and datasets
Image Lab v6.1 for the GelDoc Go Imaging System (Bio-Rad)
Smart control data analysis for ClarioStar Plus (MARS, BMG LabTech)
Procedure
Cell culture
Cultivate Chlamydomonas cells in TAP liquid media at 25 °C, under continuous light (50 µmol photons/m/s) with shaking at 120 rpm until you obtain a concentration of 4 × 10⁶ to 6 × 10⁶ cell/mL.
Transfer 1 mL of culture to as many wells as required in a 24-well plate.
Add 20 µL of a 50 mM fresh solution of GSNO per well.
Close the 24-well plate with Micropore surgical tape and place it at 25 °C under continuous light (50 µmol photons/m/s) with shaking at 120 rpm.
NO detection after GSNO treatment
Add the DAF-FM diacetate to your sample at a final concentration of 5 µM (e.g., 1 µL of a 5 mM solution in a final volume of 1 mL) and place the cells under low light (e.g., 10 µmol photons/m/s) at 25 °C under agitation (120 rpm) for 30 min.
Centrifuge cells at 2,300× g for 3 min, remove the supernatant, and replace it with the same volume of TAP media. Repeat twice.
After a 15 min incubation period, add GSNO to your sample at a final concentration of 1 mM (e.g., 20 µL of a 50 mM solution in a final volume of 1 mL).
NO can be detected as soon as 30 min after GSNO treatment in a plate reader, using wavelengths corresponding to fluorescein (excitation 483 ± 14 nm and emission at 530 ± 30 nm) (Figure 1).
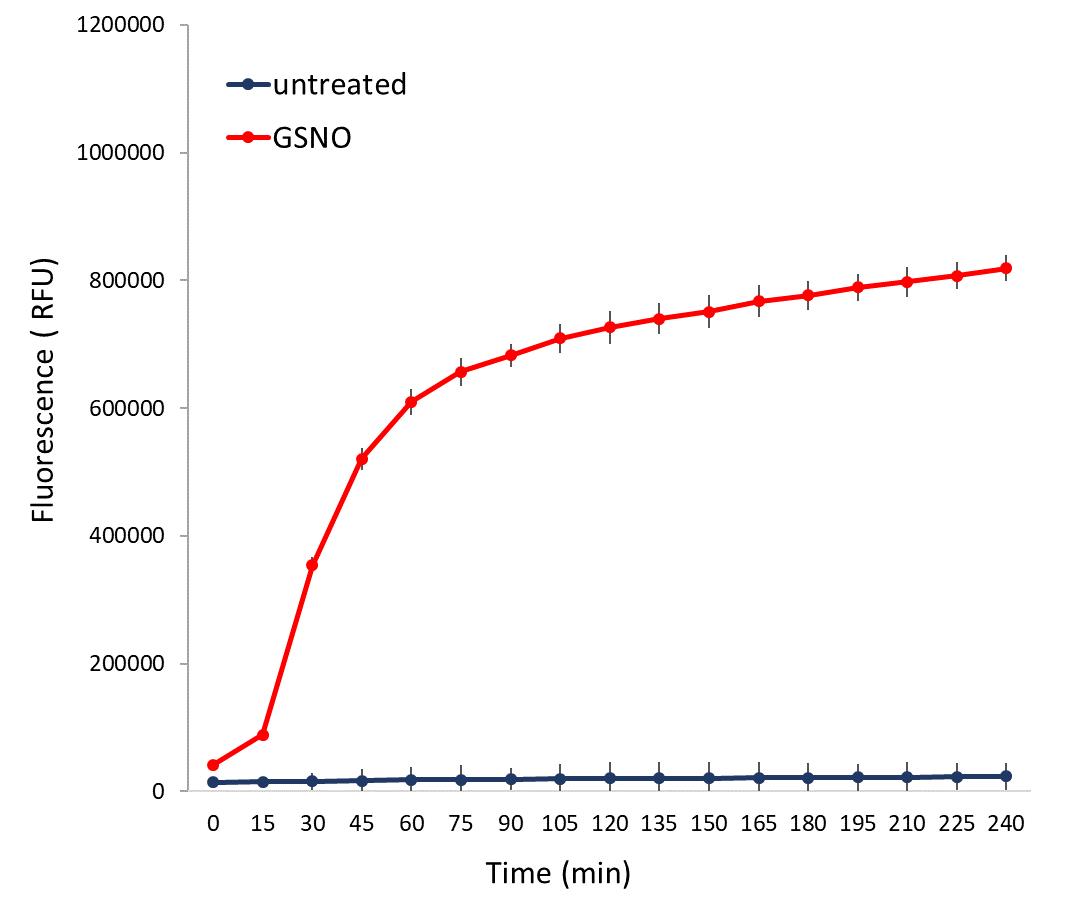
Figure 1. Example of nitric oxide (NO) quantification after S-nitrosoglutathione (GSNO) treatment. DAF-FM fluorescence was measured every 15 min for 4 h in a sample treated with GSNO (1 mM) and in the untreated control. Values represent the average of four biological replicates; error bars indicate ± SEM.
DNA degradation profile analysis
Eight hours after the beginning of the GSNO treatment, transfer the contents of two wells (2 mL) of the 24-well plate into a 2 mL Eppendorf tube.
Harvest the cells by centrifuging the tubes at 2,300× g for 5 min.
Remove the supernatant and dissolve the pellet in 600 µL of extraction buffer by placing it for 10 min at 37 °C under 1,400 rpm agitation in a thermomixer.
Centrifuge at 17,000× g for 3 min to pellet the debris.
Transfer 400 µL of the supernatant into a new 1.5 mL Eppendorf tube.
Add 500 µL of phenol:chloroform:isoamyl solution.
Mix the solution by vortexing for at least 30 s.
Centrifuge at 16,000× g for 5 min.
Carefully collect 300 µL of the upper phase and transfer it to a new 1.5 mL Eppendorf tube.
Add 750 µL of 100% ethanol and 45 µL of sodium acetate 3.3 M, mix gently turning the tube over a few times, and leave in ice for 30 min.
Centrifuge at 17,000× g for 30 min at 4 °C to pellet the DNA.
Remove all supernatant and rinse the pellet with 500 µL of ethanol 70%. Centrifuge at 17,000× g for 5 min at 4 °C.
Remove all supernatant and dry the pellet by placing the tube upside down on absorbent paper for 10 min.
Note: No residues of ethanol should remain at this stage. If needed, the tubes can be dried for a longer time.
Add 100 µL of water and dissolve the pellet by shaking at 1,400 rpm for 5 min at 50 °C in a thermomixer.
Note: The pellet can be hard to dissolve. If needed, use a pipette tip and increase agitation time.
DNA concentration (typically 200–500 ng/µL) and A260nm/A280nm ratio (expressing protein contamination, typically between 1.8 and 2) are estimated spectrophotometrically using a NanoDrop.
Digest 10 µg of DNA with 1 µL of RNase A for 15 min at 37 °C.
Load 10 µg of your DNA samples and 4.5 µL of GeneRuler 100 bp Plus DNA ladder on a 2% agarose gel.
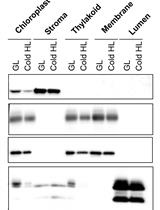
Check the DNA degradation profile after 20 min of migration at 100V and estimate the size of the DNA fragments, using GelDoc Go and Image Lab (Figure 2).
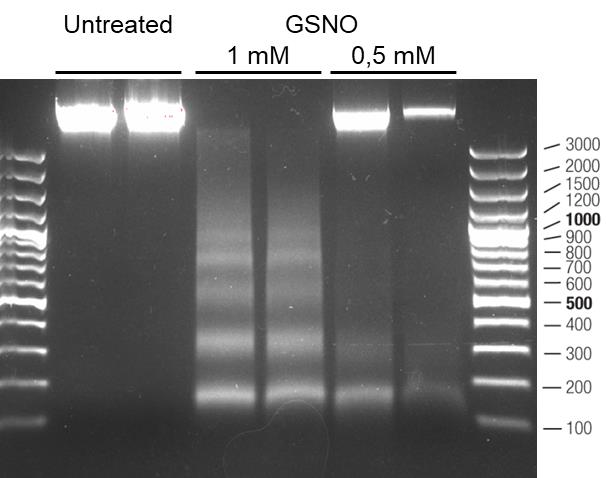
Figure 2. Analysis of DNA degradation profile in untreated cells compared with cells treated with S-nitrosoglutathione (GSNO) 0.5 mM and 1 mM, 8 h after treatment. For each condition, two independent samples are shown. The size of the marker bands is expressed in base pairs.
Death quantification procedure
At different times after GSNO treatment (we recommend 4, 8, and 24 h), take 20 µL of culture from each well and add 8 µL of Evans blue 0.5%.
Observe the cells under a microscope (at 200× or 400× magnification) using a slide with sufficient space to avoid crushing the cells (e.g., Counting chamber Neubauer) and take a representative photo of each sample.
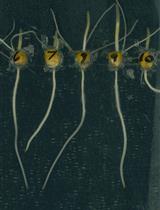
Determine the percentage of dead cells over a population of at least 100 cells by counting the number of blue (dead cells) and living cells (green cells) (Figure 3A). The percentage of dead cells is equal to the number of dead cells divided by the total number of cells, multiplied by 100 (Figure 3B).

Figure 3. Cell death quantification using Evans blue staining. A. Living cells remain green, while dead cells appear blue after treatment with Evans blue. Scale bar represents 50 µm. B. Percentage of dead cells at different times after S-nitrosoglutathione (GSNO) treatment compared with control. Values represent the average of six biological replicates; error bars indicate ± SEM. Adapted from Lambert et al. [12].
Validation of protocol
This protocol or parts of it has been used and validated in the following research article:
Lambert et al. [12]. Type II metacaspase mediates light-dependent programmed cell death in Chlamydomonas reinhardtii. Plant Physiology (Figures 1, 2–6).
In this article, the percentage of death was assessed in different Chlamydomonas populations, using between four and six biological replicates and a Student's t-test to highlight significant differences. In this way, we were able to reveal quite fine statistical differences between the different samples tested (e.g., Figure 1A).
Acknowledgments
This work was supported in part by the CNRS (MITI, ADAPT-VIVANT), Sorbonne Université (iBio initiative). We would like to thank the authors of the publication from which this Bio-protocol article was inspired: Lambert, L., de Carpentier, F., André, P., Marchand, C. H. and Danon, A. (2024). Type II metacaspase mediates light-dependent programmed cell death in Chlamydomonas reinhardtii. Plant Physiol. 194(4): 2648–2662 [12].
Competing interests
The authors declare no conflicts of interest.
References
- Kerr, J. F., Wyllie, A. H. and Currie, A. R. (1972). Apoptosis: a basic biological phenomenon with wide-ranging implications in tissue kinetics. Br J Cancer. 26(4): 239–257.
- de Carpentier, F., Lemaire, S. D. and Danon, A. (2019). When Unity Is Strength: The Strategies Used by Chlamydomonas to Survive Environmental Stresses. Cells. 8(11): 1307.
- Lambert, L., de Carpentier, F., André, P., Marchand, C. H. and Danon, A. (2024). Type II metacaspase mediates light-dependent programmed cell death in Chlamydomonas reinhardtii. Plant Physiol. 194(4): 2648–2662.
- Chang, H. L., Hsu, Y. T., Kang, C. Y. and Lee, T. M. (2013). Nitric Oxide Down-Regulation of Carotenoid Synthesis and PSII Activity in Relation to Very High Light-Induced Singlet Oxygen Production and Oxidative Stress in Chlamydomonas reinhardtii. Plant Cell Physiol. 54(8): 1296–1315.
- Yordanova, Z. P., Woltering, E. J., Kapchina-Toteva, V. M. and Iakimova, E. T. (2013). Mastoparan-induced programmed cell death in the unicellular alga Chlamydomonas reinhardtii. Ann Bot. 111(2): 191–205.
- Danon, A., Delorme, V., Mailhac, N. and Gallois, P. (2000). Plant programmed cell death: A common way to die. Plant Physiol Biochem. 38(9): 647–655.
- Vavilala, S. L., Gawde, K. K., Sinha, M. and D’Souza, J. S. (2015). Programmed cell death is induced by hydrogen peroxide but not by excessive ionic stress of sodium chloride in the unicellular green alga Chlamydomonas reinhardtii. Eur J Phycol. 50(4): 422–438.
- Schnell, R. A. and Lefebvre, P. A. (1993). Isolation of the Chlamydomonas regulatory gene NIT2 by transposon tagging. Genetics. 134(3): 737–747.
- Li, X., Patena, W., Fauser, F., Jinkerson, R. E., Saroussi, S., Meyer, M. T., Ivanova, N., Robertson, J. M., Yue, R., Zhang, R., et al. (2019). A genome-wide algal mutant library and functional screen identifies genes required for eukaryotic photosynthesis. Nat Genet. 51(4): 627–635.
- Gorman, D. S. and Levine, R. P. (1965). Cytochrome f and plastocyanin: their sequence in the photosynthetic electron transport chain of Chlamydomonas reinhardi. Proc Natl Acad Sci USA. 54(6): 1665–1669.
- Broniowska, K. A., Diers, A. R. and Hogg, N. (2013). S-Nitrosoglutathione. Biochim Biophys Acta BBA - Gen Subj. 1830(5): 3173–3181.
Article Information
Publication history
Received: May 13, 2024
Accepted: Jul 2, 2024
Available online: Jul 18, 2024
Published: Aug 5, 2024
Copyright
© 2024 The Author(s); This is an open access article under the CC BY-NC license (https://creativecommons.org/licenses/by-nc/4.0/).
How to cite
Readers should cite both the Bio-protocol article and the original research article where this protocol was used:
- Lambert, L. and Danon, A. (2024). Detection and Quantification of Programmed Cell Death in Chlamydomonas reinhardtii: The Example of S-Nitrosoglutathione. Bio-protocol 14(15): e5043. DOI: 10.21769/BioProtoc.5043.
Lambert, L., de Carpentier, F., André, P., Marchand, C. H. and Danon, A. (2024). Type II metacaspase mediates light-dependent programmed cell death in Chlamydomonas reinhardtii.Plant Physiol. 194(4): 2648–2662.
Category
Plant Science > Plant physiology > Abiotic stress
Cell Biology > Cell signaling > Stress response
Do you have any questions about this protocol?
Post your question to gather feedback from the community. We will also invite the authors of this article to respond.