- Protocols

- Articles and Issues
- For Authors
- About
- Become a Reviewer

Microscale Thermophoresis (MST) as a Tool to Study Binding Interactions of Oxygen-Sensitive Biohybrids
(*contributed equally to this work) Published: Vol 14, Iss 15, Aug 5, 2024 DOI: 10.21769/BioProtoc.5041 Views: 2865
Reviewed by: Joana Alexandra Costa ReisPhilipp A.M. SchmidpeterDjamel Eddine Chafai
Original research article
The authors used this protocol in:
Nov 2023
Advertisement


Protocol Collections
Comprehensive collections of detailed, peer-reviewed protocols focusing on specific topics


Related protocols
Abstract
Microscale thermophoresis (MST) is a technique used to measure the strength of molecular interactions. MST is a thermophoretic-based technique that monitors the change in fluorescence associated with the movement of fluorescent-labeled molecules in response to a temperature gradient triggered by an IR LASER. MST has advantages over other approaches for examining molecular interactions, such as isothermal titration calorimetry, nuclear magnetic resonance, biolayer interferometry, and surface plasmon resonance, requiring a small sample size that does not need to be immobilized and a high-sensitivity fluorescence detection. In addition, since the approach involves the loading of samples into capillaries that can be easily sealed, it can be adapted to analyze oxygen-sensitive samples. In this Bio-protocol, we describe the troubleshooting and optimization we have done to enable the use of MST to examine protein–protein interactions, protein–ligand interactions, and protein–nanocrystal interactions. The salient elements in the developed procedures include 1) loading and sealing capabilities in an anaerobic chamber for analysis using a NanoTemper MST located on the benchtop in air, 2) identification of the optimal reducing agents compatible with data acquisition with effective protection against trace oxygen, and 3) the optimization of data acquisition and analysis procedures. The procedures lay the groundwork to define the determinants of molecular interactions in these technically demanding systems.
Key features
• Established procedures for loading and sealing tubes in an anaerobic chamber for subsequent analysis.
• Sodium dithionite (NaDT) could easily be substituted with one electron-reduced 1,1'-bis(3-sulfonatopropyl)-4,4'-bipyridinium [(SPr)2V•] to perform sensitive biophysical assays on oxygen-sensitive proteins like the MoFe protein.
• Established MST as an experimental tool to quantify binding affinities in novel enzyme–quantum dot biohybrid complexes that are extremely oxygen-sensitive.
Keywords: Microscale thermophoresisGraphical overview
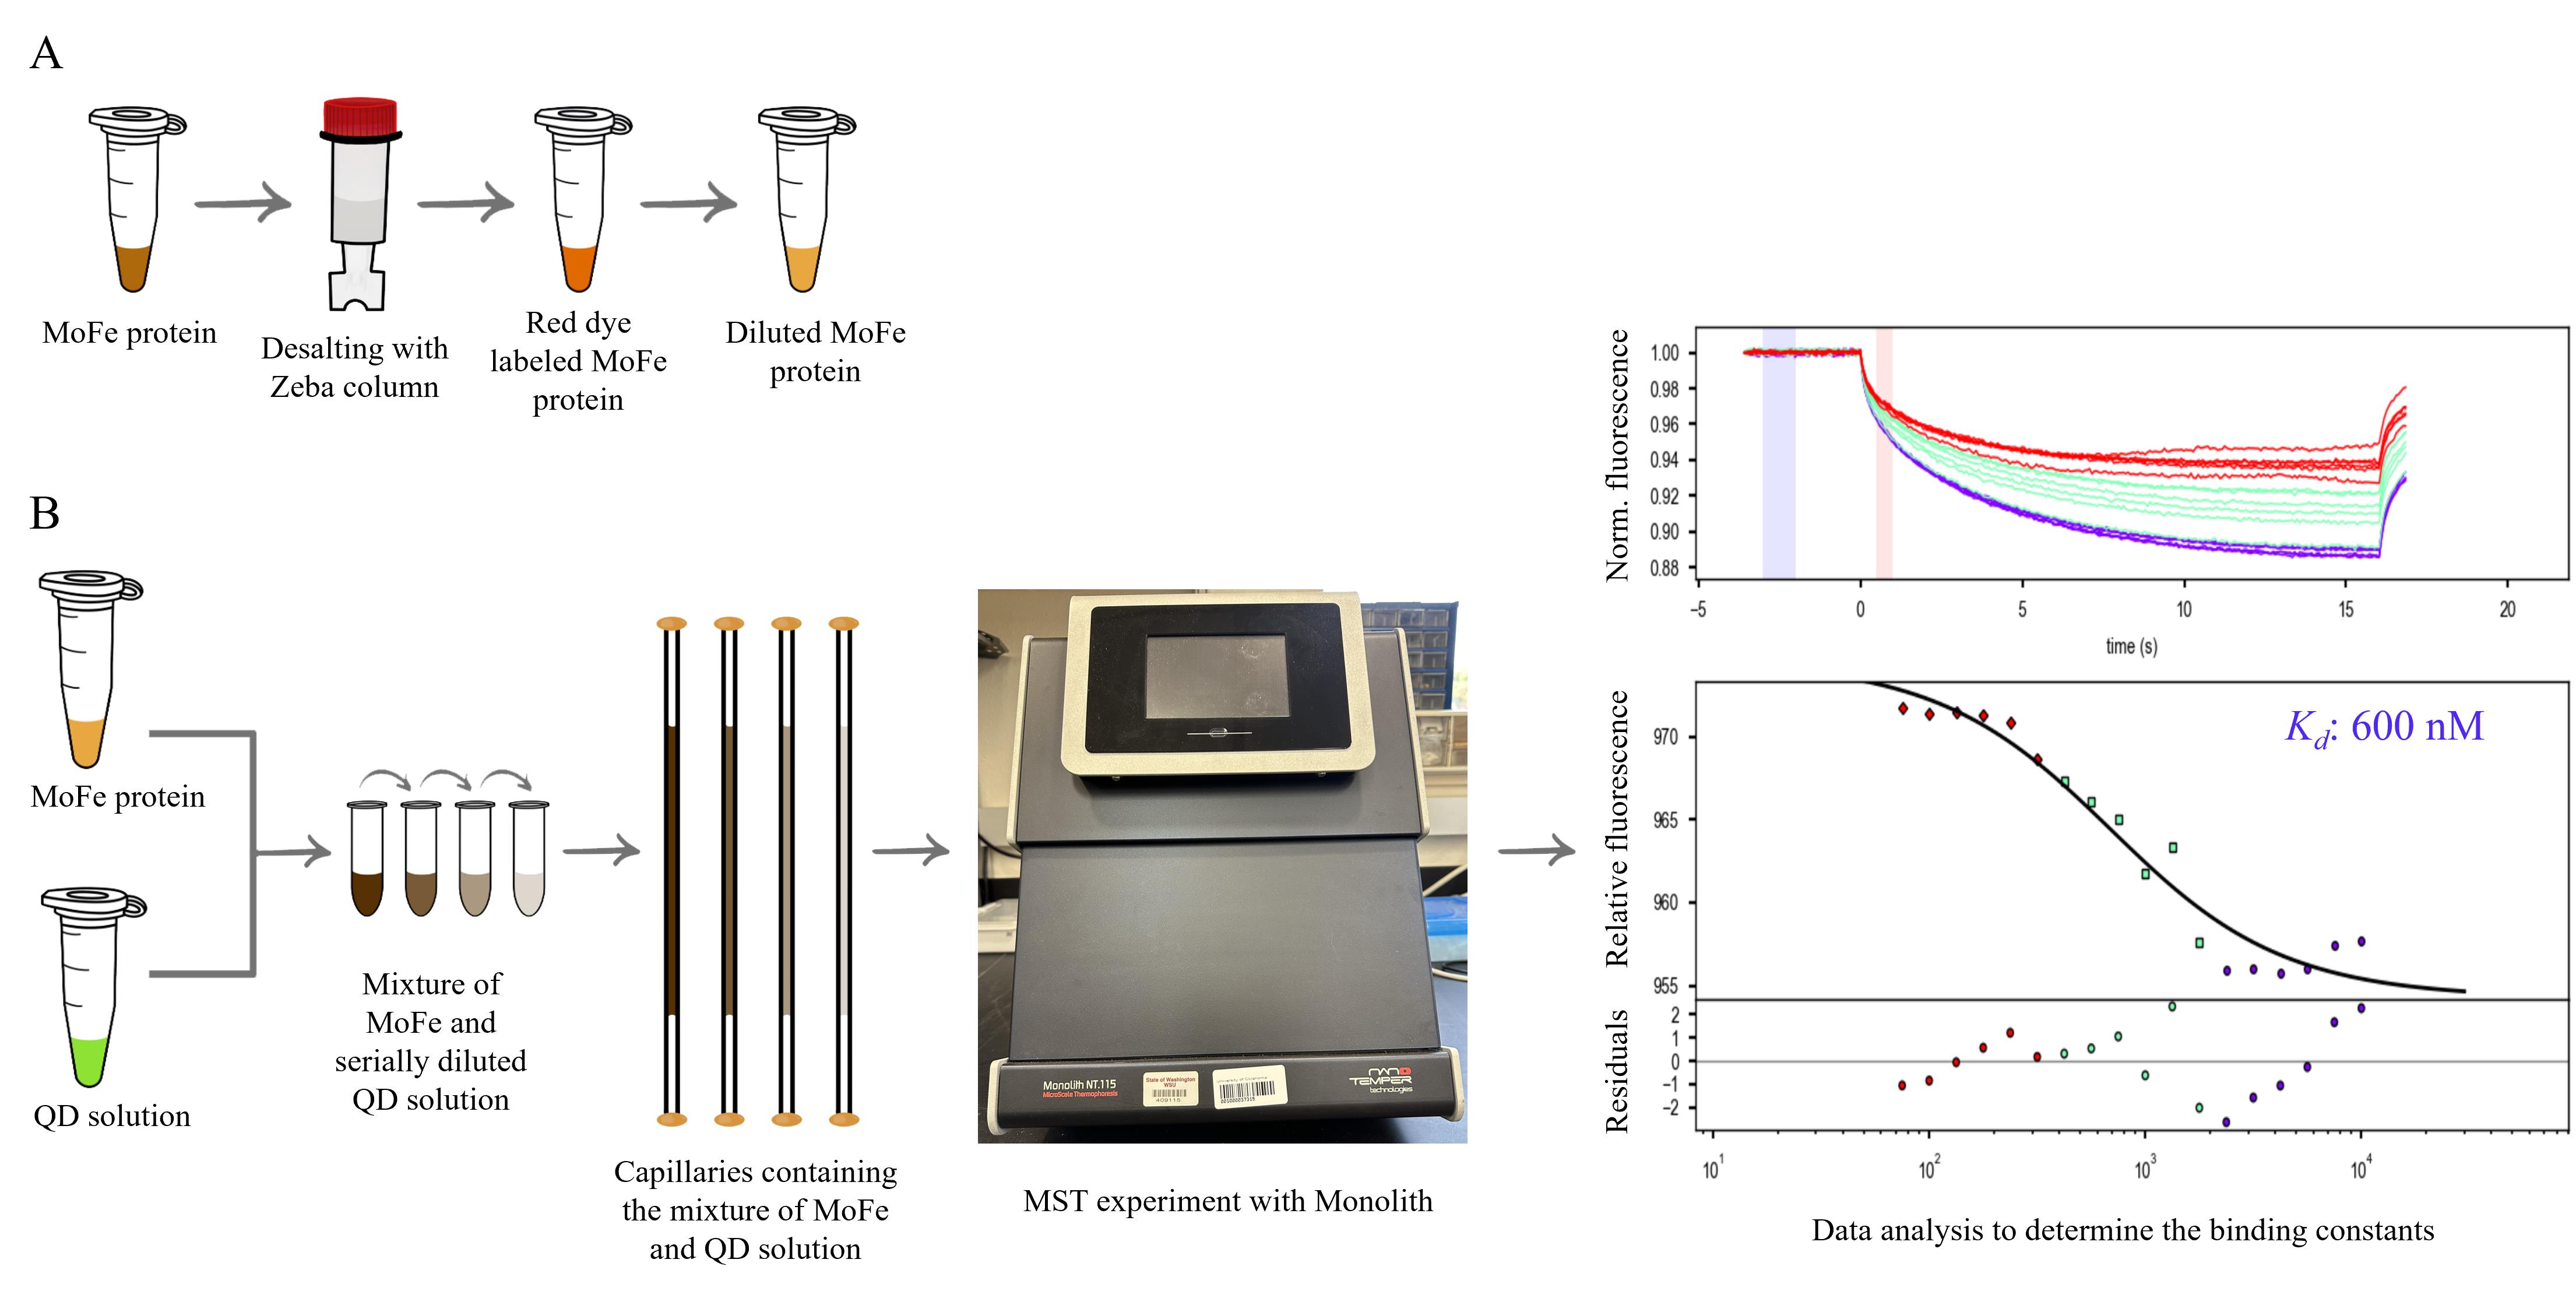
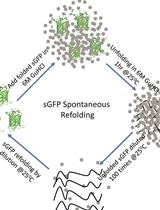
Flowchart of the experimental workflow to determine the dissociation constant (Kd) between the MoFe protein and quantum dots (QDs). A) Preparation of the MoFe protein for the microscale thermophoresis (MST) experiment: The MoFe protein, which was originally purified in HEPES buffer, was buffer exchanged with MOPS-(SPr)2V• buffer using a Zeba column, diluted, and stored in liquid nitrogen. The MoFe protein in MOPS-(SPr)2V• buffer is diluted in MOPS-(SPr)2V•-Tween buffer and labeled with RED-tris-NTA second-generation dye to achieve the concentration required for the MST experiments. B) Experimental flowchart of the MST experiment: The Red dye–labeled MoFe protein and unlabeled QD solution stocks are prepared separately. Prepare a serial dilution of QD solution and mix them with an equal concentration of Red dye–labeled MoFe protein. Transfer the MoFe protein–QD mixture into capillary tubes individually and seal them with wax. Transfer the capillaries into Monolith [1] and perform the MST experiment, which is followed by data analysis and determination of the dissociation constant (Kd) between the MoFe protein and QDs. The top panel of the graph represents the changes observed in the fluorescence intensity during the MST experiment. The bottom panel is the graph depicting the calculated value of the Kd based on the observed fluorescence changes (Y-axis) as a function of the concentration of the interacting QD (X-axis). The lower part of the bottom panel represents the residuals, depicting the quality of the experimental fit.
Background
Quantification of biomolecular interactions is essential as they are critical to drug design, pharmaceutical, and bioprocessing industries. There are several techniques used to determine the strength of molecular interactions including isothermal titration calorimetry (ITC), surface plasmon resonance (SPR), nuclear magnetic resonance (NMR), and biolayer interferometry (BLI). Although these techniques have wide applications, there are several challenges associated with them in studying oxygen-sensitive samples. Microscale thermophoresis (MST), on the other hand, is a highly sensitive method where the intermolecular interactions are studied based on changes in fluorescence intensity of the target molecule as a function of the temperature-based difference in movement between bound and unbound states across a thermal gradient [1,2]. This Bio-protocol focuses on adapting the technique to analyze molecular interactions for highly oxygen-sensitive metalloenzymes and nanocrystalline quantum dots (QDs). We found that it was suboptimal to operate the NanoTemper MST within an anaerobic chamber, necessitating the development of a procedure to load and seal samples in an anaerobic chamber for analysis on the bench in the air. We achieved this by preparing the samples and sealing the MST capillaries inside the mBraun glove box, using capillary wax. Although this proved to be a successful strategy, there still was a need to protect extremely oxygen-sensitive samples like the MoFe protein and the Fe protein of nitrogenase from trace amounts of oxygen that might be introduced during sample preparation. Strong reducing agents like sodium dithionite (NaDT) are routinely used for this purpose; however, NaDT quenches the intensity of the fluorescence signal at even low concentrations. To overcome this, we have employed a novel, one electron-reduced viologen-based 1,1'-bis(3-sulfonatopropyl)-4,4'-bipyridinium radical anion [(SPr)2V•] that does not quench the fluorescence signal, instead of NaDT as a reducing agent in our experiments [3–5]. To check if the (SPr)2V• is a favorable and viable option, we have tested it for studying MoFe protein and Fe protein interactions. These proteins were selected because they are known to be extremely oxygen-sensitive; if our protocol with (SPr)2V• and sealing of the capillaries inside the mBraun works, this can be adapted as a reliable system to study interactions between any molecules that are oxygen-sensitive. After successfully validating our results, we have further developed MST protocols to study interactions of MoFe protein–cadmium sulfide (CdS) nanocrystal biohybrids. Specifically, we adapted the approach to examine CdS QDs of various sizes, which have been shown to interact with several metalloenzymes where the photoexcited conduction band electrons from the QDs could be transferred to the active site of the enzyme, triggering catalysis [6–9]. This emerging class of novel enzyme-QD biohybrids is of utmost significance as it could redefine bio-catalysis [10]. We have successfully demonstrated light-driven reduction of N2 to NH3 using novel MoFe-CdS nanocrystal biohybrids [11,12]. Although the reactivity of MoFe protein and CdS QD mixtures have been studied, there has been no characterization of the molecular interactions prior to our work [13]. We have now successfully developed the protocols for determining the dissociation constants (Kd) of these novel biohybrids involving MoFe protein and the CdS QDs. Here, we have articulated a detailed protocol for determining the Kd between the MoFe protein and 3.7 nm CdS QDs, which was reported in Pellows et al. [13].
Materials and reagents
Reagents
His-Tag labeling Kit RED-tris-NTA 2nd Generation (NanoTemper, catalog number: MO-L018)
Pierce BCA Protein Assay kit (Thermo Fisher, catalog number: 23225)
Capillary wax (Hampton Research, catalog number: HR4-328)
Liquid nitrogen
Double-distilled Milli-Q water
Sodium chloride (NaCl) (Sigma, catalog number: S9888-5KG)
4-(2-hydroxyethyl)-1-piperazineethanesulfonic acid (HEPES) (Sigma, catalog number: H3375-25G)
3-(N-morpholino) propanesulfonic acid (MOPS) (Sigma, catalog number: M1254-25G)
Sodium dithionite (Fisher Scientific, catalog number: 10274490)
Tween-20 (Sigma, catalog number: P1379-25ML)
One electron-reduced 1,1'-bis(3-sulfonatopropyl)-4,4'-bipyridinium [(SPr)2V•] (details in Procedure)
MoFe protein (details in Procedure)
3.7 nm CdS QD (details in Procedure)
Solutions
HEPES buffer (see Recipes)
MOPS-(SPr)2V• buffer (see Recipes)
MOPS-(SPr)2V•-Tween buffer (see Recipes)
QD buffer (see Recipes)
Recipes
HEPES buffer
Reagent Final concentration Amount HEPES 50 mM, pH 7 119 mg NaCl 150 mM 87.6 mg Sodium dithionite (1 M) 2 mM 20 μL H2O n/a 9 mL Make the final volume to 10 mL MOPS-(SPr)2V• buffer
Reagent Final concentration Amount MOPS 50 mM, pH 7 104 mg NaCl 150 mM 87.6 mg (SPr)2V• 50 mM 1 mM 0.2 mL H2O n/a 9 mL Make the final volume to 10 mL MOPS-(SPr)2V•-Tween buffer
Reagent Final concentration Amount MOPS 50 mM, pH 7 104 mg NaCl 10 mM 5.84 mg (SPr)2V• 50 mM 50 μM 10 μL Tween-20 (100%) 0.05% 5 μL H2O n/a 9 mL Make the final volume to 10 mL QD buffer
Reagent Final concentration Amount MOPS 50 mM, pH 7 104 mg (SPr)2V• 50 mM 50 μM 10 μL H2O n/a 9 mL Make the final volume to 10 mL Note: All buffers must be thoroughly degassed before moving them inside the mBraun glove box. This experiment requires only small amounts of buffer, and (SPr)2V• in buffers can degrade upon long-term storage.
Laboratory supplies
Monolith capillaries (NanoTemper, catalog number: MO-K022)
1.5 mL low protein binding microcentrifuge tubes (Thermo Fisher, catalog number: 90410)
0.2 mL thin-wall low protein binding microcentrifuge tubes (BIOplastics, catalog number: K77301)
0.5 mL low protein binding microcentrifuge tubes (Sarstedt Inc, catalog number: 72.704.600)
0.5 mL Zeba spin desalting columns, 7K MWCO (Thermo Fisher, catalog number: 89882)
50 mL tubes (VWR, catalog number: 89039-658)
50 mL tubes (VWR, catalog number: 89039-666)
10 μL pipette tips (VWR, catalog number: 470146-272)
200 μL pipette tips (VWR, catalog number: 470146-222)
1,000 μL pipette tips (VWR, catalog number: 470146-264)
Fisher brand 96-well PCR tube racks (Fisher Scientific, catalog number: 03-448-20)
VWR 80-well microtube racks (VWR, catalog number: 82024-469)
10 mL Wheaton crimp vials (Sigma, catalog number: DWK223686)
Aluminum crimp seals (VWR, catalog number: 97047-818)
Rubber stoppers (Grainger, catalog number: W224100-202)
500 µL gastight syringe (Hamilton, catalog number: 81265)
20 mL sample vials (Grainger, catalog number: 986710)
Equipment
Nanodrop (Thermo Scientific, NanoDrop One, catalog number: ND-ONEC-W)
Microscale thermophoresis (NanoTemper, model: Monolith NT.115)
Dry bath (VWR, Standard Dry Block Heater, catalog number: 75838-286)
Mini centrifuge (Eppendorf, MiniSpin, catalog number: 022620100)
Glove box (mBraun, model: UNIlab pro SP)
Vortexing machine (VWR, Analog Vortex Mixer, catalog number: 10153-838)
Software and datasets
MO.Control (NanoTemper, version: 1.6.1)
PALMIST software (The University of Texas Southwestern Medical Center, version 1.5.8)
Procedure
The (SPr)2V• and the 3.7 nm CdS QD used in this protocol have been synthesized as described previously [3,13]. The MoFe protein required for this protocol has been purified as previously described [14]. MoFe was initially at a concentration of 50 mg/mL in HEPES buffer, which was buffer exchanged into MOPS-(SPr)2V• and diluted 18 times. This dilution was necessary because MST is a highly sensitive technique that can detect interactions even at the nanomolar range.
MoFe protein buffer exchange
Note: This entire procedure must be performed inside the mBraun glove box.
Break the seal off the bottom of the Zeba spin desalting column and discard it (Note 1).
Slightly loosen the cap on the top of the column.
Place the column in the 1.5 mL collection tube.
Gently centrifuge the column at 1,500× g for 1 min to remove the storage solution (Note 2).
Discard the storage solution and place the column back onto the collection tube.
Equilibrate the column by adding 300 µL of MOPS-(SPr)2V• buffer to the top of it and incubate for 1 min.
Following the incubation, centrifuge the column for 1 min at 1,500× g to drain out the excess buffer.
Discard the buffer collected in the storage tube.
Repeat steps A6–A8 at least three more times to ensure the column is properly equilibrated with the MOPS-(SPr)2V• buffer.
Discard the collection tube and place the equilibrated column onto a clean low protein binding microcentrifuge.
Add 75 µL of concentrated MoFe protein to the top of the column.
Centrifuge the column at 1,500× g for 2 min.
Transfer the buffer-exchanged MoFe protein in MOPS-(SPr)2V• buffer and dilute as necessary to a final concentration of 11.6 μM to an appropriate tube for downstream experiments.
Cryopreserve excess MoFe protein by sealing in a 10 mL Wheaton crimp vial with a rubber stopper and aluminum cap, remove from the mBraun chamber, and use a 500 μL Hamilton syringe to rapidly (minimize O2 exposure) transfer the MoFe protein dropwise into liquid nitrogen. Transfer the frozen MoFe protein pellets into a clean needle-pierced 20 mL sample vial (to allow safe nitrogen gas venting) and store in liquid nitrogen.
MoFe protein concentration determination using bicinchoninic acid (BCA) assay
Prepare the working reagent (WR) by mixing the reagents A and B in the ratio of 50:1 (Note 4). In a clean 15 mL Falcon tube, dispense 5 mL of reagent A and add 0.1 mL of reagent B (Note 5).
For standards, make at least 10 different known concentrations.
Use the provided 2 mg/mL bovine serum albumin (BSA) as the standard stock solution (Note 6).
Make a dilution series of BSA from 2 to 0.2 mg/mL.
Take 10 clean 0.2 mL Eppendorf tubes and label them as 2.0, 1.8, 1.6, 1.4, 1.2, 1.0, 0.8, 0.6, 0.4, and 0.2.
Add double-distilled Milli-Q water in the following order: For 1.8 add 10 µL, for 1.6 add 20 µL, for 1.4 add 30 µL, for 1.2 add 40 µL, for 1.0 add 50 µL, for 0.8 add 60 µL, for 0.6 add 70 µL, for 0.4 add 80 µL, and for 0.2 add 90 µL. For 2.0, do not add water (Table 1).
Table 1. Reference table to make different known concentrations of the BSA sample
Tube # BSA (µL) Milli-Q water (µL) 2.0 100 0 1.8 90 10 1.6 80 20 1.4 70 30 1.2 60 40 1.0 50 50 0.8 40 60 0.6 30 70 0.4 20 80 0.2 10 90 The final concentration of the MoFe protein was determined to be 11.6 µM. The protein was then cryopreserved in liquid nitrogen until further use.
Now, add BSA to the labeled tubes as follows: For 2.0 add 100 µL, for 1.8 add 90 µL, for 1.6 add 80 µL, for 1.4 add 70 µL, for 1.2 add 60 µL, for 1.0 add 50 µL, for 0.8 add 40 µL, for 0.6 add 30 µL, for 0.4 add 20 µL, and for 0.2 add 10 µL.
Label another set of 12 clean 0.2 mL Eppendorf tubes and label them as 2B, 1.8B, 1.6B, 1.4B, 1.2B, 1.0B, 0.8B, 0.6B, 0.4B, 0.2B, PR1, and PR2 (PR1 & PR2 are the protein samples, whose concentrations are to be determined).
Dispense 25 µL each of all the standards that were made into the respective tubes. For example, dispense 25 µL from 2.0 and add it to 2.0B, and so on.
Use the PR1 and PR2 for the MoFe protein whose concentration is yet to be determined. Dispense 25 µL of the MoFe protein as it is into the PR1. Take a clean 0.2 mL Eppendorf tube and make a 1:1 dilution of the MoFe protein in water by adding 25 µL of the MoFe protein and 25 µL of the double-distilled Milli-Q water. Take 25 µL of the diluted MoFe protein and transfer it into PR2.
To all 12 tubes, add 200 µL of the WR, close the lid, and mix them thoroughly by vortexing.
Incubate the samples at 37 °C for 30 min in a dry bath.
Following the incubation time, cool the samples to room temperature.
Switch on the NanoDrop One and select proteins under the new experiment. In the proteins tab, select protein BCA method and use water as blank (Notes 7 and 8).
Use 2 µL of the sample and record the concentrations at 562 nm for all 12 samples individually (10 standards and 2 MoFe protein samples).
Make a standard curve by plotting the 562 nm absorbance data for each of the BSA standards on the Y-axis vs. the concentration in mg/mL on the X-axis. Use the standard curve to determine the protein concentration of each unknown sample (PR1 and PR2) (Note 9).
Testing of the binding efficiency of His-tagged MoFe protein with the RED-tris-NTA 2nd generation dye
Add 25 µL of MOPS-(SPr)2V•-Tween buffer to the vial containing the Red dye provided in the kit to obtain a final stock of 5 µM Red dye.
From the final stock of Red dye, prepare 200 µL of 50 nM working stock of the dye by diluting it 100 times. For this, dispense 2 µL of the 5 µM Red dye into a clean 0.5 mL microcentrifuge tube and add 198 µL of MOPS-(SPr)2V•-Tween buffer.
Dispense 30 µL of 4 µM MoFe protein in MOPS-(SPr)2V•-Tween buffer into a clean 0.2 mL thin-wall low protein binding microcentrifuge tube.
Arrange 16 clean PCR tubes, label them 1–16, and arrange them sequentially on a PCR tube holder.
Dispense 10 µL of MOPS-(SPr)2V•-Tween buffer to all PCR tubes except for the first tube, labeled “1.”
Following this, dispense 20 µL of 4 µM MoFe protein into the first tube, labeled “1.2.”
Make a serial dilution of 1:1 ratio from tube 1. For this, dispense 10 µL from tube 1 and transfer it into tube 2, mix it thoroughly, and using the same tip, transfer 10 µL from tube 2 into tube 3. Repeat this process until tube 16. After thoroughly mixing the sample in the final tube (16), remove 10 µL from that tube and discard it.
Now, add 10 µL of the 50 nM Red dye to all 16 tubes.
Incubate the samples at room temperature for 30 min.
Following the incubation, centrifuge the samples at 14,000× g for 10 min.
Transfer the sample from the PCR tubes into 16 clean Monolith capillaries sequentially.
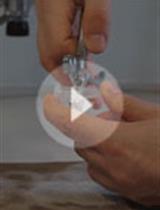
Allow the samples to load into the capillaries via capillary suction (Figure 1A).
Following the transfer, gently hold the top end of the capillary with forceps and slowly dip the bottom end into the molten wax. Hold the capillary at 90° and allow the wax to solidify to seal one end (Figure 1B). Now, gently reverse the direction of the capillary tube to hold the sealed end of the capillary with the forceps. Gently dip the opposite end into molten wax and seal the other end (Figure 1C) (Note 11).
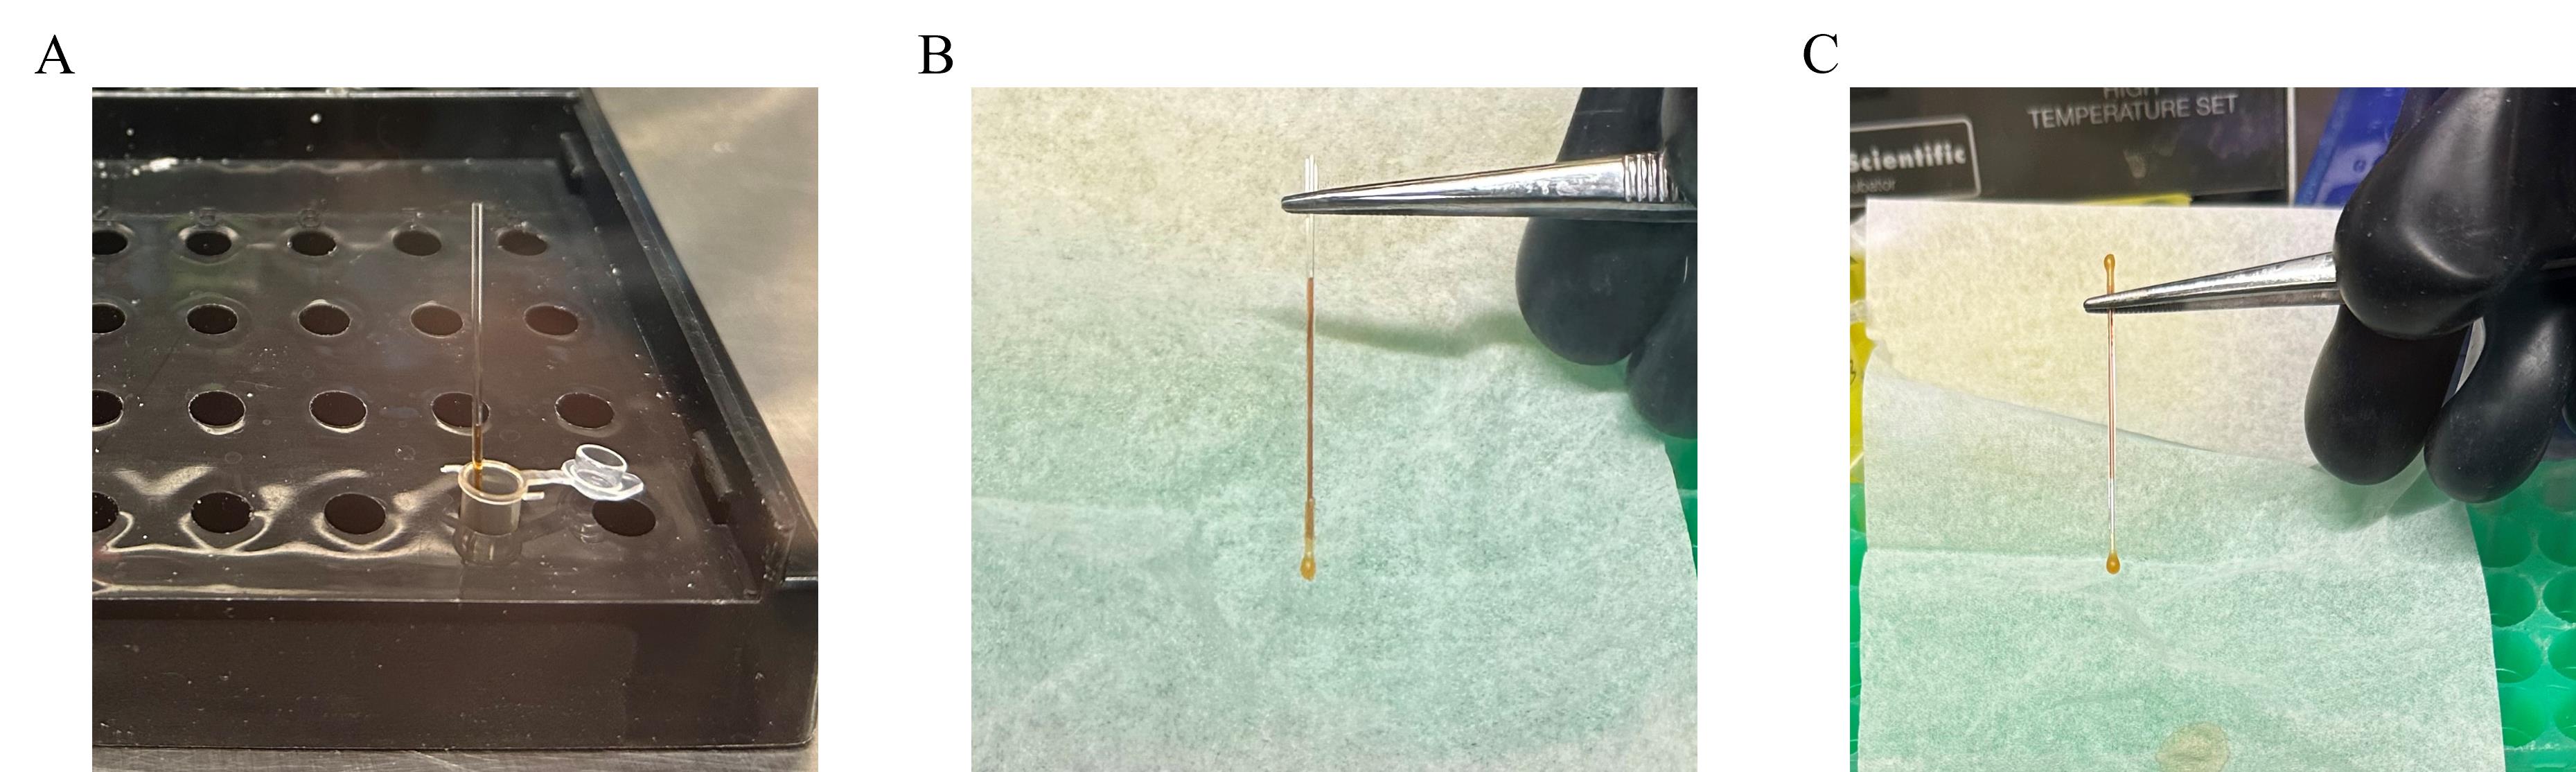
Figure 1. Workflow for the sealing of the capillary tubes. A) Allow the sample to load into the capillary via capillary suction. B) Hold the top end of the capillary at 90° with clean forceps and allow the wax to solidify to seal one end. C) Similarly, seal the other end by reversing the capillary.Place the capillaries on the Monolith sample tray and remove the tray from the mBraun glove box.
Switch on the Monolith NT.115, gently place the sample tray (with the capillaries) in the tray holder, and close the lid.
Open the MO.Control version 1.6.1 software and open a new experiment. Under select excitation color tab, select Nano-RED and, in the next screen under choose an experiment tab, select expert mode.
In the expert mode, add the following experimental parameters, as shown in Figure 2: Excitation power, 80%; MST-power, medium; Before MST, 3 s, MST-on time, 15 s; and After MST, 1 s.
After setting up the experimental parameters, click Add dilution series at the bottom of the screen, highlighted in a green rectangular box in Figure 2.
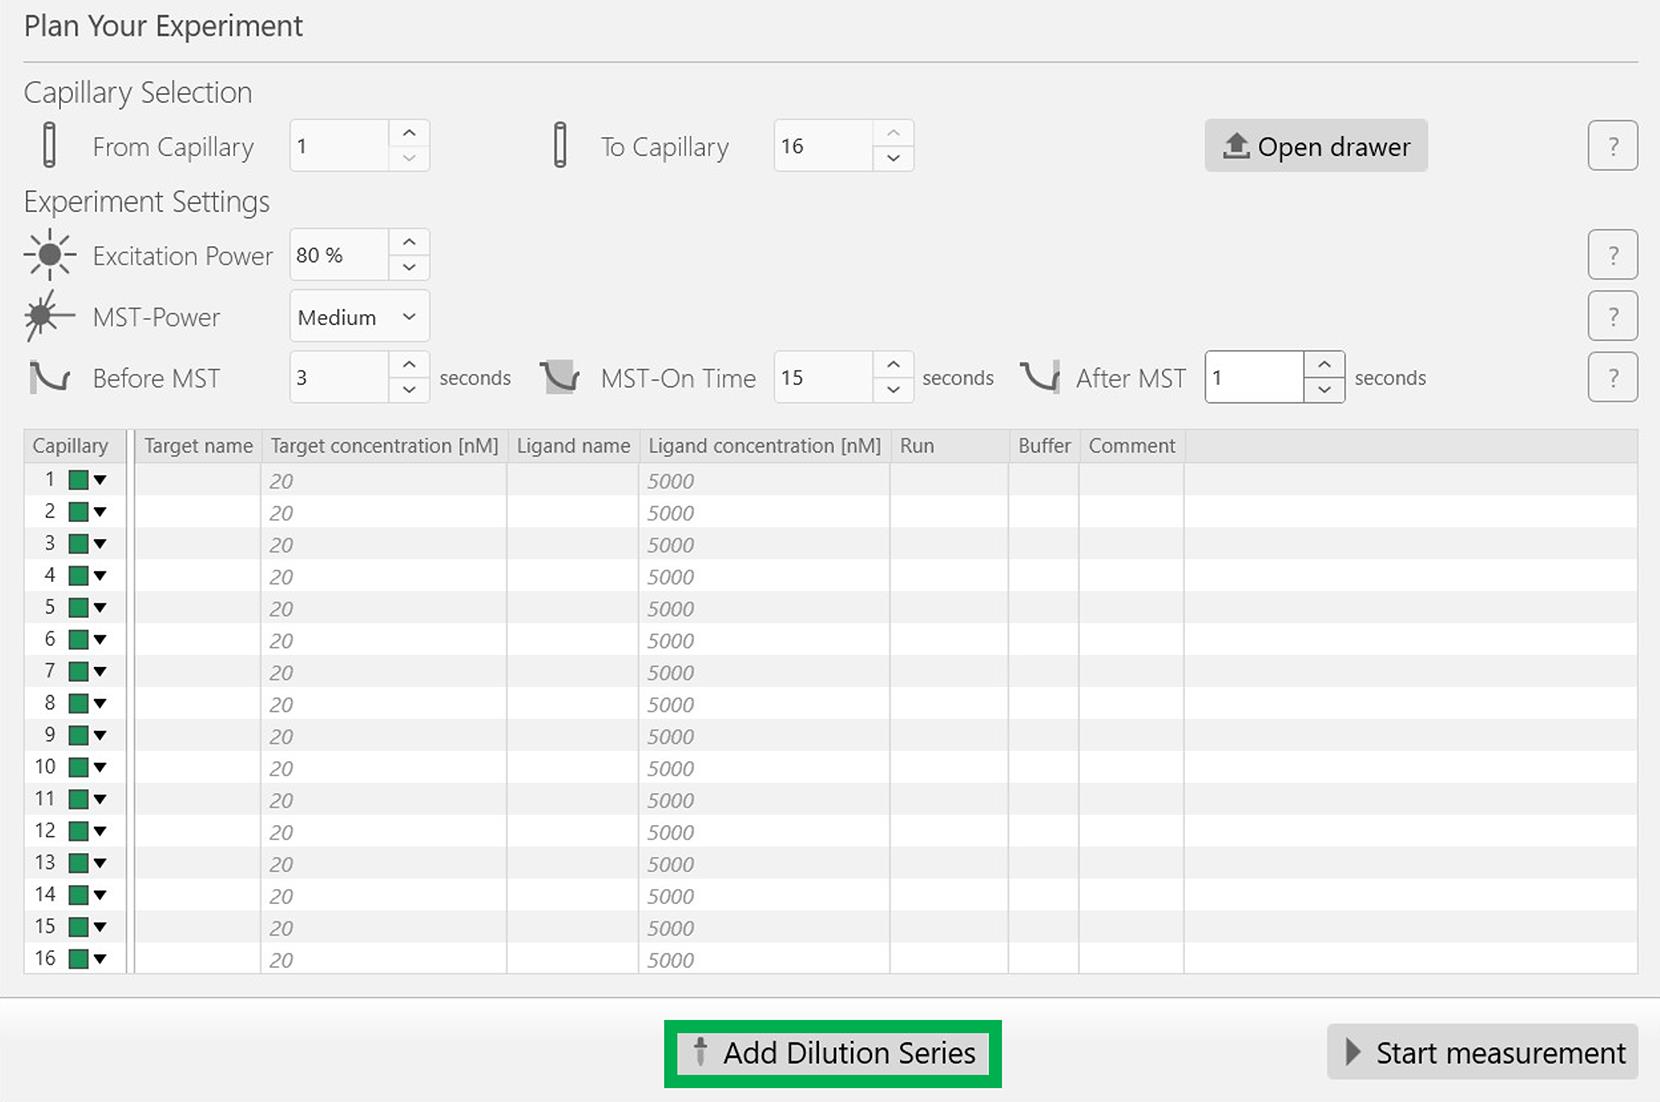
Figure 2. Screenshot of the MO.Control version 1.6.1 software (NanoTemper) with the desired experimental parameters. After updating these parameters, click the Add dilution series button at the end of the window, highlighted in green.Set the following parameters: Highest concentration for MoFe protein, 2,000 nM; Dilution, 1:1; Red dye concentration is maintained constant at 25 nM as described in Figure 3. After inputting these parameters, click Add at the bottom of the sub-window highlighted in a green rectangle box (Figure 3).
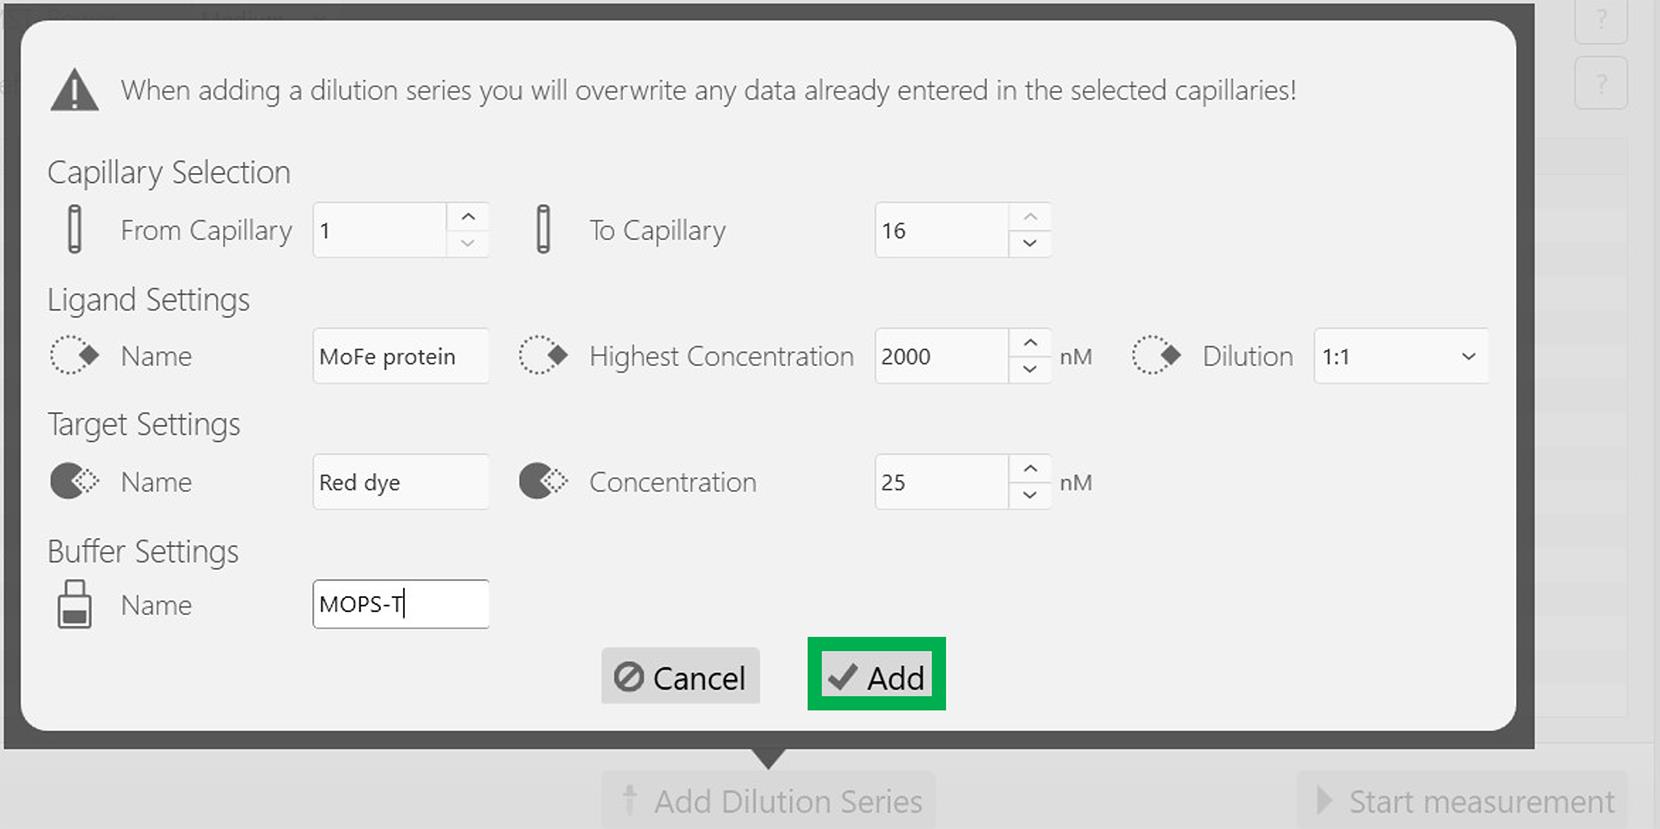
Figure 3. Screenshot of the MO.Control version 1.6.1 software depicting the information related to the dilution factor. After updating the necessary information, press the Add button, highlighted in a green box.Following this, all experimental parameters, including the concentrations of the target (Red dye) and the ligand (MoFe protein), are reflected appropriately in the next screen as depicted in Figure 4. Now, start the experiment by clicking the Start measurement at the bottom of the screen, indicated in the green rectangular box (Figure 4).
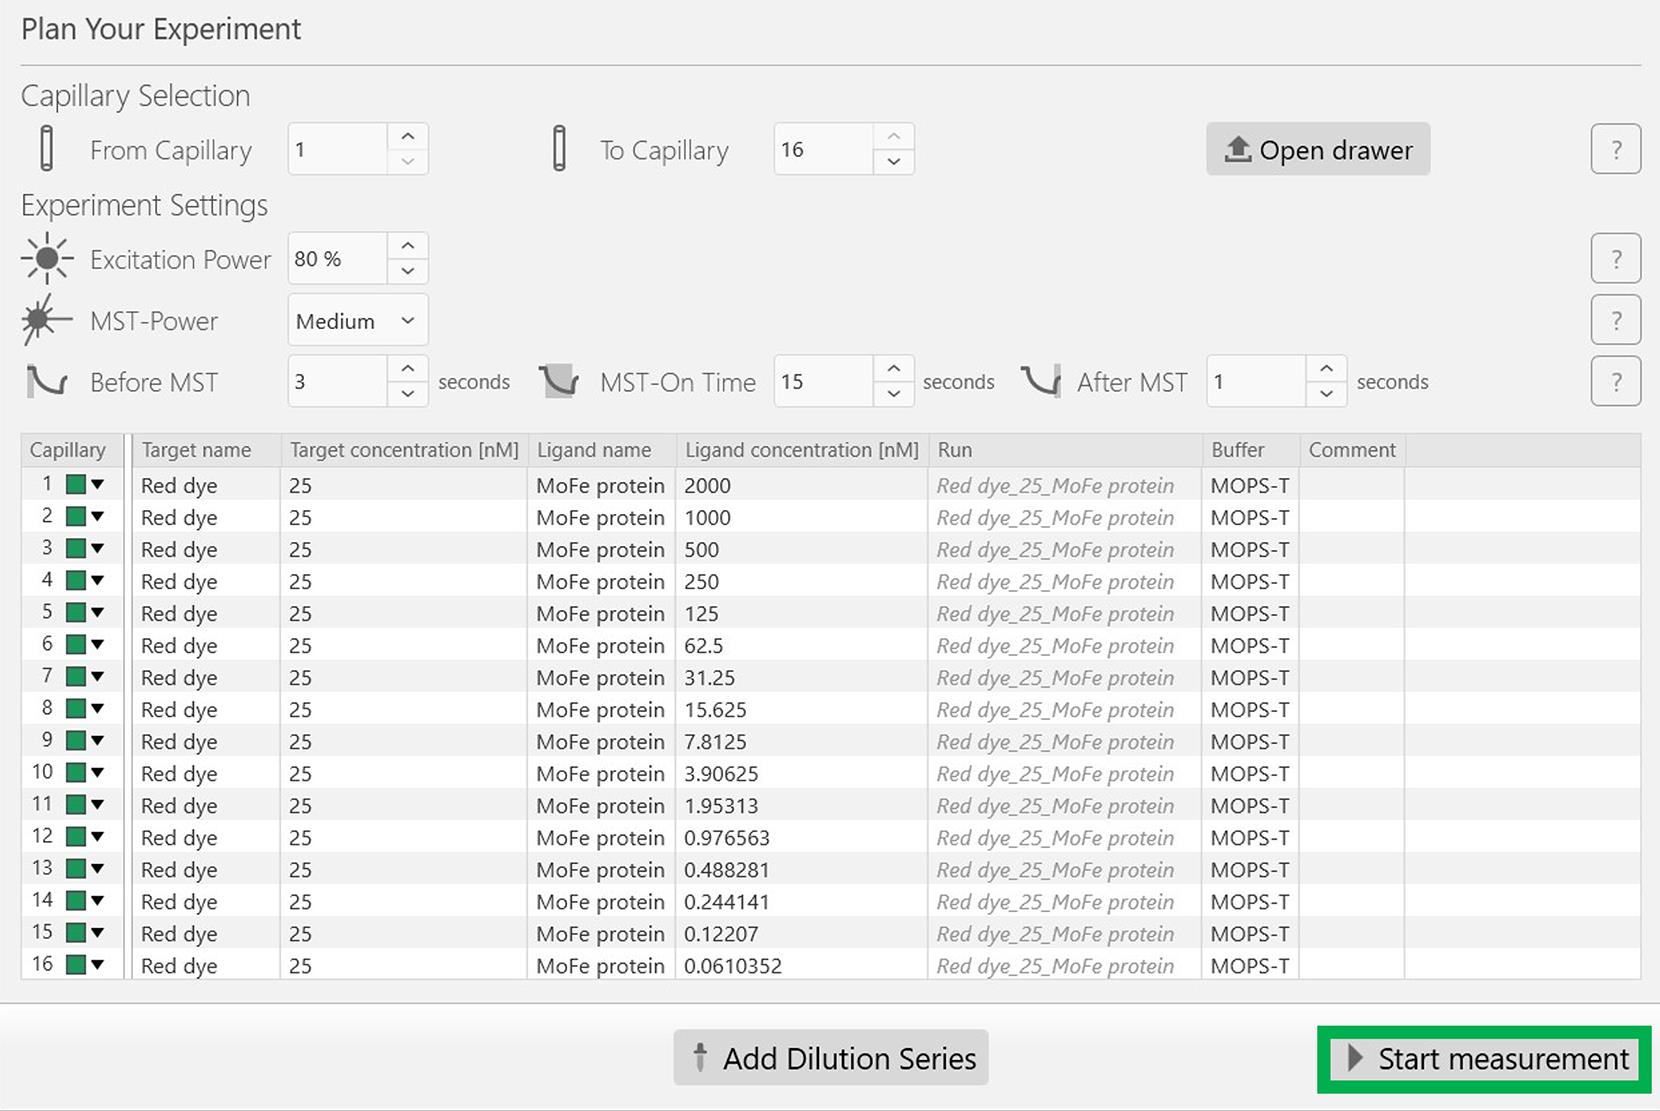
Figure 4. Screenshot of the MO.Control version 1.6.1 software showing the final experimental parameters. Make sure all the experimental parameters reflect the originally planned experiment. Click the Start measurement button at the bottom of the window to begin the experiment.Following the experiment, open the lid, gently remove the sample tray, and discard the capillaries. Now, analyze the dissociation constant (Kd) of the Red dye with the His-tagged MoFe protein using the PALMIST software. Note that the interaction between the Red dye and His tag is a reversible reaction. (For data analysis, refer to Data analysis section).
Determining the dissociation constant (Kd) between the Red dye–labeled MoFe protein with the 3.7 nm CdS QD
Prepare 100 µL of a 100 nM working stock of the Red dye solution. Add 2 µL of the 5 µM Red dye into a clean 0.5 mL microcentrifuge tube and add 98 µL of MOPS-(SPr)2V•-Tween buffer.
Dilute the MoFe protein in MOPS-(SPr)2V•-Tween buffer to a final concentration of 800 nM from its original stock of 11.6 µM in MOPS-(SPr)2V• buffer.
Transfer 90 µL of 800 nM MoFe protein in MOPS-(SPr)2V•-Tween buffer into a clean 0.5 mL microcentrifuge tube.
Add 90 µL of 100 nM Red dye solution in MOPS-(SPr)2V•-Tween buffer into the tube containing MoFe protein and mix the solution gently (Note 12).
Incubate the sample for 30 min at room temperature.
Following incubation, centrifuge the sample at 14,000× g for 10 min.
Following centrifugation, carefully transfer the supernatant into a new clean 0.5 mL microcentrifuge tube.
Finally, label the MoFe protein in MOPS-(SPr)2V•-Tween buffer with the Red dye; the final concentration is 400 nM.
Prepare the 3.7 nm CdS QD solution (see Note 13).
Dilute the original stock of 3.7 nm CdS QD solution (in Milli-Q water) into QD buffer to a final concentration of 20,000 nM.
Prepare 16 clean PCR tubes and label them 1–16.
Add 10 µL of QD buffer to all the PCR tubes except for the first tube, labeled “1.”
Transfer 40 µL of 20,000 nM 3.7 nm CdS QD to tube 1.
Make a 3:1 dilution series of 3.7 nm CdS QD solution. Transfer 30 µL of 20,000 nM 3.7 nm CdS QD from tube 1 into tube 2, mix it thoroughly, and, using the same tip, transfer 30 µL from tube 2 into tube 3. Repeat this process until tube 16. After thoroughly mixing the sample in the final 16th tube, discard 30 µL from the 16th tube.
Add 10 µL of the 400 nM Red dye–labeled MoFe protein to all 16 tubes and mix the solutions in each individual tube gently with the pipette tip.
Follow the steps as described in C9–17.
Set the following experimental parameters: Highest concentration for the 3.7 nm CdS QD, 10,000 nM; Dilution, 3:1; Red dye–labeled MoFe protein concentration is maintained constant at 200 nM as described in Figure 5. After updating these parameters, click Add at the bottom of the window (Figure 5).
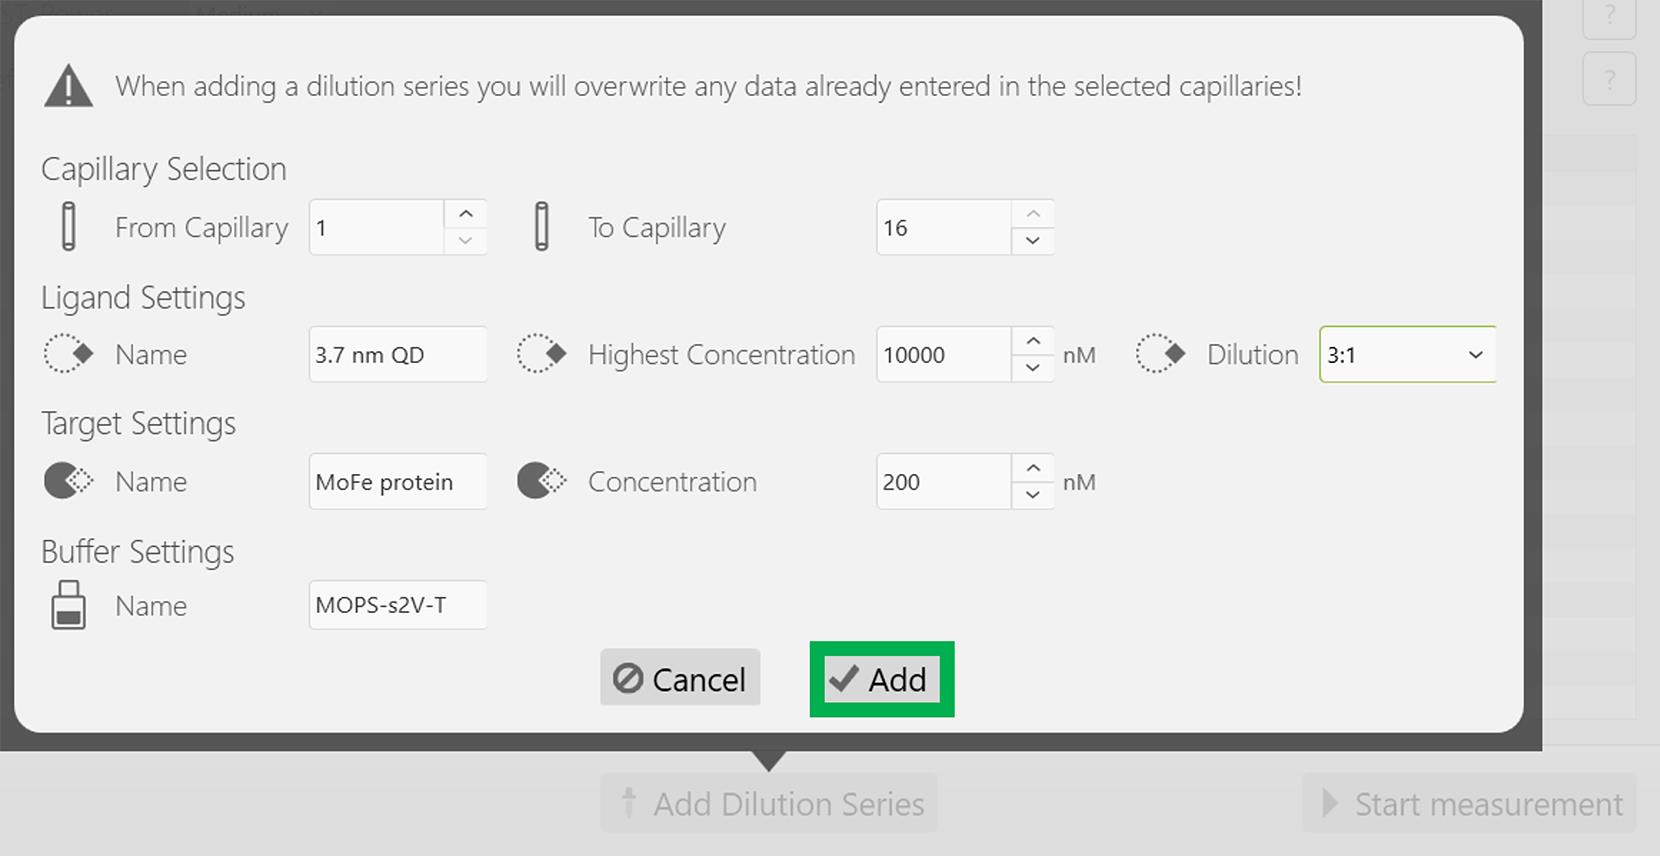
Figure 5. Screenshot of the MO.Control version 1.6.1 software depicting the information related to the dilution factor of the 3.7 nm CdS QD. Following this, click the Add button highlighted in the green box.All experimental parameters, including the concentrations of the target (MoFe protein) and the ligand (3.7 nm CdS QD) are reflected appropriately in the next screen, as depicted in Figure 6. Now, start the experiment by clicking Start measurement at the bottom of the screen, indicated in the green rectangular box (Figure 6). Note that the emission maximum of the Red dye is approximately 660 nm.
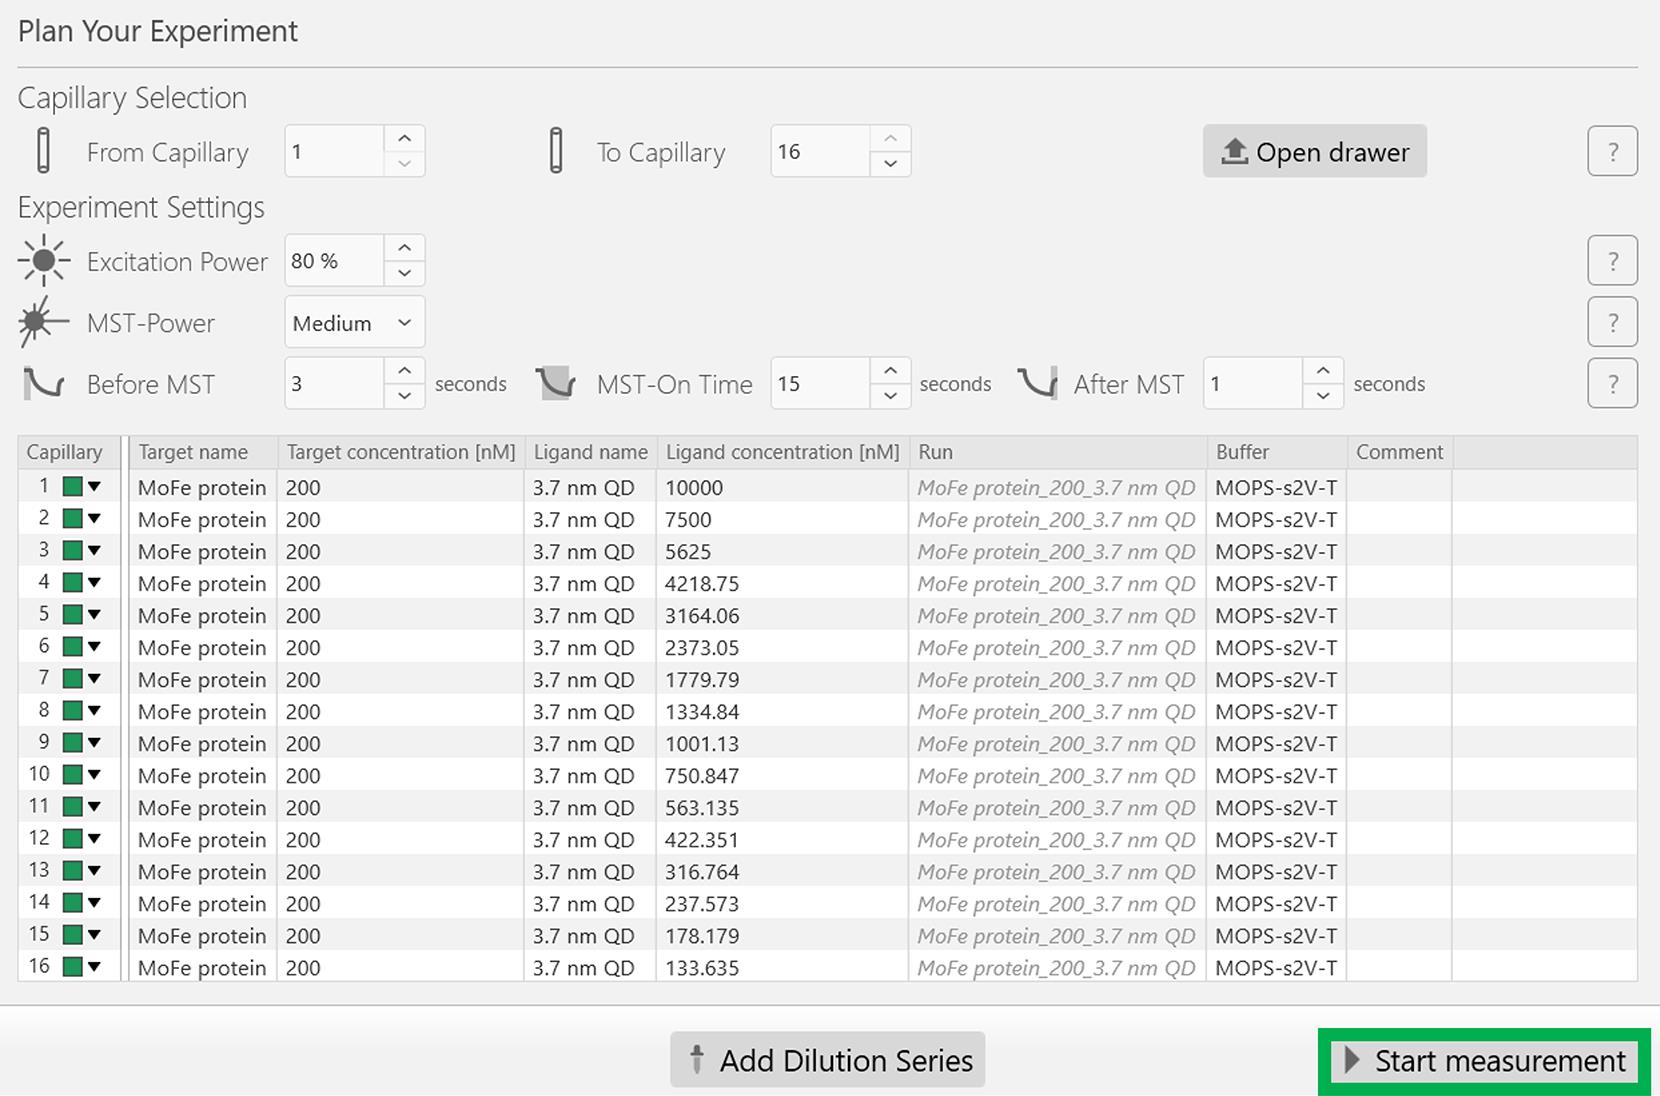
Figure 6. Screenshot of the MO.Control version 1.6.1 software showing the final experimental parameters for the MoFe protein and 3.7 nm CdS QD MST experiment. After ensuring all parameters are correct, click the Start measurement button at the bottom of the window to begin the MST experiment.At the end of the experiment, open the lid, gently remove the sample tray, and discard the capillaries. Analyze the dissociation constant (Kd) between the MoFe protein and 3.7 nm CdS QD using the PALMIST software (Note 14).
Open the PALMIST software, click File, and then click the Read .moc File (Figure 7).
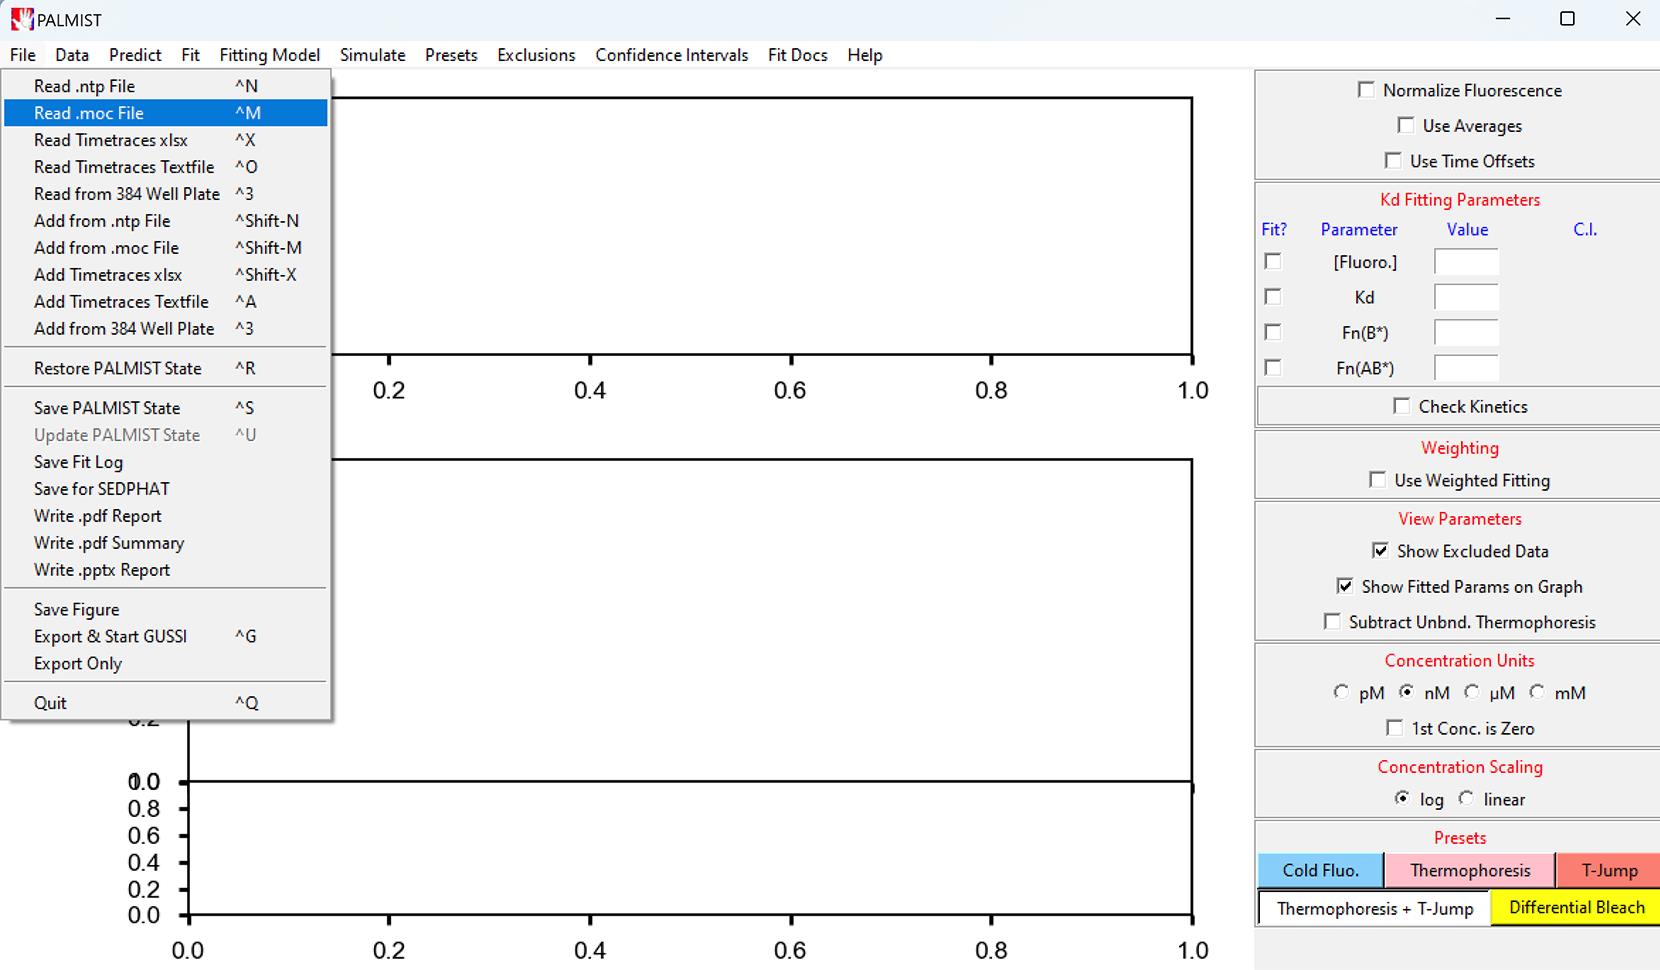
Figure 7. Screenshot of the PALMIST version 1.5.8 software showing the location of the Read. moc File under the File tabOpen the saved MST experiment data (.moc) from its original location.
After opening the data, select T-Jump at the bottom-right corner of the PALMIST software (Figure 8).
Check Normalize Fluorescence at the top-right of the window (Figure 8).
Click Fit (Hill equation) to determine the dissociation constant (Kd) (Figure 8).
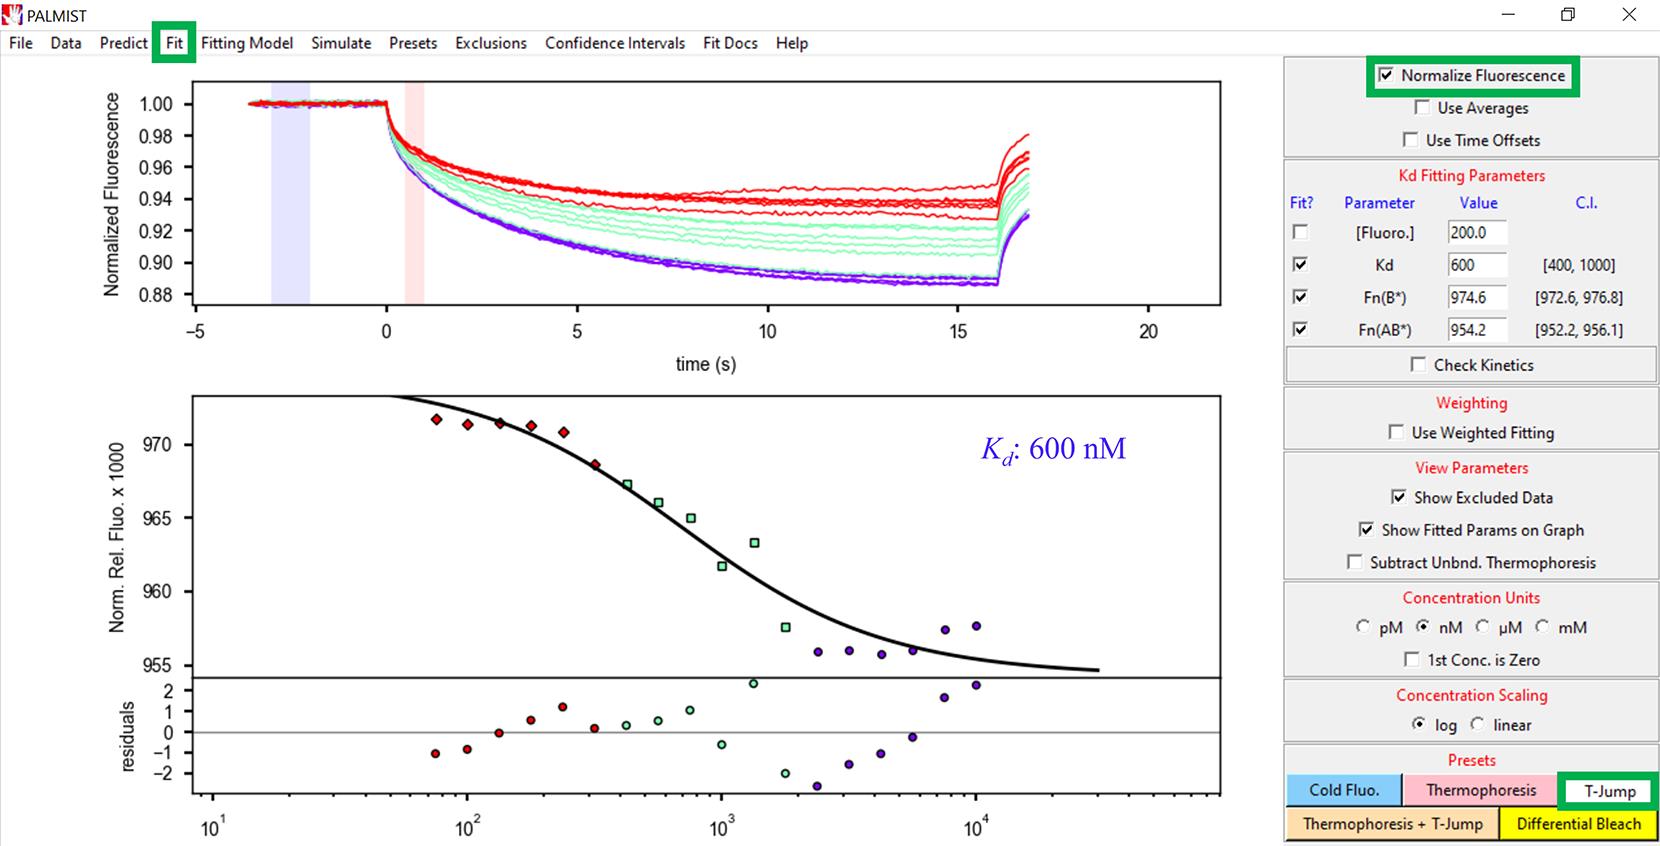
Figure 8. Screenshot of the PALMIST version 1.5.8 software displaying the location of the T-Jump, Normalize Fluorescence, and Fit (highlighted in individual green boxes) and processed data along with the Kd value. The top panel shows the change in fluorescence of all the capillaries across the length of the MST experiment. The upper part of the lower panel shows the experimental fit of the data while the bottom part shows the residuals, displaying the quality of the data fitting in relation to the experimental data.Zeba spin desalting columns are ideal for desalting unwanted buffer constituents prior to the MST experiments. These columns are highly efficient in recovering most of the protein, especially when working under very low volumes.
Make sure to mark the side of the column where the resin is positioned upward. Always place the column in the Eppendorf tube with the mark facing outward when placing the tube in the centrifuge in all the subsequent steps wherever centrifugation is necessary. Otherwise, the desalting efficiency could be reduced.
Although other assay kits are currently available, the BCA kit is highly recommended when working with metalloproteins as it is compatible with several reducing agents.
When both BCA reagents are mixed, the solution initially appears to be turbid; however, upon gently mixing, the turbidity should disappear resulting in a clear green solution.
Make sure you have enough volume of WR to carry out one set of standards and at least two unknown concentrations of the target protein. If you are using the test tube method, 2 mL of the WR is required per sample. For smaller volumes, up to 200 µL is required per sample.
Caution: Be careful while breaking the glass seal of the vial. Broken glass may cause injuries. After the usage, carefully discard the broken glass into a glass disposal box.
If Nanodrop is not available, a microplate reader can be used with the same protocol. Use a compatible microplate instead of 0.2 mL Eppendorf tubes.
If neither Nanodrop nor the microplate reader is available, readings can be measured by either a colorimeter or spectrophotometer. When using a colorimeter/spectrophotometer, larger volumes are required depending on the cuvette’s size and volume.
Repeat the BCA assay at least three times and make sure to have consistent values from the three replicates.
This experiment is mandatory to determine the binding affinity of the target protein to the Red dye and, once determined, this experiment does not need to be performed as long as using the same target protein for the MST experiments.
It is sometimes necessary to “double dip” the capillary end in the capillary wax to ensure sealing. Check that both ends of each capillary are sealed before removing them from the mBraun.
Using a sub-stoichiometric concentration of the Red dye relative to the target protein is recommended, as any excess unbound Red dye can interfere with fluorescence changes during MST experiments and significantly alter the Kd values during data analysis.
It is critical that the 3.7 nm CdS QD dilution in QD buffer is performed just prior to mixing with the MoFe protein and MST data collection. Also, prepare all buffers with the (SPr)2V• on the day of the experiments to maintain optimal oxygen scavenging.
A lower dissociation constant (Kd) implies higher binding affinities, whereas higher Kd values indicate weaker interactions.
Since the MoFe protein and the 3.7 nm CdS QD are extremely oxygen-sensitive, it is important to handle these samples without interference from atmospheric oxygen. Always transfer these samples in air-tight Wheaton crimp vials sealed with rubber stopper and aluminum crimp seals before moving the samples into the mBraun glove box.
For detecting binding affinities between molecules having weaker interactions, it is recommended to increase the LED intensity to 100% as long as photobleaching is not significant.
Certain non-biological samples may have less stability under certain solvent conditions. It is recommended to optimize their stabilities under different solvent conditions before performing MST experiments.
During MST experiments, if you observe aggregation behavior during data collection, try to optimize and improve the solvent conditions. Also, try to minimize the time between sample preparation and data collection to avoid aggregation during data collection.
Careful pipetting is a must, given the small volumes being used for making serial dilutions. Avoid small drops on the sides of tubes during serial dilution transfers since small errors can have a big impact on the results.
- Jerabek-Willemsen, M., André, T., Wanner, R., Roth, H. M., Duhr, S., Baaske, P. and Breitsprecher, D. (2014). MicroScale Thermophoresis: Interaction analysis and beyond. J Mol Struct. 1077: 101–113.
- Seidel, S. A., Dijkman, P. M., Lea, W. A., van den Bogaart, G., Jerabek-Willemsen, M., Lazic, A., Joseph, J. S., Srinivasan, P., Baaske, P., Simeonov, A., et al. (2013). Microscale thermophoresis quantifies biomolecular interactions under previously challenging conditions. Methods. 59(3): 301–315.
- Badalyan, A., Yang, Z. Y., Hu, B., Luo, J., Hu, M., Liu, T. L. and Seefeldt, L. C. (2019). An Efficient Viologen-Based Electron Donor to Nitrogenase. Biochemistry. 58(46): 4590–4595.
- DeBruler, C., Hu, B., Moss, J., Luo, J. and Liu, T. L. (2018). A Sulfonate-Functionalized Viologen Enabling Neutral Cation Exchange, Aqueous Organic Redox Flow Batteries toward Renewable Energy Storage. ACS Energy Lett. 3(3): 663–668.
- Yang, Z. Y., Badalyan, A., Hoffman, B. M., Dean, D. R. and Seefeldt, L. C. (2023). The Fe Protein Cycle Associated with Nitrogenase Catalysis Requires the Hydrolysis of Two ATP for Each Single Electron Transfer Event. J Am Chem Soc. 145(10): 5637–5644.
- Brown, K. A., Dayal, S., Ai, X., Rumbles, G. and King, P. W. (2010). Controlled Assembly of Hydrogenase-CdTe Nanocrystal Hybrids for Solar Hydrogen Production. J Am Chem Soc. 132(28): 9672–9680.
- Brown, K. A., Wilker, M. B., Boehm, M., Dukovic, G. and King, P. W. (2012). Characterization of Photochemical Processes for H2 Production by CdS Nanorod–[FeFe] Hydrogenase Complexes. J Am Chem Soc. 134(12): 5627–5636.
- Chaudhary, Y. S., Woolerton, T. W., Allen, C. S., Warner, J. H., Pierce, E., Ragsdale, S. W. and Armstrong, F. A. (2012). Visible light-driven CO2reduction by enzyme coupled CdS nanocrystals. Chem Commun. 48(1): 58–60.
- Hamby, H., Li, B., Shinopoulos, K. E., Keller, H. R., Elliott, S. J. and Dukovic, G. (2019). Light-driven carbon−carbon bond formation via CO2reduction catalyzed by complexes of CdS nanorods and a 2-oxoacid oxidoreductase. Proc Natl Acad Sci USA. 117(1): 135–140.
- Utterback, J. K., Ruzicka, J. L., Keller, H. R., Pellows, L. M. and Dukovic, G. (2020). Electron Transfer from Semiconductor Nanocrystals to Redox Enzymes. Annu Rev Phys Chem. 71(1): 335–359.
- Brown, K. A., Harris, D. F., Wilker, M. B., Rasmussen, A., Khadka, N., Hamby, H., Keable, S., Dukovic, G., Peters, J. W., Seefeldt, L. C., et al. (2016). Light-driven dinitrogen reduction catalyzed by a CdS:nitrogenase MoFe protein biohybrid. Science. 352(6284): 448–450.
- Brown, K. A., Ruzicka, J., Kallas, H., Chica, B., Mulder, D. W., Peters, J. W., Seefeldt, L. C., Dukovic, G. and King, P. W. (2020). Excitation-Rate Determines Product Stoichiometry in Photochemical Ammonia Production by CdS Quantum Dot-Nitrogenase MoFe Protein Complexes. ACS Catal. 10(19): 11147–11152.
- Pellows, L. M., Willis, M. A., Ruzicka, J. L., Jagilinki, B. P., Mulder, D. W., Yang, Z. Y., Seefeldt, L. C., King, P. W., Dukovic, G., Peters, J. W., et al. (2023). High Affinity Electrostatic Interactions Support the Formation of CdS Quantum Dot:Nitrogenase MoFe Protein Complexes. Nano Lett. 23(22): 10466–10472.
- Christiansen, J., Goodwin, P. J., Lanzilotta, W. N., Seefeldt, L. C. and Dean, D. R. (1998). Catalytic and biophysical properties of a nitrogenase Apo-MoFe protein produced by a nifB-deletion mutant of Azotobacter vinelandii.Biochemistry. 37(36): 12611–12623.
- Scheuermann, T. H., Padrick, S. B., Gardner, K. H. and Brautigam, C. A. (2016). On the acquisition and analysis of microscale thermophoresis data. Anal Biochem. 496: 79–93.
To determine the protein binding affinities accurately, it is essential to have the accurate value of the concentration of protein being used in the MST experiments. Thus, the concentration of protein being used is quantified using BCA assay (Note 3).
Note: This procedure can be performed on a regular workbench and does not need to be performed inside the mBraun glove box.
To determine the binding efficiency of the His-tagged MoFe protein with the RED-tris-NTA 2nd generation dye, the MST experiment was performed (Note 10).
Note: This procedure must be performed inside the mBraun glove box until step C13.
To determine the dissociation constant (Kd) between the His-tagged MoFe protein and the 3.7 nm CdS QD, MST was performed.
Data analysis
The MST data analysis has been performed using the PALMIST software, which is freely available and can be downloaded from the following link: https://www.utsouthwestern.edu/research/core-facilities/mbr/software/. For more information on data analysis, refer to Scheuermann et al. [15].
Validation of protocol
This protocol has been validated in Pellows et al. [13]. High affinity electrostatic interactions support the formation of CdS Quantum Dot:Nitrogenase MoFe protein complexes. Nano Letters (Figure 2 panels A and B, Figures 3 and 4).
General notes and troubleshooting
General notes
Troubleshooting
Acknowledgments
This work has been funded by the U.S. Department of Energy Office of Basic Energy Sciences, Division of Chemical Sciences, Geosciences, and Biosciences, Physical Biosciences and Solar Photochemistry Programs. This work was authored in part by the Alliance for Sustainable Energy, LLC, the manager and operator of the National Renewable Energy Laboratory for the U.S. Department of Energy (DOE) under Contract No. DEAC36-08GO28308. The U.S. Government and the publisher, by accepting the article for publication, acknowledge that the U.S. Government retains a nonexclusive, paid-up, irrevocable, worldwide license to publish or reproduce the published form of this work or allow others to do so for U.S. Government purposes. This protocol has been validated in Pellows et al. [13], published in ACS Nano Letters.
Competing interests
The authors declare no competing interests.
References
Article Information
Publication history
Received: Mar 27, 2024
Accepted: Jun 24, 2024
Available online: Jul 18, 2024
Published: Aug 5, 2024
Copyright
© 2024 The Author(s); This is an open access article under the CC BY-NC license (https://creativecommons.org/licenses/by-nc/4.0/).
How to cite
Jagilinki, B. P., Willis, M. A., Mus, F., Sharma, R., Pellows, L. M., Mulder, D. W., Yang, Z. Y., Seefeldt, L. C., King, P. W., Dukovic, G. and Peters, J. W. (2024). Microscale Thermophoresis (MST) as a Tool to Study Binding Interactions of Oxygen-Sensitive Biohybrids. Bio-protocol 14(15): e5041. DOI: 10.21769/BioProtoc.5041.
Category
Biophysics > Bioengineering > Nanomaterials
Biochemistry > Protein > Fluorescence
Do you have any questions about this protocol?
Post your question to gather feedback from the community. We will also invite the authors of this article to respond.