- Protocols

- Articles and Issues
- For Authors
- About
- Become a Reviewer

Quantification of Autophagosomes in Human Fibroblasts Using Cyto-ID® Staining and Cytation Imaging
Published: Vol 14, Iss 13, Jul 5, 2024 DOI: 10.21769/BioProtoc.5025 Views: 1691
Reviewed by: Olga KopachVishal Nehru
Original research article
The authors used this protocol in:

Feb 2024
Advertisement


Protocol Collections
Comprehensive collections of detailed, peer-reviewed protocols focusing on specific topics


Abstract
As an essential process for the maintenance of cellular homeostasis and function, autophagy is responsible for the lysosome-mediated degradation of damaged proteins and organelles; therefore, dysregulation of autophagy in humans can lead to a variety of diseases. The link between impaired autophagy and disease highlights the need to investigate possible interventions to address dysregulations. One possible intervention is hyperthermia, which is described in this protocol. To investigate these interventions, a method for absolute quantification of autophagosomal compartments is required that allows comparison of autophagosomal activity under different conditions. Existing methods such as western blotting and immunohistochemistry for analysing the location and relative abundance of intracellular proteins associated with autophagy, or transmission electron microscopy (TEM), which are either very time-consuming, expensive, or both, are less suitable for this purpose. The method described in this protocol allows the absolute quantification of autophagosomes per cell in human fibroblasts using the CYTO-ID® Autophagy Detection Kit after heat therapy compared to a control. The Cyto-ID® assay is based on the use of a specific dye that selectively stains autophagic compartments, combined with an additional Hoechst 33342 dye for nuclear staining. The subsequent recognition of these stained compartments by the Cytation Imager enables the software to determine the number of autophagosomes per nucleus in living cells. Additionally, this absolute quantification uses an image-based method, and the protocol is easy to use and not time-consuming. Furthermore, the method is not only suitable for heat therapy but can also be adapted to any other desired therapy or substance.
Key features
• Absolute quantification of autophagic compartments in living cells.
• Optimised protocol for the determination of autophagy in primary human skin fibroblasts.
• Allows the testing of active substances and treatments concerning autophagy.
• Imaging-based method for the determination of autophagy.
Keywords: AutophagyGraphical overview
Background
As part of normal housekeeping, mammalian cells regularly replace damaged organelles or misfolded proteins to prevent potentially dangerous components from accumulating and overwhelming the cell. Autophagy removes and recycles this waste by isolating the targeted materials within a double-membrane vesicle called an autophagosome, which fuses with the lysosome. The fusion is facilitated by tethering factors that bind to proteins on the autophagosome and the lysosome [1]. After fusion with the lysosomes, the cellular waste is degraded by acidic lysosomal hydrolases (Figure 1). Disruption of the autophagy process is implicated in numerous human diseases and pathophysiological conditions, including neurodegenerative, infectious, autoimmune, cardiovascular, rheumatic, metabolic, pulmonary, and malignant diseases and ageing [2,3]. For this reason, it is important to find interventions such as treatment methods and/or substances that counteract impaired autophagy. Autophagy is known to be triggered under stress conditions such as starvation, hypoxia, DNA damage, ER stress, pathogen infection [4], and, in the case of this protocol, hyperthermia. The hyperthermia or heat treatment was carried out using an IRAcubator to induce autophagy. This device is a portable incubator that uses infrared-A radiation in the wavelength range from 780 to 1,400 nm, which heats the human fibroblasts to 39 °C. This is just one example of a possible treatment method for influencing autophagy. Regardless of the investigated intervention, however, a reliable and reproducible method is required for such measurements. Common methods for detecting autophagy are transmission electron microscopy (TEM) or western blot. However, TEM is very expensive and more suitable for analysing the location rather than the number of autophagosomes. Western blot requires a large amount of sample material, is very time-consuming, and expensive. Other methods such as the LC3 HiBiT reporter assay or other reporter systems are more suitable for cell lines than for primary cells. Another possible method, which was also used in our paper [5], could be the quantification by flow cytometry after staining with anti-LC3 FITC conjugated antibodies. However, this method is currently only established in our laboratory for peripheral blood mononuclear cells (PBMCs) and not for human fibroblasts.
The CYTO-ID® Autophagy Detection Kit used in this protocol contains a green dye that has been optimised by identifying titratable functional components that allow minimal staining of lysosomes while showing bright fluorescence when incorporated into pre-autophagosomes, autophagosomes, and autolysosomes. The kit also contains Hoechst dye for nuclear staining to enable the detection of autophagosomes per nucleus. In addition, the lysosomal inhibitor chloroquine can be added as a positive control. By inhibiting lysosomal degradation, the autophagosomal process is interrupted and autophagosomes accumulate (Figure 1). This means that in the wells that also contain chloroquine, a higher number of autophagosomes per nucleus should be seen if the staining has worked properly. For this reason, additional wells with added chloroquine were prepared for both conditions as a positive control for the assay.
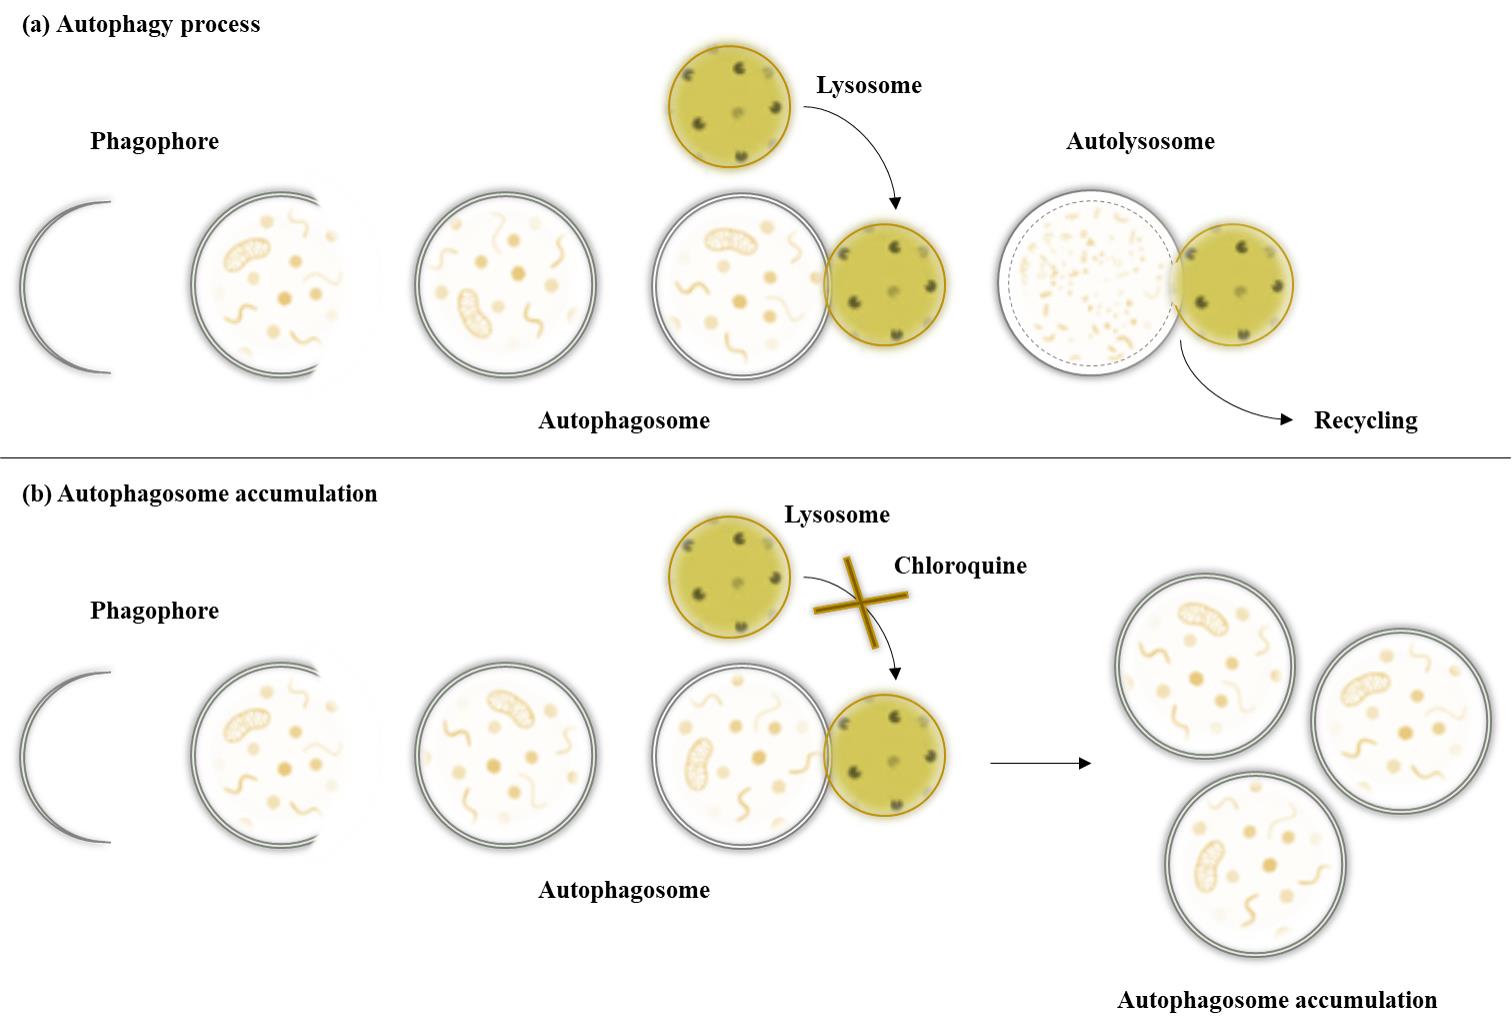
Figure 1. Autophagy pathway under different conditions. After maturation of the autophagosomes, the vesicles are either degraded by fusion with lysosomes or accumulate due to the inhibition of lysosomal fusion by chloroquine.
The advantages of this method are that it is easy to use and not time-consuming. Furthermore, it is not only suitable for heat therapy but can also be adapted to any other desired therapy or substance. It can also be adapted to other adherent cells such as HeLa cells. The method is not suitable for small, round cells such as peripheral blood mononuclear cells (PBMCs).
Materials and reagents
Biological materials
Primary human skin fibroblasts, prepuce of a healthy eight-year-old male donor, passage 08–09
Reagents
Fetal bovine serum (FBS) (Gibco, catalog number: 11573397)
Trypsin-EDTA (0.5%) (Gibco, catalog number: 10779413)
Chloroquine diphosphate (TOCRIS, catalog number 4109)
Dimethyl sulphoxide (DMSO) ≥ 99.5%, BioScience grade (Carl Roth, catalog number: A994.2)
Dulbecco’s modified Eagle’s medium, high glucose (DMEM) (Gibco, catalog number: 41966052)
Gentamycin (10 mg/mL) (Gibco, catalog number: 11500506)
Sodium chloride (NaCl) (Carl Roth, catalog number: 3957)
Di-sodium hydrogen phosphate dodecahydrate (Na2HPO4·12H2O) (Carl Roth, catalog number: N350)
Potassium dihydrogen phosphate (KH2PO4) (Carl Roth, catalog number: 3904)
Potassium chloride (KCl) (Carl Roth, catalog number: 6781)
CYTO-ID® Autophagy Detection Kit 2.0 (Enzo Life Sciences GmbH, catalog number: ENZ-KIT175-0200)
Solutions
1× Phosphate buffered saline (PBS) (see Recipes)
DMEM for fibroblasts (see Recipes)
Stop solution (see Recipes)
Cryomedium (see Recipes)
1× assay buffer (see Recipes)
Staining solution (see Recipes)
Recipes
1× Phosphate buffered saline (PBS)
Note: Adjust pH value to 7.4. Autoclave 10× PBS; for 1× PBS, dilute 10× stock 1:10 with deionized water (50 mL of 10× PBS + 450 mL of deionized water), autoclave, and store at room temperature.
Reagent Final concentration (10×) Quantity or volume (10×) NaCl 8.0% (w/v) 80.0 g KCl 0.2% (w/v) 2.0 g Na2HPO4·12H2O 1.78% (w/v) 17.8 g KH2PO4 0.24% (w/v) 2.4 g Deionized water n/a ad 1,000 mL Total (optional) n/a 1,000 mL DMEM for fibroblasts (medium)
Note: Store at 4 °C.
Reagent Final concentration Quantity or Volume DMEM 90.5% (v/v) 500 mL FBS 9.05% (v/v) 50 mL Gentamycin 0.45% (v/v) 2.5 mL Total (optional) 100% 552.5 mL Stop solution
Note: Store at 4 °C.
Reagent Final concentration Quantity or Volume 1× PBS 90.91% (v/v) 500 mL FBS 9.09% (v/v) 50 mL Total (optional) 100% 550 mL Cryomedium
Note: Store at 4 °C.
Reagent Final concentration Quantity or Volume FBS 90% (v/v) 45 mL DMSO 10% (v/v) 5 mL Total (optional) 100% 50 mL 1× assay buffer
Note: Store at 4 °C.
Reagent Final concentration Quantity or Volume 10× assay buffer (from CYTO-ID®) 1× 1 mL Deionized water 9 mL Total (optional) n/a 10 mL Staining solution (CYTO-ID®)
Note: Prepare immediately before use, do not store. All listed ingredients are part of the CYTO-ID® Autophagy Detection Kit 2.0.
Reagent Final concentration Quantity or Volume 1× assay buffer n/a 2.4 mL CYTO-ID® green detection reagent n/a 4.8 µL Hoechst 33342 Nuclear Stain n/a 2.4 µL Total (optional) n/a 2407.2 µL
Laboratory supplies
Centrifuge tubes, 15 and 50 mL (SARSTEDT, catalog numbers: 62.554.502, 62.547.254)
Reaction tube, 1.5 and 2 mL (SARSTEDT, catalog numbers: 72.706, 72.695.500)
CryoPure vial, 1.6 mL (SARSTEDT, catalog number: 72.380.992)
Pipette tips, 20, 200, and 1,000 μL (SARSTEDT, catalog numbers: 701.114.210, 70.3030, and 70.3050)
Serological pipettes, 5, 10, and 25 mL (SARSTEDT, catalog numbers: 86.1253.001, 86.1254.001, and 86.1685.001)
Cell culture plate, 96-well microplate (Greiner, catalog number: 655090)
Cell culture flask, T175, Cell+ (SARSTEDT, catalog number: 83.3912.302)
Equipment
Pipettes: Eppendorf Research® Plus 10 μL, 20 μL, 200 μL, 1,000 μL (Eppendorf, catalog numbers: 3123000020, 3123000039, 3123000055, 3123000063)
Multichannel microliter pipette Transferpette®, 20–200 µL (BRAND GMBH + CO.KG, catalog number: 9280173)
Pipetting aid: PipetBoy acu 2 (Integra Biosciences, catalog number: 155 000)
Neubauer counting chamber improved (Carl Roth, catalog number: PC72.1)
Inverted microscope: Primovert, Objektiv Plan-Achromat 4×/0.10, 10×/0.25 Ph1 (Carl Zeiss, catalog numbers: 415510-1100-000, 415500-1600-001, 415500-1605-001)
Water bath (GFL, catalog number: 1003)
Microcentrifuge Eppendorf 5424 (Eppendorf, catalog number: 05-400-005)
Swing out rotor centrifuge Eppendorf 5804 R (Eppendorf, catalog numbers: 5805000010, 5804709004)
Water purification system ELGA® PURELAB flex 3 (Veolia, catalog number: PF3XXXXM1)
pH meter FE20 FiveEasyTM (Mettler Toledo, catalog number: 30266626)
Heat treatment IRAcubator (Von Ardenne Institut für Angewandte Medizinische Forschung GmbH)
Incubator at 37 °C with 5% CO2, 90% humidity (HERA Cell 240, catalog number: 2510-413-01)
BioTek Cytation 1 cell imaging multimode reader, DAPI 377, 447; GFP 469, 525 (Agilent, model: CYT1AGV)
Software and datasets
Gen 5 Image Prime (3.09.07, 01/10/2020), license needed
Procedure
Cell expansion
Thaw 5 × 10⁶ primary human skin fibroblasts (passage 08) in 30 mL of stop solution.
Centrifuge at 500× g for 3 min at room temperature.
Discard the stop solution.
Seed fibroblasts in T175 bottles. Distribute the 5 × 10⁶ cells into five T175 cell culture flasks (approximately 1 × 10⁶ cells per T175 flask) with 20 mL of DMEM for fibroblasts medium per flask.
Check cells by microscopy and cultivate them under standard tissue culture conditions at 37 °C and 5% CO2 in a humidified incubator.
If necessary, change the medium and divide the cells into new T175 bottles when they have reached 70% confluence.
Expand the cells until the number of cells required for all planned experiences is reached.
Note: All experiments should be carried out with the same cell passage in order to achieve better reproducibility and comparability.
Freeze all cells in 0.5 × 10⁶ cells (passage 09) per portion in 1 mL of cryomedium in CryoPure vials.
Cell thawing for experiment
Thaw 0.5 × 10⁶ primary human skin fibroblasts (passage 09) of the previous expanded cells in 10 mL of stop solution.
Centrifuge at 500× g for 3 min at room temperature.
Discard the stop solution.
Seed all cells in a T175 cell flask with 20 mL of DMEM for fibroblasts medium
Cultivate human fibroblasts under standard tissue culture conditions at 37 °C and 5% CO2 in a humidified incubator.
Caution: The human fibroblasts should be expanded for at least two days after thawing to allow the cells to regenerate after the freeze/thaw process. Cells should not exceed a confluence of 70%.
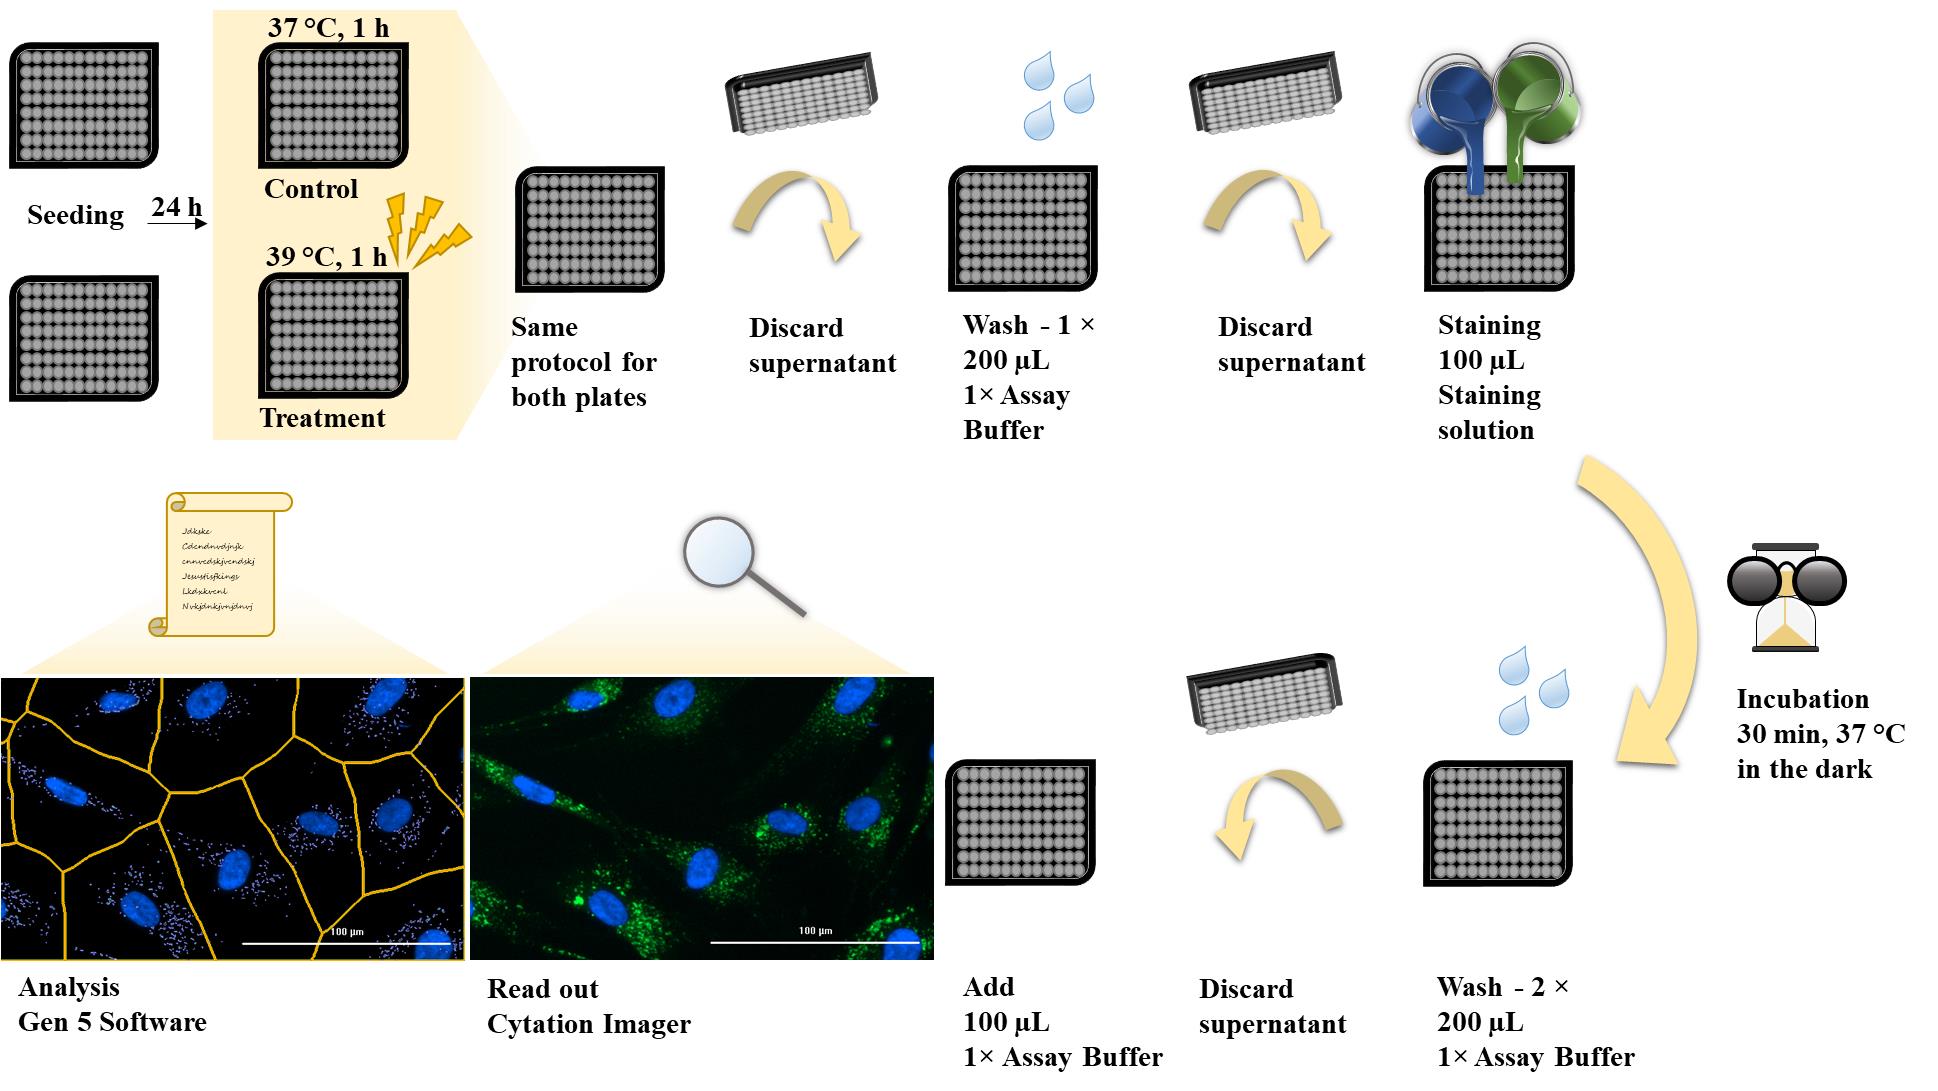
Cell seeding and treatment
After an appropriate incubation period, remove the cells with 0.05% Trypsin-EDTA.
Note: Incubate at 37 °C for approximately 2 min and observe the detachment process under the microscope.
Prepare 12 wells per plate (control plate, treatment plate) with 5,000 cells each in 100 µL of DMEM for fibroblasts medium.
Note: In order to achieve an even cell seeding, leave the plate for 1 h at room temperature without moving.
Incubate cells for approximately 24 h at 37 °C and 5% CO2.
The next day, proceed in the same way for both plates (Figure 2):
Add 100 µL of DMEM for fibroblasts per well to six wells.
Add 100 µL of 0.5 µM chloroquine (diluted in DMEM for fibroblasts) per well to the other six wells.
Caution: The duration of the chloroquine treatment should be approximately 1 h, so steps C4–C7 must be carried out quickly.
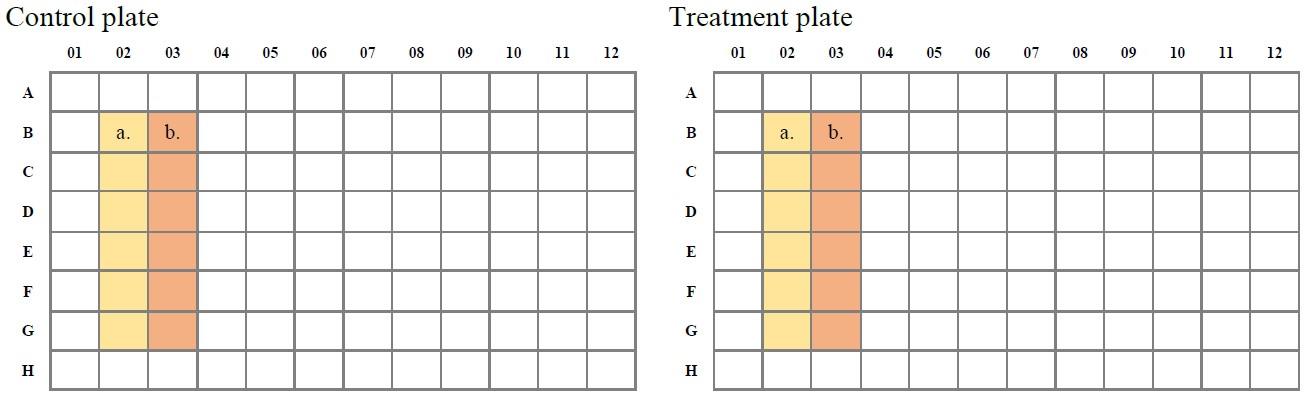
Figure 2. Plate layouts. Both plates, the control plate and the treatment plate, contain six wells with medium (a.) for the measurement and six wells with 0.5 µM chloroquine (b.) as a positive control.Mix all prepared wells by pipetting.
Caution: Mix the solutions gently, as harsh pipetting could detach and stress the cells.
The IRAcubator should be preheated to 39 °C.
Place the control plate in a humidified incubator at 37 °C and 5% CO2 for 1 h.
Place the treatment plate in the IRAcubator at 39 °C for 1 h (Figure 3).
Note: Ensure that the 96-well plate is centred over the temperature sensor.
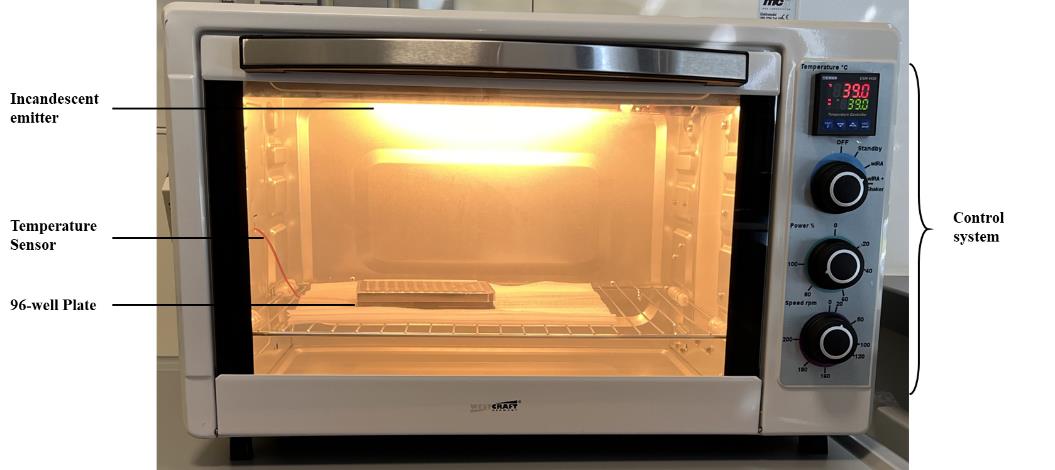
Figure 3. Placement of the treatment plate in the IRAcubator heat treatment device
Cyto-ID® staining
Discard the supernatant (DMEM for fibroblasts, 0.5 µM chloroquine) by turning the plate over on laboratory tissue paper.
Note: The Cytation Imager can only read one plate at a time; therefore, a delay is required between the two plates so that they can be measured one after the other. Start staining with the treatment plate until step D4 and then continue with the control plate after approximately 10 min.
Wash all wells with 200 µL of 1× assay buffer and discard the supernatant by turning the plate over on laboratory tissue paper.
Note: Allow the assay buffer to warm to room temperature.
Add 100 µL of staining solution (see Recipes).
Incubate the plate in the dark in a humidified incubator at 37 °C and 5% CO2 for 30 min.
Wash all wells twice with 200 µL of 1× assay buffer and discard supernatant by turning the plate over on laboratory tissue paper.
Add 100 µL of 1× assay buffer to each well and image the cells immediately.
Cell imaging
Define the imaging settings (paper button) as shown in Figure 4. Capture two images in the middle of each well.
Note: The button in the right-hand corner (e.g., 30/96) allows you to specify which wells of the plate are to be measured. These settings should match the layout of the panel.
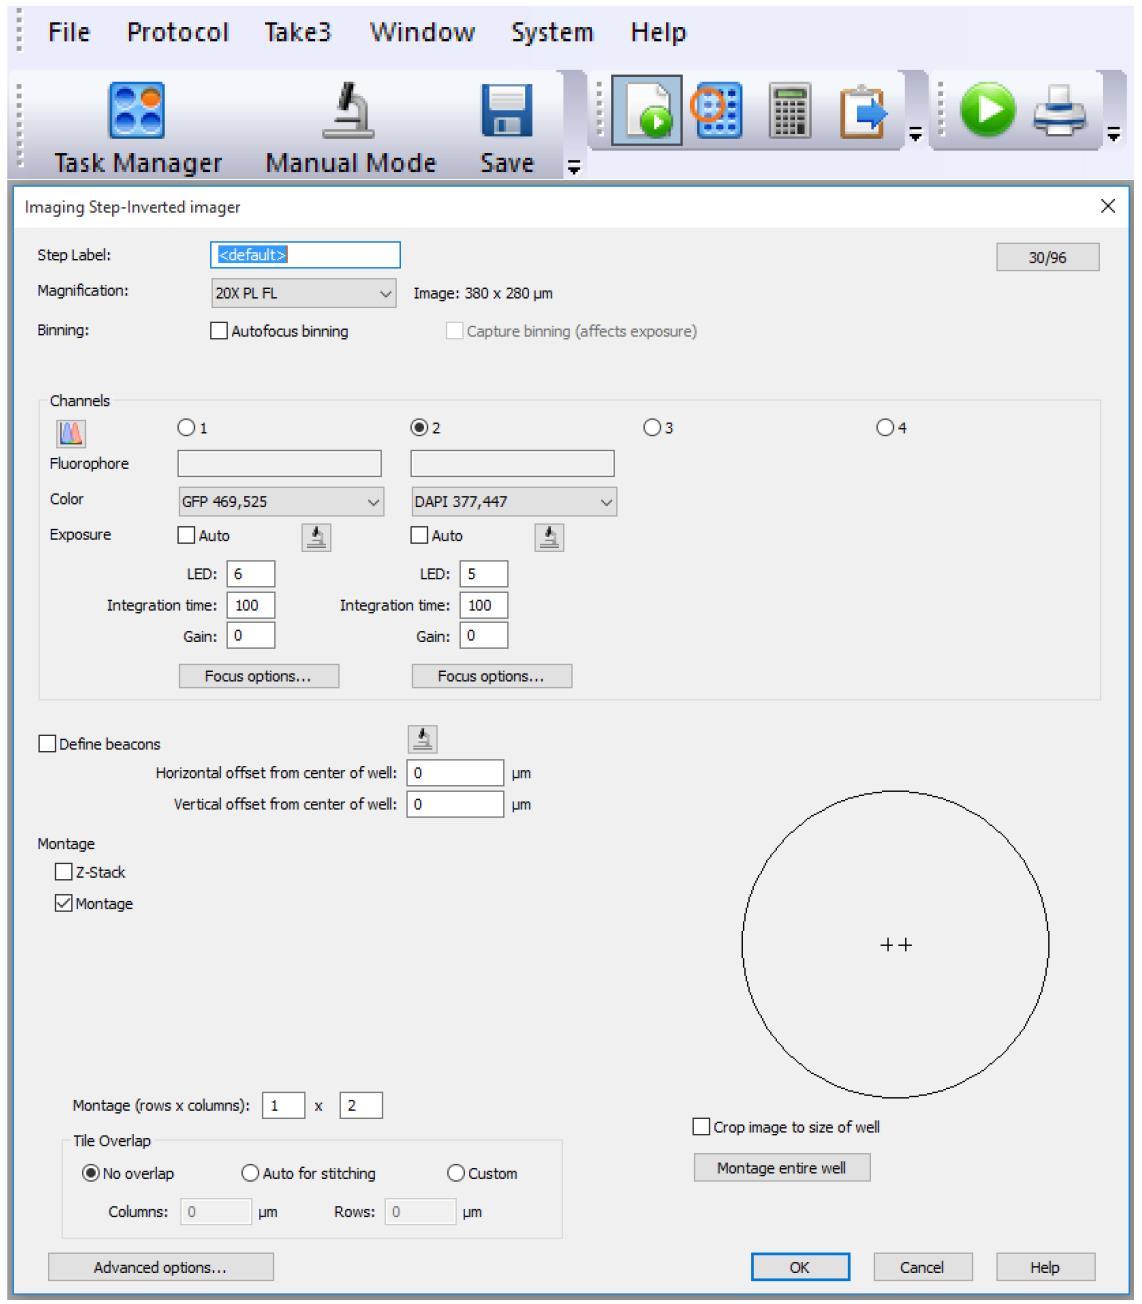
Figure 4. Imaging settingsDefine the plate layout (plate button) as shown in Figure 5.
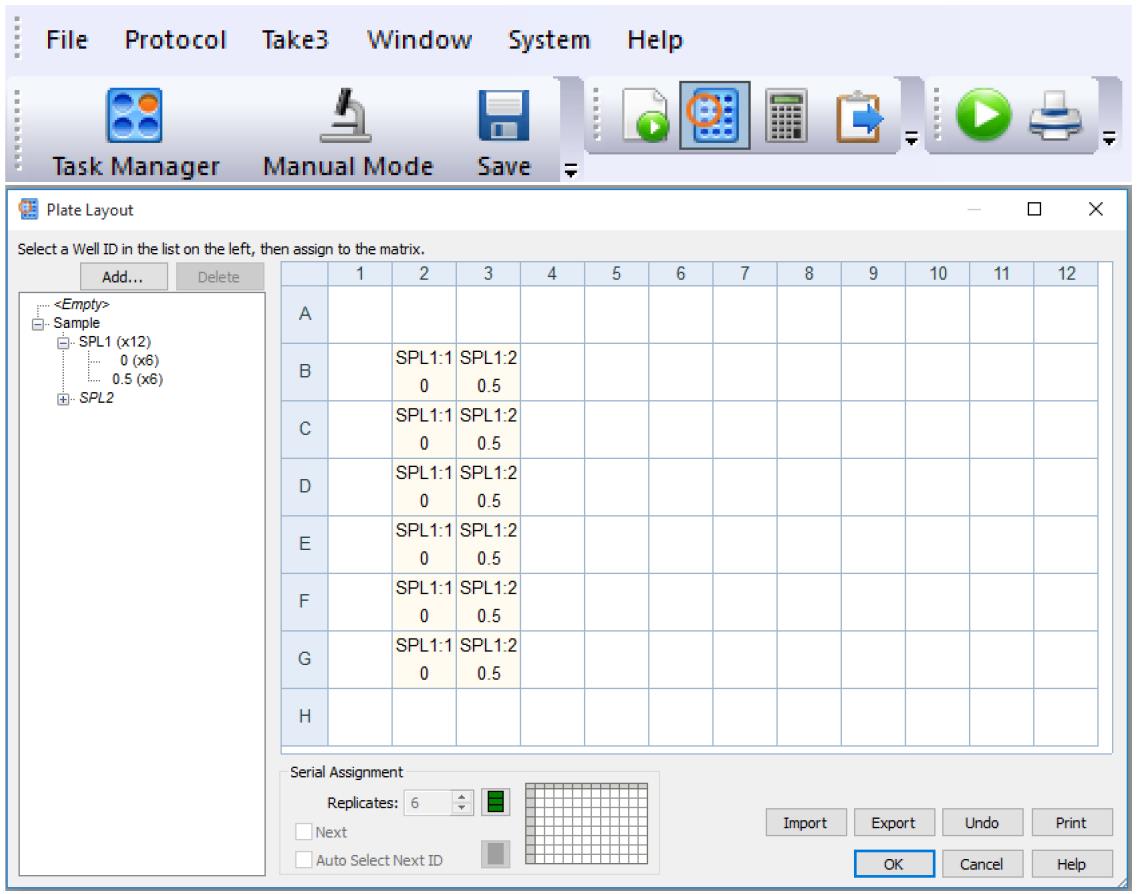
Figure 5. Plate layout definitionDefine the parameters for image processing (calculator button) and cell analysis as specified in Table 1.
Table 1. Settings of the Gen 5 image analysis software
Imaging preprocessing Image deconvolution Image set DAPI Image set Tsf [GFP 469,525]
Tsf [DAPI 377,447]Background Dark Point spread function Auto, based on objective Rolling bar diameter 66 µm Iterations 5 Image smoothing strength 0 Data out prefix Deconvolved Image set GFP Background Dark Rolling bar diameter 1.5 µm Priority Fine results Image smoothing strength 0 Cellular analysis Primary mask
and countDeconvolved
[Tsf [DAPI 377,447]] Deconvolved
[Tsf [GFP 469,525]]Secondary Mask Deconvolved
[Tsf [GFP 469,525]]Threshold Auto Background Dark Background Dark Measure within a
primary maskChecked
Use Primary MaskObject selection
Min. object size
Max. object size
5 µm
40 µmMeasure within a secondary mask Checked Expand primary mask 50 µm Threshold Unchecked Count spots Checked Size 0.5–5 µm Advanced options Count spots options Rolling ball size Default Threshold 1200 Curve Analysis: Autophagosomes per nucleus Start the process by pressing the Start button (play button).
Data analysis
As indicated, six technical replicates are recommended per condition. Two images are taken in the middle of the well for each technical replicate. Figure 6 shows an example of successful cell imaging with subsequent image processing and cell analysis.
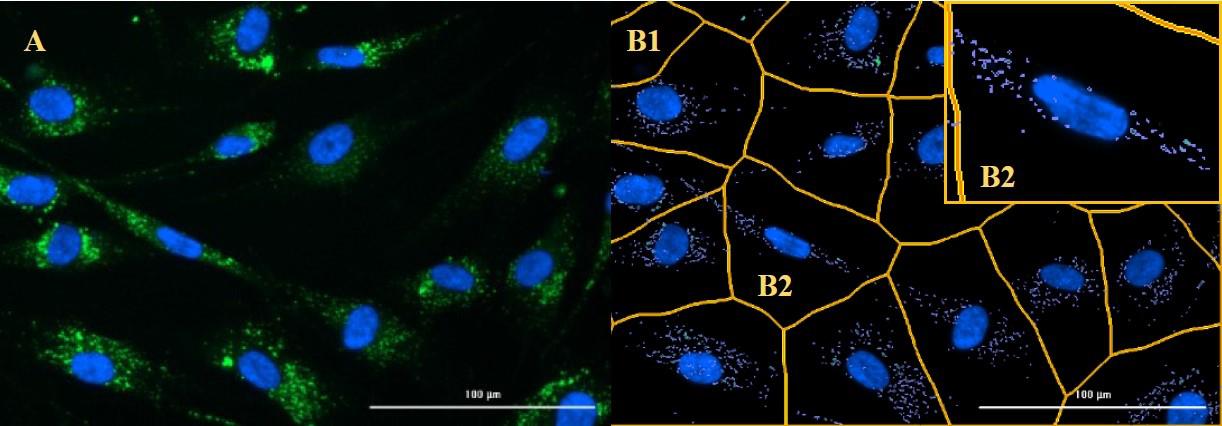
Figure 6. Example of successful cell imaging (A), image processing and cell analysis (B1, B2). After image processing, the predefined masks are placed around the cell nuclei (B1). All autophagosomes in this area are counted and assigned to the respective cell nucleus (B2).
Unfortunately, the imager is not always able to find the right focus to capture a sharp image (Figure 7). For this reason, it is necessary to go through all the images, check their sharpness, and sort them out by masking them, so that they are not included in the calculation.
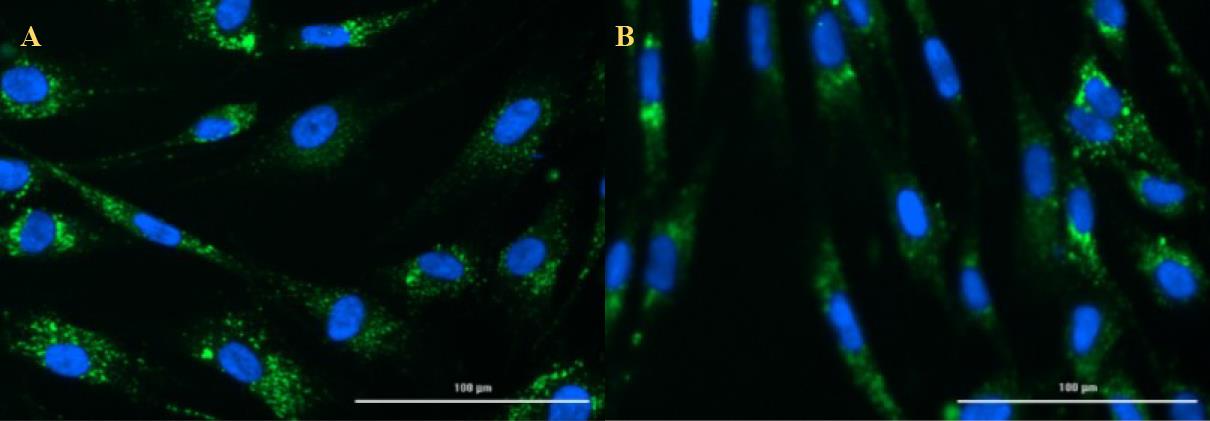
Figure 7. Example of a sharp image (A) and an image out of focus (B). Once the sharpness of the images has been checked, the calculated data is exported to Excel and analysed using statistical software of your choice.
Validation of protocol
This protocol or parts of it has been used and validated in the following research article:
Hochecker et al. [5]. Heat treatment in health and disease: How water-filtered infrared-A (wIRA) irradiation affects key cellular mechanisms in myalgic encephalomyelitis/chronic fatigue syndrome (ME/CFS) patients compared to healthy donors. Journal of Thermal Biology (Figure 1).
General notes and troubleshooting
General notes
In order to maintain ideal growth conditions for the cells, they should not exceed a confluency of 70%. In the case of mortal cell lines, the cell lines change as a result of cultivation, and the phenotype becomes increasingly different from the original cells. Therefore, no cells above passage 12 should be used for the experiments.
The software is not capable to distinguish the individual autophagosomes in small and round cells like PBMCs (Figure 8). This can be explained by the difficulty in finding the correct focus in round and non-planar objects, as well as the overlapping of autophagosomes, which is also due to the round cell morphology and the limited space in the small cells.
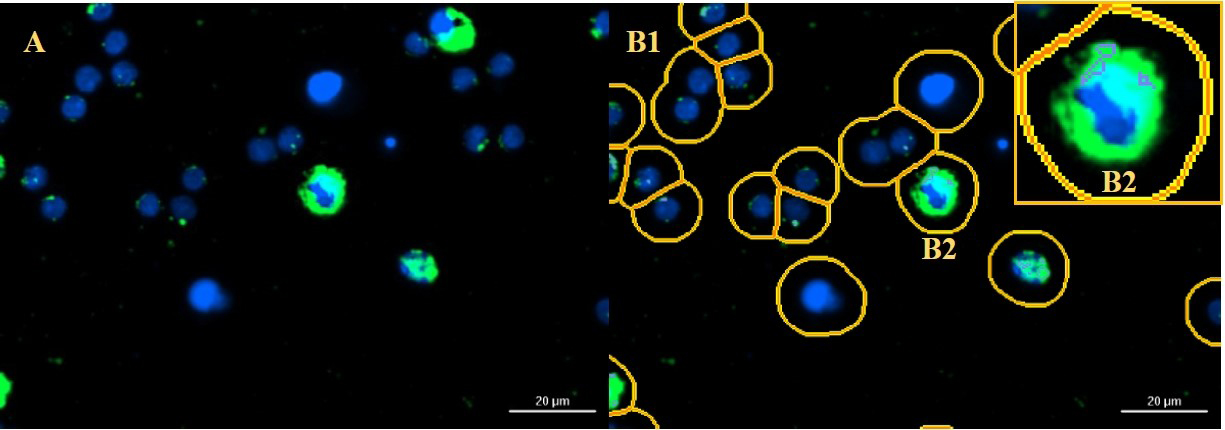 Figure 8. Example of unsuccessful cell imaging of human peripheral blood mononuclear cells (PBMCs) (A), image processing and cell analysis (B1, B2)
Troubleshooting
Problem 1: No or too few cells in the cell imaging.
Possible causes: Too few cells sown or careless washing of the cells.
Solutions: Plate more cells or wash more carefully.
Problem 2: The imager cannot find the right focus.
Possible causes: Too few cells in the image, insufficient staining, or technical aspects.
Solutions: Adjust the cell count, wash more carefully, or adjust staining.
Problem 3: Inadequate staining or background fluorescence.
Possible causes: Staining solution is not suitable or too long incubation with the staining solution.
Solutions: Optimise the concentrations of the staining solution compartments or adjust the incubation time.
Problem 4: The chloroquine control does not show a higher amount of autophagosomes compared to the samples without chloroquine (established cells and chloroquine concentration).
Possible causes: Something went wrong during the assay (treatment or staining process).
Solutions: As the results are not reliable, the test should be repeated.
Problem 5: The chloroquine control does not show a higher amount of autophagosomes compared to the samples without chloroquine (new cells and/or treatment).
Possible causes: Chloroquine concentration too low to achieve an effect, very strong effect of the investigated treatment on autophagy → saturation.
Solutions: Optimise the chloroquine concentration, adapt the treatment conditions if possible.
Problem 6: Cells are not, too little, or too strongly stained.
Possible causes: The colouring solution was forgotten, prepared incorrectly, or the concentrations of the components are not suitable.
Solutions: Repeat the experiment or optimise the staining solution.
Problem 7: Only nuclei or only autophagosomes are visible and not both.
Possible causes: Hoechst or CYTO-ID® green detection reagents were forgotten.
Solution: Repeat the experiment.
Further troubleshooting instructions for the CTYO-ID® Autophagy Detection Kit can be found in the product manual.
Further troubleshooting instructions for the Gen 5 software and the Cytation 1 Imager can be found in the respective product manuals.
Acknowledgments
The authors thank Dr. Astfalk for kindly providing skin samples. They also thank Dr. Alexander von Ardenne and Noah Molinski for the construction of the IRAcubator and the good cooperation. This work was funded by the “Professor Manfred von Ardenne Forschungsförderungsgesellschaft e.V.” This study was supported by the Baden-Württemberg Ministry for Science, Research and Art (MWK Baden-Württemberg) through the “Kooperatives Promotionskolleg (KPK) InViTe2 Sigmaringen / Konstanz,” in which Barbara Hochecker is an associated PhD student. This protocol was used in Hochecker et al. [5].
Competing interests
The authors declare the following financial interests/personal relationships, which may be considered as potential competing interests: Barbara Hochecker reports financial support was provided by “Professor Manfred von Ardenne Forschungsförderungsgesellschaft e.V.”
Ethical considerations
All experiments were performed in accordance with the Declaration of Helsinki and approved by the Ethics Committee of the Medical Association of Baden-Württemberg, Germany. Patients were informed in advance and gave their written consent to the use of their samples.
References
- Yim, W. Y. and Mizushima, N. (2020). Lysosome biology in autophagy. Cell Discov. 6(1): 6.
- Rabinowitz, J. D. and White, E. (2010). Autophagy and metabolism. Science. 330(6009): 1344–1348.
- Galluzzi, L., Baehrecke, E. H., Ballabio, A., Boya, P., Bravo‐San Pedro, J. M., Cecconi, F., Choi, A. M., Chu, C. T., Codogno, P., Colombo, M. I., et al. (2017). Molecular definitions of autophagy and related processes. EMBO J. 36(13): 1811–1836.
- King, J. S., Veltman, D. M. and Insall, R. H. (2011). The induction of autophagy by mechanical stress. Autophagy. 7(12): 1490–1499.
- Hochecker, B., Molinski, N., Matt, K., Meßmer, A., Scherer, M., von Ardenne, A. and Bergemann, J. (2024). Heat treatment in health and disease: How water-filtered infrared-A (wIRA) irradiation affects key cellular mechanisms in myalgic encephalomyelitis/chronic fatigue syndrome (ME/CFS) patients compared to healthy donors. J Therm Biol. 120: 103813.
Article Information
Publication history
Received: Apr 2, 2024
Accepted: May 30, 2024
Available online: Jun 23, 2024
Published: Jul 5, 2024
Copyright
© 2024 The Author(s); This is an open access article under the CC BY-NC license (https://creativecommons.org/licenses/by-nc/4.0/).
How to cite
Hochecker, B., Matt, K. C., Meßmer, A. L., Scherer, M. M. and Bergemann, J. (2024). Quantification of Autophagosomes in Human Fibroblasts Using Cyto-ID® Staining and Cytation Imaging. Bio-protocol 14(13): e5025. DOI: 10.21769/BioProtoc.5025.
Category
Cell Biology > Cell imaging > Live-cell imaging
Cell Biology > Cell viability > Cell death
Do you have any questions about this protocol?
Post your question to gather feedback from the community. We will also invite the authors of this article to respond.