- Protocols

- Articles and Issues
- For Authors
- About
- Become a Reviewer

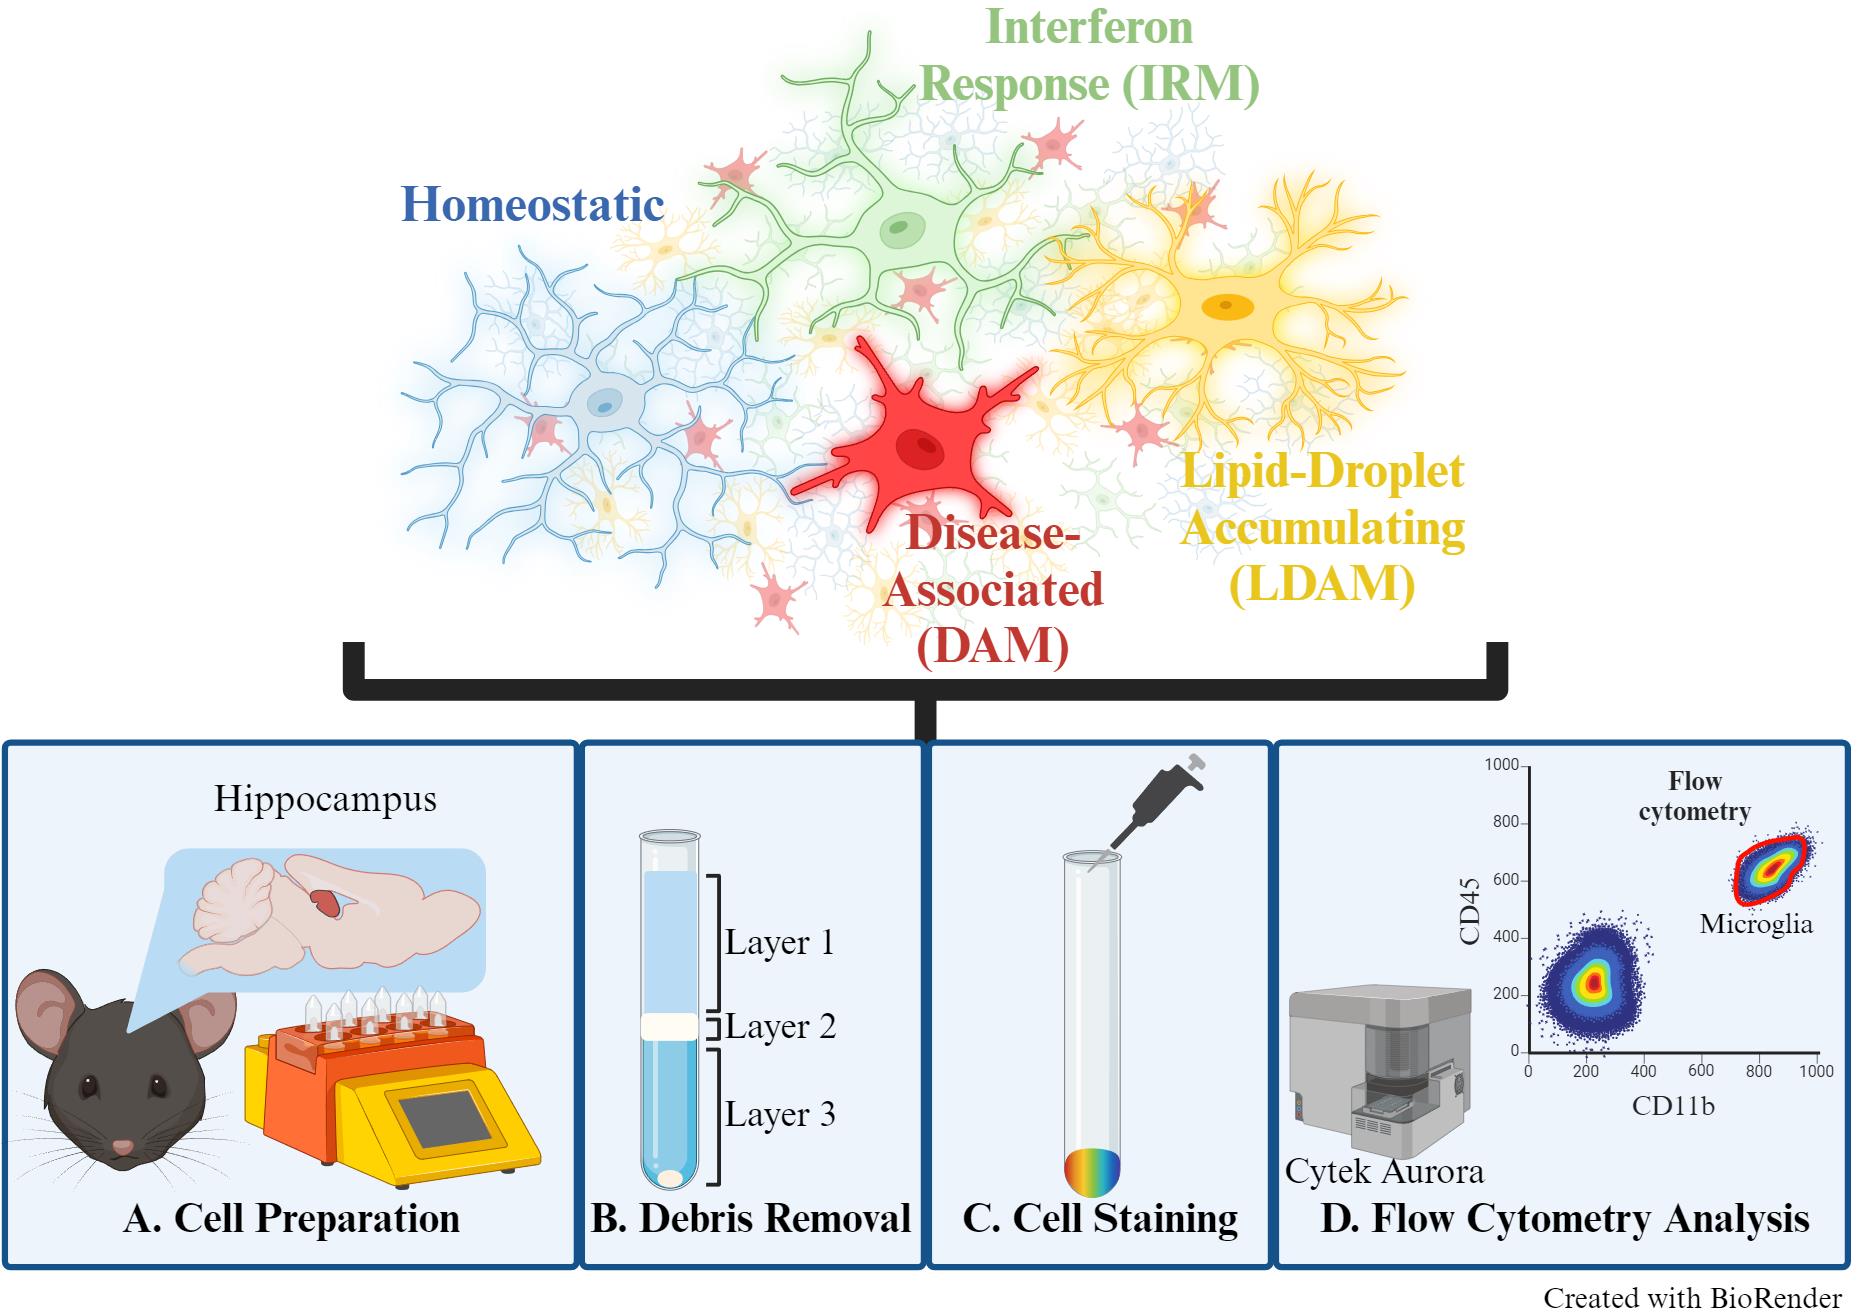
Flow Cytometry Analysis of Microglial Phenotypes in the Murine Brain During Aging and Disease
Published: Vol 14, Iss 12, Jun 20, 2024 DOI: 10.21769/BioProtoc.5018 Views: 3650
Reviewed by: Geoffrey C. Y. LauSuresh KumarAnonymous reviewer(s)
Original research article
The authors used this protocol in:

Aug 2023
Advertisement


Protocol Collections
Comprehensive collections of detailed, peer-reviewed protocols focusing on specific topics


Related protocols

Abstract
Microglia, the brain's primary resident immune cell, exists in various phenotypic states depending on intrinsic and extrinsic signaling. Distinguishing between these phenotypes can offer valuable biological insights into neurodevelopmental and neurodegenerative processes. Recent advances in single-cell transcriptomic profiling have allowed for increased granularity and better separation of distinct microglial states. While techniques such as immunofluorescence and single-cell RNA sequencing (scRNA-seq) are available to differentiate microglial phenotypes and functions, these methods present notable limitations, including challenging quantification methods, high cost, and advanced analytical techniques. This protocol addresses these limitations by presenting an optimized cell preparation procedure that prevents ex vivo activation and a flow cytometry panel to distinguish four distinct microglial states from murine brain tissue. Following cell preparation, fluorescent antibodies were applied to label 1) homeostatic, 2) disease-associated (DAM), 3) interferon response (IRM), and 4) lipid-droplet accumulating (LDAM) microglia, based on gene markers identified in previous scRNA-seq studies. Stained cells were analyzed by flow cytometry to assess phenotypic distribution as a function of age and sex. A key advantage of this procedure is its adaptability, allowing the panel provided to be enhanced using additional markers with an appropriate cell analyzer (i.e., Cytek Aurora 5 laser spectral flow cytometer) and interrogating different brain regions or disease models. Additionally, this protocol does not require microglial cell sorting, resulting in a relatively quick and straightforward experiment. Ultimately, this protocol can compare the distribution of microglial phenotypic states between various experimental groups, such as disease state or age, with a lower cost and higher throughput than scRNA-seq.
Key features
• Analysis of microglial phenotypes from murine brain without the need for cell sorting, imaging, or scRNA-seq.
• This protocol can distinguish between homeostatic, disease-associated (DAM), lipid-droplet accumulating (LDAM), and interferon response (IRM) microglia from any murine brain region and/or disease model of interest.
• This protocol can be modified to incorporate additional markers of interest or dyes when using a cell analyzer capable of multiple color detections.
Keywords: MicrogliaGraphical overview
Background
Microglia are brain-resident immune cells that contribute to the neuroenvironment through diverse functions, including debris phagocytosis, neuronal support, and synaptic pruning. Their multifaceted roles align with distinct phenotypic states, largely influenced by environmental stimuli and intrinsic signaling cascades [1]. These specialized cells are involved in many neurological diseases, such as Alzheimer’s disease (AD). For instance, the disease-associated microglia (DAM) phenotype was first identified in an AD mouse model and has since been further validated to play a role in response to neurodegeneration [2]. Differentiating and quantifying microglial phenotypic states offers valuable insights into pathways associated with development and disease processes, presenting promising avenues for therapeutic exploration. Although fluorescent immunolabeling and microscopy can be used to distinguish microglial phenotypes, this approach is time-consuming, and quantification requires multiple tissue sections. Alternatively, sequencing-based approaches, though providing high-throughput and high-resolution data, are costly and demand specialized analytical training. Here, we present a fluorescence-based flow cytometry method to distinguish microglial phenotypic states, allowing for high-throughput, multiparametric analysis of single-cell suspensions with straightforward quantification tools.
In this protocol, we describe a simple and time-effective preparation of single-cell suspensions from murine brain tissue for flow cytometric analysis to distinguish multiple microglial phenotypes. Microglia have been previously described as either “M1” (pro-inflammatory) or “M2” (anti-inflammatory) to indicate “active” or “resting” states, respectively. However, the field has since moved to more descriptive terms such as “homeostatic” or specific “reactive” phenotypes, given that microglia are in a constant state of activity to respond to stimuli [3]. Therefore, this panel can distinguish between non-reactive/surveying (homeostatic) or reactive [DAM, interferon-response microglia (IRM), and lipid-droplet accumulating microglia (LDAM)] microglial phenotypes [3]. This protocol was previously used to examine sex differences in microglial phenotypic states during aging [4]. The markers for each of the examined phenotypes (homeostatic, DAM, IRM, and LDAM) were selected from several publications [2,5–10], ensuring no overlap between states, and are listed within the Materials and Reagents section.
A notable advantage to this protocol is the adaptability of this microglial phenotype panel, allowing for additional fluorescent antibodies or dyes depending on the laser and filter capabilities of the chosen cell analyzer. The use of fluorescent dyes offers in vivo examination of microglial phenotypes, including Methoxy-X04 (amyloid-β plaques) [11] and BODIPY (lipid accumulations) [10], where colocalization with these markers is useful in identifying DAM and LDAM phenotypes, respectively. This flexibility facilitates versatile applications in studying microglia. While initially utilized to examine sex differences in hippocampal microglial aging, this protocol can be applied to address various biological questions relevant to multiple murine disease models and other brain regions.
Materials and reagents
Biological materials
Mice: C57BL/6N (or any mouse line of interest)
Note: The data presented in the primary research article was generated in adult mice between 3 and 25 months of age. This protocol has not been tested on microglia isolated from neonatal or juvenile mice.
Reagents
Adult Brain Dissociation kit (Miltenyi Biotec, catalog number: 130-107-677)
D-PBS, calcium, magnesium, glucose, pyruvate (Gibco, catalog number: 14-287-072)
Cell staining buffer (BioLegend, catalog number: 420201)
TruStain FcX (BioLegend, catalog number: 101319)
Actinomycin D (Streptomyces species) (Sigma-Aldrich, catalog number: A1410-5MG)
Anisomycin (Streptomyces griseolus) (Sigma-Aldrich, catalog number: A9789-25MG)
Triptolide (Sigma-Aldrich, catalog number: T3652-1MG)
Dimethyl Sulfoxide (DMSO) (Fisher Scientific, catalog number: D1281)
Antibodies used for each microglia phenotype (Table 1)
Table 1. Antibody list for microglial phenotypes
Phenotype Antibody Conc. Fluorophore Clone Host Vendor Catalog # Dilution Canonical CD11b 0.2 mg/mL Brilliant Violet 421TM M1/70 Rat BioLegend 101235 1:50 Canonical (hematopoietic) CD45 0.2 mg/mL Brilliant Violet 785TM 30-F11 Rat BioLegend 103149 1:40 Homeostatic P2RY12 0.2 mg/mL APC/FireTM 810 S16007D Rat BioLegend 848013 1:50 Disease-associated microglia (DAM) CD11c 0.2 mg/mL Brilliant Violet 605TM N418 Arm. Hamster BioLegend 117334 1:50 Disease-associated microglia (DAM) CD282 0.2 mg/mL PE/Cyanine7 QA16A01 Mouse BioLegend 153011 1:50 Disease-associated microglia (DAM) CLEC7A 9 μg/300 μL APC REA154 Human Miltenyi 130102985 1:50 Interferon response Microglia (IRM) CD317 0.2 mg/mL Brilliant Violet 650TM 927 Rat BioLegend 127019 1:50 Lipid-droplet accumulating microglia (LDAM) CD63 0.2 mg/mL PE NVG-2 Rat BioLegend 143903 1:40
Solutions
Actinomycin D (5 mg/mL stock solution) (see Recipes)
Triptolide (10 mM stock solution) (see Recipes)
Anisomycin (10 mg/mL stock solution) (see Recipes)
Actinomycin D (5 mg/mL stock solution)
Reconstitute actinomycin D in DMSO to a concentration of 5 mg/mL.
Aliquot and store at -20 °C protected from light.
Triptolide (10 mM stock solution)
Reconstitute triptolide in DMSO to a concentration of 10 mM.
Aliquot and store at -20 °C protected from light.
Anisomycin (10 mg/mL stock solution)
Reconstitute anisomycin in DMSO to a concentration of 10 mg/mL.
Aliquot and store at 4 °C protected from light.
Laboratory supplies
GentleMACS C tubes (Miltenyi Biotec, catalog number: 130-096-334)
MACS SmartStrainer (70 μm) (Miltenyi Biotec, catalog number: 130-110-916)
15 mL centrifuge tubes (Corning, catalog number: 0553859A)
5 mL round-bottom Polystyrene test tube (Falcon, catalog number: 352054)
Strainer caps for FACS tubes (Olympus Plastics, catalog number: 28-155)
Equipment
GentleMACS Octo dissociator with heaters (Miltenyi Biotec, catalog number: 130-096-427)
Allegra X-30R centrifuge with swinging bucket (Beckman Coulter, catalog number: B08540)
Cytek Aurora 5 laser spectral flow cytometer (Cytek Biosciences, model: U0488, U1188)
Software and datasets
FlowJo v10.9.0
GraphPad Prism v9.5
Procedure
Below, we describe the step-by-step procedure for performing a flow cytometry experiment to identify microglial phenotypic states from murine brain tissue. This procedure has been used to identify sex differences in microglial phenotypic states from young and aged murine hippocampal tissue. The biological markers used in this study were selected by cross-referencing markers in common from multiple publicly available microglia data sets [2,5–10] and the commercial availability of non-overlapping fluorescent antibodies. This protocol can be optimized for additional murine disease models and brain regions.
*For all steps: Buffers, solutions, and suspensions must be kept at 4 unless otherwise noted (i.e., gentleMACS Octo dissociator with heaters).
** It is recommended to label all necessary tubes for the appropriate steps (i.e., C tubes, 15 mL, 5 mL, etc.) before starting the protocol.
Cell preparation
Note: Cell preparation and debris removal will follow the manufacturer’s instructions for the Adult Brain Dissociation kit with minor modifications, as detailed below.
Set the swinging bucket centrifuge to 4 .
Prepare the solutions from the Miltenyi Adult Brain Dissociation kit according to the manufacturer’s instructions.
Prepare Enzyme Mix 1: Buffer Z (1,900 μL/sample) + Enzyme P (50 μL/sample).
Prepare Enzyme Mix 2: Buffer Y (20 μL/sample) + Enzyme A (10 μL/sample).
Add 1,950 μL of Enzyme Mix 1 to a gentleMACS C tube.
Supplement with transcription and translation inhibitors (2 μL/sample of each) to prevent microglial ex vivo activation [12].
Actinomycin D (5 mg/mL stock solution)
Anisomycin (10 mg/mL stock solution)
Triptolide (10 mM stock solution)
Carefully dissect the hippocampus on surfaces chilled by ice.
Note: Although hippocampal tissue is used in this procedure, this protocol can be adapted for any brain region.
Euthanize mice according to the approved euthanasia method.
Note: Cardiac perfusion or intravenous labeling of circulating immune cells is recommended to exclude circulating immune cells from analysis.
Using small scissors, cut the skin carefully down the midline of the head, ending at the nasal bridge, and separate the skin from the skull laterally.
Break the nasal bridge using large scissors.
Using small scissors, cut the skull along the longitudinal fissure, beginning caudal and moving rostral.
Two distinct sides of the skull are formed. Using forceps, carefully separate the skull from the brain laterally. Avoid puncturing the brain tissue.
Remove the brain from the skull cavity and place it into a dish containing ~10 mL of ice-cold D-PBS to rinse the tissue.
Extract the brain from the dish and gently dry it with a dry wipe on an appropriate dissection surface (i.e., an aluminum plate on ice).
Using a small dissection spatula, cut into the cortex along the midline of the brain, roughly mid-brain deep.
To dissect the hippocampus, carefully peel away the cortex from one hemisphere, exposing the hippocampus. Once identified, scoop the hippocampus away from the cortex. Repeat on the opposite side.
Once isolated, cut the hippocampus into approximately four pieces and place into the appropriately labeled C tube.
Add 30 μL of Enzyme Mix 2 (from step A2b above) to each C tube containing brain tissue.
Attach the C tube to the gentleMACS Octo dissociator with heaters and use program 37C_ABDK_02 (20-100 mg of sample) or 37C_ABDK_01 (>100 mg of sample)(Miltenyi Biotech preset program).
Note: Ensure all tissue pieces are within the buffer solution to obtain the highest yield.
After completion of the program, remove the C tubes and centrifuge briefly at 300× g (immediately stop once it reaches 300× g) to collect the dissociated sample at the bottom of the tube.
Using 1 mL of D-PBS, pre-wet a 70 μm MACS SmartStrainer on a labeled 15 mL conical tube for each sample.
Resuspend each cell pellet and transfer it onto the appropriate 70 μm MACS SmartStrainer.
To retain the remaining tissue, add 10 mL of cold D-PBS to the C tube, close the tube, shake gently, and filter the complete volume to the appropriate 70 μm MACS SmartStrainer and 15 mL conical tube.
Using a swinging bucket centrifuge, centrifuge the 15 mL tube containing the cell suspensions at 300× g for 10 min at 4 .
Completely aspirate supernatant and proceed immediately to section B.
Debris removal
Resuspend (do not vortex) the pellet with 1,550 μL of D-PBS and transfer suspension to a labeled 5 mL round-bottom FACS tube.
Add 450 μL of debris removal solution.
Mix well by setting pipette volume ≥ 1,000 μL and gently mix ≥ 20 times.
Note: Proper mixing of the debris removal solution is necessary to ensure separation of the layers.
Gently overlay the cell suspension with 2 mL of D-PBS, avoiding the mixture of layers (see General Note 1).
Note: Gently tilt the 5 mL tube to a near-horizontal plane to allow for more controlled pipetting. Within the tube, place the pipette tip slightly above the top of the tilted solution and very slowly eject D-PBS, ensuring that the layersdo not mix. Pipette 1,000 µL twice for a smaller, more controllable volume.
Centrifuge the layered suspension at 3,000× g for 10 min at 4 .
Centrifugation will form three layers. Completely aspirate layers 1 & 2 (Figure 1).
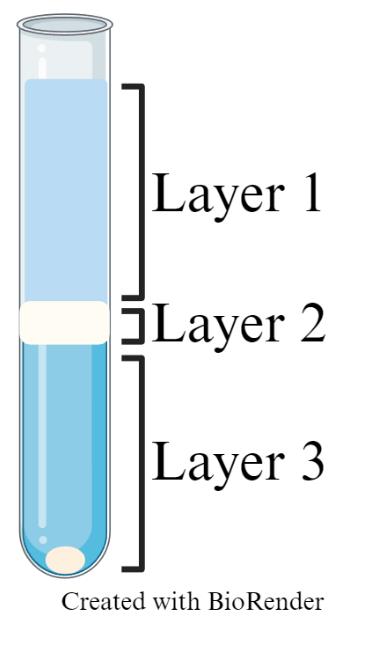
Figure 1. Representative image of debris removal step post-centrifugation. Layer 1: buffer; layer 2: debris; layer 3: remaining buffer with cell pellet.Bring volume up to 5 mL with D-PBS, cap the tube, and gently invert three times to mix.
Centrifuge the cell suspension at 1,000× g for 10 min at 4 with full acceleration and brake.
Completely aspirate the supernatant and proceed to section C.
Cell staining
Resuspend the cell pellet carefully in 1 mL of cell staining buffer.
Using 100 μL of cell staining buffer, pre-wet the filter cap of a 5 mL round-bottom FACS flow tube and filter the cell suspension through the cap, collecting the filtered suspension into the appropriately labeled flow tubes.
Note: Snap the filter cap on and ensure the ability to move the cap up and down to avoid a seal that prevents the flow of the solution. Slowly add the suspension to the cap and avoid overfilling the filter. The initial volume may need assistance passing through the filter by tapping the tube on a hard surface.
Centrifuge the cell suspension at 300× g for 10 min at 4 .
While the cells are spinning, prepare the Fc blocking solution at a 1:200 dilution (i.e., 1 μL of TruStain FcX + 199 μL of cell staining buffer). You will need 50 μL of Fc blocking solution per sample.
Once centrifugation is finished, decant the supernatant (leaves ~30 μL of solution).
Note: Decant by quickly inverting the tube over an appropriate waste container without shaking the tube. Allow most of the liquid to drain and blot the remainder on the rim using a disposable absorbent material placed flat on a benchtop. Quickly orient the tube without shaking or disturbing the pellet.
Resuspend the cells in 50 μL of Fc blocking solution and incubate at room temperature for 5 min protected from light.
Label tubes for each sample and controls [i.e., single-antibody, fluorescence minus one (FMO), and isotype controls].
Resuspend control samples in a volume that results in 100 μL for each tube.
Note: This step is for the distribution of the control samples into a number of tubes that correlates to the total number of antibodies used plus one unstained sample (i.e., 1,100 μL for 10 antibodies that leaves 100 μL remaining for the unstained control).
Transfer 100 μL of each control sample into its corresponding tube.
For the remaining tubes, add 20 µL of cell staining buffer to bring volume to ~100 μL for staining.
Add each antibody to their corresponding tube at the appropriate concentrations for a 100 μL volume.
Incubate the antibody cell mixture at 4 for 30 min, protected from light.
Wash the cells using 1 mL of cell staining buffer and spin at 300× g for 10 min at 4 ℃.
Aspirate or decant the supernatant completely and resuspend in 250 μL of cell staining buffer for flow analysis.
Data analysis
Data collection, data analysis, gating strategy, and identification of microglial phenotypes
Data collection
Make the appropriate adjustments (i.e., laser power, forward/side scatter, etc.) during data collection to position the data points of the unstained controls in the lower left quadrant. Each single-stained control should display a distinct positive population within the desired channel (fluorophore overlap should be corrected before collecting experimental data).
Note: It is recommended to collect data using a cell analyzer (i.e., Cytek Aurora 5 laser spectral flow cytometer) with autofluorescence exclusion capabilities due to the high autofluorescence found in murine brain tissue that can negatively affect downstream analysis.
Determining the cell population
On a density plot, select forward scatter vs. side scatter (FSC vs. SSC) on the X and Y axes, respectively. FSC indicates cell size, while SSC indicates cell granularity. The cell population is determined by excluding the leftmost population (debris) (Figure 2A).
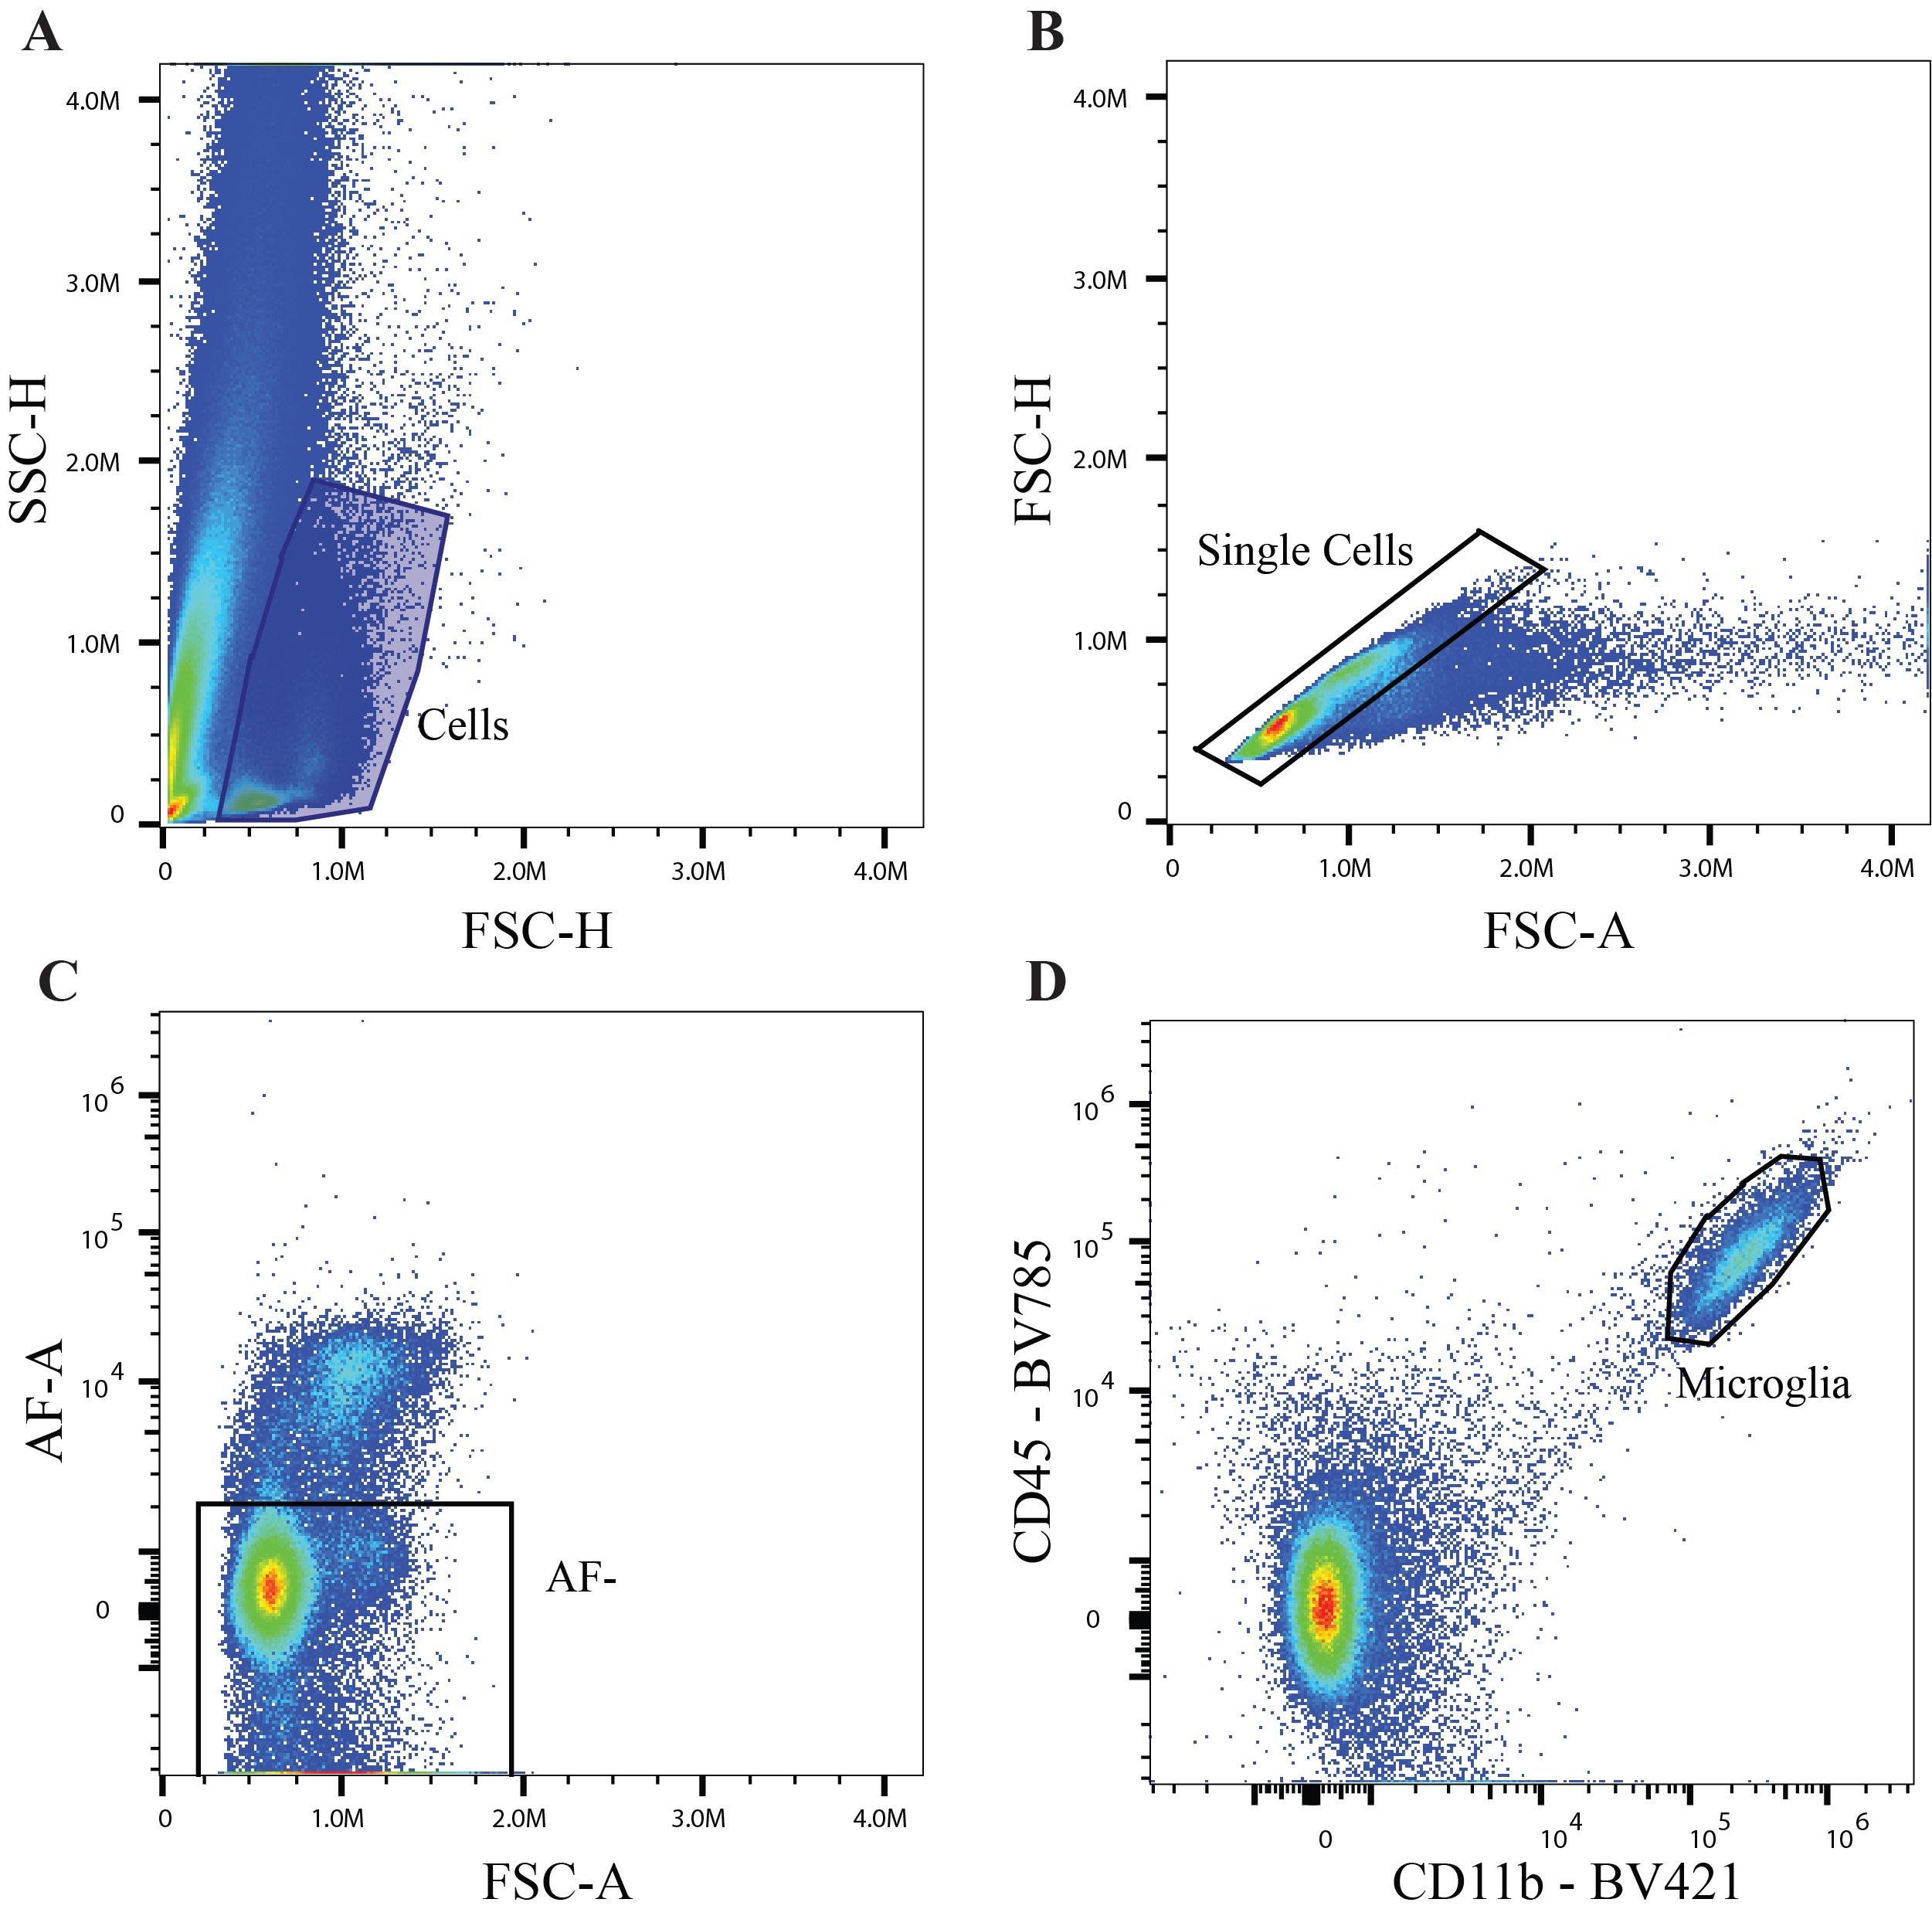
Figure 2. Gating strategy for distinguishing microglia. A. Recommended parameters to establish live cell population. B. Single-cell selection to exclude doublets. C. Selection of an autofluorescent negative population using the Cytek Aurora 5 laser spectral flow cytometer. D. Identification of microglial population (CD11b+CD45Mid).Single-cell selection
To exclude doublets, select forward scatter area vs. forward scatter height (FSC-A vs. FSC-H) on the X and Y axes, respectively. Gate the densest population located along the diagonal (Figure 2B).
Autofluorescence correction
To correct for autofluorescence, select FSC-A vs. autofluorescence area (FSC-A vs. AF-A) on the X and Y axes, respectively. Place a gate on the negative population, extending the gate to negative values located off the displayed plot (Figure 2C). This will ensure that all cell populations are included in the data set.
Note: Cells positive for autofluorescence should be excluded due to the possibility of a false positive signal.
Identifying microglial population
To select the microglia population for downstream phenotyping, select the canonical microglial marker CD11b vs. the canonical hematopoietic marker CD45 on the X and Y axes, respectively. Microglia populations will display a CD11b+CD45Mid expression as described in previous reports [1] (Figure 2D). Use this population to identify microglia phenotypes.
Microglial phenotypes
The antibodies from this panel can be used to identify four distinct microglial phenotypes, as shown in Figure 3 (Note: More variations can be used to visualize these phenotypes). Homeostatic microglia are defined as P2RY12+CLEC7A- (Figure 3A). Disease-associated microglia (DAM) are determined by CD11chighCLEC7Ahigh and/or CD282+CLEC7Ahigh (Figure 3B). Interferon-response microglia (IRM) (Figure 3C) and lipid-droplet accumulating microglia (LDAM) (Figure 3D) are measured by the mean fluorescent intensity (MFI) of CD317+ and CD63+, respectively. When using the MFI, comparisons should be made between sample groups to determine differences in the IRM and LDAM populations for biological relevance.
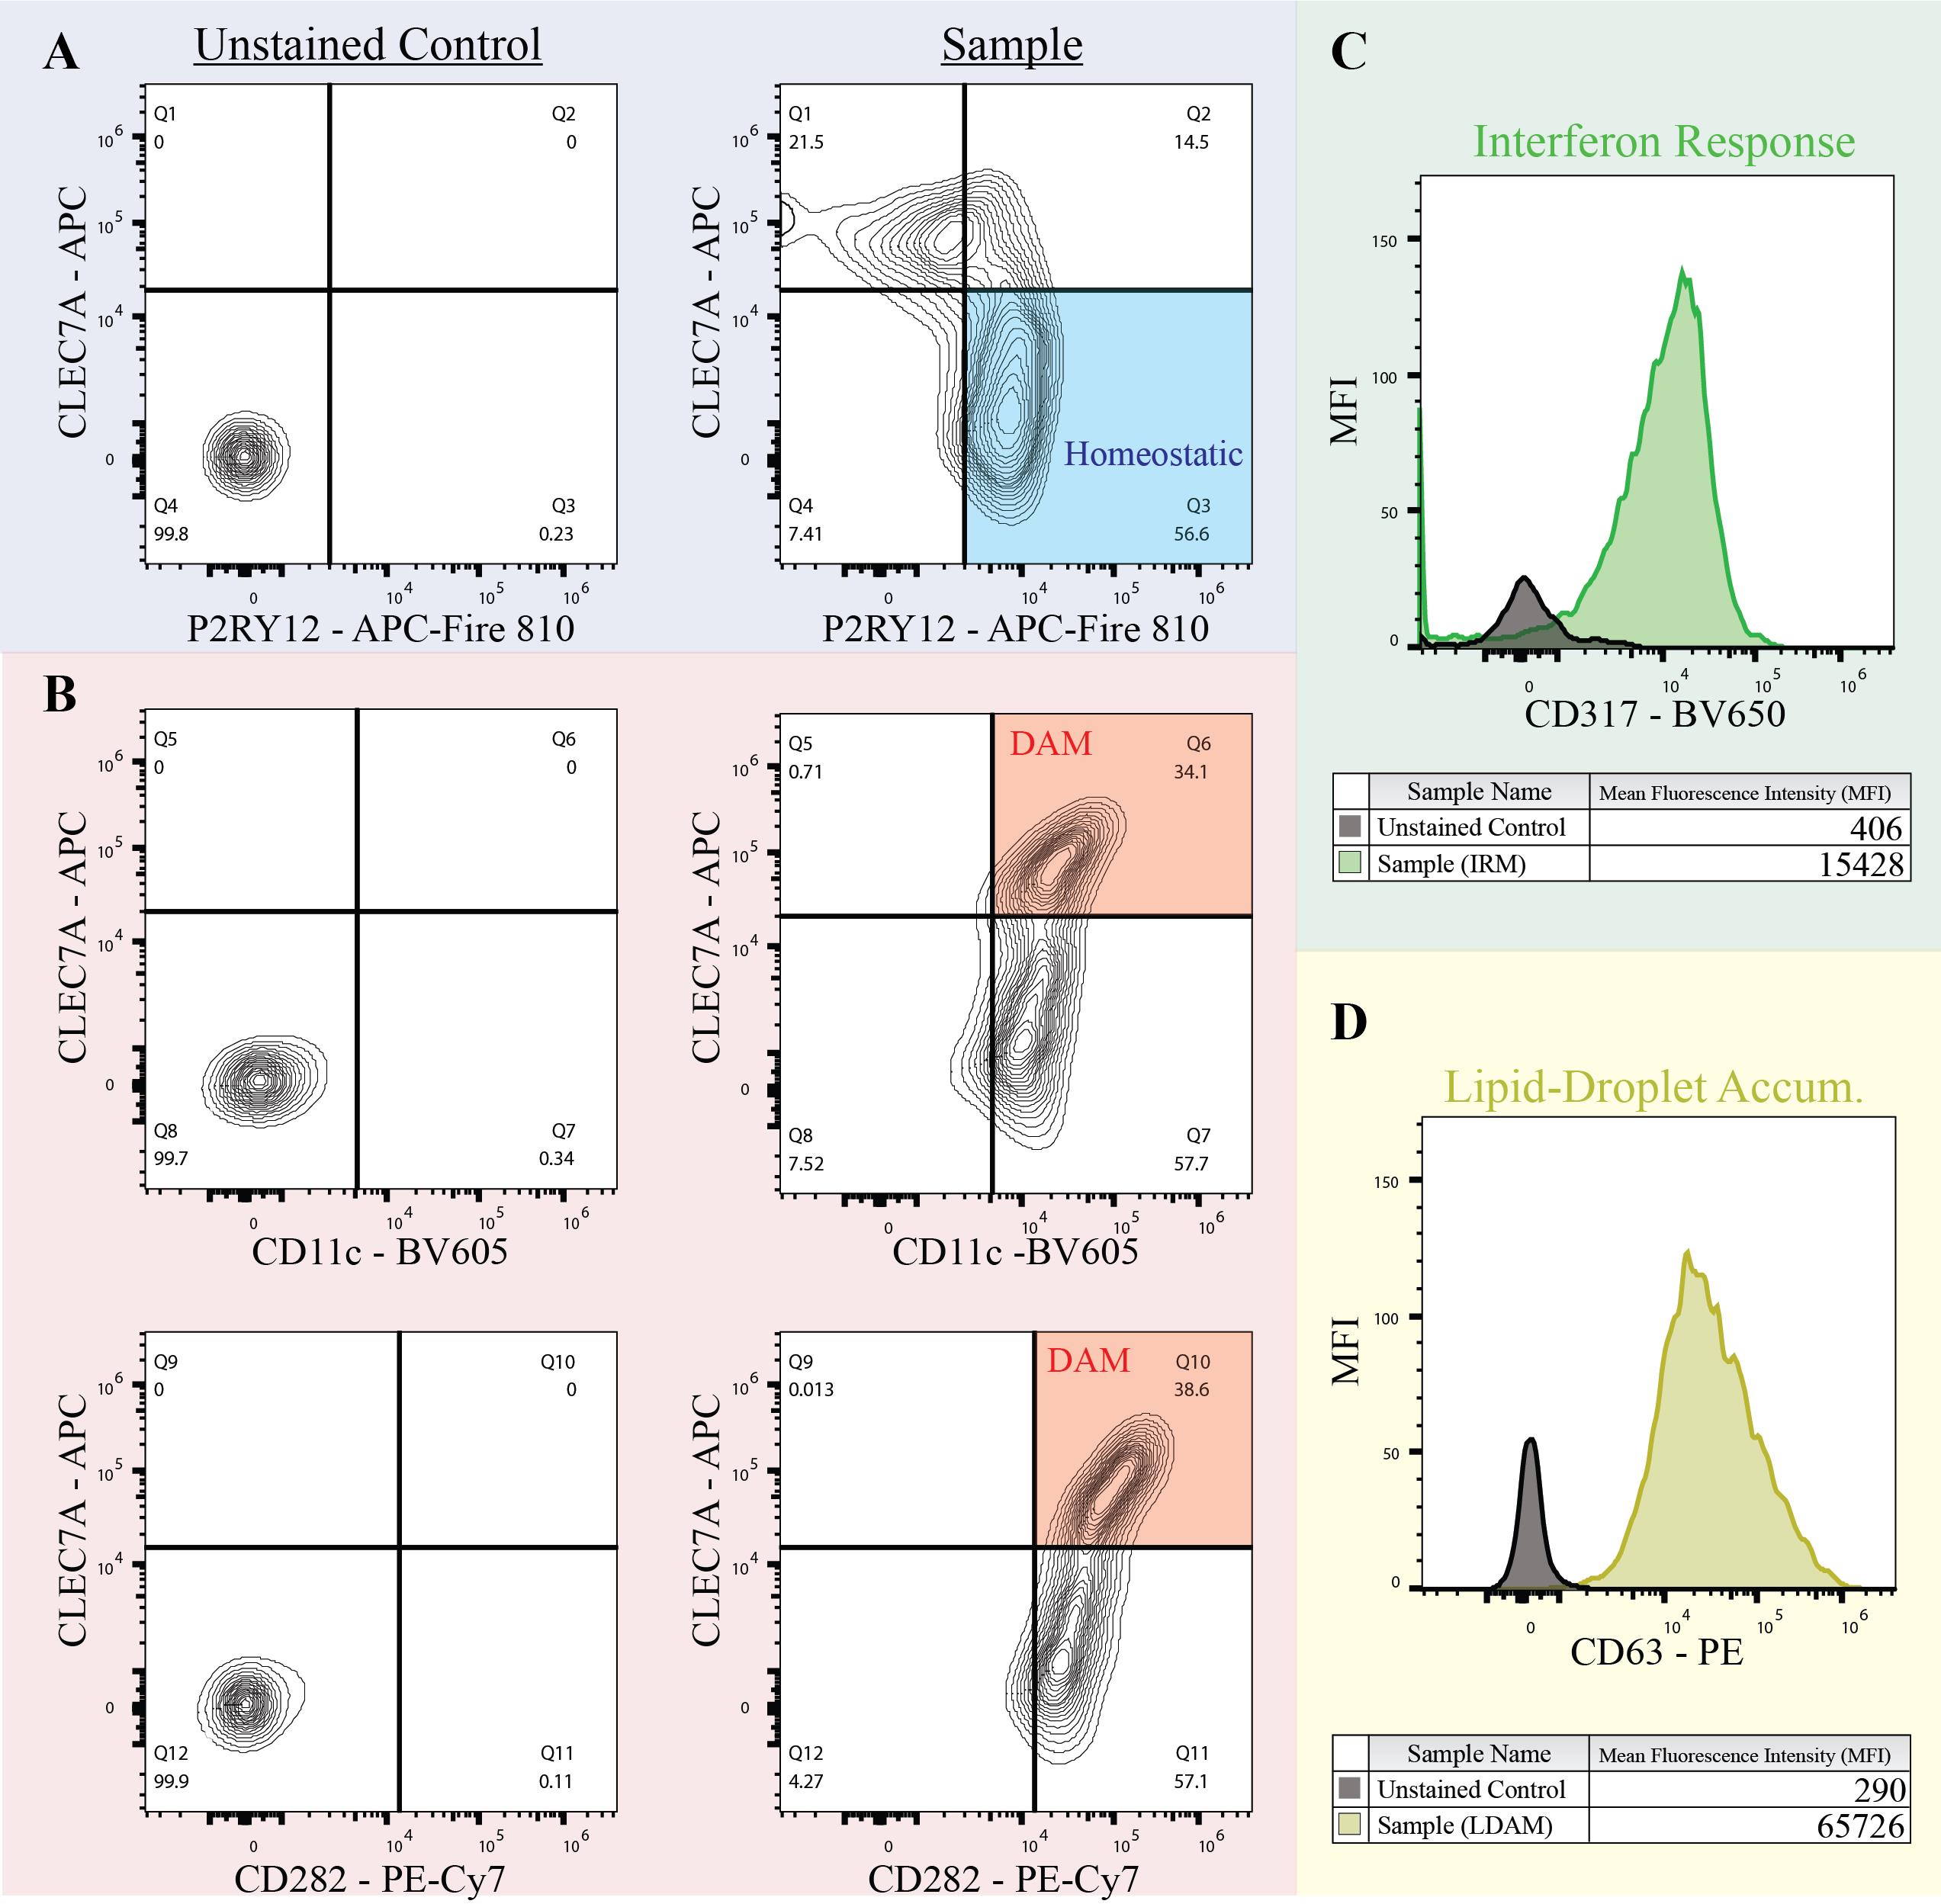
Figure 3. Distinguishing microglial phenotypes. A. Homeostatic microglia are defined as P2RY12+CLEC7a-. B. Disease-associated microglia determined by CD11chighCLEC7Ahigh and CD282+CLEC7Ahigh. C. Interferon-response microglia determined by CD317 histogram. D. Lipid-droplet accumulating microglia determined by CD63 histogram.Statistical analysis
GraphPad Prism v9.5 was used to conduct statistical analyses using a mixed-effects model, matching by age and collection date, and Sidak’s multiple comparisons test. Outliers due to technical variation were removed using the ROUT outlier test (Q+1%). The number of biological replicates to reach statistical power for this type of experiment depends on the expected proportion of each phenotypic state for the given murine model and brain region.
Validation of protocol
This protocol or parts of it have been used and validated in the following research article(s):
Ocañas et al. (2023). Microglial senescence contributes to female-biased neuroinflammation in the aging mouse hippocampus: implications for Alzheimer’s disease. Journal of Neuroinflammation. (Figure 6, panels A-I).
General notes and troubleshooting
General notes
Debris removal—step B4: Proper overlay with D-PBS is crucial for clean data output, which is dependent on the separation of the layers. Mixing of the layers will result in excessive debris that can pollute the quality of the sample. Ensure careful adherence to the note listed in this step.
Fluorescent dyes, such as Methoxy-X04 [11] and BODIPY [10,11], may be used to examine in vivo microglial activity of DAM and LDAM phenotypes, respectively.
Appropriate controls, including single antibody, FMO, and isotype controls, should be included to ensure the observed signals are specific to the markers of interest.
This protocol has only been tested on murine hippocampal and cortical regions. However, other brain regions and/or disease models may be suitable with minimal optimization.
Cardiac perfusion or in vivo labeling of circulating immune cells is recommended to reduce 1) the amount of infiltrating peripheral macrophages that may confound distinct microglial populations, 2) autofluorescence from peripheral blood, and 3) overall debris that would result in cleaner data output.
Murine brain tissue has significant autofluorescence, with increased signals in aged tissue. The Cytek Aurora 5 laser spectral flow cytometer was used in this protocol, which allows gated removal of autofluorescent signal, but this feature may not be available in other flow cytometers. If using a cell analyzer without this autofluorescent detection, consider adapting this protocol with Burns et al. 2021 [13,14].
Previous reports have indicated that a subset of microglia may exist in AF+ populations due to the accumulation of lipofuscin during phagocytosis of cellular debris, with increased incidence in aged brains [15,16]. However, this protocol does not address AF correction during the cell preparation steps that would be necessary to include this lipofuscin+ population in phenotypic differentiation. Therefore, all AF+ populations are excluded during analysis to avoid false positive results.
This protocol used control samples from the same tissue due to variability in fluorescence intensity. Compensation beads may be used instead to provide more consistent and reusable control samples; however, this will require optimization to select the appropriate fluorescence intensity according to the tissue sample of interest.
The original intent of this protocol is to distinguish changes in microglial populations during aging, as described in the referenced primary research article [17]. However, the same cell preparation and staining steps can be adapted and optimized for cell sorting of these microglial phenotypes for additional downstream experiments.
Acknowledgments
This work was supported by grants from the National Institute of Health (NIH): DP5OD033443, R01AG059430, T32AG052363, 1S10OD028479-01. This work was also supported in part by awards I01BX003906, IK6BX006033, and ISIBX004797 from the United States (U.S.) Department of Veterans Affairs, Biomedical Laboratory Research and Development Service. This work was supported by a grant from the Alzheimer's Association (SAGA23-1072406).
Competing interests
The authors declare no competing interests.
Ethical considerations
All animal procedures were approved by the Institutional Animal Care and Use Committee at the Oklahoma Medical Research Foundation (OMRF).
References
- Jurga, A. M., Paleczna, M. and Kuter, K. Z. (2020). Overview of General and Discriminating Markers of Differential Microglia Phenotypes. Front Cell Neurosci. 14: e00198. https://doi.org/10.3389/fncel.2020.00198
- Keren-Shaul, H., Spinrad, A., Weiner, A., Matcovitch-Natan, O., Dvir-Szternfeld, R., Ulland, T. K., David, E., Baruch, K., Lara-Astaiso, D. and Toth, B. (2017). A unique microglia type associated with restricting development of Alzheimer’s disease. Cell 169(7): 1276–1290. e1217. https://doi.org/10.1016/j.cell.2017.05.018
- Paolicelli, R. C., Sierra, A., Stevens, B., Tremblay, M.-E., Aguzzi, A., Ajami, B., Amit, I., Audinat, E., Bechmann, I. and Bennett, M. (2022). Microglia states and nomenclature: A field at its crossroads. Neuron. 110(21): 3458-3483. https://doi.org/10.1016/j.neuron.2022.10.020
- Ocañas, S. R., Pham, K. D., Cox, J. E., Keck, A. W., Ko, S., Ampadu, F. A., Porter, H. L., Ansere, V. A., Kulpa, A. and Kellogg, C. M. (2023). Microglial senescence contributes to female-biased neuroinflammation in the aging mouse hippocampus: implications for Alzheimer’s disease. J Neuroinflammation. 20(1): 188. https://doi.org/10.1186/s12974-023-02870-2
- Krasemann, S., Madore, C., Cialic, R., Baufeld, C., Calcagno, N., El Fatimy, R., Beckers, L., O’loughlin, E., Xu, Y. and Fanek, Z. (2017). The TREM2-APOE pathway drives the transcriptional phenotype of dysfunctional microglia in neurodegenerative diseases. Immunity. 47(3): 566–581. e569. https://doi.org/10.1016/j.immuni.2017.08.008
- Sala Frigerio, C., Wolfs, L., Fattorelli, N., Thrupp, N., Voytyuk, I., Schmidt, I., Mancuso, R., Chen, W. T., Woodbury, M. E., Srivastava, G., et al. (2019). The Major Risk Factors for Alzheimer's Disease: Age, Sex, and Genes Modulate the Microglia Response to Aβ Plaques. Cell Rep. 27(4): 1293–1306.e1296. https://doi.org/10.1016/j.celrep.2019.03.099.
- Ellwanger, D. C., Wang, S., Brioschi, S., Shao, Z., Green, L., Case, R., Yoo, D., Weishuhn, D., Rathanaswami, P. and Bradley, J. (2021). Prior activation state shapes the microglia response to antihuman TREM2 in a mouse model of Alzheimer’s disease. Proc Natl Acad Sci USA. 118(3): e2017742118. https://doi.org/10.1073/pnas.2017742118
- Magusali, N., Graham, A. C., Piers, T. M., Panichnantakul, P., Yaman, U., Shoai, M., Reynolds, R. H., Botia, J. A., Brookes, K. J. and Guetta-Baranes, T. (2021). A genetic link between risk for Alzheimer's disease and severe COVID-19 outcomes via the OAS1 gene. Brain 144(12): 3727–3741. https://doi.org/10.1093/brain/awab337
- Grubman, A., Choo, X. Y., Chew, G., Ouyang, J. F., Sun, G., Croft, N. P., Rossello, F. J., Simmons, R., Buckberry, S. and Landin, D. V. (2021). Transcriptional signature in microglia associated with Aβ plaque phagocytosis. Nat Commun. 12(1): 3015. https://doi.org/10.1038/s41467-021-23111-1
- Marschallinger, J., Iram, T., Zardeneta, M., Lee, S. E., Lehallier, B., Haney, M. S., Pluvinage, J. V., Mathur, V., Hahn, O., Morgens, D. W., et al. (2020). Lipid-droplet-accumulating microglia represent a dysfunctional and proinflammatory state in the aging brain. Nat Neurosci. 23(2): 194–208. https://doi.org/10.1038/s41593-019-0566-1.
- Klunk, W. E., Bacskai, B. J., Mathis, C. A., Kajdasz, S. T., McLellan, M. E., Frosch, M. P., Debnath, M. L., Holt, D. P., Wang, Y. and Hyman, B. T. (2002). Imaging Aβ plaques in living transgenic mice with multiphoton microscopy and methoxy-X04, a systemically administered Congo red derivative. J. Neuropathol. Exp. Neurol. 61(9): 797–805. https://doi.org/10.1093/jnen/61.9.797
- Ocañas, S. R., Pham, K. D., Blankenship, H. E., Machalinski, A. H., Chucair-Elliott, A. J. and Freeman, W. M. (2022). Minimizing the ex vivo confounds of cell-isolation techniques on transcriptomic and translatomic profiles of purified microglia. Eneuro 9(2). https://doi.org/10.1523/eneuro.0348-21.2022
- Burns, J. C., Ransohoff, R. M. and Mingueneau, M. (2021). Isolation of Microglia and Analysis of Protein Expression by Flow Cytometry: Avoiding the Pitfall of Microglia Background Autofluorescence. Bio Protoc 11(14): e4091. https://doi.org/10.21769/BioProtoc.4091.
- Burns, J. C., Cotleur, B., Walther, D. M., Bajrami, B., Rubino, S. J., Wei, R., Franchimont, N., Cotman, S. L., Ransohoff, R. M. and Mingueneau, M. (2020). Differential accumulation of storage bodies with aging defines discrete subsets of microglia in the healthy brain. Elife 9: e57495. https://doi.org/10.7554/elife.57495
- Stillman, J. M., Mendes Lopes, F., Lin, J. P., Hu, K., Reich, D. S. and Schafer, D. P. (2023). Lipofuscin-like autofluorescence within microglia and its impact on studying microglial engulfment. Nat Commun. 14(1): 7060. https://doi.org/10.1038/s41467-023-42809-y
- Ritzel, R. M., Li, Y., Jiao, Y., Lei, Z., Doran, S. J., He, J., Shahror, R. A., Henry, R. J., Khan, R. and Tan, C. (2023). Brain injury accelerates the onset of a reversible age-related microglial phenotype associated with inflammatory neurodegeneration. Sci Adv. 9(10): eadd1101. https://doi.org/10.1126/sciadv.add1101
- Ocañas, S. R., Pham, K. D., Cox, J. E., Keck, A. W., Ko, S., Ampadu, F. A., Porter, H. L., Ansere, V. A., Kulpa, A. and Kellogg, C. M. (2023). Microglial senescence contributes to female-biased neuroinflammation in the aging mouse hippocampus: implications for Alzheimer’s disease. bioRxiv: 2023.2003. 2007.531562. https://doi.org/10.1101/2023.03.07.531562
Article Information
Copyright
© 2024 The Author(s); This is an open access article under the CC BY-NC license (https://creativecommons.org/licenses/by-nc/4.0/).
How to cite
Cox, J. E. J., Pham, K. D., Keck, A. W., Wright, Z., Thomas, M. A., Freeman, W. M. and Ocañas, S. R. (2024). Flow Cytometry Analysis of Microglial Phenotypes in the Murine Brain During Aging and Disease. Bio-protocol 14(12): e5018. DOI: 10.21769/BioProtoc.5018.
Category
Neuroscience > Cellular mechanisms > Microglia
Biochemistry > Protein > Labeling
Cell Biology > Cell-based analysis > Flow cytometry
Do you have any questions about this protocol?
Post your question to gather feedback from the community. We will also invite the authors of this article to respond.