- Protocols

- Articles and Issues
- For Authors
- About
- Become a Reviewer

Measuring Sleep and Activity Patterns in Adult Zebrafish
Published: Vol 14, Iss 12, Jun 20, 2024 DOI: 10.21769/BioProtoc.5014 Views: 2028
Reviewed by: Alberto RissoneErica BrescianiSalim Gasmi
Advertisement


Protocol Collections
Comprehensive collections of detailed, peer-reviewed protocols focusing on specific topics


Related protocols
Abstract
Sleep is an essential behavior that is still poorly understood. Sleep abnormalities accompany a variety of psychiatric and neurological disorders, and sleep can serve as a modifiable behavior in the treatment of these disorders. Zebrafish (Danio rerio) has proven to be a powerful model organism to study sleep and the interplay between sleep and these disorders due to the high conservation of the neuro-modulatory mechanisms that control sleep and wake states between zebrafish and humans. The zebrafish is a diurnal vertebrate with a relatively simple nervous system compared to mammalian models, exhibiting conservation of sleep ontogeny across different life stages. Zebrafish larvae are an established high-throughput model to assess sleep phenotypes and the biological underpinnings of sleep disturbances. To date, sleep measurement in juvenile and adult zebrafish has not been performed in a standardized and reproducible manner because of the relatively low-throughput nature in relation to their larval counterparts. This has left a gap in understanding sleep across later stages of life that are relevant to many psychiatric and neurodegenerative disorders. Several research groups have used homemade systems to address this gap. Here, we report employing commercially available equipment to track activity and sleep/wake patterns in juvenile and adult zebrafish. The equipment allows researchers to perform automated behavior assays in an isolated environment with light/dark and temperature control for multiple days. We first explain the experimental procedure to track the sleep and activity of adult zebrafish and then validate the protocol by measuring the effects of melatonin and DMSO administration.
Key features
• Allows an isolated and controllable environment to carry out activity and sleep assays in juvenile and adult zebrafish.
• Measures activity of zebrafish in life stages later than early development, which requires feeding animals during the assay.
• Requires use of a commercially available equipment system and six tanks.
• The activity of zebrafish can be tracked for five days including an acclimation step.
Keywords: Adult zebrafishBackground
Sleep is a conserved behavior despite introducing some disadvantages to the organism, such as limiting responsiveness to the environment and preventing food foraging, which are critical activities for animals [1]. We spend nearly one-third of our lifetime sleeping. Although negative consequences of chronic sleep deprivation have been well-documented [1], the function of sleep is not fully known [2]. Major topics in sleep research include the investigation of why we sleep, what biological processes occur during sleep, and how sleep is regulated. Model organisms including zebrafish have been instrumental in addressing these fundamental questions in sleep research. Zebrafish meet all the behavioral criteria for defining sleep [3]. Because electrophysiological recordings of brain activity are not accessible in zebrafish, sleep is defined based on activity; one minute of inactivity in larvae [3,4] and six seconds of inactivity in adults [5] are defined as sleep. Sleep depth and arousability are possible to measure in larvae as well [6,7]. We and others have successfully identified sleep phenotypes in larval zebrafish when drug compounds were administered to their environment [8,9] and when particular genes were targeted via CRISPR/Cas9 mutation [6,10–12]. Nevertheless, there is a need to measure activity patterns and sleep in adult stages to seek answers to the following questions [13]:
1) Do sleep disturbances persist in juvenile mutant fish and adult mutant fish?
2) Do the genes of interest or the administered drug have a developmental (only at larval stage) role or a regulatory role (also at adult stages) in sleep?
For example, overexpression of the gene of interest via heat shock induction in a knockout model can be tested to see if sleep phenotypes at different stages of life are rescued. If the phenotype is rescued in larvae but not in adult fish, it indicates that the mutation irreversibly affects developmental circuits controlling sleep. Heat shock induction to mediate conditional gene expression has been applicable in juvenile [14] and adult zebrafish [15]. Sleep/wake patterns in adult zebrafish have been reported in previous studies that employed homemade solutions [5,7,16]. The methodology we propose here includes the use of a commercially available system, which ensures standardized and reproducible measurements. Sleep and activity phenotyping in larval zebrafish is high throughput; it is possible to include 96 animals in one assay [4]. Such assays in older age groups require the use of much larger tanks to allow normal swimming and exploration; therefore, one can phenotype behaviors of only 6–8 animals at once. We employed this automated video tracking in adult zebrafish (5 months old) and validated our protocol by administering melatonin, a known sleep-promoting compound. We demonstrated a sharp decrease in activity and wakefulness in adult zebrafish compared to the DMSO controls. Further studies are needed to carry out more detailed analyses of sleep parameters such as sleep bout length, sleep latency, and sleep bout numbers in age groups older than larval stages.
Materials and reagents
Biological materials
Adult wild type zebrafish (AB line). Adult zebrafish are housed under a 13:11 h light/dark cycle at the zebrafish core facility of the Children Hospital of Philadelphia.
Note: If possible, fish should be of equal size and pigment. Although the measure is meant to detect the center of the body, discrepancies can be found when comparing fish of drastically different sizes/pigments.
Reagents
Water from tank system (Aquaneering, San Diego, USA)
Gemma micro zebrafish food 150ZF (Skretting, Gemma micro-150)
Tap water to warm up and circulate around the tanks
Laboratory supplies
Six zebrafish breeding tanks, 1 L capacity [Aquaneering, ZHC100T (tank) and ZHC100L (lid)]
Equipment
Zebracube and regulator (ViewPoint Life Sciences Inc)
Zebracube is the chamber that houses juvenile or adult zebrafish during the experiment. It is connected to a computer and software that enable automated video tracking under cycling lights. A camera inside the Zebracube captures data based on the settings defined in the software by the researcher. The regulator facilitates circulation of warm water (28.5 °C) in and out of the water bath where the tanks are placed.
Temperature control unit (Julabo GmbH, model: 200F)
The temperature control unit heats tap water to 28.5 °C in order to keep zebrafish at the optimal growth temperature during the experiment.
Software and datasets
ZebraCube v5.18.0.0 (Viewpoint Life Sciences, Inc., access date, 09/26/2021)
Microsoft Excel (Excel 2016, access date, 02/16/2024)
MATLAB v2021b (Mathworks, https://mathworks.com, access date, 02/16/2024)
GraphPad Prism V10 (access date, 02/16/2024)
Procedure
We monitored activity patterns of 16 (5-month-old) adult zebrafish across 72 continuous hours using the commercially available automated system Zebracube to determine the optimal acclimation period for circadian cycle stabilization. We concluded that the acclimation period (first two days), as previously reported by Yokogawa et al. (2007) [5], shows robust sleep/wake patterns in line with 13:11 h light/dark cycle. We then captured activity data following the acclimation step, and we were able to replicate the activity patterns demonstrated previously [7] using the same parameters. Previous literature reported the use of homemade setups to record activity patterns of adult zebrafish [5,7,16]. We hereby introduce the use of a standardized protocol by employing a commercially available video tracking system to monitor juvenile and adult zebrafish sleep and activity patterns.
Animal handling
Start the regulator and temperature control unit to warm up the water surrounding the tanks (Figure 1). Set the water temperature to 28.5 °C.
Measure the temperature of water inside the water bath to ensure it is 28.5 °C. One may need to set the temperature on the control unit to a higher temperature due to the long tubing between equipment.
Add 500 mL of system water to each tank. Transfer one adult fish per tank. Use six tanks (Figure 2). We recommend alternating locations by genotype and/or treatment to avoid potential detection differences in the camera. When multiple replicate rounds are run, the group order should be alternated.
Note: Eight tanks will fit in this setup, but we found more reliable readings with six. We used the outer tank and the lid of a breeding tank. Lids were open during data capture to avoid condensation. The tanks are portable. We placed them in the water bath and then defined the virtual areas to collect data. Warm water at 28.5 °C circulates around the tanks.
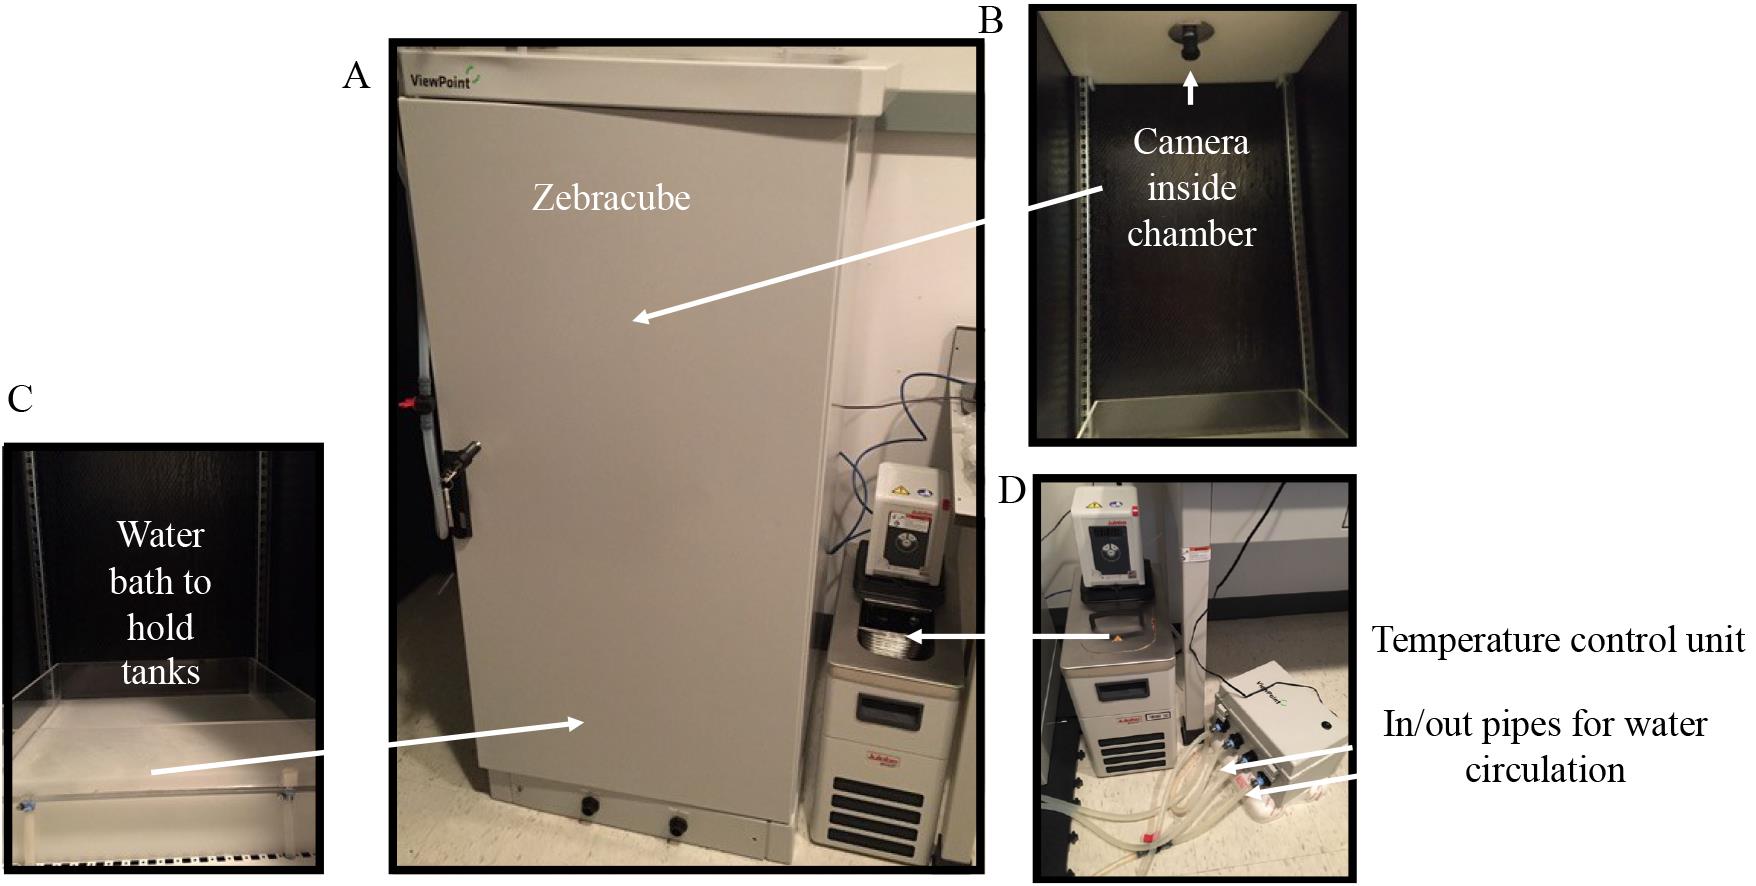
Figure 1. Video monitoring system to measure locomotor activity patterns in juvenile and adult zebrafish. The experimental system is composed of the Zebracube system (ViewPoint Life Sciences, Inc.), a camera located at the top of the equipment to capture locomotor activity data of zebrafish, a water bath for circulating warm water during experiments, a regulator, and a temperature control unit. In and out pipes for water circulation are marked on the picture.
Adult zebrafish monitoring
Acclimation
Day 1 (acclimation): Draw rectangles by outlining the rectangle of the tanks so that the virtual area for data collection overlaps with the physical boundaries of the tanks that house adult fish (Figures 2 and 3). Apply distance calibration (Figure 3). Define light/dark cycle under the stimulus driving feature (Figure 4). Start the software using the following settings in tracking mode:
[background threshold: 40, inactive/small movement cutoff: 1.3 cm/s, small/large movement cutoff: 8 cm/s] on the main page (see General notes 1).
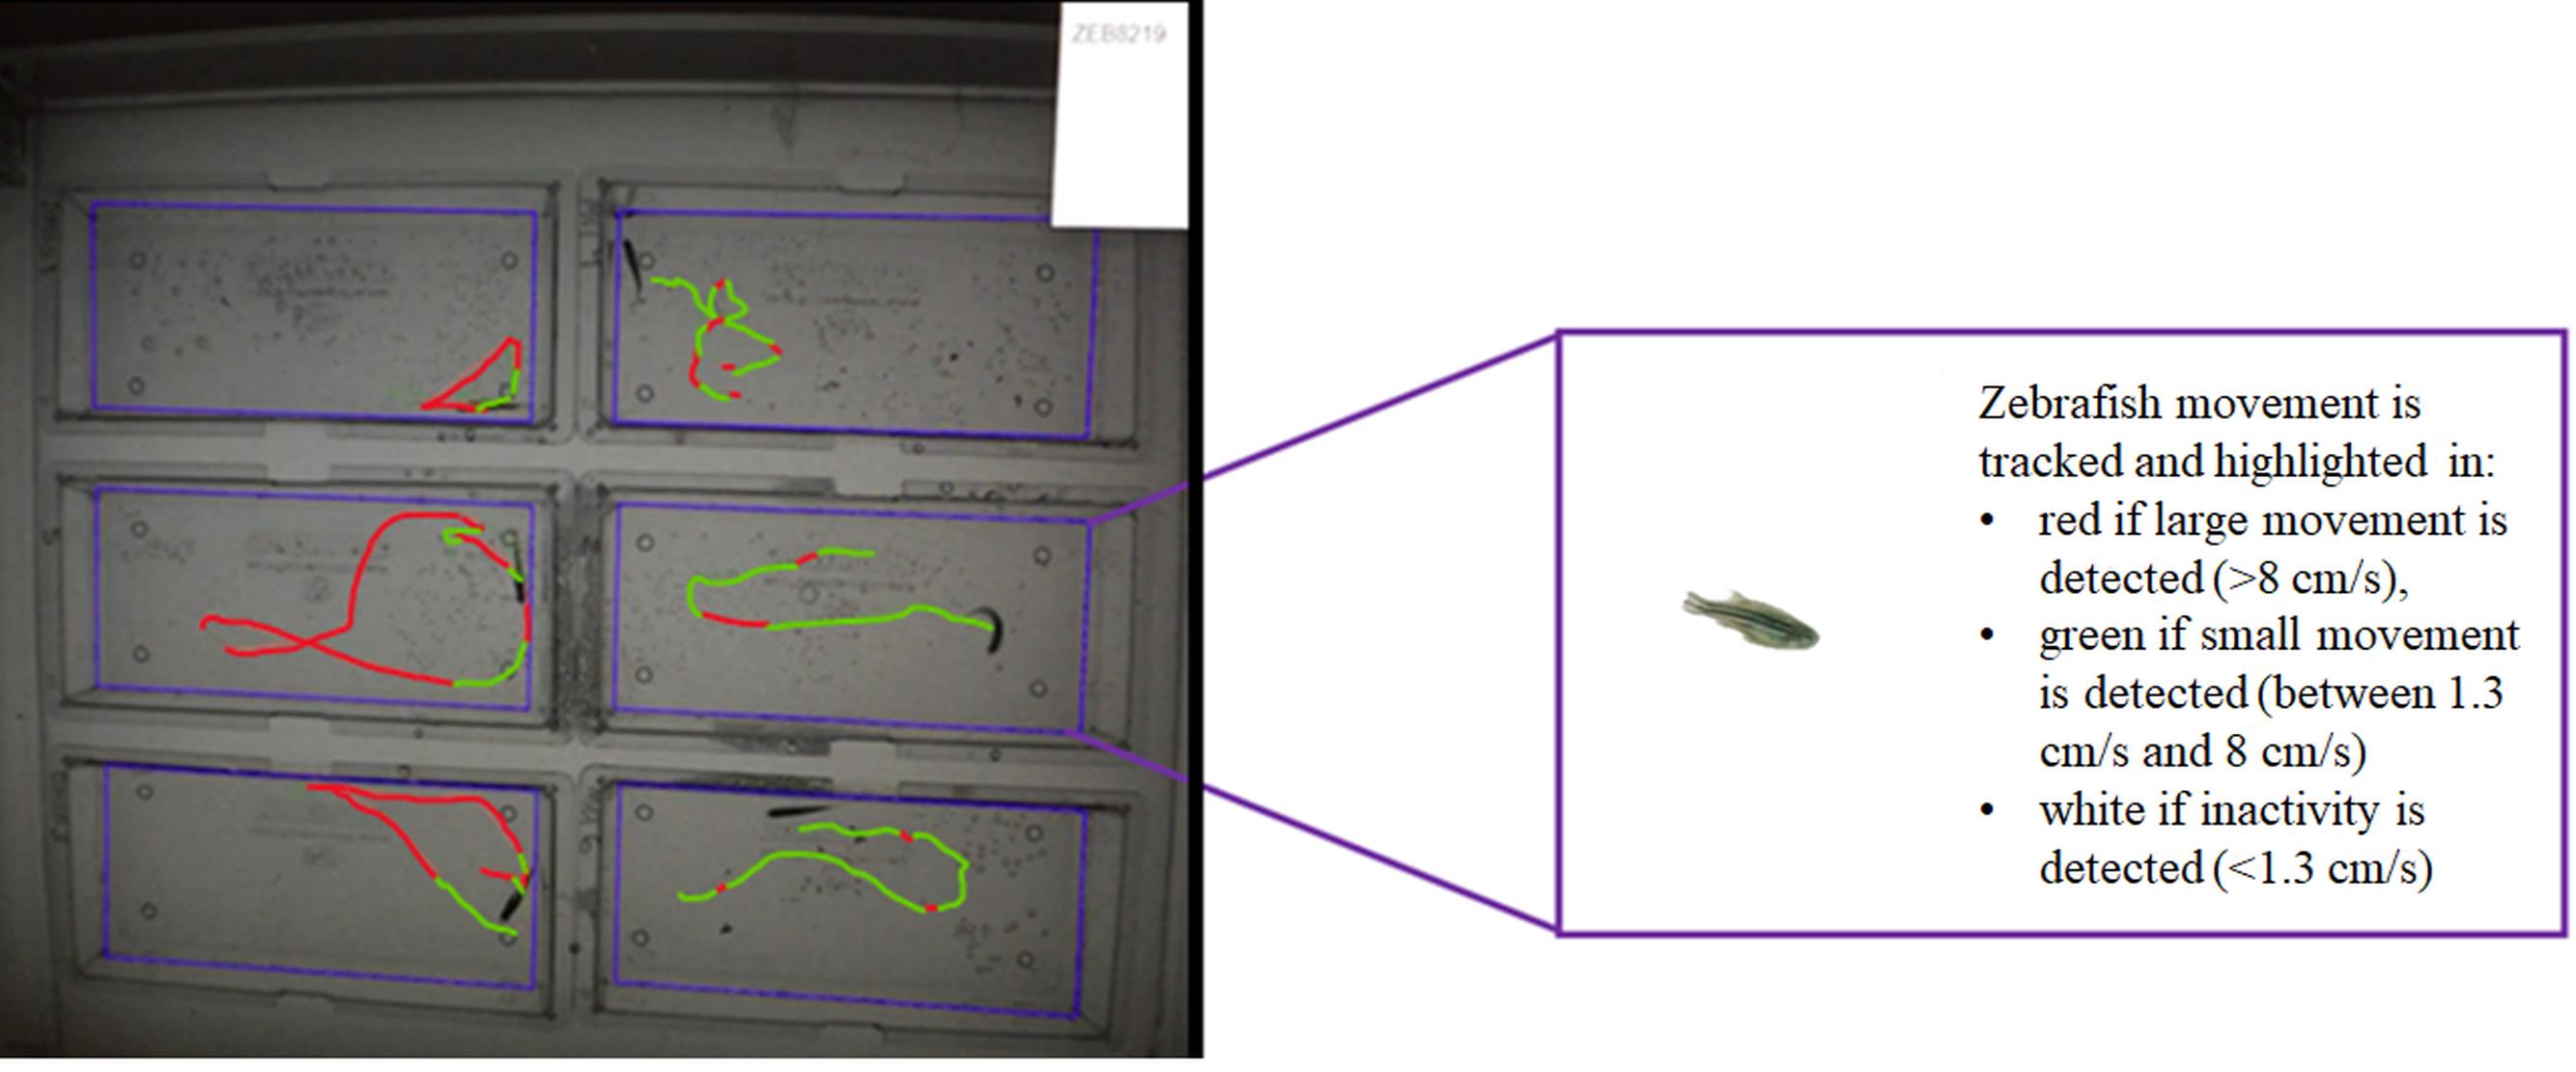
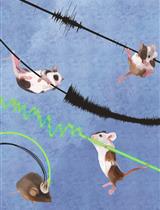
Figure 2. Adult zebrafish activity monitoring assay. The swimming behavior of six adult zebrafish is monitored in separate tanks. Large movement, small movement, and inactivity can be tracked.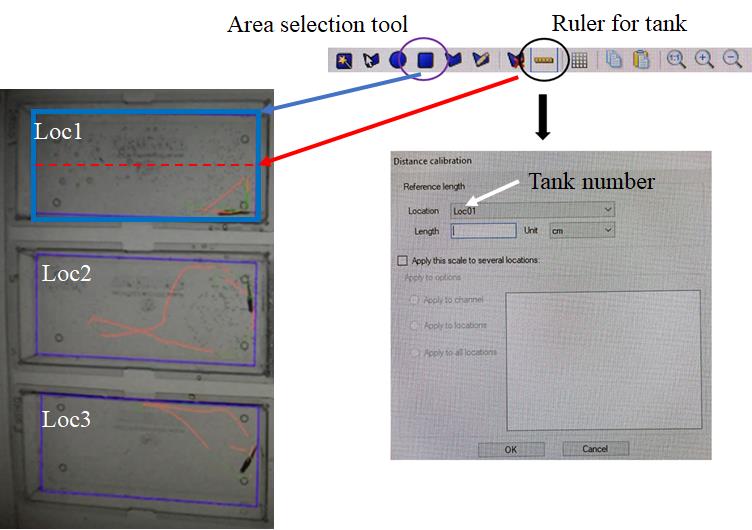
Figure 3. Tools in the software to specify the virtual areas (rectangular icon marked with purple circle) for collecting activity data of adult zebrafish and to apply distance calibration (ruler icon marked with black circle). Location name needs to be changed with each box to provide a unique identifier in the output file. Make sure to keep a note of which genotype/treatment is in each location. Each location is identified as Loc1–6 to differentiate each animal.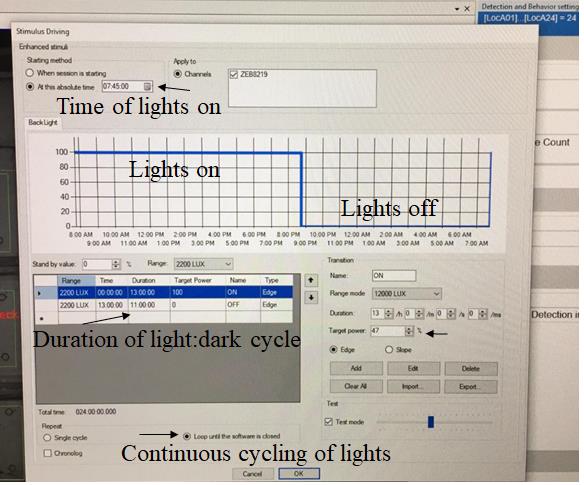
Figure 4. Stimulus driving tab to define light and dark cycle. We specified 13 h of light cycle starting at 07:45 am and 11 h of dark cycle starting at 8:45 pm to be consistent with the light settings at the core facility. Time of lights on and duration of light and dark cycle may be redefined in the software. Make sure to test the light source with a lux meter at the level of the tanks to ensure consistent lux readings across experiments. Alterations in brightness and hue can alter behavior. Select the option loop until the software is closed to keep the same light/dark cycle until the end of the experiment.Day 2 (acclimation): Refresh 20% of system water in the tanks at 9 am, feed the fish, and remove debris using a transfer pipette. Day 3 can also be included as acclimation, but we use it as a baseline reference day if drug is to be added.
The zebrafish were transferred from their original tanks to the tanks used in the experiment. Handling may cause stress in fish. We looked for stabilization of the sleep-wake behavior of the adult zebrafish at the acclimation step. Zebrafish are very responsive to the light. A stabilized sleep/wake cycle aligned to the timing of the light/dark cycle without large swings in activity throughout the day/night displays that acclimation has been achieved and the setup is working.
Data collection
Day 3 (assay): Refresh 20% of system water in the tanks, feed the fish, and remove debris using a transfer pipette at 9 am. Collect data to analyze sleep and activity patterns of adult zebrafish using the same settings from acclimation step during day and night. Data were collected every 6 s, as 6-s bouts of inactivity have previously been shown to be indicative of a sleep-like state by an increase in arousal threshold in adult fish [5].
Note: If adding drugs such as melatonin, care should be taken to segregate drug administration and feeding so that the effect of the drug is not masked by the innate drive to feed. Please see the validation section for more details. We avoided drug and food overlap by feeding the fish at 9 am and administering melatonin and DMSO at 11:45 am.
Day 4: Stop the assay after the 72-h period is completed or after the lights turn on.
Data analysis
Saving the data: After the assay is completed, data files will automatically populate in the selected output folder. The Excel file contains the data for analysis, but all files in the output folder should be saved to a drive, in case recreation of the Excel file is necessary.
Open the Excel file (Figure 5) and create a column called “sumdist” to the right of “lardist.” In Excel, use the sum function to add the “smldist” and “lardist” columns into the new “sumdist” column. This can be done in R or MATLAB, but for ease of use by others, we show how to do this in Excel.
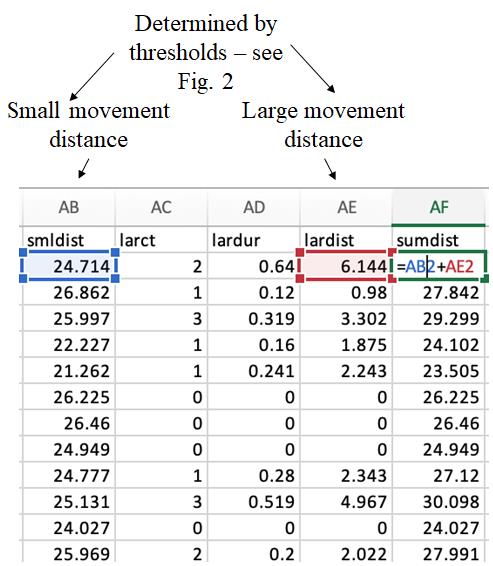
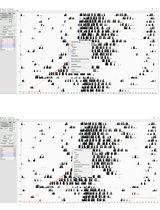
Figure 5. A representative output Excel spreadsheet showing locomotor activity record of adult zebrafish. To analyze the data, we created a new variable called “sumdist,” which is the sum of the activity in the “smldist” and “lardist” columns. Small movement distance (smldist) and large movement distance (lardist) are calculated by the software using the determined thresholds.Transform the data using MATLAB. We adapted the code provided by Lee et al. (https://bio-protocol.org/en/bpdetail?id=4313&type=0) [4] to transform the files for easier analysis. This transformation creates an output file ordered by clock time (zeitgeber time) with individual fish ordered at the top by box location. It collects the data from the “sumdist” column and places it in the corresponding “FISH” column. The value in the “CLOCK” column is zeitgeber time with 0 representing the lights-on and 13 representing the lights-off. Each row is a 6-s bin and represents the total distance traveled during that 6 s.
Note: This was adapted in the MATLAB script, as the script provided by Lee et al. uses a 14:10 light cycle. The Lee et al. code is also made for larvae, using 1 min bins instead of 6 s bins. We therefore changed the code to account for this. Use code: Viewpoint_to_Matlab_forAdults. – %comments are added where code was adapted from code provided by https://bio-protocol.org/en/bpdetail?id=4313&type=0
Analyzing the data. This can be done in a number of ways. To create the graphs displayed in Figure 6, we summed the data across hourly windows by summing the values every 600 rows in the Excel file beginning at CLOCK = 0 for each individual fish.
Note: It is important to start at CLOCK = 0 AFTER the acclimation period.
The hourly sums are then transferred to GraphPad Prism V10 for statistical analyses and plotting. We recommend including a 24-h period for acclimation. The acclimation data are not analyzed in the finalized dataset but provide a window for behavioral stabilization in the novel environment.
Depending on the experimental timeline, the hour following the acclimation period will be used for data analysis. For example: if a 48-h period is used for analysis, you will measure activity from ZT0 of the second day to the final bin before ZT0 or the 4th day (i.e., 23.99...). We recommend at least one full 24-h window for data analysis, but extra hours may be included if needed.
The data are loaded into a “grouped” table with sub-columns representing each fish per group. Hourly data are placed in each row of the table and data are plotted using the XY “points and connecting lines” graph format to create a plot as in Figure 6 with mean and SEM. We recommend plotting values for individual fish first to inspect data for outliers or spurious values. If a fish is a very different size from the others, the detection can be skewed. Individual boxes may also lose detection or fish may be extremely inactive skewing the results. Video review should be performed for suspicious results to justify removal.
To detect the prolonged response to melatonin, we plotted the hourly sums for the 9 h following drug administration (to lights-off) (Figure 6B). The immediate response to melatonin was calculated as the total distance traveled in the 1 h after drug administration (12–1 pm) (Figure 6C). We also compared this to the same time window on the previous baseline day to show the activity did not differ between groups prior to melatonin administration.
Validation of protocol
We tested the effects of melatonin on activity patterns of adult zebrafish to validate the protocol. We tracked distance traveled before and after melatonin administration to capture activity changes in light and dark cycles. Melatonin dissolved in DMSO (1.5 mL 50 µM) was administered to 500 mL final volume of water in which fish were housed during experiments. Therefore, the final concentration of melatonin was 150 µM. In control groups, 1.5 mL of DMSO was administered to 500 mL of tank water. The final concentration of DMSO was 0.3%. Melatonin and DMSO were added on day 4 at 11:45 am as endogenous melatonin levels are low at this time of day [17]. Data were captured until the next morning. Total distance traveled for the subsequent 9 h of the light cycle following drug administration was compared between experiment and control groups using RM-ANOVA (Figure 6B) [F(1,14) = 2.36, P = 0.15)]. Distance traveled after melatonin administration was compared between the experimental group and control group for the baseline day (12–1 pm) and the post-melatonin period (12–1 pm) by two-way repeated measures ANOVA with Bonferroni’s multiple comparisons correction applied [main effect of time X treatment; F(1,14) = 5.63, P = 0.03] [Bonferroni’s adjusted p-value; post-melatonin (P = 0.03)]. (Figure 6C). Exogenous melatonin administration at noon promoted inactivity peaking 1 h after administration as shown in larvae [8] with a modest effect persisting through the remainder of the light cycle (Figure 6A–B). Thus, we validated this methodology by demonstrating a decrease in activity and wakefulness in adult zebrafish compared to the control group.
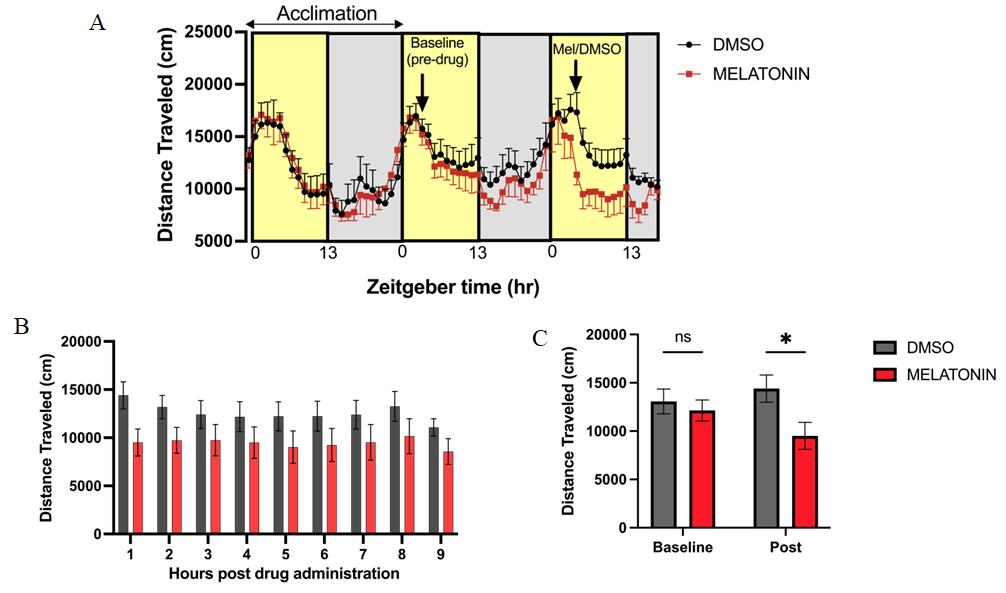
Figure 6. Exogenous melatonin decreases daytime wakefulness. A. Distance traveled (mean and SEM) captured across three continuous days. Melatonin (150 µM final concentration in 0.3% DMSO) or 0.3% DMSO (control) was administered at 11:45 am (right arrow). Activity is captured on a 13:11 h light/dark cycle and shown as zeitgeber time. B. Total distance traveled each hour of light cycle following drug administration. C. Total distance traveled in the hour following drug administration (12 pm–1 pm). Two-way RM-ANOVA with Bonferroni’s multiple comparisons test was performed in B–C. *p < 0.05 adjusted. Data are presented as mean and SEM. n = 8 fish/group from three biological replicates.
General notes and troubleshooting
General notes
Background thresholds might vary based on the body size of juvenile zebrafish and adult zebrafish. One needs to observe if the colored tracks are generated for each fish (i.e., the line should track with the center of the body).
Using larvae in sleep assays is higher throughput when compared to using juveniles and adults; however, there are some specific questions that require the use of older age groups as indicated under the background section. Therefore, performing these assays in a standard and replicable environment is critical.
We continued to follow the 13:11 h light/dark cycle, which was applied in the zebrafish core facility at the time. We preferred this schedule in our experiment to not introduce a sudden change in the circadian rhythm of the adult zebrafish; however, we recommend setting the light/dark cycle to the usual 14:10 h cycle if possible. Duration of light/dark cycle and the time to start the cycle are possible to redefine in the software (see Figure 4).
System water used in the beginning of the experiment setup was at room temperature. We first started the temperature control unit, warmed up the system water inside the tanks by taking advantage of the circulating water, and finally placed the fish inside each tank individually. Circulating water was at 28.5 °C. We made sure of this temperature by measuring the water inside the water bath. The water used to refresh the tank water was at room temperature. Since it is 20% of the tank water, it was quickly warmed by the circulating warm water.
Troubleshooting
Problem: Software does not track the fish.
Possible cause: The virtual area that overlaps with the physical boundaries of the tank was defined in the previous assay.
Solution: Define the virtual areas at the beginning of each assay.
Problem: The lines are not centered on the body of the fish or are delayed.
Solution: Redefine the threshold for each box individually to ensure each fish is being detected over the background.
Acknowledgments
We thank Adele Donahue for technical assistance. Data in this work were supported by funding from Fulbright Visiting Scholar Program–Postdoctoral Grant, grant number FY-2017-TR-PD-07 (FDB), and National Institutes of Health grant, The Program Project Grant (PPG) P01 HL160471-01A1 (AIP).
Competing interests
The authors declare no competing interests.
Ethical considerations
All experiments were performed in accordance with the Institutional Animal Care and Use Committee guidelines of the University of Pennsylvania and the Children Hospital of Philadelphia.
References
- Joiner, W. J. (2016). Unraveling the Evolutionary Determinants of Sleep. Curr Biol. 26(20): R1073-R1087. https://doi.org/10.1016/j.cub.2016.08.068.
- Keene, A. C. and Duboue, E. R. (2018). The origins and evolution of sleep. J Exp Biol. 221(Pt 11). https://doi.org/10.1242/jeb.159533.
- Rihel, J., Prober, D. A. and Schier, A. F. (2010). Monitoring sleep and arousal in zebrafish. Methods Cell Biol. 100: 281–294. https://doi.org/10.1016/B978-0-12-384892-5.00011-6.
- Lee, D. A., Oikonomou, G. and Prober, D. A. (2022). Large-scale Analysis of Sleep in Zebrafish. Bio Protoc. 12(3): e4313. https://doi.org/10.21769/BioProtoc.4313.
- Yokogawa, T., Marin, W., Faraco, J., Pezeron, G., Appelbaum, L., Zhang, J., Rosa, F., Mourrain, P. and Mignot, E. (2007). Characterization of sleep in zebrafish and insomnia in hypocretin receptor mutants. PLoS Biol .5(10): e277. https://doi.org/10.1371/journal.pbio.0050277.
- Doldur-Balli, F., Zimmerman, A. J., Keenan, B. T., Shetty, Z. Y., Grant, S. F. A., Seiler, C., Veatch, O. J. and Pack, A. I. (2023). Pleiotropic effects of a high confidence Autism Spectrum Disorder gene, arid1b, on zebrafish sleep. Neurobiol Sleep Circadian Rhythms. 14: 100096. https://doi.org/10.1016/j.nbscr.2023.100096.
- Chen, S., Reichert, S., Singh, C., Oikonomou, G., Rihel, J. and Prober, D. A. (2017). Light-Dependent Regulation of Sleep and Wake States by Prokineticin 2 in Zebrafish. Neuron. 95(1): 153–168 e156. https://doi.org/10.1016/j.neuron.2017.06.001.
- Doldur-Balli, F., Smieszek, S., Keenan, B. T., Zimmerman, A. J., Veatch, O. J., Polymeropoulos, C. M., Birznieks, G. and Polymeropoulos, M. H. (2024). Screening effects of HCN channel blockers on sleep/wake behavior in zebrafish. Front Neurosci. 18. https://doi.org/10.3389/fnins.2024.1375484.
- Rihel, J., Prober, D. A., Arvanites, A., Lam, K., Zimmerman, S., Jang, S., Haggarty, S. J., Kokel, D., Rubin, L. L., Peterson, R. T., et al. (2010). Zebrafish behavioral profiling links drugs to biological targets and rest/wake regulation. Science. 327(5963): 348–351. https://doi.org/10.1126/science.1183090.
- Zimmerman, A. J., Doldur-Balli, F., Keenan, B. T., Shetty, Z. Y., Palermo, J., Chesi, A., Sonti, S., Pahl, M. C., Brown, E. B., Pippin, J. A., et al. (Preprint). Zebrafish screen of high-confidence effector genes at insomnia GWAS loci implicates conserved regulators of sleep-wake behaviors. Preprint. 2022.2010.2005.511011. https://doi.org/10.1101/2022.10.05.511011.
- Ruzzo, E. K., Perez-Cano, L., Jung, J. Y., Wang, L. K., Kashef-Haghighi, D., Hartl, C., Singh, C., Xu, J., Hoekstra, J. N., Leventhal, O., et al. (2019). Inherited and De Novo Genetic Risk for Autism Impacts Shared Networks. Cell. 178(4): 850–866 e826. https://doi.org/10.1016/j.cell.2019.07.015.
- Palermo, J., Chesi, A., Zimmerman, A., Sonti, S., Lasconi, C., Brown, E. B., Pippin, J. A., Wells, A. D., Doldur-Balli, F., Mazzotti, D. R., et al. (2023). Variant-to-gene-mapping followed by cross-species genetic screening identifies GPI-anchor biosynthesis as novel regulator of sleep. Sci Adv. 9(1): 1–14. https://doi.org/https://doi.org/10.1101/2021.12.19.472248.
- Doldur-Balli, F., Imamura, T., Veatch, O. J., Gong, N. N., Lim, D. C., Hart, M. P., Abel, T., Kayser, M. S., Brodkin, E. S. and Pack, A. I. (2022). Synaptic dysfunction connects autism spectrum disorder and sleep disturbances: A perspective from studies in model organisms. Sleep Med Rev. 62(101595): 1–15. https://doi.org/10.1016/j.smrv.2022.101595.
- Shen, M. C., Ozacar, A. T., Osgood, M., Boeras, C., Pink, J., Thomas, J., Kohtz, J. D. and Karlstrom, R. (2013). Heat-shock-mediated conditional regulation of hedgehog/gli signaling in zebrafish. Dev Dyn. 242(5): 539–549. https://doi.org/10.1002/dvdy.23955.
- Xu M, Ye Y, Ye Z, Xu S, Liu W, Xu J, Zhang Y, Liu Q, Huang Z and W., Z. (2020). Human BCR/ABL1 induces chronic myeloid leukemia-like disease in zebrafish. Haematologica. 105(3): 674–686. https://doi.org/10.3324/haematol.2019.215939.
- Appelbaum, L., Wang, G. X., Maro, G. S., Mori, R., Tovin, A., Marin, W., Yokogawa, T., Kawakami, K., Smith, S. J., Gothilf, Y., et al. (2009). Sleep-wake regulation and hypocretin-melatonin interaction in zebrafish. Proc Natl Acad Sci U S A. 106(51): 21942–21947. https://doi.org/10.1073/pnas.906637106.
- Khan, Z. A., Labala, R. K., Yumnamcha, T., Devi, S. D., Mondal, G., Sanjita Devi, H., Rajiv, C., Bharali, R. and Chattoraj, A. (2018). Artificial Light at Night (ALAN), an alarm to ovarian physiology: A study of possible chronodisruption on zebrafish (Danio rerio). Sci Total Environ. 628–629: 1407–1421. https://doi.org/10.1016/j.scitotenv.2018.02.101.
Article Information
Copyright
© 2024 The Author(s); This is an open access article under the CC BY-NC license (https://creativecommons.org/licenses/by-nc/4.0/).
How to cite
Doldur-Balli, F., Zimmerman, A. J., Seiler, C., Veatch, O. and Pack, A. I. (2024). Measuring Sleep and Activity Patterns in Adult Zebrafish. Bio-protocol 14(12): e5014. DOI: 10.21769/BioProtoc.5014.
Category
Neuroscience > Behavioral neuroscience > Sleep and arousal
Do you have any questions about this protocol?
Post your question to gather feedback from the community. We will also invite the authors of this article to respond.