- Protocols

- Articles and Issues
- For Authors
- About
- Become a Reviewer

Isolation and Characterization of Extracellular Vesicles Derived from Ex Vivo Culture of Visceral Adipose Tissue

Published: Vol 14, Iss 11, Jun 5, 2024 DOI: 10.21769/BioProtoc.5011 Views: 2313
Reviewed by: Xinlei LiAnonymous reviewer(s)
Advertisement


Protocol Collections
Comprehensive collections of detailed, peer-reviewed protocols focusing on specific topics


Related protocols
Abstract
Extracellular vesicles (EVs) are a heterogeneous group of nanoparticles possessing a lipid bilayer membrane that plays a significant role in intercellular communication by transferring their cargoes, consisting of peptides, proteins, fatty acids, DNA, and RNA, to receiver cells. Isolation of EVs is cumbersome and time-consuming due to their nano size and the co-isolation of small molecules along with EVs. This is why current protocols for the isolation of EVs are unable to provide high purity. So far, studies have focused on EVs derived from cell supernatants or body fluids but are associated with a number of limitations. Cell lines with a high passage number cannot be considered as representative of the original cell type, and EVs isolated from those can present distinct properties and characteristics. Additionally, cultured cells only have a single cell type and do not possess any cellular interactions with other types of cells, which normally exist in the tissue microenvironment. Therefore, studies involving the direct EVs isolation from whole tissues can provide a better understanding of intercellular communication in vivo. This underscores the critical need to standardize and optimize protocols for isolating and characterizing EVs from tissues. We have developed a differential centrifugation-based technique to isolate and characterize EVs from whole adipose tissue, which can be potentially applied to other types of tissues. This may help us to better understand the role of EVs in the tissue microenvironment in both diseased and normal conditions.
Key features
• Isolation of tissue-derived extracellular vesicles from ex vivo culture of visceral adipose tissue or any whole tissue.
• Microscopic visualization of extracellular vesicles’ morphology without dehydration steps, with minimum effect on their shape.
• Flow cytometry approach to characterize the extracellular vesicles using specific protein markers, as an alternative to the time-consuming western blot.
Keywords: Extracellular vesiclesBackground
Extracellular vesicles (EVs) are nanoparticles possessing a lipid bilayer membrane that participate in intercellular communication by transferring encoded information and cargo molecules in the form of lipids, cytokines, RNA, DNA, proteins, peptides, and other biomolecules to the recipient cells [1]. Despite considerable progress, the challenges and complexity associated with EVs remain substantial. The isolation of EVs is frequently complicated by the presence of other extracellular macromolecules with similar features [2]. There are three main subtypes of EVs distinguished by their respective sources: body fluids, cell culture, and tissues [3].
Most of the studies have been accomplished on EVs derived from cell culture supernatants or body fluids, such as serum, plasma, whole blood, milk, saliva, and urine [3]. However, several drawbacks are associated with cell culture and body fluid–derived EVs related studies.
Cell culture supernatant-derived EVs can be considered as a reliable source for mechanistic studies due to the continuous availability and reproducibility of results. Cultured cells lose their unique features after long-term subcultures, affecting the quality and composition of the EVs released, thereby altering the interpretation of EVs biological function [4]. Moreover, cells are mostly cultured in a two-dimensional environment with single-cell type and no heterogenic cell–cell interactions that exist in the tissue microenvironment [4,5]. Therefore, cell culture–derived EVs cannot reflect the exact dynamic progression of the disease. Body fluid–derived EVs provide a minimally invasive method to imitate the dynamic development of diseases [6,7]. However, mixtures of EVs from various sources are included in body fluids, comprising serum-derived proteins [8]. Also, it is difficult to identify the exact tissue of origin from where the EVs are isolated [9]. Therefore, it is required to focus on the studies involving tissue-derived EVs from whole tissues so as to generate a better understanding; unfortunately, the number of related studies are limited, with existing isolation and characterization protocols primarily tailored to the former subtypes.
Tissue-derived EVs, residing in the extracellular interstitium, serve as integral mediators of intercellular signal transduction, providing the exact pathophysiological state and interactions between different types of cells, demonstrating the 3D structure and cell properties [5,10]. Notably, tissue-derived EVs overcome challenges associated with contaminants found in body fluid–derived EVs [4]. Analyzing EVs from tumor and adjacent non-tumor tissues provides valuable insights into their common biological properties [8].
Recognizing this gap, we present a robust and reproducible method for isolating and characterizing tissue-derived EVs, specifically from adipose tissue comprising of a heterogeneous population of cells that cooperate to perform multiple physiological roles. Adipose tissue dysfunction, usually observed in obesity, is linked to changes in the adipose secretome comprised of cytokines, free fatty acids, hormones, lipids, and, more lately, extracellular vesicles, which subsequently contribute to the disease pathology [11]. We have developed a simple, reliable, and reproducible method to isolate and characterize tissue-derived extracellular vesicles. We highly recommend further studies on tissue-derived EVs, as it can support a better understanding of the tissue microenvironment in normal and in diseased conditions.
Materials and reagents
Biological materials
Human visceral adipose tissue
Note: Peri-pancreatic adipose tissue (adipose tissue in the retroperitoneum region surrounding the pancreas) is used as biological experimental material in this protocol. Peri-pancreatic adipose tissue has been taken from human subjects undergoing pancreatic cancer surgery after written informed consent. However, the protocol can be used with any type of tissue.
The study has been approved by the Institutional Ethics Committee (INT/IEC/2023/SPL-287, 21st March, 2023) of Post Graduate Institute of Medical Education and Research, Chandigarh, India.
Reagents
Distilled water
10× Dulbecco’s phosphate buffered saline (DPBS) (HIMEDIA, catalog number: TL1022). Store at 15–30 °C
Antibiotic–Antimycotic cocktail (GibcoTM, catalog number: 15240-062)
Exosome-depleted FBS (GibcoTM, catalo number: A2720801)
HiAdipo XLTM adipocyte differentiation media (HIMEDIA, catalog number: AL521)
Part A: Basal medium (store at 2–8 °C)
Part B: Differentiation supplement (store at -5 to -20 °C)
For complete medium: Add the contents of Part B to Part A under aseptic conditions with 1 mL of antibiotic cocktail solution and 10% exosome-depleted FBS
PierceTM BCA Protein Assay kit (Thermo Scientific, catalog number: 23227)
RIPA (EMD Millipore, catalog number: 20-188)
Protease inhibitor cocktail (Sigma, catalog number: P8340)
Sodium dihydro orthophosphate anhydrous (Sigma, catalog number: 5438400100)
Sucrose (Sigma, catalog number: S0389)
Sodium hydroxide (Sigma, catalog number: 1.06498)
Uranyl acetate dihydrate (SRL laboratories, catalog number: 81405)
25% glutaraldehyde EM grade (Electron Microscopy Sciences, catalog number: 16220)
30% Acrylamide-bisacrylamide solution (HIMEDIA, catalogue number: ML037)
Tris base (HIMEDIA, catalog number: TC072M)
Sodium do-decyl sulphate (SDS) (HIMEDIA, catalog number: GRM205)
Glycine (HIMEDIA, catalog number: MB013)
Sodium chloride (NaCl) (HIMEDIA, catalog number: GRM3954)
Bovine serum albumin (BSA) (HIMEDIA, catalog number: MB083)
Tween 20 (Sigma, catalog number: P9416)
Ponceau S (HIMEDIA, catalog number: ML045)
Glacial acetic acid (Central drug house, product code: 027017)
2- propanol (HIMEDIA, catalog number: MB063)
Glycerol (HIMEDIA, catalog number: MB060)
Bromophenol blue (Sigma, catalog number: 114391)
β-mercaptoethanol (Sigma, catalog number: 6250)
Methanol LR (SDFCL limited, product code: 39192)
Ammonium persulphate (APS) (HIMEDIA, catalog number: MB003)
N, N, N’, N’,-Tetramethyl ethylenediamine (TEMED) (Sigma, catalog number: T9281)
Clarity Western ECL substrate (Bio-Rad, catalog number: 170-5061)
Pre-stained protein ladder (HIMEDIA, catalog number: MBT092)
Coomassie® brilliant blue (HIMEDIA, catalog number: MB092)
Primary and secondary antibodies for Western blotting (Table 1)
Table 1. Primary and secondary antibodies
Antibody Host Company Catalog number CD 63 (clone: E1W3T) Rabbit mAb Cell Signaling Technology 52090 CD 9 (clone: D8O1A) Rabbit mAb Cell Signaling Technology 13174 TSG 101 (clone: E6V1X) Rabbit mAb Cell Signaling Technology 72312 Calnexin Rabbit pAb Cell Signaling Technology 2433 Anti-Rabbit-HRP Goat IgG Abcam ab97051 CD 9 exosome capture beads (Abcam, catalog number: ab239685)
CD 63 exosome capture beads (Abcam, catalog number: ab239686)
Conjugated antibodies for flow cytometry (Table 2)
Table 2. Conjugated antibodies
Antibody-Fluorochrome Host Company Catalog number CD 63-FITC (clone: H5C6) Mouse mAb BioLegend 353005 CD 9-PE (clone: HI9A) Mouse mAb BioLegend 312105
Solutions
1× Dulbecco’s phosphate buffered saline (DPBS) (see Recipes)
1× RIPA buffer (see Recipes)
BCA working solution (see Recipes)
Sorensen’s phosphate buffer (see Recipes)
3% Glutaraldehyde (see Recipes)
5% Uranyl acetate (see Recipes)
10× Electrophoresis running buffer (see Recipes)
1× Electrophoresis running buffer (see Recipes)
Transfer buffer (see Recipes)
1.0 M Tris-HCl, pH 6.8 (see Recipes)
1.5 M Tris-HCl, pH 8.8 (see Recipes)
10% SDS (see Recipes)
10% APS (see Recipes)
10% SDS-PAGE resolving gel (see Recipes)
12% SDS-PAGE resolving gel (see Recipes)
15% SDS-PAGE stacking gel (see Recipes)
6× Loading dye (Laemmli buffer) (see Recipes)
Working loading dye (reducing) (see Recipes)
CBB staining solution (see Recipes)
10× TBS (see Recipes)
1× TBST (see Recipes)
5% BSA Blocking Buffer (see Recipes)
Recipes
Note: All the solutions are kept under room temperature unless described. Always refer to the manufacturer’s instructions for the storage temperature and shelf life of reagent.
1× DPBS
Reagent Final concentration Amount 10× DPBS 10× 5 mL Distilled water n/a 45 mL 1× RIPA Buffer
Reagent Final concentration Amount 10× RIPA n/a 100 μL Distilled water n/a 900 μL Protease inhibitor n/a 2 μL BCA working solution
Reagent Final concentration Amount Part A n/a 50 mL Part B n/a 1 mL This solution is stable for 1 day only. Prepare just before use. Working solution quantity will vary upon the requirement and the number of samples. The ratio of part A and part B should be 50:1.
Sorensen’s phosphate buffer
Reagent Final concentration Amount Sodium dihydro orthophosphate n/a 1.9 g Sodium hydroxide n/a 0.28 g (≈ 2 pellets) Distilled water n/a 400 mL 3% Glutaraldehyde
Reagent Final concentration Amount Sorensen’s phosphate buffer n/a 400 mL Glutaraldehyde 25% 54 mL Sucrose n/a 7.4 g Adjust the pH to 7.2–7.4. Prepare the solution as stock and store at 4 °C for long-term use.
5% uranyl acetate
Reagent Final concentration Amount Uranyl acetate 5% 50 mg Distilled water n/a 1 mL 10× Electrophoresis running buffer
Reagent Final concentration Amount Tris base 25 mM 30 g Glycine 192 mM 144 g SDS 0.1% 10 g Make up the volume to 1,000 mL. Keep at 37 overnight to dissolve completely. Store at 4 for long-term use.
1× Electrophoresis running buffer
Reagent Final concentration Amount 10× electrophoresis running buffer n/a 100 mL Distilled water n/a 900 mL Transfer buffer
Reagent Final concentration Amount Tris base 25 mM 3.0 g Glycine 190 mM 14.2 g Methanol n/a 200 mL Make up the volume to 1,000 mL. Prepare the solution 3–4 h before use so that it can be completely dissolved. The solution needs to be chilled.
1.0 M Tris-HCl
Reagent Final concentration Amount Tris base 1.0 M 6 g Distilled water n/a 70 mL Keep the solution at 37 overnight. Set the pH at 6.8 using concentrated HCl. Make up the final volume to 100 mL. Store at 4 .
1.5 M Tris-HCl
Reagent Final concentration Amount Tris base 1.5 M 18.15 g Distilled water n/a 70 mL Keep the solution at 37 overnight. Set the pH at 8.8 using concentrated HCl. Make up the final volume to 100 mL. Store at 4 .
10% SDS
Reagent Final concentration Amount SDS n/a 10 g Distilled water n/a 100 mL 10% APS
Reagent Final concentration Amount Ammonium persulphate n/a 0.1 g Distilled water n/a 1 mL Freshly prepare the solution every time before use. Keep the APS on ice until use.
10% polyacrylamide resolving gel
Reagent Final concentration Amount Acrylamide-bisacrylamide solution 30% 3.3 mL Tris-HCl 1.5 M 2.5 mL SDS 10% 0.1 mL Distilled water n/a 4.0 mL APS 10% 100 μL TEMED n/a 4 μL 12% polyacrylamide resolving gel
Reagent Final concentration Amount Acrylamide-bisacrylamide solution 30% 4 mL Tris-HCl 1.5 M 2.5 mL SDS 10% 0.1 mL Distilled water n/a 3.3 mL APS 10% 100 μL TEMED n/a 4 μL 5% polyacrylamide stacking gel
Reagent Final concentration Amount Acrylamide-bisacrylamide solution 30% 330 μL Tris-HCl (pH: 6.8) 1.0 M 250 μL SDS 10% 20 μL Distilled water n/a 1.4 mL APS 10% 20 μL TEMED n/a 2 μL 6× Loading dye (Laemmli buffer)
Reagent Final concentration Amount SDS 9% 0.9 g Pure glycerol 50% 5 mL Tris-HCl 375 mM 0.591 g Distilled water n/a 7 mL Dissolve all three items. Set to pH 6.8 using NaOH. Add 0.03 g of bromophenol blue (0.03%). Make up the final volume to 10 mL using distilled water. Store at -20 for long term use.
Working loading dye (reducing)
Reagent Final concentration Amount 6× Loading dye n/a 91 μL β-mercaptoethanol n/a 9 μL Freshly prepare the dye every time before use.
CBB staining solution
Reagent Final concentration Amount Coomassie brilliant blue 0.1% 0.05 g Methanol n/a 20 mL Distilled water n/a 70 mL Glacial acetic acid n/a 10 mL Coomassie brilliant blue is first dissolved in methanol followed by distilled water and acetic acid. Mix thoroughly and store at 4 . This solution can be used several times.
10× TBS
Reagent Final concentration Amount Tris base n/a 24 g NaCl n/a 88 g Distilled water n/a 900 mL Keep the solution at 37 overnight. Set to pH 7.6 using concentrated HCl. Make up the final volume to 1000 mL. Store at 4 for long term use.
1× TBST
Reagent Final concentration Amount 10× TBS n/a 100 mL Distilled water n/a 900 mL Tween 20 0.1% 1 mL Store the solution at 4 .
5% BSA blocking buffer
Reagent Final concentration Amount BSA 5% 2.5 g 1× TBST n/a 50 mL Freshly prepare the solution each time.
Laboratory supplies
FinnpipetteTM F2 Good Laboratory Pipetting (GLP) Kits: 1: 1–10 μL, 10–100 μL, and 100–1000 μL (Thermo ScientificTM, catalog number: 4700870)
1.5 mL micro centrifuge tubes (Tarsons, catalog number: 500010)
96-well plate (Falcons, catalog number: 353072)
15 mL graduated centrifuge tubes, PP (Tarsons, catalog number: 546021)
50 mL graduated centrifuge tubes, PP (Tarsons, catalog number: 546041)
Disposable Petri dishes (Tarsons, catalog number: 460090-90 mm)
Costar® 6-well cell culture plate (Corning Inc, catalog number: 3516)
Sterile surgical blades
Syringe driven filters (HIMEDIA, catalog number: SF-137)
Quartz flow cell cuvette (Malvern, model number: ZEN0023)
Type 90 Ti fixed-angle titanium rotor (Beckmann Coulter, product number: 355530)
Quick-seal tube kit, 16 × 76 mm (Beckmann Coulter, product number: 348179)
Coverslips
Copper grid, carbon coated, Type B 200 mesh (TED Pella USA, model number: 01810)
Tweezer, high precision, Style 5 (Electron Microscopy Sciences, catalog number: 78325-5S)
Blotting sheets
Nitrocellulose transfer membrane 0.45 μm (HIMEDIA, catalog number: SF110B)
Polystyrene round-bottom tube 12 × 75 mm style (Falcon, catalog number: 352054)
Equipment
Airstream® Class II Type A2 biological safety cabinet (ESCO Scientific, catalog number: 2011011)
Centrifuge 5430-R with rotor F-35-6-30 (Eppendorf, catalog number: 022620659)
Ultra-sonic bath sonicator (LABWAN, model: LW-USB11)
Optima XPN 100 ultracentrifuge (Beckmann coulter, model: OPTIMA XPN-100)
Zetasizer Nano ZSP (Malvern, model: MEL0665)
JSM-IT300 InTouchScopeTM scanning electron microscope (JEOL, model: JSM-IT300)
JEOL-1400 plus Transmission electron microscope (JEOL, model: JEOL 1400 plus)
Mini-PROTEAN® TETRA CELL (Bio-Rad, catalog number: 1658004)
Mini-PROTEAN® TETRA CELL Single core (Bio-Rad, catalog number: 1658005)
PROTEAN® System casting stand (Bio-Rad, catalog number: 1658050)
Mini-PROTEAN® TETRA cell handcasting accessory kit (Bio-Rad, catalog number: 1653370)
Mini-PROTEAN® system glass plates (Bio-Rad, catalog number: 1653308)
Mini-PROTEAN® Gel releasers (Bio-Rad, catalog number: 1653320)
Mini-PROTEAN® gaskets (Bio-Rad, catalog number: 1653305)
Mini-PROTEAN® comb, 10 well (Bio-Rad, catalog number: 1653359)
Mini-TRANS-BLOT® electrophoretic transfer cell (Bio-Rad, catalog number: 1703930)
Mini-TRANS-BLOT® foam pads (Bio-Rad, catalog number: 1703933)
Mini-TRANS-BLOT® accessories (Bio-Rad, catalog number: 1703820)
Rocking shaker (Dot Scientific Inc, catalog number: SK-R1807-S)
Azure 400® imager (Azure Biosystems, model number: AZURE 400)
BD FACS Canto II flow cytometer (BD Biosciences, model: BD FACS CantoTM II)
Procedure
Procurement and culture of human visceral adipose tissue
Add approximately 5 g of visceral adipose tissue from human subjects undergoing surgery depending upon the site of adipose tissue to a sterile pre-chilled 1× DPBS vial (see Recipe 1).
Note: In this study, peri-pancreatic adipose tissue is used as visceral adipose tissue, as mentioned in biological material section. A fresh tissue sample should be taken. Frozen tissue samples should not be used, as it can decrease the quality and quantity of extracellular vesicles.
Clean the tissue thoroughly 3–4 times with 1× DBPS until the tissue is free from blood.
Note: This protocol needs to be strictly done in a biosafety cabinet class II, as the tissue has to be sterile throughout.
Transfer the tissue to a sterile Petri dish and cut the tissue in small pieces using sterile blades.
Transfer the tissue pieces to a 6-well plate and add 3 mL of exosome-free adipocyte differentiation media in the first 48 h.
Collect the conditioned media after 48 h in a sterile vial; store at -20 °C and add 3 mL of exosome-free adipocyte differentiation media again for the next 48 h.
Collect and pool the conditioned media for extracellular vesicle isolation.
Note: If not subjected to extracellular vesicle isolation directly, the conditioned media can be stored at -80 °C up to five days for the better quality and quantity of EVs.
Isolation of extracellular vesicles by ultracentrifugation
Label 15 mL sterile tubes containing conditioned media.
Centrifuge the conditioned media at 2,000× g for 20 min at 4 °C to remove any tissue debris.
Note: Isolation of the EVs should be strictly performed at 4 or on ice.
Collect the supernatant in a fresh sterile tube and place it on ice.
Filter the supernatant using a 0.45 μM syringe filter to remove large sized vesicles or apoptotic bodies.
Note: Alternatively, centrifuge the supernatant at 10,000× g for 1 h at 4 to remove large sized vesicles or apoptotic bodies.
Transfer the filtered supernatant in the ultracentrifuge polypropylene tubes on ice.
Centrifuge at 100,000× g at 4 for 2 h for EVs isolation.
Carefully discard the supernatant using a 1000 μL and 20 μL pipette. Leave approximately 200 μL of supernatant to avoid disturbing the pellet.
Fill the ultracentrifuge tube up to 14 mL (marking at the tube) with 1× DPBS.
Centrifuge at 100,000× g at 4 for 2 h to wash the EVs pellet.
Discard the supernatant carefully.
Dissolve the pellet in 200 μL of ice-cold 0.1× DPBS (Figure 1).
Note: Dilute 1× DPBS by dissolving 5 mL of 1× DPBS in 45 mL of distilled water.
Note: Sometimes, the pellet does not appear as clear and is hard to visualize; in this case, it is suggested to remove the supernatant carefully and leaving up to 50 µL.
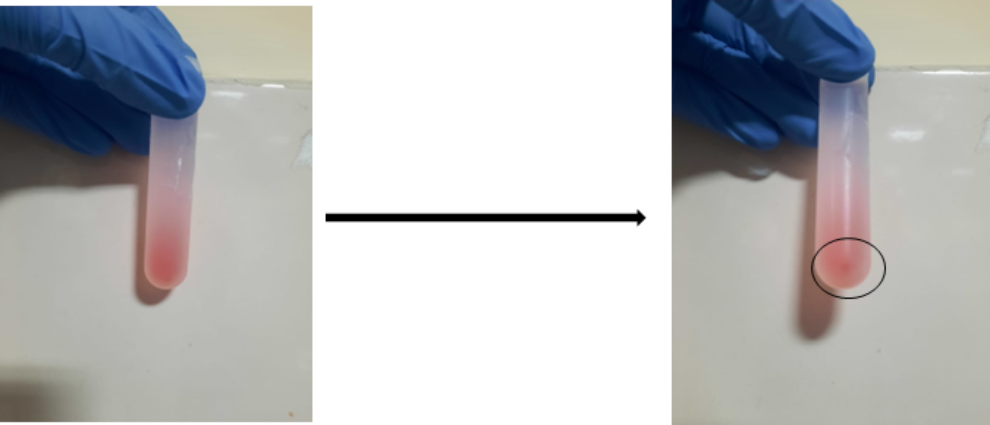
Figure 1. Isolation of adipose tissue–derived extracellular vesicles (EVs) by ultracentrifugation. The circle shows the EVs pellet obtained after ultracentrifugation.The EVs pellet is ready for quantification and characterization.
Quantification of total EVs protein by BCA analysis
Prepare BSA dilutions (see Table 3) in 1.5 mL microcentrifuge tubes to obtain a BCA standard curve.
Table 3. BCA standard curve preparation
Albumin standard dilution (mg/mL) Albumin stock solution (2 mg/mL) (μL) ddH2O (μL) 2.00 200 - 1.00 100 100 0.5 50 150 0.25 25 175 0.125 12.5 187.5 0.0625 6.25 193.75 Add 100 μL of 1× RIPA buffer to 100 μL of EVs (dissolved in 0.1× DPBS) and mix thoroughly (see Recipe 2).
Keep the solution for 1 h at 4 for protein enrichment. Add 2 μL of protease inhibitor cocktail.
Sonicate for 2 min with 1 min break thrice on ice.
Centrifuge at 14,000× g for 25 min.
Collect supernatant in 1.5 mL tubes and discard the pellet (if formed).
Pipette 12.5 μL of BSA standards and EVs sample in triplicates into the same 96-well plate.
Add 100 μL of BCA working solution to each well (see Recipe 3).
Incubate the plate at 37 °C for 45 min and evaluate the protein concentration at OD 562 with plate reader.
Calculate the protein concentration by plotting the BCA standard curve (Table 4 and Figure 2).
Table 4. BCA analysis. Total EVs protein calculation performed by BCA analysis. Six BSA standards in serial dilutions were used, and average absorbance was calculated at 562 nm.
Sample OD 1 OD 2 OD 3 Average OD Concentration BSA S1 (2 mg/mL) 1.222 1.229 1.264 1.238333333 BSA S2 (1 mg/mL) 0.656 0.709 0.673 0.679333333 BSA S3 (0.5 mg/mL) 0.415 0.413 0.414 BSA S4 (0.25 mg/mL) 0.262 0.285 0.276 0.274333333 BSA S5 (0.125 mg/mL) 0.183 0.17 0.178 0.177 BSA S6 (0.0625 mg/mL) 0.134 0.131 0.133 0.132666667 Adipose tissue 1 0.899 1.005 0.984 0.962666667 1.5 mg/mL Adipose tissue 2 0.697 0.59 0.713 0.666666667 0.975 mg/mL 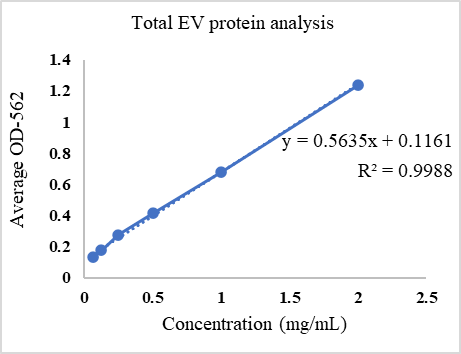
Figure 2. BCA standard curve for estimation of concentration of proteins. The concentration of adipose tissue–derived extracellular vesicles is calculated using a linear equation obtained from the standard curve. EV, extracellular vesicles.
According to the Minimal Information for the Study of Extracellular Vesicles (MISEV 2023) guidelines, each preparation of EVs should be (a) defined by quantitative measures of the source of EVs; (b) characterized to the extent possible to determine abundance of EVs; (c) tested for the presence of EV components associated with subtypes, and (d) validated for the presence of other non-vesicular, co-isolated contaminants.
Size evaluation of EVs by dynamic light scattering
Dilute isolated EVs in 0.1× DPBS (1:200). Mix the solution gently and thoroughly such that a single suspension of EVs will be formed.
Transfer 200 μL of diluted EVs to the glass cuvette and perform particle size analysis.
The system takes approximately 30 s to calculate the average particle size (Figure 3).
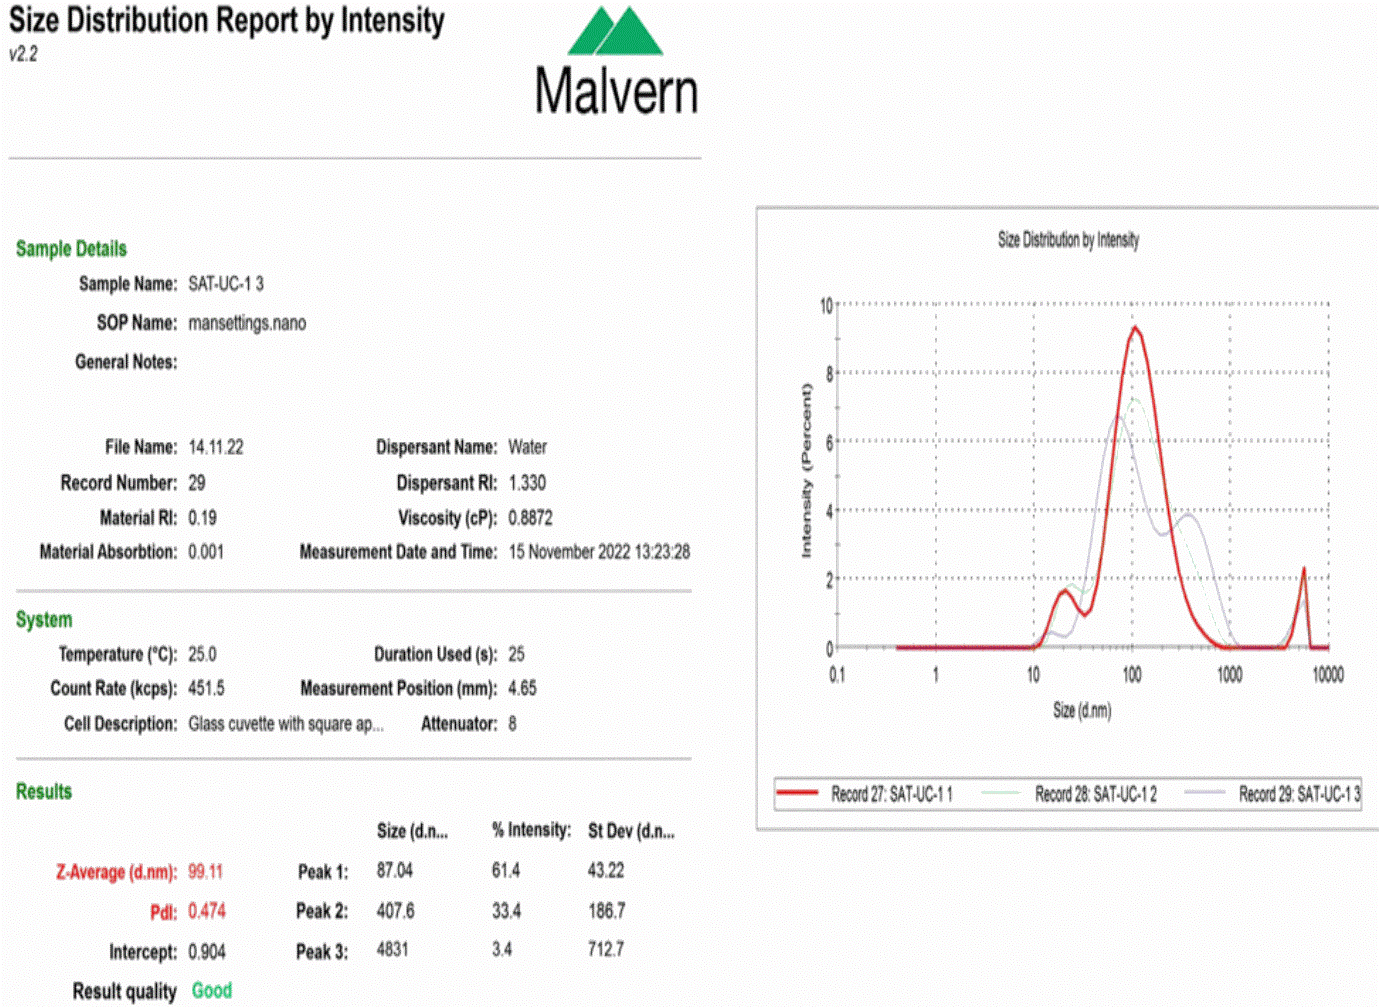
Figure 3. Dynamic light scattering for particle size analysis of extracellular vesicles. The figure represents size evaluation of isolated extracellular vesicles from adipose tissue sample. The average size of the particle appears to be 99.11 nm, which is in the size range of extracellular vesicles, with a polydispersity index (PDI) of 0.474, which represents a heterogeneous population of extracellular vesicles in the adipose tissue.
Visualization of EVs via scanning electron microscopy
Dilute the freshly isolated EVs in 0.1× DPBS (1:500). Mix the solution gently and thoroughly such that a single suspension of EVs is formed.
Spread 50 μL of diluted EVs evenly on a coverslip.
Let the coverslip dry under sterile conditions.
To make the surface conductive, apply a coating gold-palladium by sputtering.
Visualize under the SEM at low beam energy (7 kV) (Figure 4).
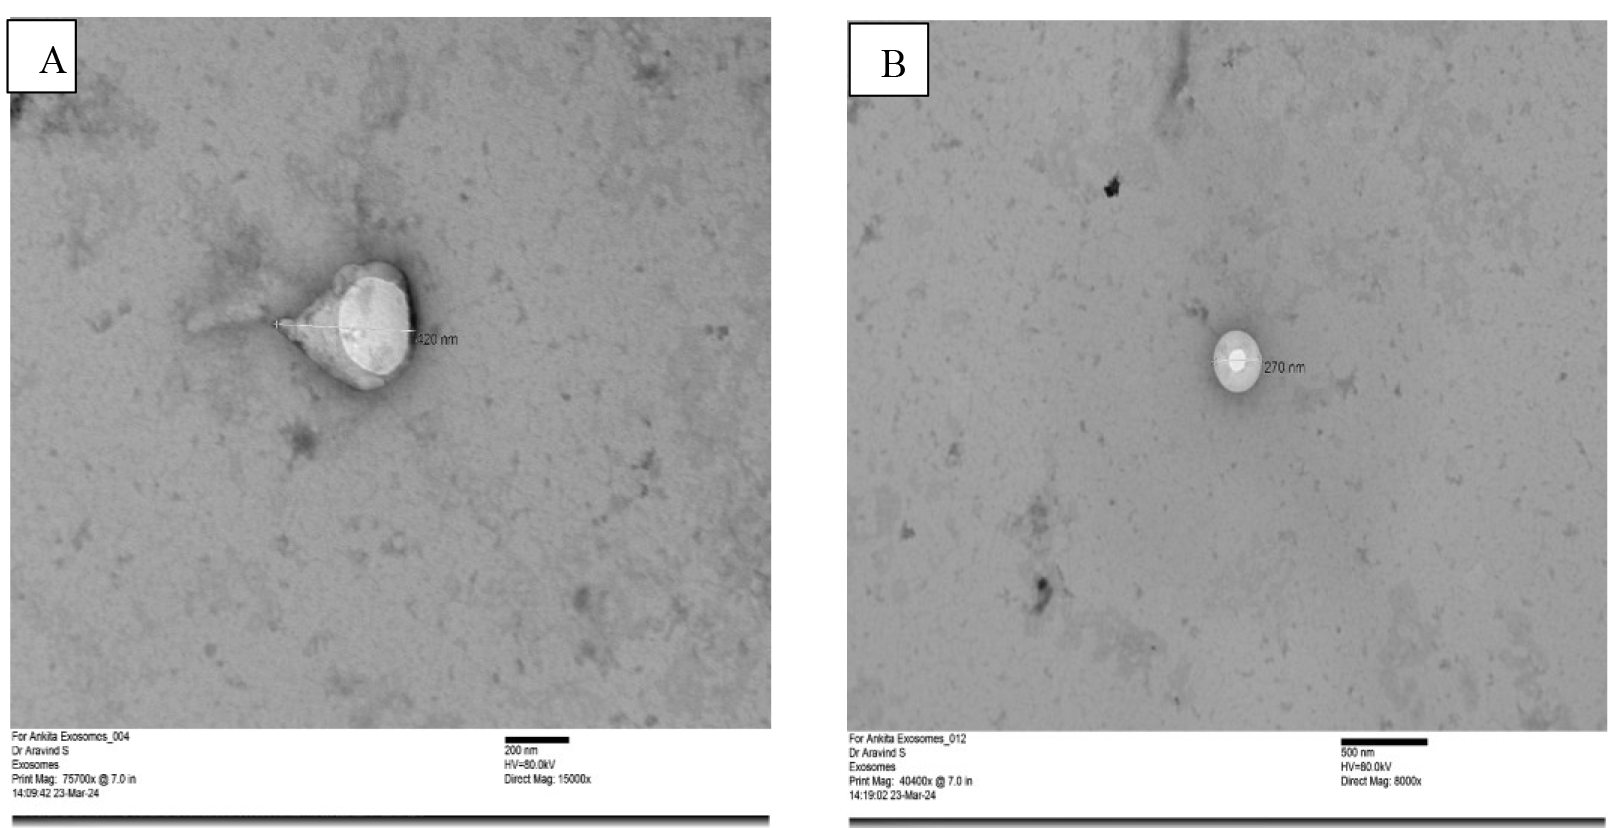
Figure 4. Scanning electron microscopy for size and morphological analysis of extracellular vesicles. The figure shows a heterogeneous population of isolated extracellular vesicles in the size range of 30–1,000 nm. (A) Magnification: 50,000×; Scale: 0.5 μm (B) Magnification: 100,000×; Scale: 0.1 µm
High resolution imaging by transmission electron microscopy
Dilute the freshly isolated EVs in 0.1× DBPS (1:500). Mix the solution gently and thoroughly such that a single suspension of EVs is formed.
Filter the diluted sample using a 0.45 μM syringe filter.
Mix 5 μL of diluted EVs and 5 μL of 3% glutaraldehyde (see Recipe 5). Incubate at room temperature for 5 min.
Incubate the carbon coated copper grid on a drop of fixed EVs for 2 min.
Remove excess sample using a blotting sheet by holding the grid gently with Tweezer, Style 5 from the side.
Incubate the grid on a drop of 5% uranyl acetate (see Recipe 6) for 5 min.
Again, remove the excess sample using blotting sheet.
Air dry the grid under sterile conditions.
Transfer to gelatin capsule or microcentrifuge tubes until visualization.
For visualization, mount the grid in a TEM specimen holder and set the voltage at 120 kV.
Visualize the EVs under the TEM (Figure 5).
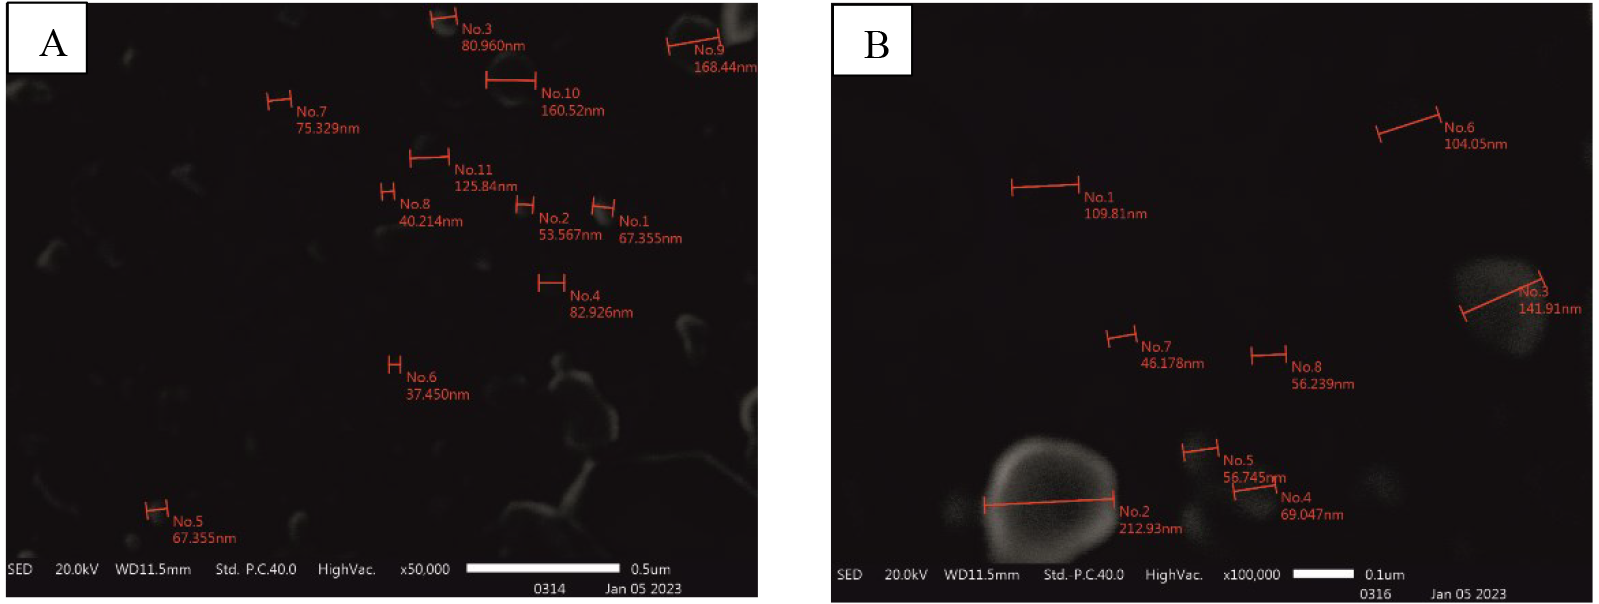
Figure 5. Transmission electron microscopy for the evaluation of the extracellular vesicles’ morphology. Extracellular vesicles show an exact round-shaped morphology surrounded by a membrane. The figure shows a heterogeneous extracellular vesicle population of different size ranges. (A) Scale: 200 nm (B) Scale: 500 nm
Characterization by protein composition using western blotting
Prepare 1× electrophoresis running buffer from 10× running buffer and transfer buffer (see Recipes 7–9) and keep the solutions at 4 to cool down.
For transferring of proteins, cut nitrocellulose membranes conferring to the gel size.
Prepare the polyacrylamide gel (10% for antibodies CD 63, TSG 101, Flotilin-1, and Calnexin and 12% for CD 9) (see Recipes 10–16) in PROTEAN® system casting stand. Let the gel sit for 25–30 min to get polymerized at room temperature.
Note: Different percentages of polyacrylamide are used for gel preparation depending upon the molecular weight of the proteins to be resolved: 7.5% for 50–200 kDa proteins, 10% for 15–100 kDa proteins, 12% for 10–70 kDa proteins, and 15% for 12–45 kDa proteins.
By the time gel gets polymerized, resuspend 50 µg of EVs sample (dissolved in RIPA) in working loading dye thoroughly and let it boil at 95 for 5 min in a dry bath (see Recipes 17–18).
Remove the polymerized polyacrylamide gels carefully from the casting stand and shift them into Mini-PROTEAN® TETRA CELL filled with chilled 1× electrophoresis running buffer.
Note: Chilled 1× electrophoresis running buffer is required to prevent the smile distortion effect leading to smiling or frowning bands.
Fill the wells of the gel with 1× running buffer before the loading of samples.
Inject the samples in each well using 10 μL tips.
Note: Carefully inject the samples as it may rupture the well and the sample may overflow sometimes. Join the 2–3 wells of the comb using tape when preparing polyacrylamide gel if the concentration of the sample is too low and the volume of the sample increases (>40 μL).
Run the gel at 70 V for the first 30 min for the stacking of the samples. After that, run the gel at 90 V for 150 min or until the loading buffer dye reaches the base of the gel.
Gently separate the glass plate containing gel from Mini-PROTEAN® TETRA CELL system.
Gently remove the gel from glass plates using releasers.
Note: Alternatively, before proceeding to protein transfer, it is important to visualize the separated protein bands on electrophoretic gel using CBB staining (see Recipes 19). CBB binds to the proteins by a combination of hydrophobic interactions and heteropolar bonding with basic amino acids. For this, pour 25–30 mL of CBB stain on to the electrophoretic gel placed in the tray and incubate it at room temperature for 1 h on a rocking shaker. For clear visualization of bands, wash the gel with distilled water thrice for 10 min each (Figure 6).
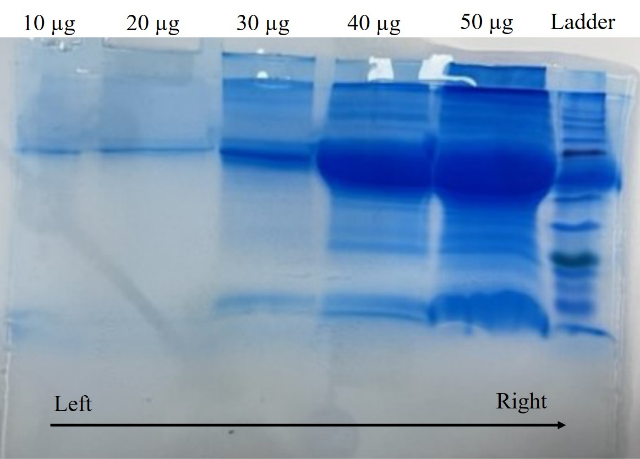
Figure 6. Representative image of Coomassie brilliant blue staining. The figure represents multiple bands of isolated extracellular vesicle proteins of one sample. The concentration of the protein loaded is 10, 20, 30, 40, and 50 μg from left to right. Different concentrations were used to standardize the protocol for protein transfer. Protein ladder (extreme right) is used for the detection of molecular weight.Note: CBB stained gel is not reusable for protein transfer. Once the electrophoresis is confirmed, run a new SDS-PAGE and continue from step 10 without CBB staining.
Place the gel into a clean tray for 5 min containing 50–100 mL of chilled freshly prepared transfer buffer such that the gel equilibrates.
Label the nitrocellulose membrane (0.45 μm) and rinse it with chilled transfer buffer.
Note: If using PVDF membrane, make sure to activate the membrane with 100% methanol for 1 min. Nitrocellulose membranes do not need to get activated.
Soak the foam pads and filter papers in chilled transfer buffer.
Assemble the filter paper, gel, and nitrocellulose membrane in the following order.
Foam pad → Filter paper → Gel nitrocellulose membrane → Filter paper → Foam pad
The arrangement should be done from the black side to the white side of the cassette.
Note: Ensure that no bubble formation occurs while transferring the gel and membrane on to the pads as it will disrupt the transfer.
Transfer the cassette in the Mini-TRANS-BLOT® electrophoretic transfer cell and fill the system with chilled transfer buffer. Arrange the cassettes in the appropriate order.
Transfer at 70 V for 2 h at 4 .
After the transfer, gently remove the membrane and transfer it to the tray with a lid containing 25–30 mL of 1× TBST (see Recipes 20–21).
Wash the membrane thrice for 10 min under gentle agitation.
Note: Before proceeding to the next step, first confirm the transfer of proteins via Ponceau S. stain, which is a reversible stain for evaluating the transfer efficiency of western blotting. Ponceau S is red colored and negatively charged, binding non-polar groups of proteins and positively charged amino groups. For this, add ready-to-use Ponceau S. stain to the membrane for 20 min and wash with 1× TBST thrice for 10 min each.
After visualization of transferred proteins, incubate the membrane in 5% BSA for 2 h at 37 under gentle agitation (see Recipes 22).
Rinse the membrane with 1× TBST three times for 5 min each under gentle agitation.
Incubate the membrane with 10 mL of primary antibody with recommended dilutions in 5% BSA (prepared in 1× TBST) overnight at 4 under gentle agitation (Table 5).
Table 5. Dilutions of primary antibody used
Antibody Dilution used CD 63 1:1,000 CD 9 1:1,000 TSG 101 1:1,000 Calnexin 1:1,000
Note: Use the recommended concentration/dilution of the primary antibody.Wash the membrane with 1× TBST three times for 5 min each under gentle agitation.
Incubate the membrane with 10 mL of anti-rabbit secondary antibody (1:1,000 dilution in 5% BSA) for 2 h under gentle agitation at room temperature.
Rinse membrane using 1× TBST three times for 5 min each under gentle agitation.
Prepare ECL working solution by pipetting 1 mL of ECL substrate peroxide solution and 1 mL of ECL substrate enhancer solution.
Remove the excess 1× TBST.
Add the ECL working solution to the tray containing membrane. Incubate the membrane for 30 s and place the membrane in the Azure 300.
Image the membranes (Figure 7).
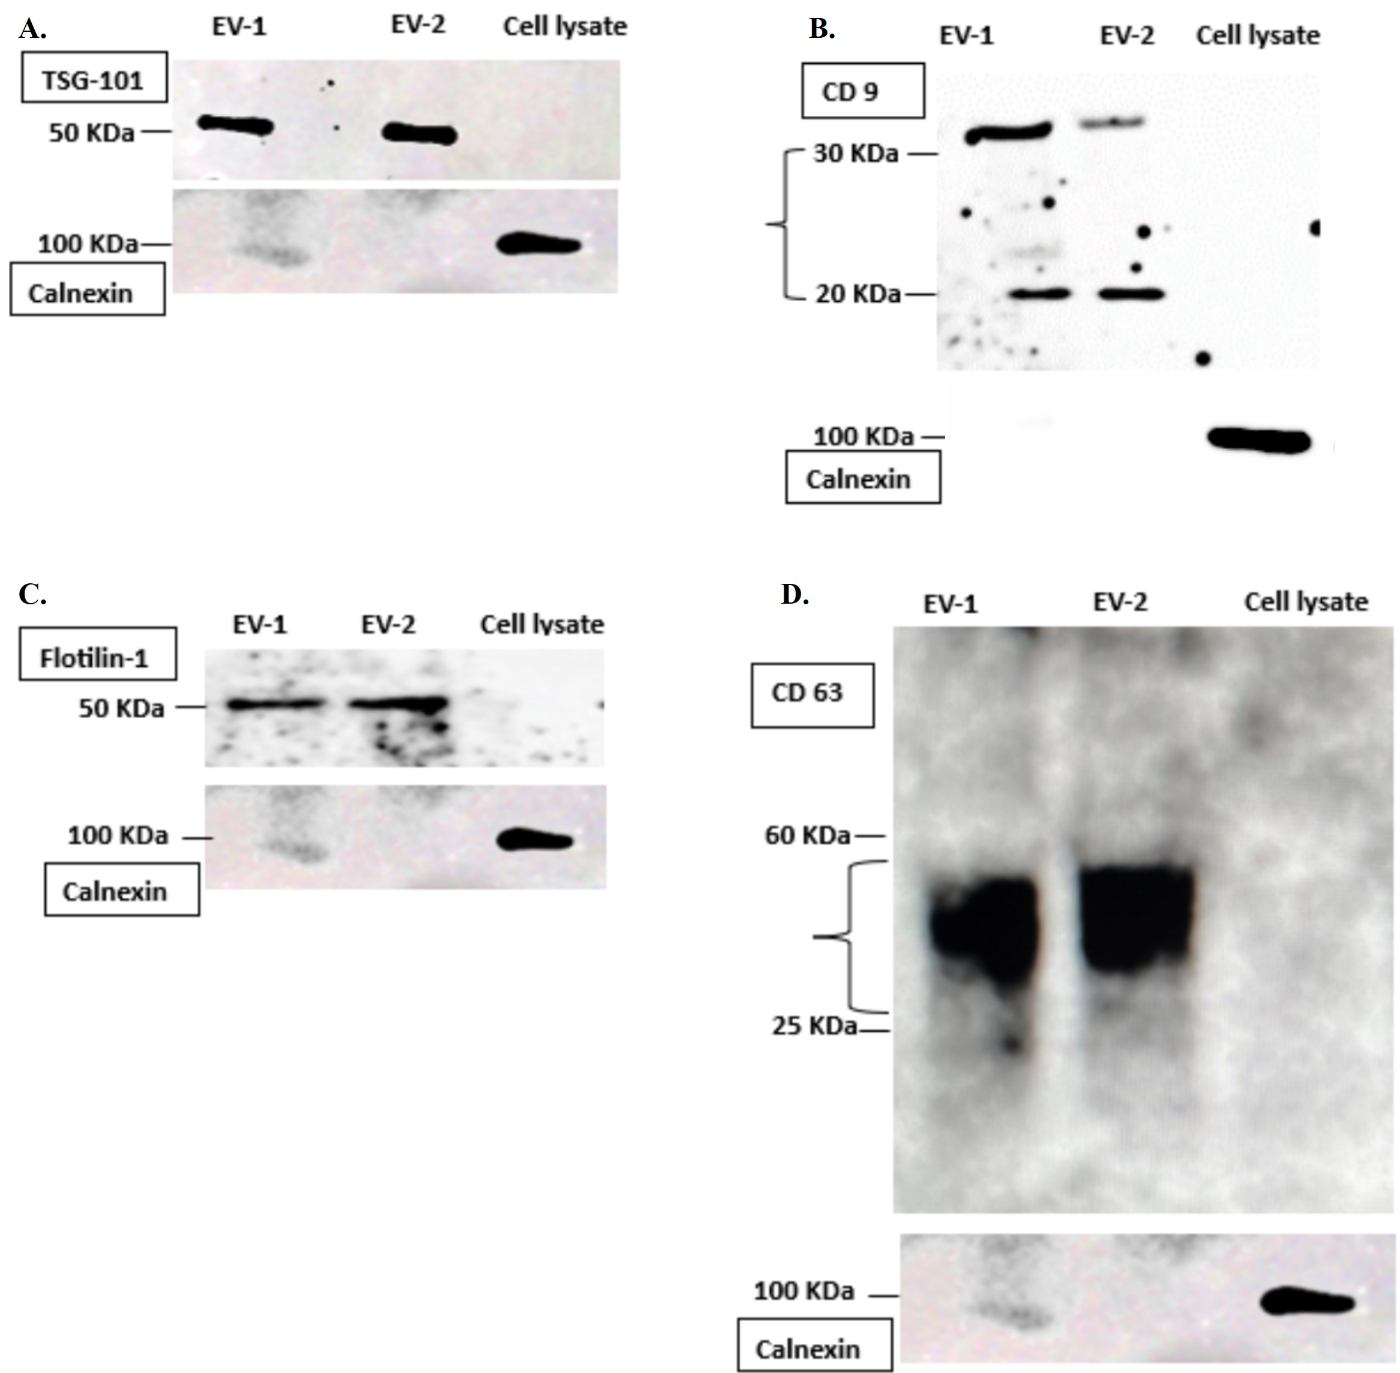
Figure 7. Western blot analysis. Isolated extracellular vesicles’ (EVs) surface proteins are characterized via western blotting. (A) TSG 101, molecular weight: 50 KDa; (B) CD 9, molecular weight: 22 KDa, 35 KDa; (C) Flotilin-1, molecular weight: 50 KDa; (D) CD 63, molecular weight: 25–60 KDa. Calnexin, endoplasmic reticulum marker, was used as a negative control for extracellular vesicles characterization during identification of TSG 101, CD 9, CD 63, and Flotilin-1 proteins. Calnexin, negative control along with TSG 101, CD 63, and Flotilin-1 protein gel is from 10% resolving gel (A, C, D), whereas CD 9 protein gel (B) is from 12% resolving gel.
Characterization by flow cytometry
Dissolve freshly isolated EVs pellet in 1 mL of 1× DPBS. Divide the 200–300 μL sample in three polystyrene round-bottom tubes. Divide the sample according to the number of tubes.
Add 50 μL of CD 9 and CD63 capture beads in tube 2 and tube 3, respectively. Tube 1 is the blank/unstained tube. Resuspend the capture beads by vortex before use.
Incubate at room temperature overnight under dark conditions.
After overnight incubation, add 5 μL of conjugated primary antibody: CD 9-PE antibody in tube 2 and CD 63-FITC antibody in tube 3.
Incubate at 4 for 2 h in dark conditions.
Wash with 1 mL of 1× DPBS (500× g for 5 min at room temperature).
Carefully remove the supernatant and resuspend the pellet in 300 μL of 1× DPBS.
Mix well by vortex. Acquire the samples using BD FACS Canto II flow cytometer using the following parameters and compensation (Figure 8).
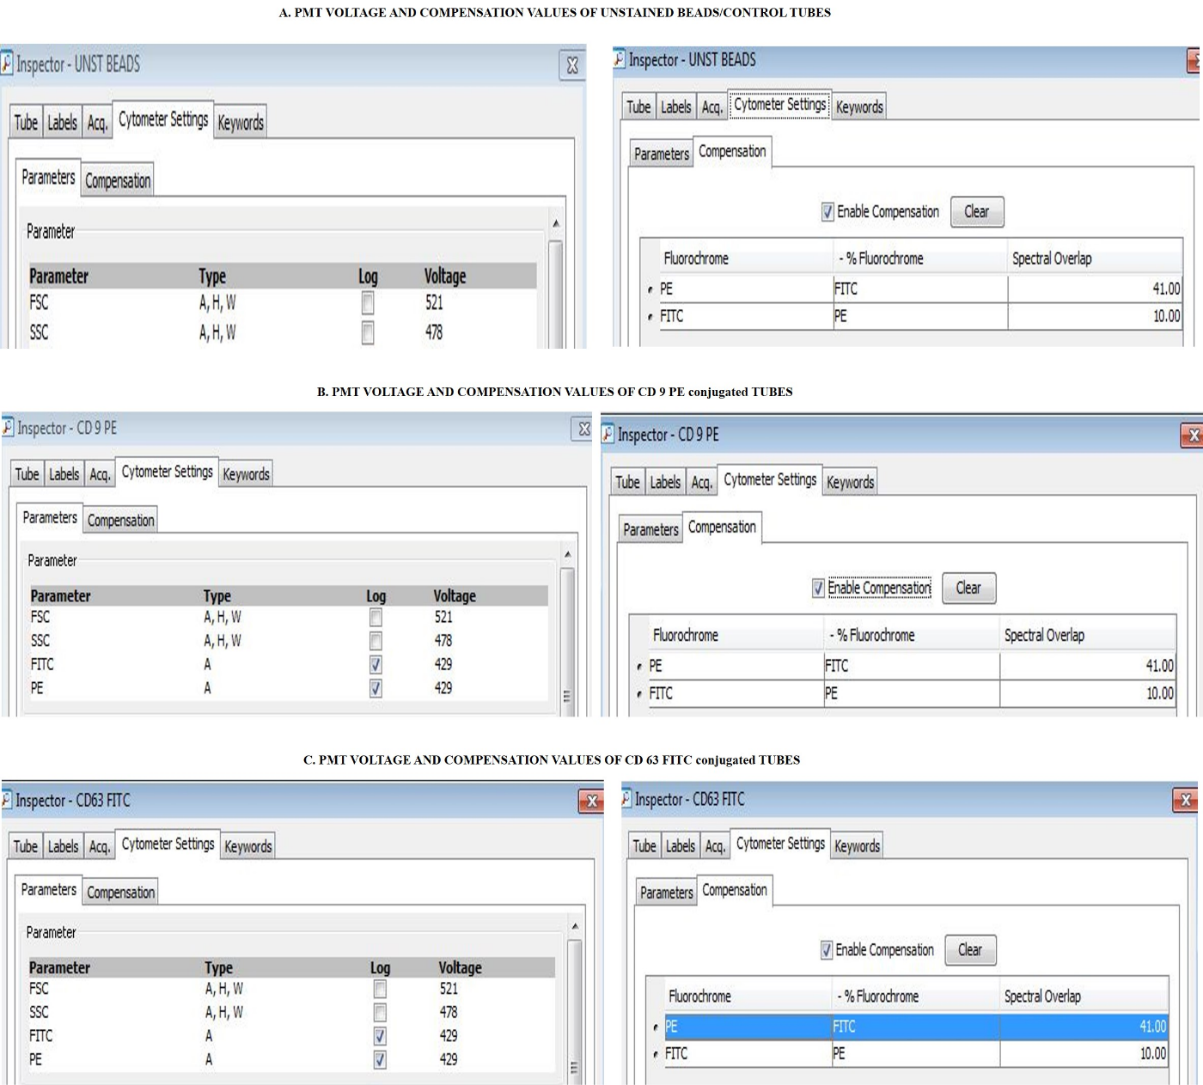
Figure 8. Parameters used for flow cytometry. A. The PMT voltages of FSC and SSC of unstained control tubes are 521 and 478, respectively. The compensation values of PE and FITC are 41.00 and 10.00. B. The PMT voltages of FSC, SSC, FITC, and PE of CD 9-PE tubes used are 521, 478, 429, and 429, respectively. The compensation values of PE and FITC are 41.00 and 10.00. (C) The PMT voltages of FSC, SSC, FITC, and PE of CD 63-PE tubes used are 521, 478, 429, and 429, respectively. The compensation values of PE and FITC are 41.00 and 10.00.Analyze the data using BD FACS DIVA software v.6.1.3 (Figure 9 and Figure 10).
Note: The samples were acquired on the basis of unstained controls (no-antibody control) to gate the positive population of CD 9 and CD 63 extracellular vesicles. Alternatively, a corresponding isotype control specific to the host in which the antibody is raised can also be used.
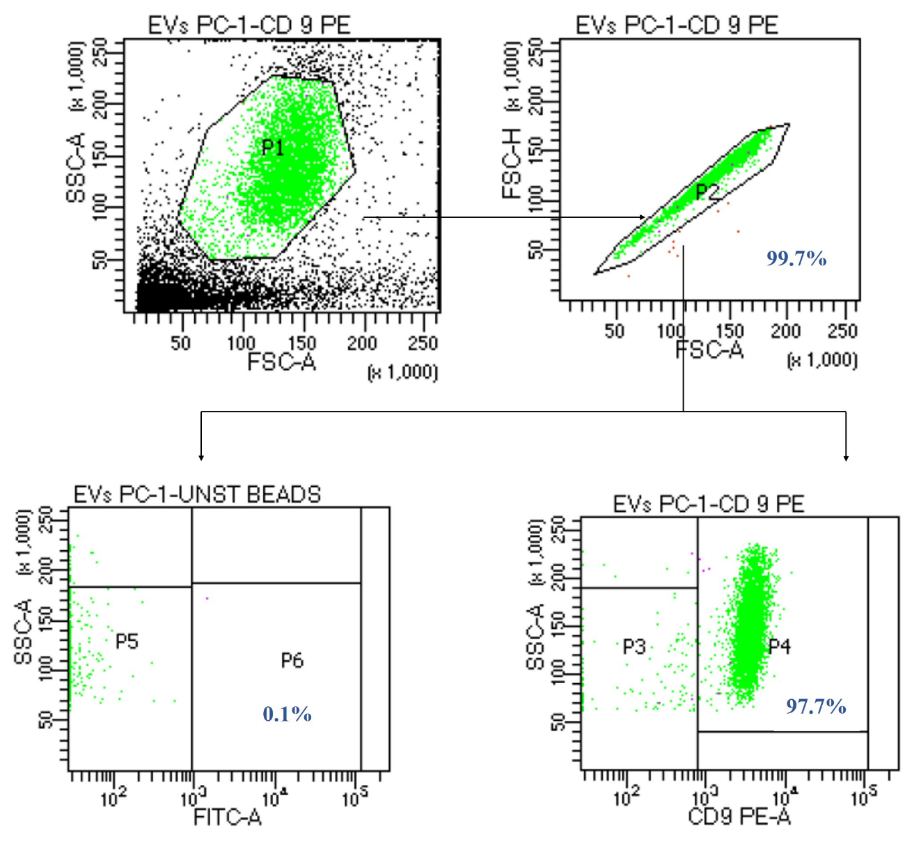
Figure 9. Representative dot plot for the characterization of CD 9+ extracellular vesicles through flow cytometry. The relative percentage of CD 9+ extracellular vesicles is 97.7%, which confirmed the presence of CD 9+ surface marker, a characteristic feature of extracellular vesicles.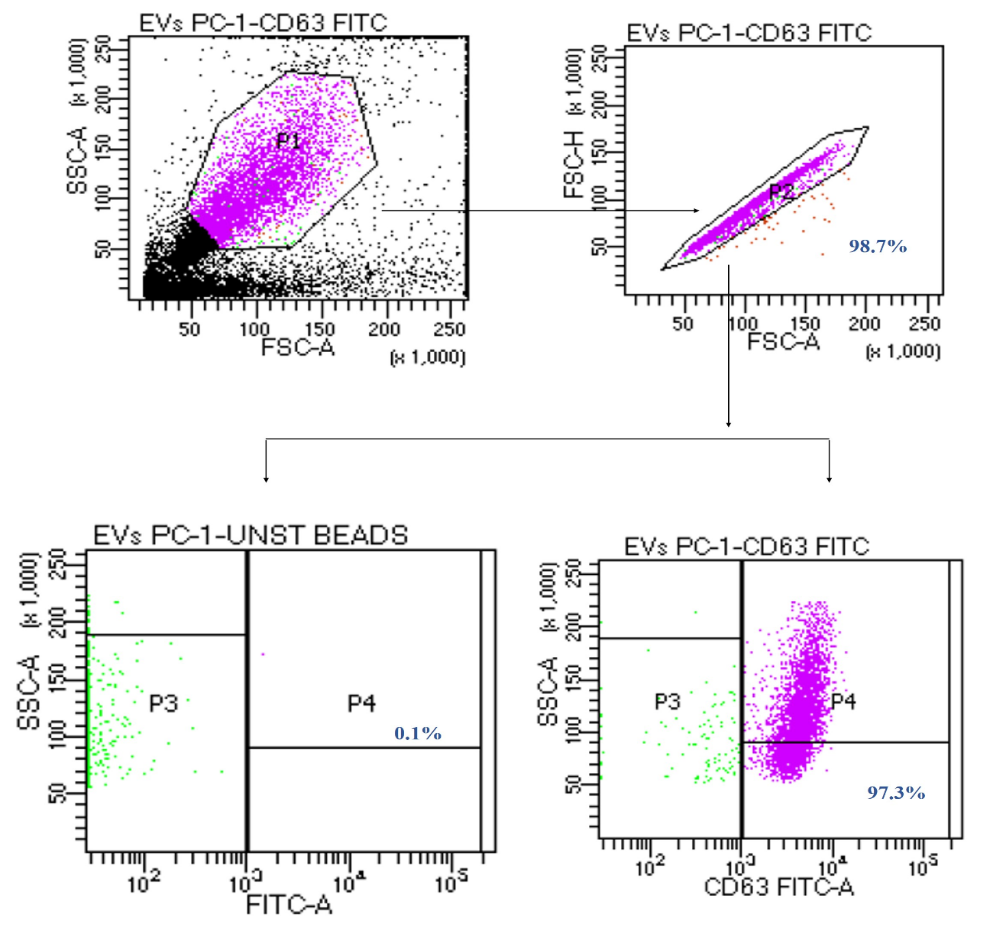
Figure 10. Representative dot plot for the characterization of CD 63+ extracellular vesicles through flow cytometry. The relative percentage of CD 63+ extracellular vesicles is 97.3%, which confirmed the presence of CD 63+ surface marker, a characteristic feature of extracellular vesicles.
Data analysis
All the experiments were performed in triplicates, and appropriate controls were used, as mentioned in the respective sections. The results obtained from the characterization techniques discussed above are as follows:
BCA analysis: The total protein concentration of isolated adipose tissue-derived extracellular vesicles was 1.5 mg/mL and 0.975 mg/mL, as shown in Table 4. The average protein concentration of adipose tissue–derived EVs was 1237.5 ± 131.25 µg/mL.
Dynamic light scattering: The average size of the extracellular vesicles appears to be 99.11 nm, which is in the size range of extracellular vesicles (30–1000 nm). The polydispersity index (PDI) was 0.474, representing the heterogeneous population of extracellular vesicles in the adipose tissue, as shown in Figure 3.
Scanning electron microscopy: The qualitative analysis of isolated extracellular vesicles for the morphological and size evaluation shows a heterogenous population of EVs with a round-shaped morphology and variable size ranging from 30 to 1,000 nm, as shown in Figure 4.
Transmission electron microscopy: Adipose tissue–derived extracellular vesicles showed a morphology similar to round-shaped vesicles enclosed by a membrane, as shown in Figure 5.
Western blot: Qualitative characterization of surface protein markers exclusively present on extracellular vesicles showed remarkable bands of EVs-specific markers (TSG101, CD 63, CD 9, and Flotilin-1), as shown in Figure 8. Also, the samples were negative for calnexin, which is an endoplasmic reticulum marker and is negative for extracellular vesicles. This showed that the isolated vesicles are sorted exclusively during their biogenesis.
Flow cytometry: Quantitative analysis of extracellular vesicles was performed through flow cytometry, and data was analyzed using BD FACS DIVA software v.6.1.3. The relative percentage of extracellular vesicles was determined using unstained beads incubated with EVs sample as a negative control for gating positive population of EVs. The relative percentage of CD 9+ extracellular vesicles was 97.7 % ± 0.2% (Figure 9) and CD 63+ extracellular vesicles were 97.3% ± 0.2% (Figure 10).
Validation of protocol
The experiments performed for characterizing EVs followed the latest MISEV guidelines. The procedure and data analysis section discusses all the datasets that validate this protocol. This protocol is reproducible as all the experiments were performed in triplicates, and appropriate controls were used utilizing simple molecular biology techniques. This protocol is a part of our ongoing doctoral thesis research work entitled “To study the potential of peri-pancreatic adipose tissue-derived exosomes in the progression of pancreatic adenocarcinoma.” This protocol will be duly cited in the upcoming publications from this project.
Some techniques like western blot and dynamic light scattering are already used widely by researchers to characterize EVs. For reference: Mizuta, Y., Akahoshi, T., Guo, J. et al. Exosomes from adipose tissue-derived mesenchymal stem cells ameliorate histone-induced acute lung injury by activating the PI3K/Akt pathway in endothelial cells. Stem Cell Res Ther 11, 508 (2020). https://doi.org/10.1186/s13287-020-02015-9 (Supplementary Figure 1, panel b, c).
General notes and troubleshooting
General notes
General notes for dynamic light scattering
Due to the small size of EVs, they can form aggregates after ultracentrifugation or isolation process. Always dilute the sample and mix gently before subjecting it to size evaluation.
Always clean the cuvette before use and make sure to run a blank of the solvent.
General notes for transmission electron microscopy
Always filter the EVs sample using a 0.45 μM syringe filter and dilute the sample to remove aggregates, as aggregates can provide false morphology and size evaluation.
Use the shiny/dark side of the carbon-coated copper grids for casting the sample.
Troubleshooting tips for Western blot
Problem Possible causes Solutions No signal/faint bands Washing for longer period/ multiple times.
Proteins are not transferred effectively.
Expired reagents due to improper handling and storage.
Not enough exposure time while imaging the blot.
Prevent the removal of detection reagents by washing the membrane gently and not aggressively. Reduce the duration of washing steps.
Reassure protein transfer via Ponceau S staining. Check if the transfer was performed in the right direction (explained in Step 14 of western blotting).
Store the solution at the prescribed temperatures. Prepare a fresh solution, if mentioned. Avoid freeze/thawing.
Increase the time of exposure from 30 s to 1 min.
Faint bands/No signal in the sample lane Protein of interest is not present.
Primary antibody is not enough.
Not enough protein is present.
Primary and secondary antibody is not compatible.
Run a positive control.
Increase the concentration of primary antibody.
The concentration of the protein should be 20–30 μg per lane.
Use the secondary antibody generated against the primary antibody species.
High background Non-specific binding could be the reason.
Not enough washing steps.
Choice of membrane.
Incubation temperature is high.
Primary antibody concentration is too high.
Secondary antibody is binding non-specifically.
Increase the blocking incubation period.
Increase the number of washing steps but do not wash aggressively.
Nitrocellulose membrane show less background and clear bands as compared to PVDF.
Incubate at 4 for a longer duration and RT for a shorter duration.
Optimize the primary antibody dilution.
Use the secondary antibody generated against the primary antibody species.
Multiple bands
At high molecular weight
At low molecular weight
Proteases have digested the protein.
Proteins have disulfide bonds.
Always add protease inhibitor before protein analysis.
Always use reducing agents and boil the samples in Laemmli buffer.
Unusual black dots/ hazy background Blocking reagent has clumped. Always prepare fresh blocking reagent. Mix the reagent thoroughly. It is better to filter the BSA blocking solution before use. Smile effect/uneven bands High voltage.
Gel has been too hot during migration.
Optimize the voltage.
Make sure to cover the gel apparatus on ice or at 4 .
Troubleshooting tips for flow cytometry
Problem Possible causes Solutions Weak fluorescence intensity Signal not compensated correctly.
Insufficient antibody present for detection.
Fluorochrome fluorescence has faded.
Positive single-color control should be set up on the flow cytometer correctly. Gating and compensation should be correct to capture all the events.
Increase antibody concentration.
Use fresh antibody. Always store at cold temperature or as described by the manufacturer.
Increased fluorescence intensity Too high antibody concentration. Reduce the antibody volume to each sample. Ensure adequate washing steps using wash buffers. Two or more populations observed when there should be just one Improper binding of EVs and beads. Ensure proper binding of EVs and beads as per manufacturer instructions before staining with EVs-specific fluorochrome-labeled antibodies. Increase the blocking incubation period.
Acknowledgments
The authors are thankful to all the patients who participated in this study. Author Ankita Arora is grateful to the Department of Biotechnology, New Delhi, India, for providing a research fellowship (DBTHRDPMU/JRF/BET-21/I/2021-22/62) leading to a Ph.D.
Competing interests
The authors declare that they have no competing interests.
Ethical considerations
The study has been approved by the Institutional Ethics Committee (INT/IEC/2023/SPL-287, 21st March, 2023) of the Post Graduate Institute of Medical Education and Research, Chandigarh, India.
References
- Zaborowski, M. P., Balaj, L., Breakefield, X. O. and Lai, C. P. (2015). Extracellular vesicles: composition, biological relevance, and methods of study. Bioscience. 65(8): 783–797. https://doi.org/10.1093/biosci/biv084
- Konoshenko, M. Y., Lekchnov, E. A., Vlassov, A. V. and Laktionov, P. P. (2018). Isolation of extracellular vesicles: general methodologies and latest trends. Biomed Res Int. 2018: 8545347. https://doi.org/10.1155/2018/8545347
- Li, S. R., Man, Q. W., Gao, X., Lin, H., Wang, J., Su, F. C., Wang, H. Q., Bu, L. L., Liu, B. and Chen, G. (2021). Tissue‐derived extracellular vesicles in cancers and non‐cancer diseases: Present and future. J Extracell Vesicles. 10(14): e12175. https://doi.org/10.1002/jev2.12175
- Crescitelli, R., Lässer, C. and Lötvall, J. (2021). Isolation and characterization of extracellular vesicle subpopulations from tissues. Nat. Protoc. 16(3): 1548-1580. https://doi.org/10.1038/s41596-020-00466-1
- Chen, X.-D., Zhao, J., Yan, Z., Zhou, B. W., Huang, W.-F., Liu, W. F., Li, C. and Liu, K.-X. (2020). Isolation of extracellular vesicles from intestinal tissue in a mouse model of intestinal ischemia/reperfusion injury. Biotechniques. 68(5): 257-262. https://doi.org/10.2144/btn-2019-0159
- Guo, M., Wang, J., Zhao, Y., Feng, Y., Han, S., Dong, Q., Cui, M. and Tieu, K. (2020). Microglial exosomes facilitate α-synuclein transmission in Parkinson’s disease. Brain. 143(5): 1476-1497. https://doi.org/10.1093/brain/awaa090
- Leung, L. L., Riaz, M. K., Qu, X., Chan, J. and Meehan, K. (2021). Profiling of extracellular vesicles in oral cancer, from transcriptomics to proteomics. Semin Cancer Biol. 74: 3-23. https://doi.org/10.1016/j.semcancer.2021.01.002
- Jingushi, K., Uemura, M., Ohnishi, N., Nakata, W., Fujita, K., Naito, T., Fujii, R., Saichi, N., Nonomura, N. and Tsujikawa, K. (2018). Extracellular vesicles isolated from human renal cell carcinoma tissues disrupt vascular endothelial cell morphology via azurocidin. Int J Cancer. 142(3): 607-617. https://doi.org/10.1002/ijc.31080
- Huang, Z. and Xu, A. (2021). Adipose extracellular vesicles in intercellular and inter-organ crosstalk in metabolic health and diseases. Front Immunol. 12: 608680. https://doi.org/10.3389/fimmu.2021.608680
- Camino, T., Lago-Baameiro, N., Martis-Sueiro, A., Couto, I., Santos, F., Baltar, J. and Pardo, M. (2020). Deciphering adipose tissue extracellular vesicles protein cargo and its role in obesity. Int J Mol Sci. 21(24): 9366. https://doi.org/10.3390/ijms21249366
- Moraes, J. A., Encarnação, C., Franco, V. A., Xavier Botelho, L. G., Rodrigues, G. P., Ramos-Andrade, I., Barja-Fidalgo, C. and Renovato-Martins, M. (2021). Adipose tissue-derived extracellular vesicles and the tumor microenvironment: revisiting the hallmarks of cancer. Cancers 13(13): 3328. https://doi.org/10.3390/cancers13133328
Article Information
Copyright
© 2024 The Author(s); This is an open access article under the CC BY-NC license (https://creativecommons.org/licenses/by-nc/4.0/).
How to cite
Arora, A., Sharma, V., Gupta, R. and Aggarwal, A. (2024). Isolation and Characterization of Extracellular Vesicles Derived from Ex Vivo Culture of Visceral Adipose Tissue. Bio-protocol 14(11): e5011. DOI: 10.21769/BioProtoc.5011.
Category
Cell Biology > Organelle isolation > Extracellular vesicle
Cell Biology > Cell-based analysis > Flow cytometry
Do you have any questions about this protocol?
Post your question to gather feedback from the community. We will also invite the authors of this article to respond.