- Protocols

- Articles and Issues
- For Authors
- About
- Become a Reviewer

A Multi-Color Immunofluorescence Assay to Distinguish Intracellular From External Leishmania Parasites
Published: Vol 14, Iss 11, Jun 5, 2024 DOI: 10.21769/BioProtoc.5009 Views: 1826
Reviewed by: Chiara AmbrogioRamu KakumanuAnonymous reviewer(s)
Original research article
The authors used this protocol in:
Jun 2023
Advertisement

Protocol Collections
Comprehensive collections of detailed, peer-reviewed protocols focusing on specific topics


Abstract
Leishmaniasis, a neglected tropical disease, is caused by the intracellular protozoan parasite Leishmania. Upon its transmission through a sandfly bite, Leishmania binds and enters host phagocytic cells, ultimately resulting in a cutaneous or visceral form of the disease. The limited therapeutics available for leishmaniasis, in combination with this parasite’s techniques to evade the host immune system, call for exploring various methods to target this infection. To this end, our laboratory has been characterizing how Leishmania is internalized by phagocytic cells through the activation of multiple host cell signaling pathways. This protocol, which we use routinely for our experiments, delineates how to infect mammalian macrophages with either promastigote or amastigote forms of the Leishmania parasite. Subsequently, the number of intracellular parasites, external parasites, and macrophages can be quantified using immunofluorescence microscopy and semi-automated analysis protocols. Studying the pathways that underlie Leishmania uptake by phagocytes will not only improve our understanding of these host–pathogen interactions but may also provide a foundation for discovering additional treatments for leishmaniasis.
Key features
• This protocol visualizes and quantifies multiple intracellular forms of Leishmania.
• It offers flexibility at various points for researchers to introduce modifications according to their study needs.
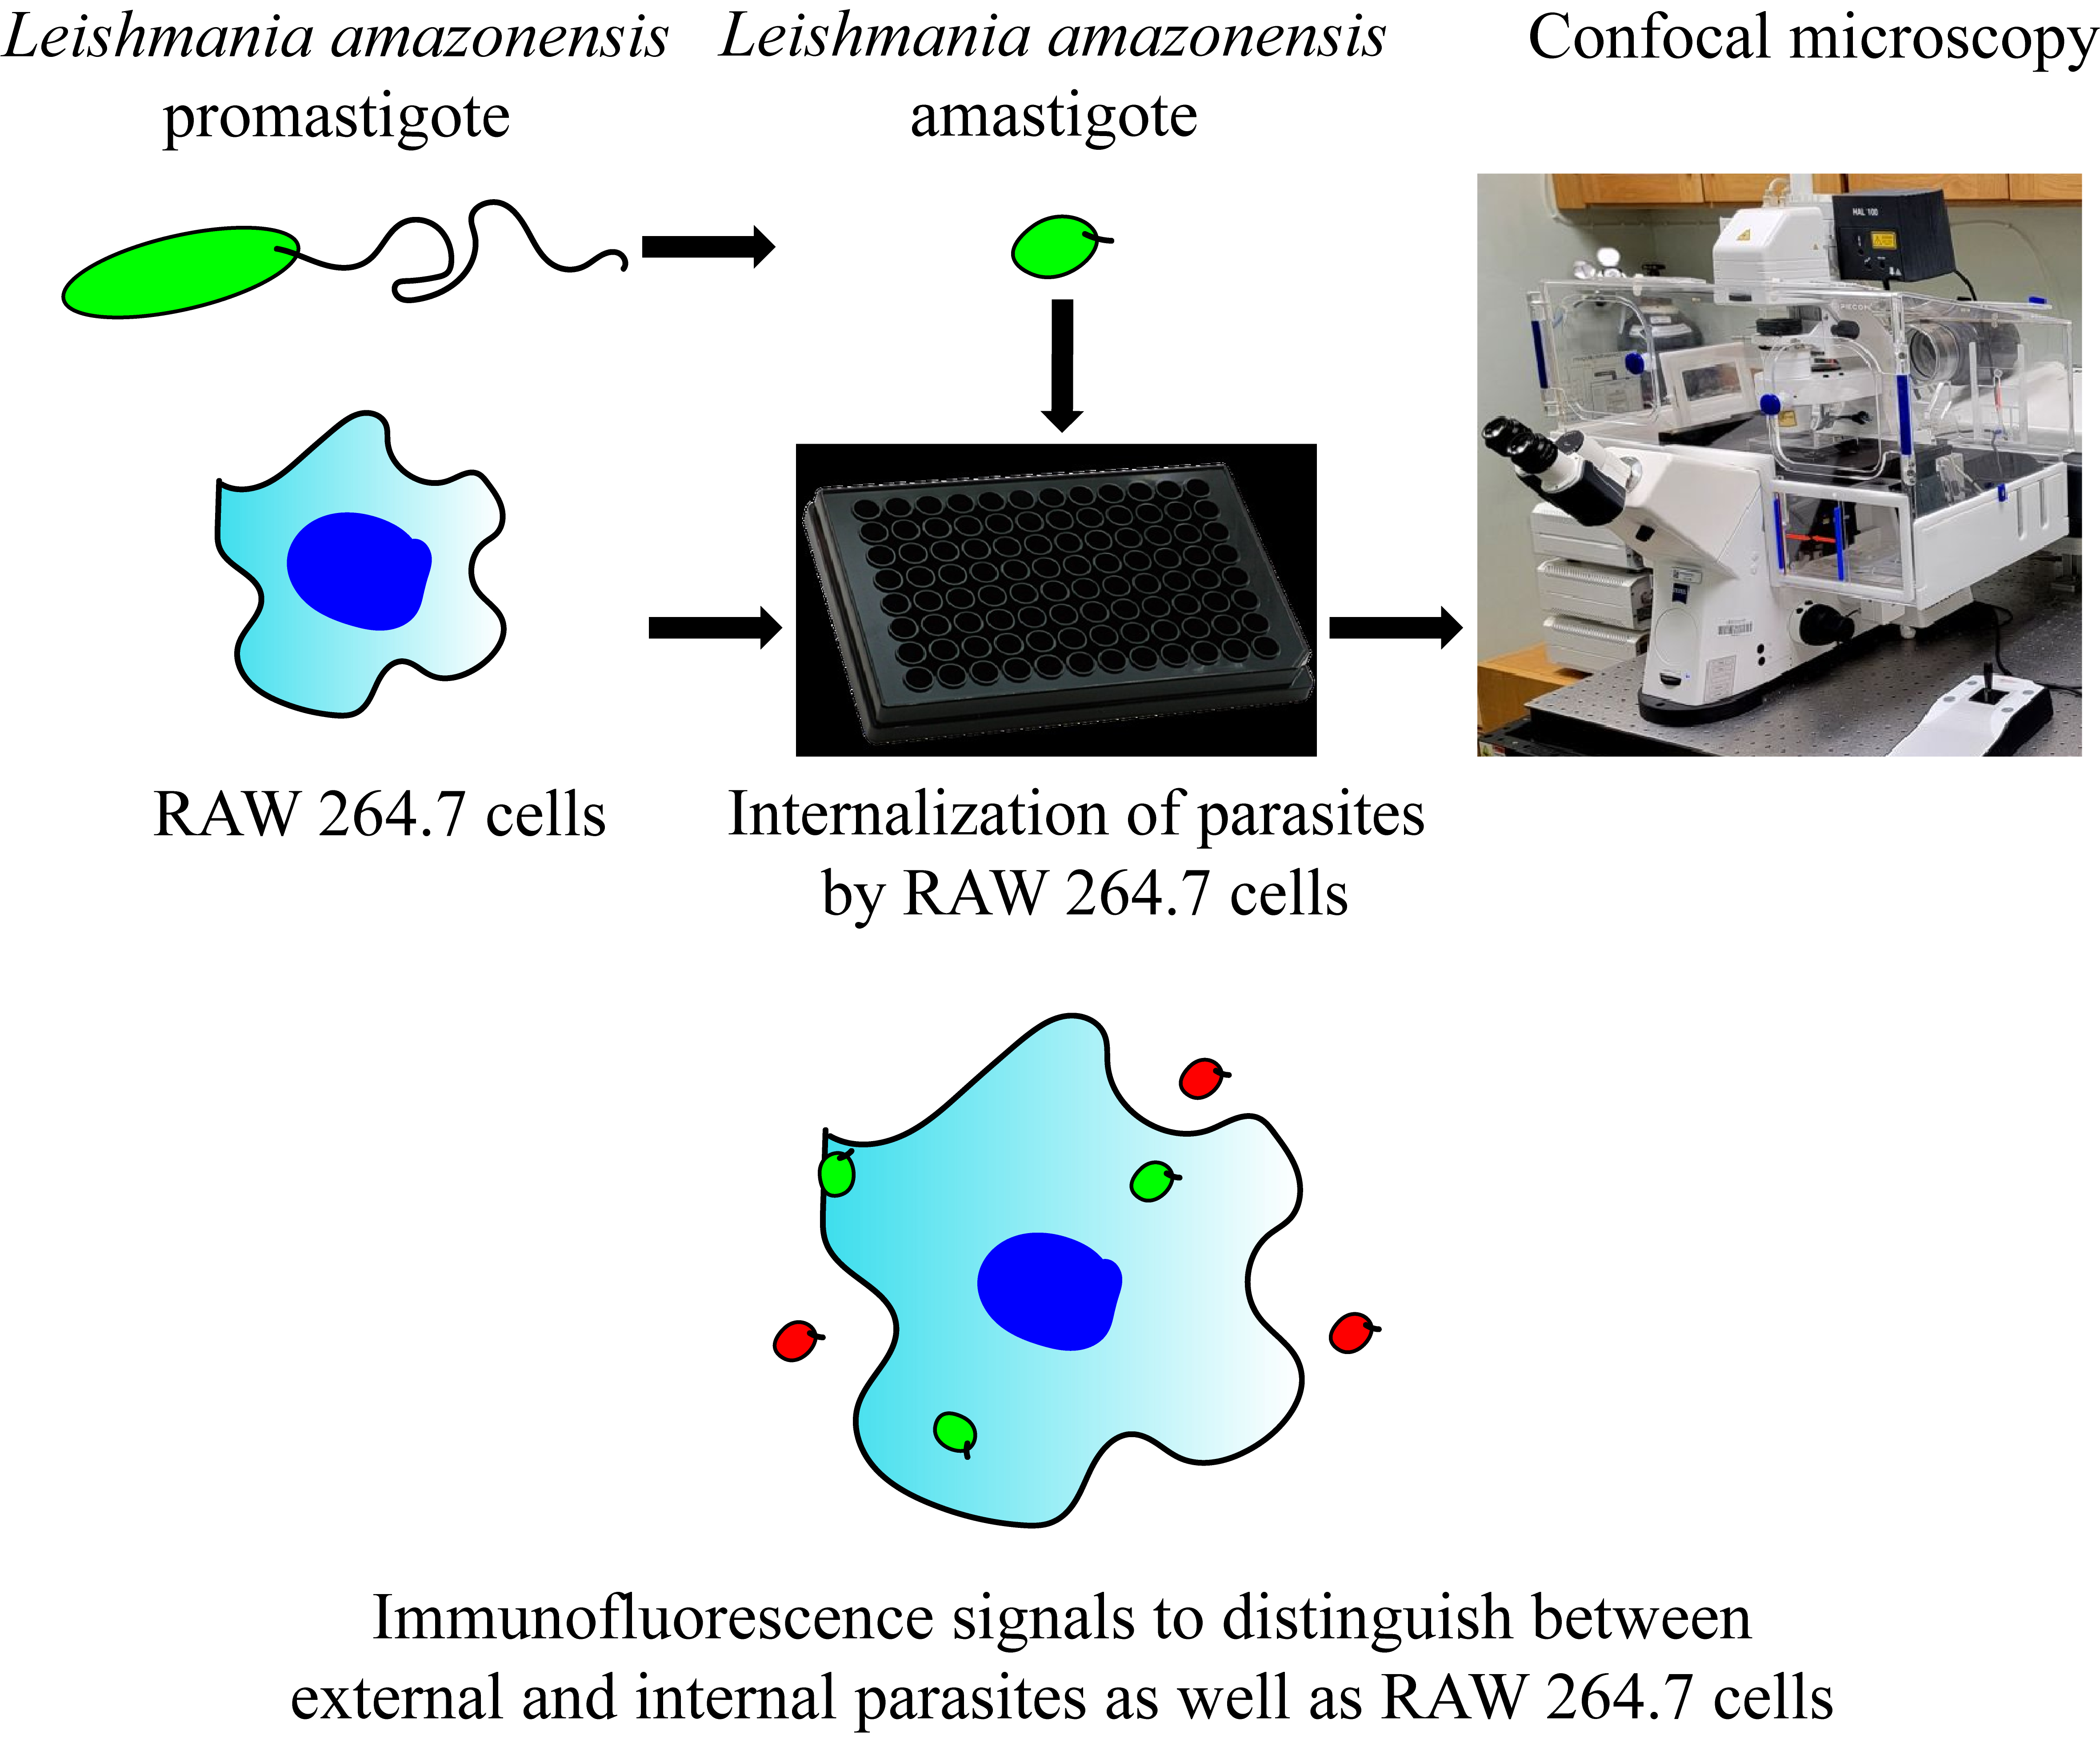
Keywords: LeishmaniaGraphical overview
Background
Leishmaniasis wreaks havoc in a population of approximately 2 million annually across 90 endemic countries, being caused by < 20 different species of the parasite Leishmania [1]. Depending on the infective species and host immune system function, the resulting pathology can include cutaneous, mucocutaneous, or visceral disease. A need for new, effective drugs is demonstrated by the inadequacies of existing treatments since current drugs for leishmaniasis suffer serious limitations such as poor efficacy, toxicity, and resistance [2,3].
In their sand fly vector, Leishmania exist as free, motile promastigotes with an elongated cell shape as well as a long flagellum. After transmission into the mammalian host, they multiply, undergo transformation, and subsequently survive as intracellular amastigotes in the phagolysosomal compartment of macrophages (MΦ) and other phagocytes [4]. Amastigotes exhibit significantly lower cell surface-to-volume ratio, and the flagellum is reduced to a tiny distended tip [5]. Although both forms are capable of infecting mammalian cells, only amastigotes can spread and eventually sustain the infection in the host [6,7]. Conversely, for many (although not all) Leishmania species, only promastigotes can be cultured without mammalian cells (axenically). As such, although the process of Leishmania uptake by human MΦ has been studied using confocal microscopy, the relative intractability of amastigotes for most species has resulted in a predominant focus on promastigotes, which in turn overlooks many of the intricacies involved in Leishmania’s interactions with host MΦ [8]. Since the host cell’s response to promastigotes and amastigotes varies significantly, a more comprehensive understanding of the entire life cycle is required for effective pathogenesis studies and drug discovery strategies.
Here, we provide a multi-color immunofluorescence protocol for studying the uptake of Leishmania by MΦ with microscopy. This protocol has been adapted from a number of prior studies in the parasitology field. However, in combination with various culture techniques, our protocol, encompassing both promastigotes and amastigotes in the experimental setup, has further expanded approaches to studies characterizing host–pathogen interactions. Furthermore, our protocol allows many ways in which it can be adapted to the situation at hand, including characterization of higher-order subcellular structures during parasite internalization or high-throughput screening and analysis for drug discovery. Our expanded methodology provides a foundation for a better understanding of the pathogenesis of leishmaniasis and the development of more efficacious and targeted therapeutic interventions.
Materials and reagents
Biological materials
RAW 264.7 cells (ATCC, catalog number: TIB-71)
.Leishmania (L.) amazonensis promastigotes (strain IFLA/BR/67/PH8) (Norma W. Andrews, University of Maryland, College Park, MD)
L. amazonensis-mNeon, expressing bright monomeric green fluorescent protein, mNeonGreen [9]
Reagents
Dulbecco’s modified Eagle’s medium (DMEM), with 4500 mg/L glucose, L-glutamine, sodium pyruvate, and sodium bicarbonate (Sigma-Aldrich, catalog number: D6429), store at 4 °C
Benchmark fetal bovine serum (FBS), heat inactivated (GeminiBio, catalog number: 100-106-500-HI), store at -20 °C
Penicillin/streptomycin solution (GeminiBio, catalog number: 400-109-100), store at -20 °C
Hygromycin B solution (50 mg/mL) (GeminiBio, catalog number: 400-123-020), store at 4 °C
Schneider’s Drosophila medium (Sigma-Aldrich, catalog number: S9895), store at 4 °C
Hemin (Sigma-Aldrich, catalog number: H9039), store at 4 °C
Sodium hydroxide solution, 10 M in water (Sigma-Aldrich, catalog number: 72068)
Phosphate buffered saline (PBS), pH 7.4, liquid, sterile-filtered, suitable for cell culture (Sigma-Aldrich, catalog number: 806552), store at 4 °C
Formaldehyde, 37% in water (Sigma-Aldrich, catalog number: F1635)
Bovine serum albumin (BSA) (Sigma-Aldrich, catalog number A7906), store at 4 °C
Triton X-100, molecular biology grade (Sigma-Aldrich, catalog number: T8787)
Mouse anti-p8 antibody, generated from hybridoma cell line generously donated from McMahon-Pratt laboratory, Yale University; available upon request, store at -20 °C
Anti-mouse IgG (H+L), F(ab')2 fragment, CF-488A-conjugate antibody produced in goat (Sigma-Aldrich, catalog number: SAB4600388), store at -20 °C
Anti-mouse IgG (H+L), highly cross-adsorbed, CF-568-conjugate antibody produced in donkey (Sigma-Aldrich, catalog number: SAB4600075), store at -20 °C
Hoechst 33342 solution, 20 mM (Thermo Fisher, catalog number: 62249), store at 4 °C
Alexa FluorTM 647 Phalloidin (Thermo Fisher, catalog number: A22287), store at -20 °C
Solutions
Complete RAW 264.7 cell media (see Recipes)
50 mM sodium hydroxide (see Recipes)
Hemin solution (see Recipes)
Complete promastigote media (see Recipes)
Complete amastigote media (see Recipes)
Fixing solution (see Recipes)
Blocking solution (see Recipes)
Permeabilization solution (see Recipes)
Recipes
Complete RAW 264.7 cell media, final pH 7.4 (4 °C storage)
Reagent Final concentration Quantity DMEM n/a 440 mL FBS 10% 50 mL Penicillin/streptomycin solution 1× 5 mL Hygromycin 1× 5 mL Total n/a 500 mL 50 mM sodium hydroxide
Reagent Final concentration Quantity 10 M sodium hydroxide 50 mM 0.5 mL Water n/a 99.5 mL Total n/a 100 mL Hemin solution (4 °C storage)
Reagent Final concentration Quantity Hemin 2.5 mg/mL 25 mg 50 mM sodium hydroxide n/a 10 mL Total n/a 10 mL Complete promastigote media, final pH 7.4 (4 °C storage)
Reagent Final concentration Quantity Schneider’s Drosophila medium n/a 835 mL FBS 15% 150 mL Penicillin/streptomycin solution 10% 10 mL Hygromycin 1× 5 mL Total n/a 1000 mL Complete amastigote media, final pH 5.4 (4 °C storage)
Reagent Final concentration Quantity Schneider’s Drosophila medium n/a 785 mL FBS 20% 200 mL Penicillin/streptomycin solution 1× 10 mL Hemin solution (Recipe 3) 0.5% 5 mL Total n/a 1,000 mL Adjust final pH to 5.4.
Fixing solution (-20 °C storage)
Reagent Final concentration Quantity Formaldehyde, 37% in water 4% 5 mL 1× PBS n/a 45 mL Total n/a 50 mL Blocking solution (4 °C storage)
Reagent Final concentration Quantity BSA 5% 2.5 g 1× PBS n/a 50 mL Total n/a 50 mL Permeabilization solution
Reagent Final concentration Quantity Triton X-100 5% 0.5 mL Blocking solution n/a 9.5 mL Total n/a 10 mL
Laboratory supplies
Sterile 15 mL polypropylene centrifuge tubes (any vendor)
Sterile 50 mL polypropylene centrifuge tubes (any vendor)
Nalgene rapid-flow sterile disposable filter units 1 L (Thermo Scientific, catalog number: 5670020)
Sterile nuclease-free filter tips (10, 200, and 1,000 μL) (any vendor)
Vented flask surface area 25 cm2 (any vendor)
Sterile cell culture dish, 100 mm (Greiner Bio-One, catalog number: 664160)
Sterile cell scraper (Falcon, catalog number: 353089)
PhenoPlate 96-well, black, optically clear flat-bottom, tissue-culture treated microplate (PerkinElmer, catalog number: 6055300)
Disposable plastic serological pipettes, sterile, individually wrapped, 5 mL, 10 mL, 25 mL capacity (any vendor)
Hemocytometer (Hausser Scientific, catalog number: 3200)
Microcentrifuge 1.7 mL tubes (Corning, Axygen®, catalog number: MCT-175-C-S)
Bleach (Clorox)
50 mL reagent reservoir (Corning, catalog number: 4870)
PoseidonTM 12 channel pipettor P200, adjustable volume, 20–200 µL (Genesee Scientific, catalog number: 33-GSC-12P200)
Plastic container for waste collection, 1 L size (any vendor)
Equipment
Centrifuge 5810R (Eppendorf, catalog number: 022628187)
Inverted confocal microscope (Zeiss, model: LSM 800)
Software and datasets
Zen 2.3 SP1 FP3 (black) 64-bit (Carl Zeiss), licensed
GraphPad Prism Version 10.1.2 (324), licensed
ImageJ 1.53t (NIH, https://imagej.net/ij/download.html)
Microsoft Excel 2016 (16.0.5422.1000) MSO 32-bit, licensed
Adobe Illustrator 28.1 64-bit, licensed
Procedure
Preparation of amastigotes from promastigotes
Filter-sterilize both complete promastigote media (see Recipes) and complete amastigote media (see Recipes) using the Nalgene rapid-flow sterile disposable filter units prior to any cell culture.
Culture L. amazonensis promastigotes in 10 mL of complete promastigote media in vented 25 cm2 tissue culture flasks in an incubator at 26 °C for a week.
Caution: The incubator containing the culture should not contain any fungal cells or bacteria to avoid potential cross-contamination issues. Regular cleaning of the incubator (at least once every two weeks) is recommended. All species of Leishmania that can infect humans are Biosafety Level 2 organisms and appropriate precautions should be taken in this regard.
Remove 5 mL of confluent L. amazonensis promastigotes from the flask and add 5 mL of complete amastigote media to the same flask. Keep in an incubator at 32 °C overnight with 5% CO2.
Without discarding the flask, pipette 10 mL of this mixed culture into a sterile 15 mL tube and spin in a centrifuge at 3,000× g for 5 min at room temperature. Discard the supernatant into a container with 10% bleach. Carefully resuspend the parasite cell pellet in 10 mL of complete amastigote media in the same flask and keep in the incubator at 32 °C with 5% CO2 for five days to grow healthy amastigote cells.
Simultaneous preparation of RAW 264.7 cells
Filter-sterilize complete RAW 264.7 cell media (see Recipes) using the Nalgene rapid-flow sterile disposable filter unit prior to any cell culture.
Place 10 mL of complete RAW 264.7 cell media with RAW 264.7 cells in a new 100 mm cell culture dish for 3–4 days.
At ~50% confluency, discard the media using a pipette into a bleach container and rinse carefully with 5 mL of sterile PBS. Pipette 5 mL of fresh DMEM media without serum into the plate. Carefully scrape the base of the plate until the cells are off the base, resuspend, and pipette them into a sterile 15 mL tube prior to infection.
Set up infection plate
Using a 1.7 mL microcentrifuge tube, prepare 100 µL of 1:5 cell dilution from the 5 mL culture of RAW 264.7 cells from section B, and use 10 µL on hemocytometer for cell counting.
Prepare a suspension of ~50,000 cells per milliliter in 10 mL of DMEM media without serum and pipette the suspension into a 50 mL reagent reservoir (see note after section D for important considerations).
Using a 12-channel pipettor, pipette 100 µL of cell suspension in each well of a microscopy-grade, black, optically clear flat-bottom, tissue-culture treated, 96-well microplate (coverslips can also be used).
(Optional) Carefully transfer the microplate into a plate adapter before placing in the centrifuge and spin at 500× g for 1 min at room temperature to ensure the settling of the cells at the base of the wells.
Place plate in an incubator at 37 °C overnight with CO2.
Set up internalization
Next morning (~12–18 h after section C), carefully pipette out 10 mL of amastigotes from step A4 into a 15 mL tube and centrifuge at 3,000× g for 5 min at room temperature to remove any trace of complete amastigote media. Discard the supernatant into a container with 10% bleach. Carefully resuspend cell pellet in 10 mL of complete RAW 264.7 cell media in a new 15 mL tube. Repeat two times.
Using a 1.7 mL microcentrifuge tube, prepare 1,000 µL of 1:100 cell dilution from this culture. Subsequently, use 10 µL of this cell dilution on hemocytometer for cell counting.
Calculate and prepare a suspension of 106 amastigotes per milliliter in 10 mL of complete RAW 264.7 cell media and pipette the suspension into a 50 mL reagent reservoir. Using a 12-channel pipettor, pipette 100 µL of amastigote suspension to the existing 100 µL of RAW 264.7 cells in each well of the microscopy grade 96-well plate set up in step C3 (see note below for important considerations at this step).
Carefully transfer the microplate into a plate adapter before placing in the centrifuge and spin at 500× g for 1 minute at room temperature to ensure that parasites settle at the base of the wells.
Incubate at 37 °C with 5% CO2 for 30 min to 2 h (see note below).
Fixing
Thaw the fixing solution (see Recipes) at 4 °C.
Pour 50 mL of PBS in a reagent reservoir.
Pour 50 mL of fixing solution in a reagent reservoir.
Take the plate out and carefully pipette out the 200 µL of media from each well into a bleach container.
Using the 12-channel pipettor, pipette 50 µL of PBS in each well of the microplate and carefully aspirate it out into the bleach container, ensuring that no damage is inflicted on the cells. This also ensures removal of excess uninternalized parasites.
Using the 12-channel pipettor, pipette 100 µL of fixing solution in each well of the microplate and incubate at room temperature for 15 min.
Aspirate the fixing solution from each well into the bleach container.
Wash the wells of microplate three times with 50 µL of PBS.
Pause point: After fixing, you can add 50 µL of PBS in each well of the microplate and it can be stored at 4 °C, ideally for a maximum of 48 h, before proceeding with the next steps.
Immunolabeling for external parasites
Using the 12-channel pipettor, pipette 100 µL of blocking solution in each well of the microplate and incubate at room temperature for 30 min.
Aspirate the blocking solution from each well into the bleach container.
Incubate for 45 min with mouse anti-p8 primary antibody diluted at 1:100 in PBS.
Wash each well three times with PBS.
Incubate for 45 min with anti-mouse IgG (H+L), highly cross-adsorbed, CF-568-conjugate antibody diluted to 1:1,000 in PBS.
Wash each well three times with PBS.
Immunolabeling for internalized parasites
Pour 10 mL of permeabilizing solution in a reagent reservoir.
Aspirate PBS from each well of microplate from section F into the bleach container.
Using the 12-channel pipettor, pipette 50 µL of permeabilizing solution in each well of the microplate and incubate at room temperature for 20 min.
Aspirate the permeabilizing solution from each well into the bleach container.
Wash each well three times with PBS.
Incubate for 45 min with mouse anti-p8 primary antibody diluted to 1:100 in PBS.
Wash each well three times with PBS.
Incubate for 45 min with anti-mouse IgG (H+L), F(ab')2 fragment, CF-488A-conjugate antibody diluted to 1:1,000 in PBS.
Wash each well three times with PBS.
Caution: The cell membrane of RAW 264.7 cells acts as a natural barrier during the antibody labeling steps. Following the outlined sequence of first labeling the external parasites, permeabilization, and finally antibody-labeling all parasites is critical to avoid any anomalous labeling of parasites.
Nuclei staining
Add 50 µL of Hoechst 33258 solution to 50 mL of PBS and mix thoroughly in a 50 mL sterile tube.
Pour the contents into a 50 mL reagent reservoir.
Aspirate PBS from each well of microplate from section F into the bleach container.
Using the 12-channel pipettor, pipette 100 µL of the Hoechst 33258–PBS mix in each well of the microplate and prepare for microscopy.
Confocal microscopy
Locate the RAW 264.7 cells by adjusting the height, using a low-magnification objective on brightfield setting.
Using Zen 2.3 SP1 FP3 (black) 64-bit software, switch to a 63× oil immersion objective lens (Plan-Apochromat 63×/1.4 Oil DIC M27) and select an imaging area that contains multiple distinguishable RAW 264.7 cells.
Set up fluorescence through three separate channels using the settings outlined in Table 1.
Note: The settings can be saved by the user for future use. However, the values may need adjustment depending on laser conditions, microscope type, and fluorescence signal intensity.
Table 1. Parameters set for confocal microscopy
Parameters External parasites (red) Internalized parasites (green) Nuclei (blue) Contrast method Fluorescence Fluorescence Fluorescence Excitation wavelength (ex.) 561 nm 488 nm 405 nm Emission wavelength (em.) 588 nm 521 nm 432 nm Pinhole 0.68 AU 0.59 AU 0.78 AU Scan mode Frame Frame Frame Scan zoom 1.0 1.0 1.0 Rotation 0° 0° 0° Pixel time 2.05 µs 2.05 µs 2.05 µs Line time 30.00 µs 30.00 µs 30.00 µs Frame time 15.10 s 15.10 s 15.10 s Scan direction Unidirectional Unidirectional Unidirectional Averaging 16 16 16 For imaging, proceed with the settings from Table 2.
Note: Imaging may be optimized by adjusting the laser power, gain, and offset, and saturated pixels (if any) can be eliminated by reducing laser power.
Table 2. Parameters set for imaging
Parameters Values Image size 1,024 × 1,024 pixels Speed 8 Averaging 4 lines Bit depth 16 Pixel size 0.1 μm × 0.1 μm × 1 μm Z-stack 5 slice (4 μm) Scan to generate the representative image(s). See Figure 1 for a sample image.
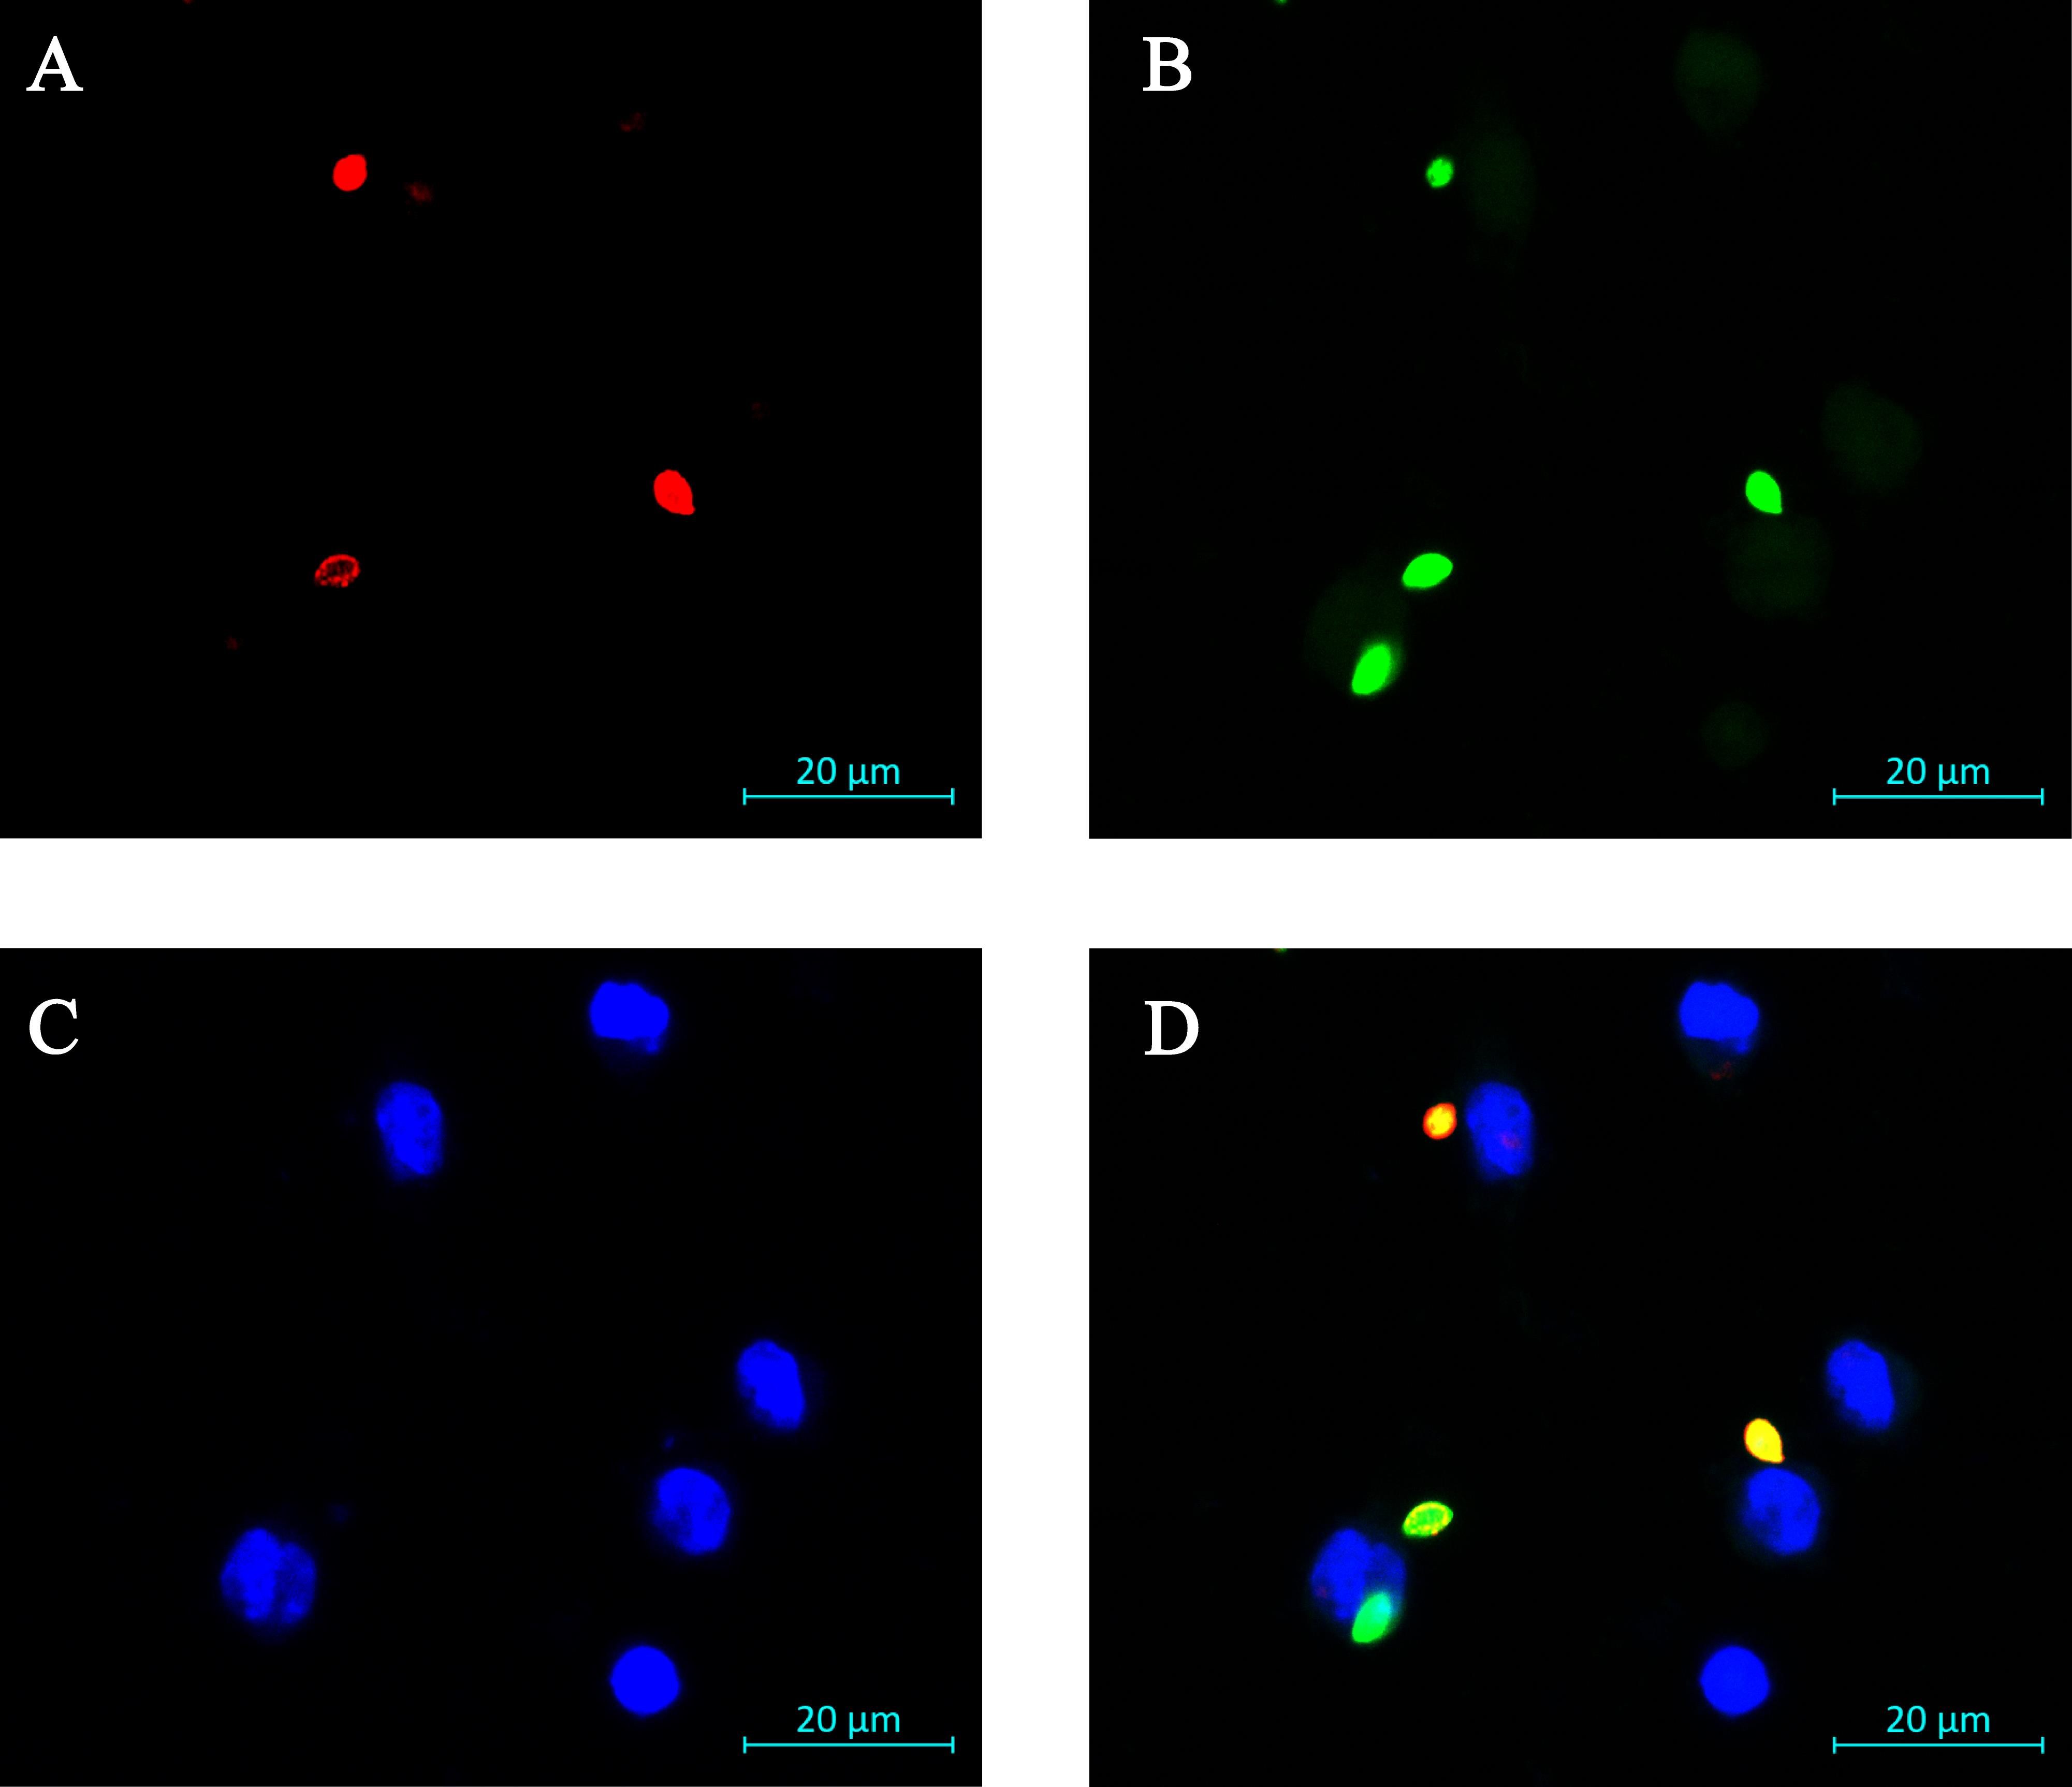
Figure 1. Representative image of immunofluorescence assay for amastigote uptake by RAW 264.7 cells. A. External parasites labeled red. In this image, two extracellular Leishmania amastigotes and one partly internalized amastigote can be seen. B. All parasites are labeled green. In this image, four total Leishmania amastigotes are visualized. Faint autofluorescence of RAW 264.7 cells can be seen in the green channel, but its intensity is well below that of the labeled parasites, and the mammalian cells are also a different size than the parasites. C. RAW 264.7 cell nuclei labeled blue with Hoechst 33342. In this image, one can see six MΦ nuclei. D. Overlay of the three images. The fully internalized amastigote is green. The two external amastigotes are both green and red (orange in the merged image). The amastigote that is in the process of being taken up by the macrophage is orange (extracellular) on the right side and green (intracellular) on the left lower side. Scale bar represents 20 μm.Data analysis
Using Zen 2.3 SP1 FP3 (black) 64-bit software, open the representative image and go to the Split tab for isolating the individual channels showing the three separate colors and the overlay.
Tabulate the content of each channel into GraphPad Prism and perform the following calculations:
Total parasites = internalized green + external red parasites
Phagocytic index (%) = (internalized green parasites/blue RAW 264.7 cell nuclei) × 100
Adhesion index (%) = (total parasites/blue RAW 264.7 cell nuclei) × 100
Variations
Immunostaining of cells in the wells involves multiple washes and exposure to multiple antibodies, which may lead to loss of quantifiable cell-parasite population after fixing, thereby introducing potential errors. A stable clone of L. amazonensis expressing bright monomeric green fluorescent protein, mNeonGreen, can be used, which eliminates the need for section G (Immunolabeling for internalized parasites). The parasites remain fluorescent even after they have been internalized by MΦ.
For experiments involving drug treatments on either parasites or RAW 264.7 cells, one can add requisite drug volumes into the media during section D (Set up internalization). The phagocytic indices of the untreated internalizations can be compared with the drug-treated groups, generating a quantitative analysis. Relevant statistical analysis can be further pursued through GraphPad Prism.
In the absence of confocal microscopy, visualization of multi-color immunofluorescence may be performed using alternative instruments, e.g., an epifluorescence microscope or more high-throughput approaches such as a BioTek Cytation 5 (Agilent) or the InCell 6000 (GE Healthcare). The BioTek Cytation 5 machine has emerged in our lab as a viable alternative for visualizing multi-color immunofluorescence, offering distinct advantages and features. One primary advantage lies in its ability to accurately visualize fluorescence signals, provided that the excitation and emission wavelengths of individual channels are precisely configured. A notable strength of the BioTek Cytation 5 is its capacity for automated analysis, streamlining the labor-intensive process of quantifying immunofluorescent signals. Researchers can establish specific signal intensity and size thresholds, enabling the machine to automatically calculate critical parameters such as the number of external and internalized parasites and the quantification of RAW 264.7 cell nuclei. Furthermore, the BioTek Cytation 5 allows users to save conditions or template protocols for data analyses, facilitating consistency across experiments and enabling seamless replication of methodologies.
Caution: Despite its merits, the BioTek Cytation 5 also has its limitations. Factors such as the need for accurate configuration of excitation and emission wavelengths, magnification limits, and potential variations in signal intensities may impact the precision of results. Additionally, the machine’s capabilities may be influenced by the quality and specificity of the antibodies used in the immunofluorescence assays. Users should compare the automated analyses with representative images at all relevant times.
We have also visualized the process of internalization between various treatment groups through labeling of phagocytic cups by labeling with Alexa FluorTM 647 phalloidin (1:1,000) in step G8 alongside the secondary antibody for the internalized parasites. Subsequently, we add a fourth channel on the confocal microscope, setting the following wavelengths: ex. 633 nm., em. 669 nm. We typically observe the actin filaments in the color white (Figure 2). Fluorescence intensity of the phagocytic cups is quantified in ImageJ through the following workflow:
Identify phagocytic cup area on the channel for actin.
Create region of interest (ROI) around it using polygon selection tool in ImageJ.
Open ROI Manager (Analyze > Tools > ROI Manager).
Add to list (can also tap t on keyboard).
Measure all ROIs.
Export to Microsoft Excel.
Calculate mean fluorescence intensity or size.
Compare the data between treatment groups and perform statistical analyses on GraphPad Prism.
Note: As an alternative to ImageJ, Adobe Illustrator can be used for creating ROI for phagocytic cups and measuring fluorescence intensity.
- WHO. (2023). Retrieved from https://www.who.int/news-room/fact-sheets/detail/leishmaniasis.
- Dorlo, T. P. C., Rijal, S., Ostyn, B., de Vries, P. J., Singh, R., Bhattarai, N., Uranw, S., Dujardin, J. C., Boelaert, M., Beijnen, J. H., et al. (2014). Failure of miltefosine in visceral leishmaniasis is associated with low drug exposure. J Infect Dis. 210(1): 146–153.
- Mohapatra, S. (2014). Drug resistance in leishmaniasis: Newer developments. Trop Parasitol. 4(1): 4–9.
- Handman, E. (1999). Cell biology of Leishmania. In: Baker, J. R., Muller, R. and Rollinson, D. (Eds.). Advances in Parasitology (Vol. 44, pp. 1–39): Academic Press.
- Sunter, J. and Gull, K. (2017). Shape, form, function and Leishmania pathogenicity: from textbook descriptions to biological understanding. Open Biol. 7(9): 170165.
- Mandell, M. A. and Beverley, S. M. (2017). Continual renewal and replication of persistent Leishmania major parasites in concomitantly immune hosts. Proc Natl Acad Sci USA. 114(5): e1619265114.
- Serafim, T. D., Coutinho-Abreu, I. V., Oliveira, F., Meneses, C., Kamhawi, S. and Valenzuela, J. G. (2018). Sequential blood meals promote Leishmania replication and reverse metacyclogenesis augmenting vector infectivity. Nat Microbiol. 3(5): 548–555.
- Paixão, A. R., Dias, B. R. S., Palma, L. C., Tavares, N. M., Brodskyn, C. I., de Menezes, J. P. B. and Veras, P. S. T. (2021). Investigating the phagocytosis of Leishmania using confocal microscopy. J Visualized Exp.: (173). doi:10.3791/62459.
- Ullah, I., Barrie, U., Kernen, R. M., Mamula, E. T., Khuong, F. T. H., Booshehri, L. M., Rhodes, E. L., Bradford, J. M., Datta, A., Wetzel, D. M., et al. (2023). Src- and Abl-family kinases activate spleen tyrosine kinase to maximize phagocytosis and Leishmania infection. J Cell Sci. 136(14): e260809.
- Mosser, D. M. and Edelson, P. J. (1985). The mouse macrophage receptor for C3bi (CR3) is a major mechanism in the phagocytosis of Leishmania promastigotes. J Immunol. 135(4): 2785–2789.
- Siqueira-Neto, J. L., Moon, S., Jang, J., Yang, G., Lee, C., Moon, H. K., Chatelain, E., Genovesio, A., Cechetto, J., Freitas-Junior, L. H., et al. (2012). An image-based high-content screening assay for compounds targeting intracellular Leishmania donovani amastigotes in human macrophages. PLoS Negl Trop Dis. 6(6): e1671.
- Wetzel, D. M., McMahon-Pratt, D. and Koleske, A. J. (2012). The Abl and Arg kinases mediate distinct modes of phagocytosis and are required for maximal Leishmania infection. Mol Cell Biol. 32(15): 3176–3186.
- Wetzel, D. M., Rhodes, E. L., Li, S., McMahon-Pratt, D. and Koleske, A. J. (2016). The Src kinases Hck, Fgr, and Lyn activate Abl2/Arg to facilitate IgG-mediated phagocytosis and Leishmania infection. J Cell Sci.: e185595.
- Wetzel, D., Håkansson, S., Hu, K., Roos, D. and Sibley, L. (2003). Actin filament polymerization regulates gliding motility by apicomplexan parasites. Mol Biol Cell. 14(2): 396–406.
- Wetzel, D. M., Schmidt, J., Kuhlenschmidt, M. S., Dubey, J. P. and Sibley, L. D. (2005). Gliding motility leads to active cellular invasion by Cryptosporidium parvum sporozoites. Infect Immun. 73(9): 5379–5387.
Note: To ensure optimal cell density and parasite burden for immunofluorescence analysis, a strategic approach to dilutions is recommended. The parasite and cell concentration should be determined by systematic dilutions to find the most suitable concentration range for achieving robust unsaturated signal strength from sufficient cells and parasites. This optimization step addresses potential issues related to overcrowding or sparse distribution of parasites on the imaging surface, attains appropriate signal-to-noise ratios, reduces background fluorescence, and enhances the clarity of cellular structures. Similarly, incubation time should be systematically tested to allow adaptation to the experimental question being addressed. Finally, when initiating this protocol, it is helpful to include uninfected MΦ as controls, as well as control samples with parasites and MΦ that were incubated at 4 °C (so parasites should be bound by MΦ, but not internalized).
Further expansion of this protocol to incorporate different study items includes:
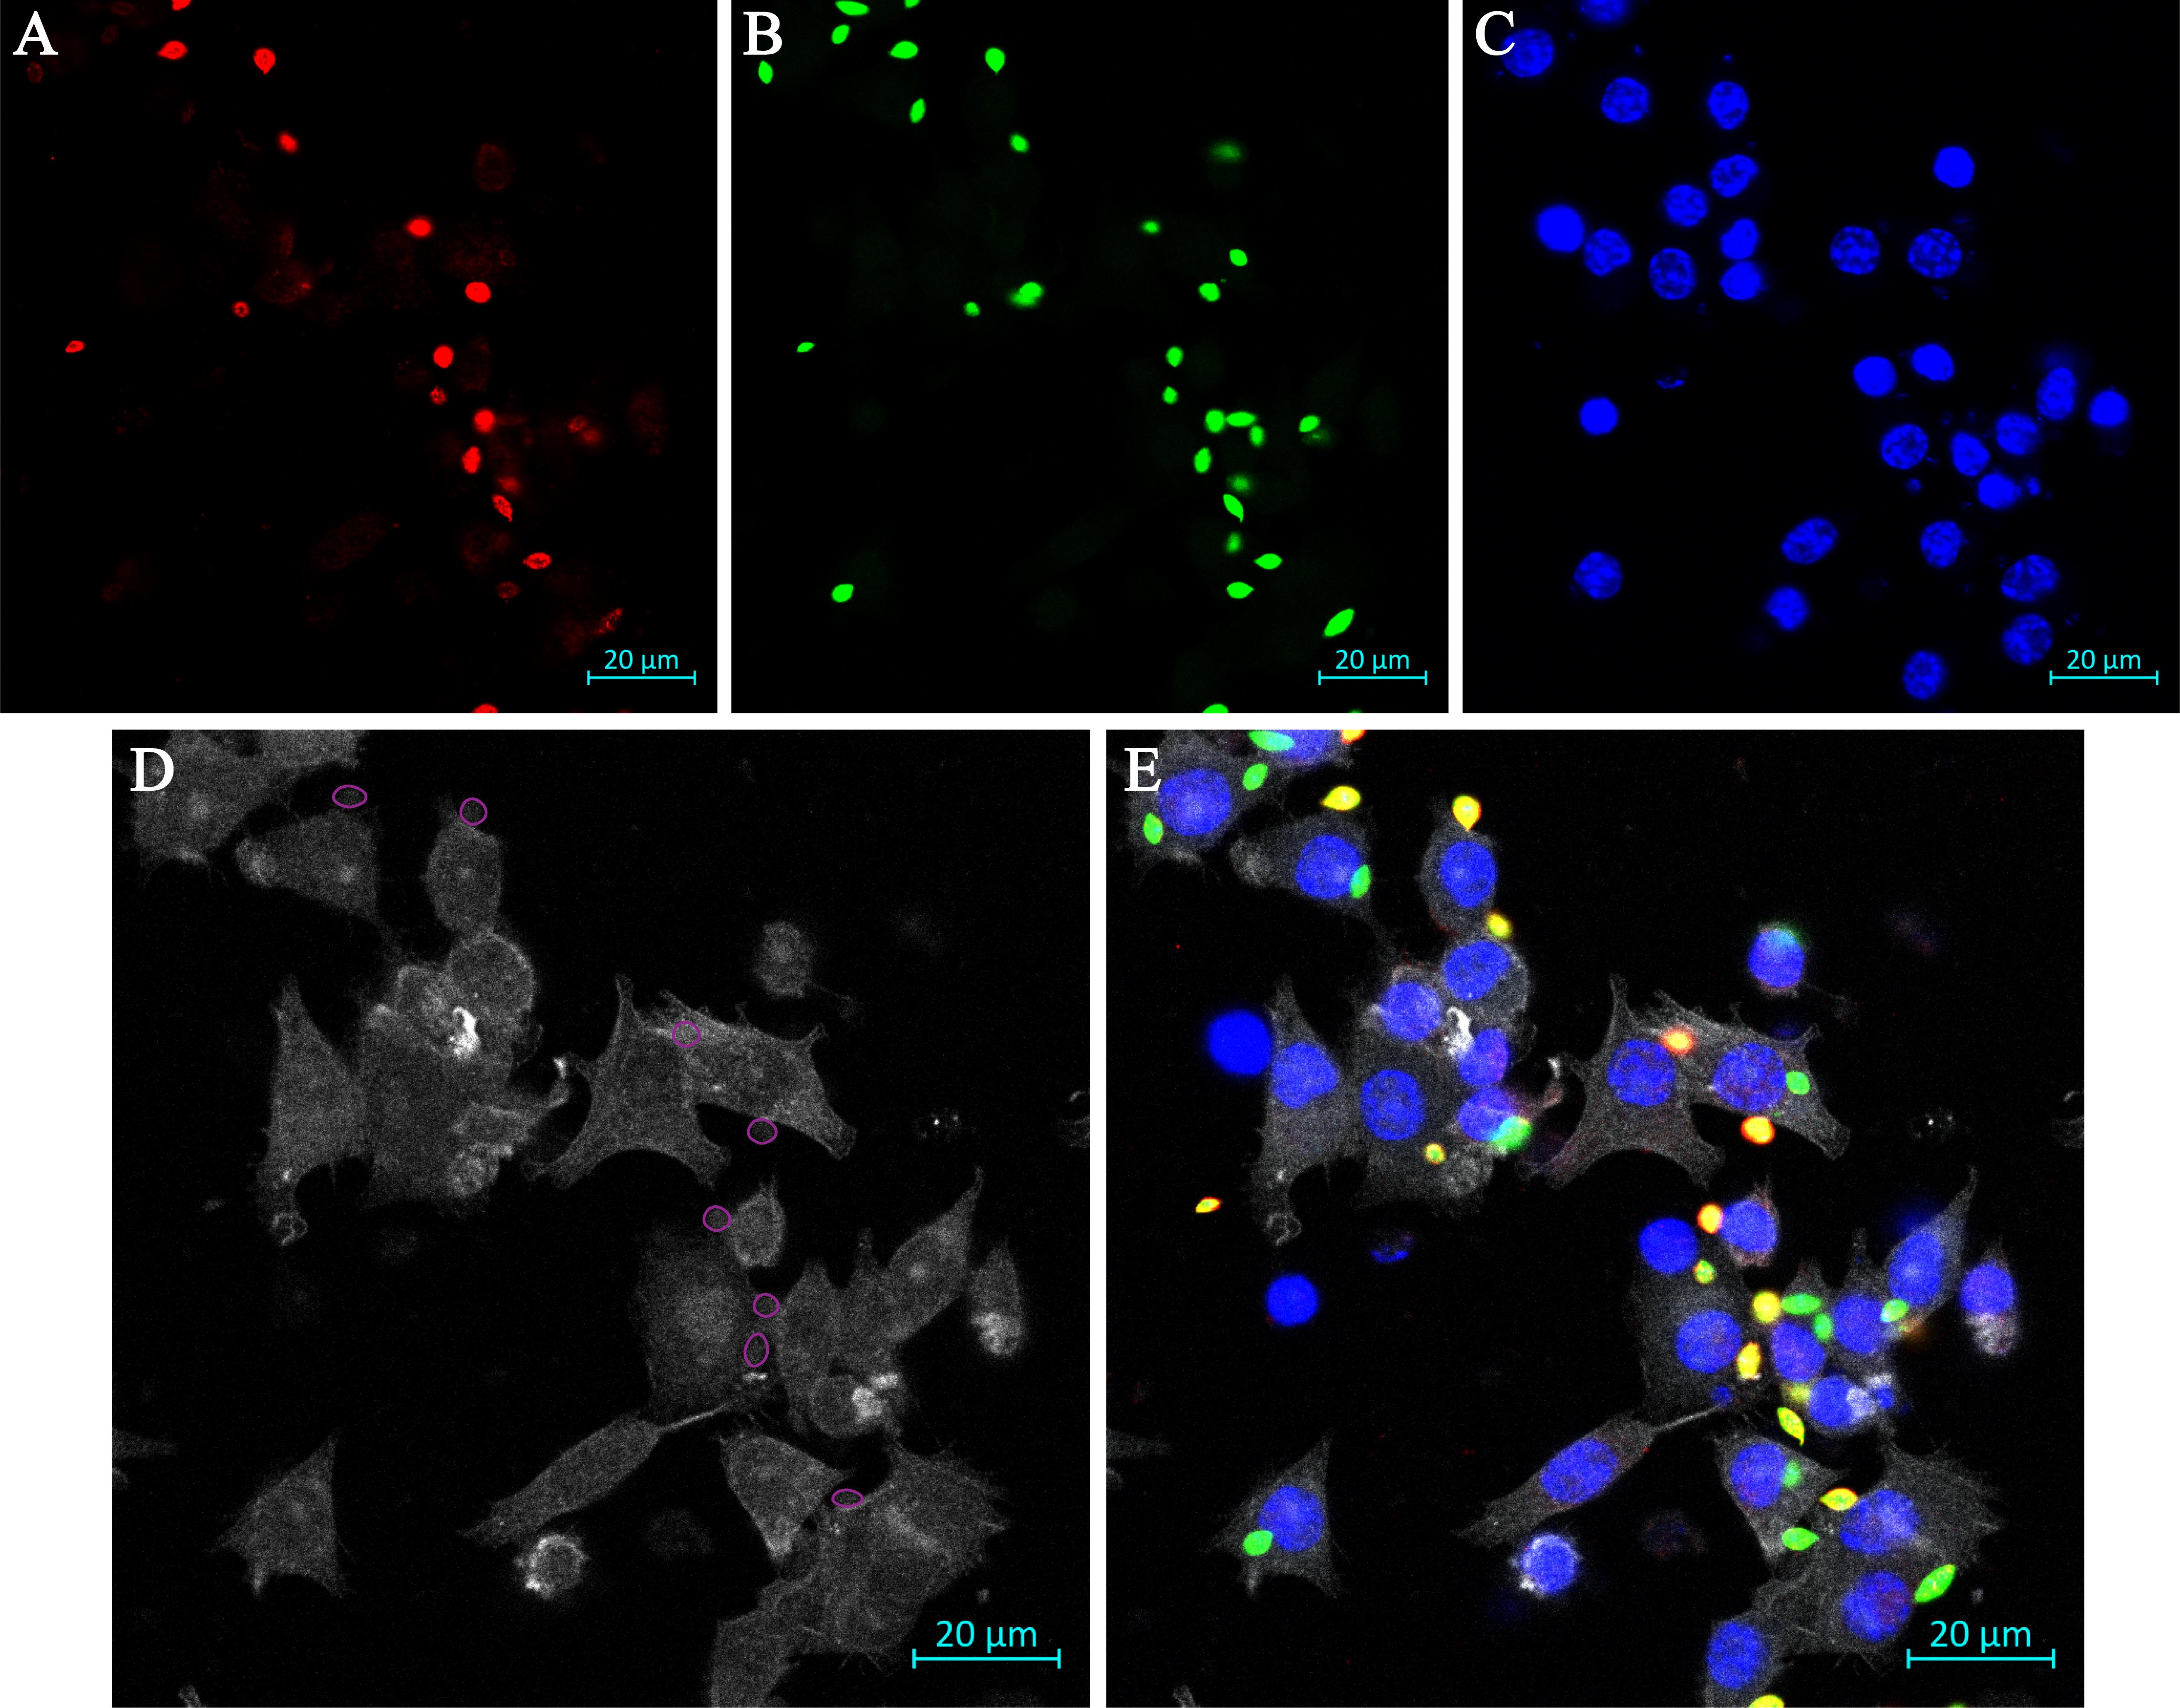
Figure 2. Representative image of immunofluorescence assay to visualize phagocytic cup formation upon amastigote uptake by RAW 264.7 cells. A. External parasites labeled red. B. All parasites labeled green. C. Nuclei labeled blue with Hoechst 33342. D. Actin filaments labeled white. Phagocytic cups (n = 8) are identified by ROIs (marked with purple circles), where we have delineated all parasites that are fully in focus and could be undergoing the process of entering mammalian cells. E. Overlay of the four images. Scale bar represents 20 μm.
Validation of protocol
The concepts of amastigogenesis and Leishmania internalization by phagocytic cells has been studied and replicated for some time [6,10], but only limited studies have employed quantitative analyses through image-based approaches [11] or characterized the uptake of amastigotes. This protocol, along with its variations, has been thoroughly peer-reviewed and validated independently by multiple researchers before publication [9,12,13]. Similar techniques have been used by our group and others for Leishmania and other microbes (e.g., the parasites Toxoplasma and Cryptosporidium) [14,15] for a number of years.
General notes and troubleshooting
Phagocytic cells, i.e., MΦs in this case, can display a lack of uniformity and consistency in the number of phagocytosed parasites. A general benchmark of RAW 264.7 cells-to-amastigotes ratio of 1:15 is a good starting point for setting up infections in 96-well plates. As described above (section D), this ratio can be adjusted to improve parasite visualization in a single pane. However, assessing the total numbers of cells and parasites should always be performed during microscopy to ensure quality results. We have found that there can be some variation between biological replicates of this assay. Under these circumstances, normalization of experimental values against a specific control group can be performed, which still maintains the integrity of the results. If this technique is used, one must either adjust corresponding statistical analysis accordingly (e.g., use one-sample two tailed t-tests to analyze for deviations from an expected result) or perform analysis before normalization. We also note that our flexible protocol allows incorporation of various fluorophores simultaneously to suit the objectives of the experiment. Naturally, it is imperative that fluorophores’ excitation and emission spectra are checked for potential overlap through spectrum viewers available on various product websites, such as https://www.thermofisher.com/order/fluorescence-spectraviewer.
Acknowledgments
We appreciate Bio-protocol’s invitation to submit this manuscript and the ongoing interest of the cell biology and microbiology communities in our multi-color immunofluorescence internalization assay. In particular, Drs. I. George Miller and Anthony J. Koleske, both from Yale University, have previously advocated for our submitting this assay as a protocol-based manuscript. We must acknowledge the generations of parasitologists who have been conducting similar studies to ours for inspiring the experimental variations that we have described, but whom we could not cite due to space constraints. We have adapted and modified our protocol on the basis of their previous work. We thank additional members of the Wetzel lab who have characterized host–pathogen interactions, including Gina Aloisio, Francis T. H. Khuong, and Imran Ullah, for their dedication to this ongoing project. We appreciate the assistance of Hanspeter Niederstrasser and Bruce A. Posner at the UT Southwestern High Throughput Screening Core with designing our automated analysis. We also thank the Biochemistry Department for access to the departmental Cytation 5 and Catherine Trice for their help with editing this manuscript. Work conducted over the years as a result of the protocol described here has been supported by NIH F32 AI094905, NIH K08 AI103036, NIH R01 AI146349, a Pediatric Infectious Diseases Society of America Fellowship, a Yale Center for Molecular Discovery Pilot Project Grant, Children’s Clinical Research Advisory Committee (CCRAC) Junior Investigator and Early Investigator Awards, a Welch Grant for Chemistry (I-2086) and funds from the UT Southwestern Department of Pediatrics (all to Dr. Wetzel). U. B. was supported by a National Institutes of Health Supplement to Promote Diversity in Health-Related Research (R01 AI146349-S1) and Medical Scientist Training (MD/PhD) Grant NIH T32GM008014. The Zeiss LSM880 with Airyscan was purchased with a Shared Instrumentation grant from NIH (1S10OD021684-01 to Katherine Luby-Phelps). We have also occasionally used an InCell Analyzer 6000 in the High Throughput Screening Core for visualizing our samples, which was purchased through NIH S10 OD018005. The funders did not play a role in the writing of this manuscript.
Competing interests
The authors declare no conflict of interest.
Ethical considerations
Use of Leishmania amazonensis, which is a Biosafety Level (BSL) 2 organism, was approved by the Biosafety Committee (Protocol # RDSR-2023-044) of The University of Texas Southwestern Medical Center, Dallas, TX.
References
Article Information
Copyright
© 2024 The Author(s); This is an open access article under the CC BY-NC license (https://creativecommons.org/licenses/by-nc/4.0/).
How to cite
Datta, A., Barrie, U. and Wetzel, D. M. (2024). A Multi-Color Immunofluorescence Assay to Distinguish Intracellular From External Leishmania Parasites. Bio-protocol 14(11): e5009. DOI: 10.21769/BioProtoc.5009.
Category
Microbiology > Microbe-host interactions > Protista
Cell Biology > Cell imaging > Confocal microscopy
Do you have any questions about this protocol?
Post your question to gather feedback from the community. We will also invite the authors of this article to respond.