- Protocols

- Articles and Issues
- For Authors
- About
- Become a Reviewer

Visualising Neutrophil Actin Dynamics in Zebrafish in Response to Laser Wounding Using Two-Photon Microscopy
Published: Vol 14, Iss 11, Jun 5, 2024 DOI: 10.21769/BioProtoc.4997 Views: 2169
Reviewed by: Alberto RissoneIvonne SehringAnonymous reviewer(s)
Original research article
The authors used this protocol in:

Jun 2022
Advertisement


Protocol Collections
Comprehensive collections of detailed, peer-reviewed protocols focusing on specific topics


Abstract
Cells need to migrate along gradients of chemicals (chemotaxis) in the course of development, wound healing, or immune responses. Neutrophils are prototypical migratory cells that are rapidly recruited to injured or infected tissues from the bloodstream. Their chemotaxis to these inflammatory sites involves changes in cytoskeletal dynamics in response to gradients of chemicals produced therein. Neutrophil chemotaxis has been largely studied in vitro; few assays have been developed to monitor gradient responses in complex living tissues. Here, we describe a laser-wound assay to generate focal injury in zebrafish larvae and monitor changes in behaviour and cytoskeletal dynamics. The first step is to cross adult fish and collect and rear embryos expressing a relevant fluorescent reporter (for example, Lifeact-mRuby, which labels dynamic actin) to an early larval stage. Subsequently, larvae are mounted and prepared for live imaging and wounding under a two-photon microscope. Finally, the resulting data are processed and used for cell segmentation and quantification of actin dynamics. Altogether, this assay allows the visualisation of cellular dynamics in response to acute injury at high resolution and can be combined with other manipulations, such as genetic or chemical perturbations.
Key features
• This protocol is designed to trigger laser wound in zebrafish larvae using two-photon intravital microscopy.
• The ability to wound while imaging makes it possible to monitor the behaviour and actin changes of the cells immediately after gradient exposure.
• The protocol requires a two-photon microscope for best results. Compared with one-photon laser wounding, the injury is more precise and has better tissue penetration.
• The focal nature of the wounds is suitable for studies of neutrophil swarming/aggregation and can be further adapted to infectious settings.
Keywords: Cell migrationBackground
Directed migration along gradients of chemicals (chemotaxis) is fundamental to many developmental and physiological processes. Immune cells represent prototypical migratory cells that rely on active motion to search tissues, find pathogens, and interact with other cells in order to launch immune responses. Among these cells, neutrophils are the first to be recruited to injured or infected tissues from the bloodstream [1]. Their chemotaxis to these inflammatory sites involves changes in cytoskeletal dynamics in response to gradients of chemicals produced therein, including primary chemoattractants produced by microbes or damaged cells (e.g., formyl peptides) or secondary attractants (i.e., attractants produced by inflamed tissue cells or by neutrophils themselves, such as chemokines and leukotriene B4) [1,2]. Understanding neutrophil chemotaxis mechanisms is important for ultimately controlling the accumulation of these cells in tissues in inflammatory disease settings, but also for providing mechanistic paradigms for understanding how other types of cells undergo directional motion in general.
Neutrophil motility and gradient sensing have been studied in vitro in settings where gradients can be administered in a controlled fashion. For example, assays where micropipettes are introduced to cells during imaging are very useful for inferring causal effects of gradients on cell behaviour. In addition, a variety of microfluidic setups can be used to generate long-lived gradients on 1D, 2D, or 3D migration devices, where the movement of the cells can be monitored over time [3–6]. Relatively few assays have been developed to profile neutrophil chemotaxis and actin dynamics in response to gradients in vivo. For example, injection of chemoattractants is difficult to perform in vivo during imaging.
Here, we provide a protocol for implementing laser-assisted tissue injury to profile the behaviour and actin dynamics of neutrophils in response to gradients. Wounds introduce a cocktail of damage-induced chemoattractants, and the behaviour of cells can be followed in response to such endogenous tissue-derived gradients [7,8]. Whilst the profile of gradients is relatively complex and difficult to determine, the advantage of this approach is that cells can be profiled in an intact organism. To compare with unspecific motion dynamics before gradient exposure, wounds can be performed in an anatomical site where neutrophils are already present and motile (such as the cephalic mesenchyme region of the zebrafish larva), or cell motion can be pre-stimulated in the tissue of interest [9]. This enables the determination of changes in the same moving cell before and after gradient exposure.
The approach has certain advantages over other intravital methods. Two-photon laser ablation is advantageous over one-photon ablation, offering more precise wounding and less background photodamage, as only the focal plane is exposed to a high number of photons [10,11]. Furthermore, the use of near-infrared light allows the performance of wounding deeper into tissues [10]. The use of the transparent zebrafish larva, as opposed to a mouse, simplifies the experimental approach and enables higher-resolution imaging of sub-cellular scale dynamics. In terms of further applications, the focal nature of the laser wound makes the assay suitable for studies of neutrophil swarming, notably when performing these wounds near or on the caudal hematopoietic tissue, where neutrophil density is highest [12]. In addition, the assay can be adapted to visualise host–pathogen interactions during wound healing, by the inclusion of microbes in the medium [12]. Genetic or chemical inhibition experiments can be used in conjunction with this assay to investigate signalling mechanisms [9,12].
Materials and reagents
Biological materials
Transgenic zebrafish: Tg(mpx:Lifeact-Ruby)
Promoter: Lysozyme neutrophil-specific promoter
Specificity: Lifeact (17 amino acids of yeast Abp140) fused to Ruby, which detects all F-actin, as described in Riedl et al. [13].
Reagents
4.53% NaOCl (Cleanline, catalog number: CL3013)
Methylene blue (Sigma-Aldrich, catalog number: M9140-25G)
1-phenyl-2-thiourea (PTU) (Sigma-Aldrich, catalog number: P7629-25G)
3-amino benzoic acid ethyl ester (MS-222 or Tricaine) (Sigma-Aldrich, catalog number: E10521-50G)
Low-melting point (LMP) agarose (Invitrogen, catalog number: 16520)
Leukotriene B4 (LTB4) (Sigma-Aldrich, catalog number: L0517)
Sodium chloride (NaCl), certified AR for analysis (Fisher Chemical, catalog number: S/3160/60)
Potassium chloride (KCl) (Honeywell Riedel-de. Haën, catalog number: 31248)
Calcium chloride 2-hydrate (CaCl2·2H2O) (AnalaR, catalog number: 100703H)
Magnesium sulphate heptahydrate (MgSO4·7H2O) (Sigma-Aldrich, catalog number: M2773)
2-[4-(2-hydroxyethyl)piperazin-1-yl]ethanesulfonic acid (HEPES), bioPerformance certified (Sigma-Aldrich, catalog number: H4034)
Trizma base (Sigma-Aldrich, catalog number: T6066)
Sodium hydroxide (NaOH) (Sigma-Aldrich, catalog number: 06203)
Solutions
E3 embryo medium (see Recipes)
MS-222 solution (see Recipes)
PTU stock solution (see Recipes)
LMP agarose solution (see Recipes)
Recipes
E3 embryo medium solution
Reagent Final concentration (for 1×) Quantity (for 60×) NaCl 5 mM 17.2 g KCl 0.17 mM 0.76 g CaCl2.2H2O 0.33 mM 2.9 g MgSO4.7H2O 0.33 mM 4.9 g ddH2O n/a Up to 1 L Total n/a 1 L E3 can be made up as a 60× stock and stored at room temperature. To prepare 60×, weigh each salt as per the table above and include 10 g of HEPES per 1 L as buffering agent. Add ~800 mL of ddH2O, adjust the pH to 7.8, and then top up with ddH2O to a final volume of 1 L. To make a 1× solution, dilute 16.7 mL of 60× solution and 1 mL of 0.01% methylene blue into a final volume of 1 L of ddH2O.
MS-222 solution
Reagent Final concentration (for 1×) Quantity (for 25×) MS-222 0.16 mg/mL 400 mg ddH2O n/a Up to 100 mL Total n/a 100 mL MS-222 can be made up as a 25× stock and stored at -20 °C for long-term storage or at 4 °C for short-term storage. To make 25× stock, weigh the corresponding amount of MS-222 as per the table above, add ~80 mL of ddH2O, adjust the pH to 7.5 using 1 M Tris pH 9, and then top up with ddH2O to a final volume of 100 mL.
PTU solution
Reagent Final concentration (for 1×) Quantity (for 50×) PTU 0.003% (w/v) 1.5 g ddH2O n/a 1 L Total n/a 1 L PTU can be made up as a 50× stock and stored in the dark at room temperature. PTU is not very soluble at room temperature. Therefore, stirring and mild heating at 60 °C is recommended to dissolve.
LMP agarose solution
Reagent Final concentration Quantity LMP agarose 1.2% (w/v) 0.24 g 1× E3 n/a 20 mL Total n/a 20 mL Use fresh LMP agarose to ensure polymerisation.
Laboratory supplies
1.5 mL TubeOne microcentrifuge tubes (Starlab, catalog number: S1615-5500)
Aquafine shader sable watercolour brush size 4/0 (Daler-Rowney, catalog number: 282034040)
Nunc glass-bottom dishes (Thermo Scientific, catalog number: 150680)
Fine point, non-sterile disposable transfer (Pasteur) pipettes (Liquipette, catalog number: 127-P406-000)
3 mL non-sterile disposable transfer (Pasteur) pipettes (Liquipette, catalog number: 127-P503-000)
50 mL skirted, sterile conical tubes (CellStar, catalog number: 210261)
15 mL sterile conical tubes (CellStar, catalog number: 188271)
Equipment
Incubator LMS series 2 (Wolflabs, catalog number: 220)
Techne FDB02AD DB-2A Analogue Dri-Block® heater (Techne, catalog number: 36620-12)
Analytical balance (Sartorius, catalog number: TE412)
pH meter with InLab® Routine Pro-OSM pH electrode (Mettler Toledo, catalog number: 51344055)
Olympus MVX10 Macro zoom fluorescence upright microscope (Olympus Life Science, catalog number: MVX10) equipped with pE-300 white LED microscope illuminator (CoolLED, catalog number: pE-300 white) to screen embryos for transgenic expression
Zeiss Stemi 2000-C stereomicroscope to remove unfertilised eggs and unhealthy or dead embryos (Carl Zeiss, catalog number: Stemi 2000-C)
TriM Scope II Multiphoton microscope (LaVision BioTec TriM Scope II) for laser wounding and live-cell imaging
Software and datasets
ImSpector Pro software (5.0.284.0, LaVision Biotec, © 1998-2016) for image acquisition on TriM Scope II – Multiphoton microscope
Fiji (ImageJ 1.52p, June 2019, publicly available [14]) for generation of maximum intensity z-projection of the 3D image datasets and generation of individual timelapse video for each neutrophil we track
MATLAB (R2018b, Sept 2018, requires a license) for image analysis and data plotting
Procedure
Crossing and rearing
Figure 1 illustrates the crossing and rearing process used in this experiment.
Maintain zebrafish under standard conditions at 28.5 °C ± 0.5 on a 14:10 h light/dark cycle until the desired stage.
Set up breeding pairs four days before laser wounding (Figure 1A).
Collect eggs as soon as possible post-fertilisation to prevent mould growth and avoid debris buildup (Figure 1B).
Note: Eggs are fertilised ~30 min after light stimulation [15] and ideally collected within 3 h from laying.
Remove the non-fertilised eggs shortly after collection (Figure 1C). Clean the selected eggs by washing them in 1× E3 embryo media three times. To further prevent mould or bacterial infection, embryos can be treated with 0.003% bleach for 5 min, followed by 3× washing in E3 media (Figure 1D).
Transfer the eggs to growth media (E3 medium supplemented with methylene blue and 1× PTU to prevent pigmentation) (Figure 1E). Grow the embryos in a 10 cm Petri dish (100 embryos/50 mL E3 medium) at 28 °C (Figure 1F).
Note: PTU should be added before 24 h post-fertilisation (hpf) to prevent pigment formation.
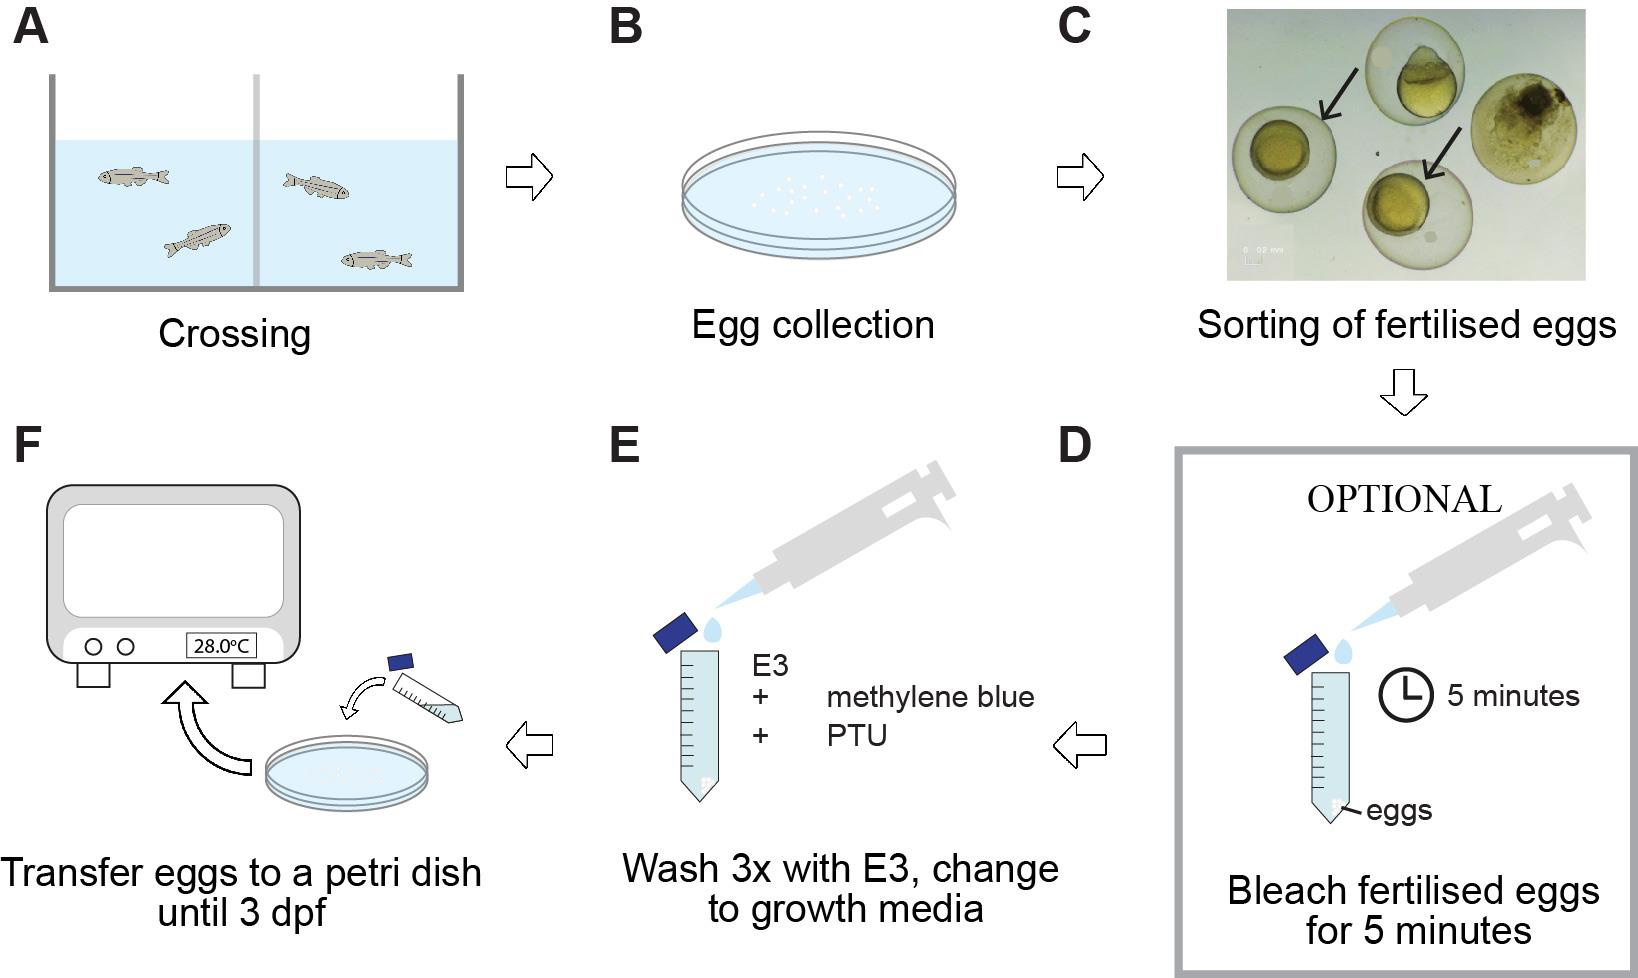
Figure 1. Diagram of the general workflow for the crossing and rearing procedures described in this paper. Adult zebrafish are set up for crossings in tanks and fit with a spawning mesh and a barrier separating the male from the female (A). For the crossing event, the barrier is removed in the morning. Eggs are collected at a maximum of 3 h later (B), followed by sorting of fertilised (arrowed) from non-fertilised eggs (C). To prevent mould or bacterial infection, embryos may be treated with a bleach solution, followed by three times washing with E3 medium (D). Finally, eggs are incubated at 28 °C in E3 supplemented with methylene blue to help prevent fungal and bacterial growth and PTU to prevent pigmentation (E, F). dpf = days post-fertilisation; PTU = 1-phenyl-2-thiourea.
Mounting of zebrafish larvae
At three days post-fertilisation (dpf), anaesthetise larvae with 1× MS-222 in E3 (Figure 2A).
Figure 2. Schematic diagram and representative images of the mounting process for laser wounding. Low-melting point (LMP) agarose is used to keep live embryos in place for an extended period of time. Larvae at 3 dpf with the strongest signal are anaesthetised with 1× MS-222 (A), screened for red (Lifeact-Ruby) fluorescent signal (B), and mounted onto (D–G) a glass-bottom plate in 1.2% LMP agarose. Once the larvae have been pipetted into the agarose (E), the larvae must be quickly (F) positioned and aligned, as the agarose will start to solidify within 1–2 min. After 10 min, agarose-embedded embryos are covered with E3 medium supplemented with MS-222 and any optional molecules, such as LTB4, and (G) imaged using a two-photon microscope. MS-222 = 3-amino benzoic acid ethyl ester; LTB4 = Leukotriene B4.Screen larvae for those that are positive for a transgene under a fluorescent stereomicroscope (Figure 2B).
Note: If the clutch contains a mix of heterozygous and homozygous larvae for the transgene, the level of expression may vary. If the brightness of the sample is important for the imaging, select the brightest larvae.
Place a 35 mm glass bottom dish with 14 mm micro-well #1.5 on the stereoscope stage and pipette 500 μL fresh 1.2% LMP agarose to the centre of the dish (Figure 2C, D).
Note: The type of imaging dish can be customised to the confocal stage requirements. The agarose has to be made fresh and kept at 37–39 °C before usage. If the agarose solidifies too quickly, the temperature at which the agarose is kept can be incrementally increased (the actual temperature of the agarose cools down quickly upon placing it on the Petri dish). Another option is to reduce the percentage of agarose to 1%.
Use a transfer pipette to transfer a few (2–3) 3 dpf larvae to the agarose with minimum E3 medium to prevent dehydration (Figure 2E). Using a fine brush, gently swirl the larvae to mix them into the agarose.
Note: It is helpful to mount as many larvae as possible to have extra fish in case of technical issues (see troubleshooting section). However, it is important to minimise the amount of E3 added into the agarose when adding the embryos, as this may dilute the agarose and create delays in the setting or stability of the embryo during imaging. We find it easier to place embryos into the agarose rather than the embryos onto the Petri dish first because it is harder to eliminate excess E3 medium in the latter scenario.
CRITICAL: The most time-sensitive step is aligning and orienting all the zebrafish larvae quickly so that they are lying flat in the agarose before it begins to solidify. The agarose usually takes 1–2 min to start solidifying after pipetting to the dish. Use a fine brush to orient each one of the larvae quickly (Figure 2F). Take caution not to injure the larvae.
Once the larvae are correctly oriented, remove as much agarose as possible using a fine-tip pipette so that the larvae are embedded in a thin agarose layer.
CRITICAL: When using an upright microscope, the goal is to have the larvae embedded in a thin agarose layer to minimise the distance between the objective and the sample. If an inverted microscope is used, the larvae need to be placed as close as possible to the bottom of the dish.
Wait for agarose around the larvae to solidify (~10 min).
Add 3 mL of E3 supplemented with 1× MS-222 to cover the agarose to prevent dehydration and keep the larvae healthy during microscopy. Mounted larvae are ready for imaging (Figure 2G).
Optional: At 20–30 min before laser wounding, add 30 μL of LTB4 solution to the E3 to attract the exit of neutrophils from the CHT (caudal hematopoietic tissue) to the ventral fin after wounding. This step is useful if the experiment requires neutrophils to be already motile or present in the tissue at the time of wounding.
Imaging and laser wounding
Laser wounding is performed on a multiphoton microscope (LaVision TriM Scope), equipped with a fast power modulation unit (electro-optic modulator) for fast microsecond laser power switching that allows specified regions of the scanned image plane to be treated with sufficient energy density to ablate through tissue. An Insight DeepSee dual-line laser was tuned to 900 nm and the laser power adjusted to approximately 500 mW.
Turn on all microscope hardware components, turn on the laser device, and start the ImSpector imaging software.
Place the dish on the microscope stage and bring the 25×/NA 1.05 water dipping objective lens down until it touches the media. Adjust the microscope stage so that the specimen is at the centre of the view.
Using the brightfield, focus on the area of the CHT ventral fin and determine the field of view that is going to be acquired containing the intended wounding site through the eyepiece (Figure 3A).
Figure 3. Schematic of a 3 dpf zebrafish larva showing the area of a two-photon laser wound and its representative field of view. Shown are a schematic of the anatomical area imaged (A) and the image projections before (B), during (C), and after (D) laser wounding. Neutrophils in a Tg(lyz:Lifeact Ruby) larva are shown (red fluorescence channel). CHT = caudal hematopoietic tissue; LW = laser wound; VF = ventral fin. Scale bar represents 50 μm. Note that upon laser wounding, the tissue becomes autofluorescent.Set the laser wavelength to 900 nm. Activate the main shutter for imaging and the 1,040 nm shutter for ablation. For the used Spectra-Physics DeepSee, the laser output power is 1.2–1.3 W.
Note: The laser power here is given for guidance but has to be optimised in pilot experiments as the values will be instrument specific. The precise choice of wavelength depends on the range available in the specific instrument and the spectral properties of the proteins imaged. The excitation maximum for Ruby is 558 nm [16].
Move the focal plane to 10 μm below the larval top surface.
Define the wounding site by selecting an ROI (wound ROI). For a field of view of 168 μm × 168 μm, a circular region of interest of 40 μm in diameter was defined in one focal plane. The pixel size was 240 nm × 240 nm with a dwell time of 15 μs.
Note: The wound size can be trialled experimentally to achieve a certain objective. In our case, we found that adjusting the wound at a diameter of 40 μm was optimal for two reasons: a) it does not cause excessive damage to the fish, so it can stay healthy and alive, and b) neutrophils could respond to the wound without any visible impairments. When locating the wound ROI, avoid pigment blasting.
After defining the wound site, determine the imaging field of view as an ROI of 300 μm × 300 μm around the wound ROI, trying to position the wound ROI at the centre of the field of view and including as many neutrophils in the image as possible. Figure 3 shows a representative field of view and laser wound ROI.
Define the z-stack with a step size of 2 μm covering roughly a 35 μm stack thickness. This yields 17–18 z-planes to acquire for every time point. To determine the top and bottom positions, the neutrophil fluorescence signal can be used as a criterion, as we want to include as many neutrophils as possible.
Note: The more parallel the larva is to the plate surface/objective, the smaller the stack thickness. The thinner the stack, the smaller the interval between elapsed stacks can be. This can be optimised during mounting to maximise the temporal resolution of the time-lapse movie.
Set the interval of image acquisition at 20 s.
Acquire a test stack to confirm that the number of defined z-planes can be acquired within the desired 20 s interval, allowing for 1–2 s before the next acquisition starts. If the stack takes longer than 20 s, adjust the z-stack size accordingly.
Define the duration of total imaging time and the time point to trigger the wounding. For example, you can acquire 30 min pre-wounding and 30 min post-wounding to image the behaviour of neutrophils shortly before and after.
Start the acquisition. This setting will automatically perform laser wounding during imaging. Alternatively, wounding can also be triggered manually at the desired time point.
Check that the tissue stays in focus during the imaging. Adjust focus as needed.
Data analysis
The image analysis scripts described below are available on GitHub, using this link: https://github.com/LeukocyteMotionAndDynamics/ActinDynamics.
To generate the maximum z-projection for analysis
Open Fiji.
Click on Plugins/Bioformats/Bio-Formats Importer.
Choose the 3D file (if the microscope generates a sequence of images and not just a single file, choose the first file of the sequence as this usually contains the metadata).
Choose the following options: Hyperstack in View stack with: and click on Use virtual stack.
When the file opens, click Image/Stacks/Z-Project.
Select top and bottom slice, Max Intensity in the Projection Type, and click on All time frames.
Save the file as .tiff.
Click Image/Properties and write down the pixel size in µm/pixel.
For each neutrophil to analyse, generate a new .tiff file
Select the first and last frame that the first neutrophil can be analysed and duplicate the .tiff file by right-clicking on the image, clicking Duplicate, defining the range of time-points (first to last image), and unselecting Duplicate stack.
Save the new file with the same experiment name but add the number of the neutrophil index.
Write down the index of the frame where the laser wound occurs (this is needed to synchronise all neutrophils later in the analysis).
Write down the centroid of the neutrophil by putting the mouse on the centre of the neutrophil at the first timeframe and reading the x-y coordinates at the bottom space of Fiji.
Define the perimeter of the laser wound
For each imaged zebrafish larva, create a maximum z-projection of the already z-projected file generated before (this file can be called time-projection; there you can see the maximum extent of the wound with maximum auto-fluorescence).
Open MATLAB.
Create a folder with the time-lapse images of the individual neutrophils and the time-projection.
Create a script to read and display the time-projection file; then, add the function to let the user choose the points on the image (script wound_select.m in GitHub).
Click sequentially at the perimeter of the wound until all the wound area has been enclosed.
Double-click to finish the selection.
Write down the x-y coordinates of the wound perimeter as they appear in the variable window of MATLAB.
Create another script in which you store, for each individual neutrophil (script cell_data.m in GitHub):
Neutrophil ID (arbitrary number starting from 1 for each neutrophil larva).
Pixel size of the image (from section Data analysis, step A8).
Time interval in seconds (i.e., 20 s) (from section Imaging and laser wounding, step 9).
x-y coordinates of the neutrophil centroid (from section Data analysis, step B4).
x-y coordinates of the perimeter of the laser wound (from section Data analysis, steps C5–C7).
The timeframe where the laser wound occurs (from section Data analysis, step B3).
To segment and analyse the neutrophils
Create a new script (script cell_analysis.m in GitHub) and define:
The number of cells to analyse.
A loop over all cells.
Reading of frames sequentially for each cell image file.
Segmenting the cell based on active contours technique [17] using MATLAB function activecontour (Figure 4A).
Figure 4. Analysis of neutrophils and calculation of Lifeact polarity with time. A. Outline (red line) of an example of a segmented neutrophil within a Tg(mpx:Lifeact-Ruby) transgenic larva. Scale bar = 10 μm. B. Neutrophil velocity vector (arrow) determines the direction of movement. C. Automated separation of the front (F) and rear (R) part of the cell; in the left image, Lifeact is concentrated at the front part (t0) while in the right image, Lifeact is concentrated at the rear part (t1). Arrows indicate the direction of motion. Scale bar = 10 μm. D. Neutrophil Lifeact polarity, in relation to time; time sequence was synchronised based on the time of the laser wounding. Adapted from Figures 2 and 3 in Georgantzoglou et al. [9].Finding the centroid of the cell.
Defining a line that separates the cell into the front and rear parts (script define_line.m in GitHub).
Separating a cell into front and rear parts based on the direction of motility of the cell (script divide_cell.m in GitHub) (Figure 4B, C).
Calculating the mean intensity at the front and rear part of the cell.
Saving the values in a MATLAB data file format.
To plot the actin polarity value as ‘mean front Lifeact’/‘mean rear Lifeact’, we create a script (script plot_actin_polarity_vs_time.m)
Create a loop over all cells.
For each cell, load the MATLAB file with the intensities (script get_cell_data.m in GitHub).
Obtain and smooth the front and rear Lifeact values for pre-wounding data.
Calculate the ratio Lifeact polarity = Lifeact front/Lifeact rear.
Synchronise data based on the timeframe of laser wound.
Repeat steps 1–5 for post-wounding data.
Calculate the mean and standard error of mean (SEM) of Lifeact polarity for each timeframe.
Plot Lifeact polarity vs. time and the SEM as a shaded area using the function boundedline.m [18] (Figure 4D).
Save the plot.
Validation of protocol
This protocol or parts of it has been used and validated in the following research articles:
Georgantzoglou et al. [9]. A two-step search and run response to gradients shapes leukocyte navigation in vivo. DOI: 10.1083/jcb.202103207.
Poplimont et al. [12]. Neutrophil Swarming in Damaged Tissue Is Orchestrated by Connexins and Cooperative Calcium Alarm Signals. DOI: 10.1016/j.cub.2020.05.030.
General notes and troubleshooting
General notes
Although related, two-photon absorption spectra are different than doubled one-photon spectra. Absorption cross-sections can also be quite different. It is therefore important to carefully choose the right fluorescent proteins and appropriate combinations [11].
A key benefit of two-photon microscopy is its property to image a thin focal volume in thick samples. The objective focal plane is the only space with a sufficient photon density to ensure the excitation of the fluorophore by two simultaneous photons [10]. To create high-resolution 3D images, the sample needs to be scanned through the focal plane of the objective. Collected over time, these volumes can be used to visualise the migration of motile cells. Consequently, the temporal resolution is limited by the scanning speed and the pixel dwell time to collect sufficient fluorescent signal. One approach to maximising the temporal resolution is to ensure the larva is positioned as parallel as possible to the objective, to minimise the size of the stack required to scan the region of interest.
Although laser wound using multiphoton imaging has been described in other organisms, we found that the application in zebrafish confers many practical advantages including (but not limited to):
Easier administration of agents and general manipulation.
Optically transparent embryos allowing high-resolution imaging of sub-cellular dynamics.
Other than the laser wound itself, the imaging procedure is non-invasive.
The possibility of continuous imaging as there is no placental barrier or influence of the maternal compartment.
It is a more refined choice of model organism, particularly in early larval stages.
There are technical aspects that can contribute to variabilities in the recruitment of neutrophils to the wound. The variabilities can be attributed to equipment settings (laser power can vary over time) and the mounting process (see troubleshooting). To this, it is important to factor in the biological variations across samples. Sufficient optimisation of protocol and biological replicates are needed to ensure reproducible results. In addition, we recommend mounting more than one larva for imaging, to have the choice to select a well-mounted larva for imaging. For more details on how to reduce variabilities, see the troubleshooting section.
Troubleshooting
| Problem | Probable cause | Solution/comments |
|---|---|---|
| Sample moves during imaging | Not enough agarose | Removal of excess agarose is important to minimise the working distance of the lens (if using an upright microscope). However, excess removal may compromise the stability of the specimen. Repeat mounting, ensuring a thin layer of agarose covers the sample. |
| Agarose has not solidified properly | Always use fresh agarose. We have noticed that agarose older than two weeks does not solidify well. | |
| No laser wound | No evidence of laser wound | Confirm whether laser wound has occurred. One thing to check is whether autofluorescence increases locally after wounding, which is a sign of tissue damage (Figure 3). In addition, one can also confirm with brightfield illumination if there is a wound, as evidenced by local opaque/discoloration of the tissue. If wound has not occurred, it is likely due to hardware or software issues. Check the hardware settings. If low laser power is observed, ask for technical support and consider system maintenance. |
| No or low neutrophil response | Laser wound is not strong enough to trigger migration | Mounting issues. Repeat mounting and ensure the sample is as parallel as possible to the bottom of the dish to ensure the entire wound is on the same focal plane. |
| Vary the wound size to find the setting that recruits cell migrations without compromising the sample’s health. If the wound is too large, it may not trigger recruitment due to overheating of the overall tissue. If the wound is too small, it may also not cause recruitment. | ||
| Wound location can also determine recruitment. For our case, we found that wounding at the region of the ventral fin or the boundary of the ventral fin and caudal hematopoietic tissue triggers more recruitment than in the head region, possibly due to the number of neutrophils present. | ||
| Sample is unwell | Sometimes mounting process can accidentally hurt the fish and cause a downward trend in heartbeat rate and blood flow velocity. Before mounting, pick larvae with good heartbeat rate, blood flow velocity, and normal morphology in addition to being positive for a transgene. Assess the heartbeat rate and blood flow velocity again before image acquisition. |
Acknowledgments
We thank Kevin O’Holleran and Martin Lenz of the Cambridge Advanced Imaging Centre, for their support and assistance in this work with two-photon microscopy; fish facility staff for assistance with zebrafish husbandry.
M. Sarris, A. Georgantzoglou, I. Williantarra and the relevant research were supported by a Medical Research Council Career Development Award (MR/L019523/1); Wellcome Trust (204845/Z/16/Z); Isaac Newton Trust (12.21 [a]i and 19.23 [n]), a Physiological Society research grant, and a Leverhulme Trust grant (RPG-2021-226). We also acknowledge all contributors to prior work [9,12] in which this protocol is based.
Competing interests
The authors declare no competing interests.
Ethical considerations
Zebrafish were maintained in accordance with UK Home Office regulations, UK Animals (Scientific Procedures) Act 1986. Adult zebrafish were maintained under project licenses 70/8255 and P533F2314, which were reviewed by the University Biomedical Services Committee. Animals were maintained according to ARRIVE guidelines.
References
- Kolaczkowska, E. and Kubes, P. (2013). Neutrophil recruitment and function in health and inflammation. Nat Rev Immunol. 13(3): 159–175.
- Sarris, M. and Sixt, M. (2015). Navigating in tissue mazes: chemoattractant interpretation in complex environments. Curr Opin Cell Biol. 36: 93–102.
- Parent, C. A., Blacklock, B. J., Froehlich, W. M., Murphy, D. B. and Devreotes, P. N. (1998). G Protein Signaling Events Are Activated at the Leading Edge of Chemotactic Cells. Cell. 95(1): 81–91.
- Servant, G., Weiner, O. D., Herzmark, P., Balla, T., Sedat, J. W. and Bourne, H. R. (2000). Polarization of Chemoattractant Receptor Signaling During Neutrophil Chemotaxis. Science. 287(5455): 1037–1040.
- Vargas, P., Terriac, E., Lennon-Duménil, A. M. and Piel, M. (2014). Study of Cell Migration in Microfabricated Channels. J Visualized Exp. 84: e51099.
- Zhao, W., Zhao, H., Li, M. and Huang, C. (2020). Microfluidic devices for neutrophil chemotaxis studies. J Transl Med. 18(1): 168.
- Eming, S. A., Krieg, T. and Davidson, J. M. (2007). Inflammation in Wound Repair: Molecular and Cellular Mechanisms. J Invest Dermatol. 127(3): 514–525.
- Metzemaekers, M., Gouwy, M. and Proost, P. (2020). Neutrophil chemoattractant receptors in health and disease: double-edged swords. Cell Mol Immunol. 17(5): 433–450.
- Georgantzoglou, A., Poplimont, H., Walker, H. A., Lämmermann, T. and Sarris, M. (2022). A two-step search and run response to gradients shapes leukocyte navigation in vivo. J Cell Biol. 221(8): e202103207.
- Denk, W., Strickler, J. H. and Webb, W. W. (1990). Two-Photon Laser Scanning Fluorescence Microscopy. Science. 248(4951): 73–76.
- Drobizhev, M., Makarov, N. S., Tillo, S. E., Hughes, T. E. and Rebane, A. (2011). Two-photon absorption properties of fluorescent proteins. Nat Methods. 8(5): 393–399.
- Poplimont, H., Georgantzoglou, A., Boulch, M., Walker, H. A., Coombs, C., Papaleonidopoulou, F. and Sarris, M. (2020). Neutrophil Swarming in Damaged Tissue Is Orchestrated by Connexins and Cooperative Calcium Alarm Signals. Curr Biol. 30(14): 2761–2776.e7.
- Riedl, J., Crevenna, A. H., Kessenbrock, K., Yu, J. H., Neukirchen, D., Bista, M., Bradke, F., Jenne, D., Holak, T. A., Werb, Z., et al. (2008). Lifeact: a versatile marker to visualize F-actin. Nat Methods. 5(7): 605–607.
- Schindelin, J., Arganda-Carreras, I., Frise, E., Kaynig, V., Longair, M., Pietzsch, T., Preibisch, S., Rueden, C., Saalfeld, S., Schmid, B., et al. (2012). Fiji: an open-source platform for biological-image analysis. Nat Methods. 9(7): 676–682.
- Westerfield, M. (2007). The zebrafish book. A guide for the laboratory use of zebrafish (Brachydanio rerio). Eugene: Univ. Oregon Press.
- Kredel, S., Oswald, F., Nienhaus, K., Deuschle, K., Röcker, C., Wolff, M., Heilker, R., Nienhaus, G. U. and Wiedenmann, J. (2009). mRuby, a Bright Monomeric Red Fluorescent Protein for Labeling of Subcellular Structures. PLoS One. 4(2): e4391.
- Chan, T. and Vese, L. (2001). Active contours without edges. IEEE Trans Image Process. 10(2): 266–277.
- Kearney, K. (2022). boundedline.m [WWW Document]. URL https://github.com/kakearney/boundedline-pkg, GitHub.
Article Information
Copyright
© 2024 The Author(s); This is an open access article under the CC BY-NC license (https://creativecommons.org/licenses/by-nc/4.0/).
How to cite
Readers should cite both the Bio-protocol article and the original research article where this protocol was used:
- Williantarra, I., Georgantzoglou, A. and Sarris, M. (2024). Visualising Neutrophil Actin Dynamics in Zebrafish in Response to Laser Wounding Using Two-Photon Microscopy. Bio-protocol 14(11): e4997. DOI: 10.21769/BioProtoc.4997.
- Georgantzoglou, A., Poplimont, H., Walker, H. A., Lämmermann, T. and Sarris, M. (2022). A two-step search and run response to gradients shapes leukocyte navigation in vivo. J Cell Biol. 221(8): e202103207.
Category
Immunology > Immune cell imaging > Two-photon microscopy
Cell Biology > Cell imaging > Confocal microscopy
Do you have any questions about this protocol?
Post your question to gather feedback from the community. We will also invite the authors of this article to respond.