- Protocols

- Articles and Issues
- For Authors
- About
- Become a Reviewer

Calcium Signal Analysis in the Zebrafish Heart via Phase Matching of the Cardiac Cycle

Published: Vol 14, Iss 10, May 20, 2024 DOI: 10.21769/BioProtoc.4989 Views: 2631
Reviewed by: Alberto RissoneAnonymous reviewer(s)
Original research article
The authors used this protocol in:

Oct 2021
Advertisement


Protocol Collections
Comprehensive collections of detailed, peer-reviewed protocols focusing on specific topics


Abstract
Calcium signalling in the endocardium is critical for heart valve development. Calcium ion pulses in the endocardium are generated in response to mechanical forces due to blood flow and can be visualised in the beating zebrafish heart using a genetically encoded calcium indicator such as GCaMP7a. Analysing these pulses is challenging because of the rapid movement of the heart during heartbeat. This protocol outlines an imaging analysis method used to phase-match the cardiac cycle in single z-slice movies of the beating heart, allowing easy measurement of the calcium signal.
Key features
• Software to synchronise and analyse frames from movies of the beating heart corresponding to a user-defined phase of the cardiac cycle.
• Software to measure the fluorescence intensity of the beating heart corresponding to a user-defined region of interest.
Keywords: Software developmentGraphical overview
Background
The heart begins to beat early during morphogenesis [1]. While most studies on heart development have been performed in fixed tissue samples or in vitro, the development of the heart is regulated by the heartbeat and blood flow [2], and a full understanding of heart development requires performing studies in the beating heart.
Thanks to its transparency, the zebrafish embryo provides an excellent model to study heart development in vivo [3]. Using the Tg(fli1a:galff);(uas:GCaMP7a) zebrafish line, we recently demonstrated that mechanoresponsive calcium signals in valve endothelial cells are present from the earliest stages of valve formation and persist until functional valve leaflets are formed [4]. Calcium signal analysis in single z-slice movies of the beating heart is challenged by the way cells move both within and outside the image plane during heartbeat and the fact that the heart rate can change over the course of imaging. Since there was no readily available software to analyse calcium signals in the beating heart, we developed our own. This protocol provides step-by-step instructions on how to use the software, which can be used to further study calcium signalling in the developing heart or easily adapted for the analysis of other imaging data containing recurring events.
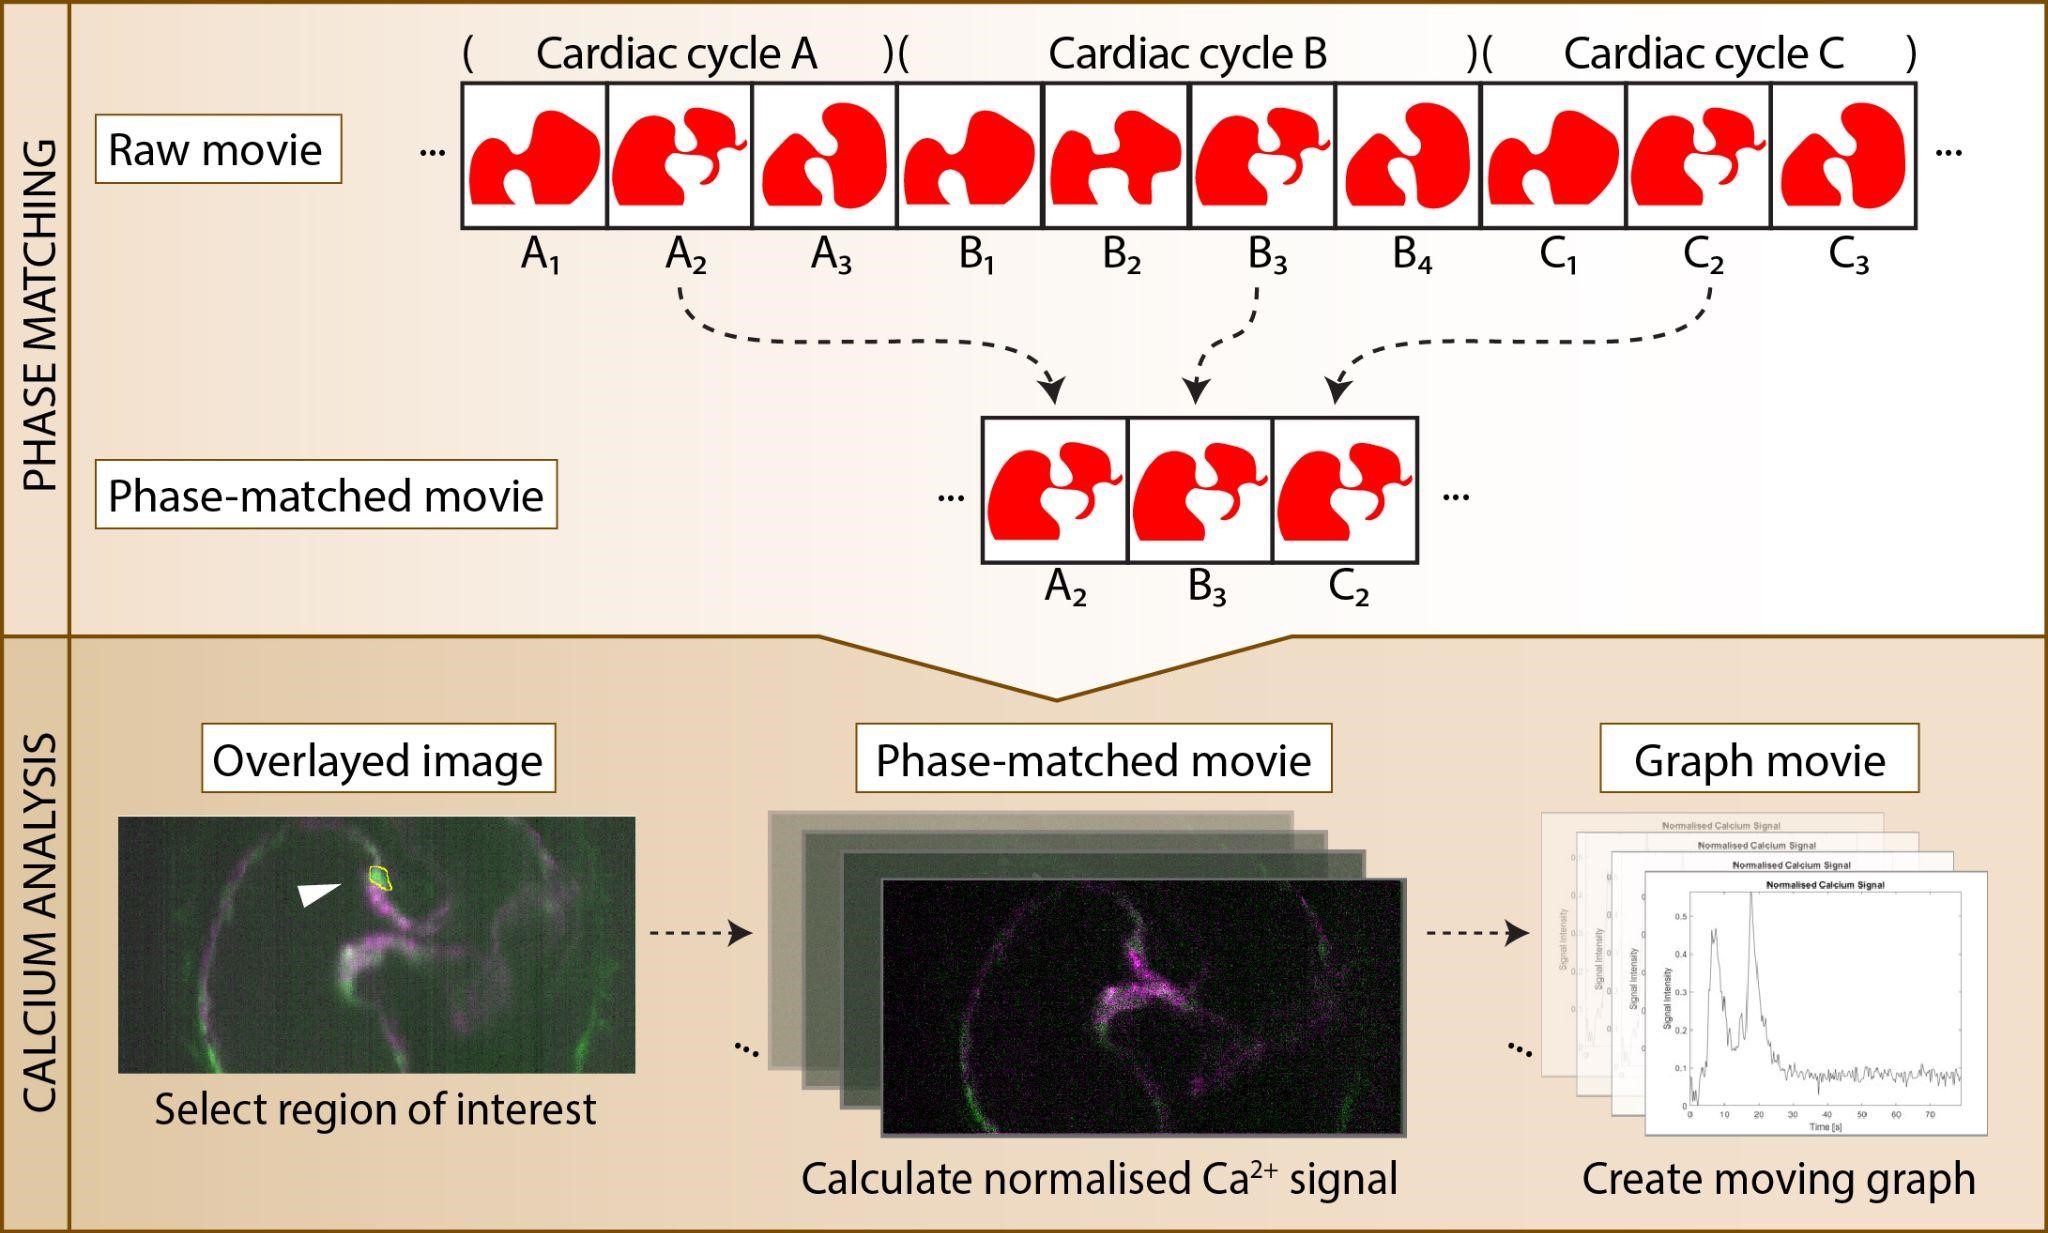
Our image analysis method involves the use of two MATLAB applications developed in our lab as well as FIJI [5], an open-source image processing package based on ImageJ2. The Phase Matching MATLAB application utilises the structural similarity score [6] to select frames corresponding to a particular phase in the cardiac cycle. The output of the Phase Matching application is a phase-matched movie with minimal cardiac cell movement. The Calcium Analysis MATLAB application reads the phase-matched movie and measures the normalised calcium signal intensity over time in a user-defined region of interest (ROI). FIJI is used to manipulate image stacks and to combine animated graphs of the normalised calcium signal with the phase-matched image data.
Equipment
Operating system: Windows 7 or later version, Mac OS X 10.8 or later, Ubuntu 12.04 LTS or later
RAM: 4 GB (8 GB+ recommended)
Disk: 128 GB
Software and datasets
FIJI 2.7.0 or later (https://fiji.sc/)
MATLAB R2014a or later (https://www.mathworks.com/products/matlab.html)
Note: MATLAB is a licensed software by MathWorks; for those who do not have MATLAB leave/licence, we provide a stand-alone executable for the Windows platform. For other platforms, we recommend using the open-source package Octave (https://octave.org)
All data and codes are available on GitHub (https://github.com/HeartValveLab/CalciumAnalysis)
Procedure
Prepare image datasets
Each channel of the single z-slice movie (see Note 1 in General notes and troubleshooting) should be saved as a single TIFF file in the working directory. If this is not the case, ImageJ can be used to convert most image file formats to TIFF.
Open the z-slice movie using FIJI.
Use Image > Duplicate to split channels.
Select File > Save As > TIFF.
Download and installation
Navigate to the GitHub page above and follow the “Getting Started—For Users” instructions for the application of choice.
Using the Phase Matching application
Select the input files and a reference frame (Figure 1).
Browse for the working directory with the input TIFF files. Note that dataset files will not be visible here.
Browse for the input TIFF files. Up to three channels can be selected.
Select the channel to be used as a reference for phase matching (Main Ch).
Select the frame to be used as a reference for phase matching (Phase).
Click Set to lock in variables. This will generate a pop-up window showing the selected reference frame.
Draw a ROI. If the use of the entire image is desired, click and drag from the top-left corner to the bottom-right corner.
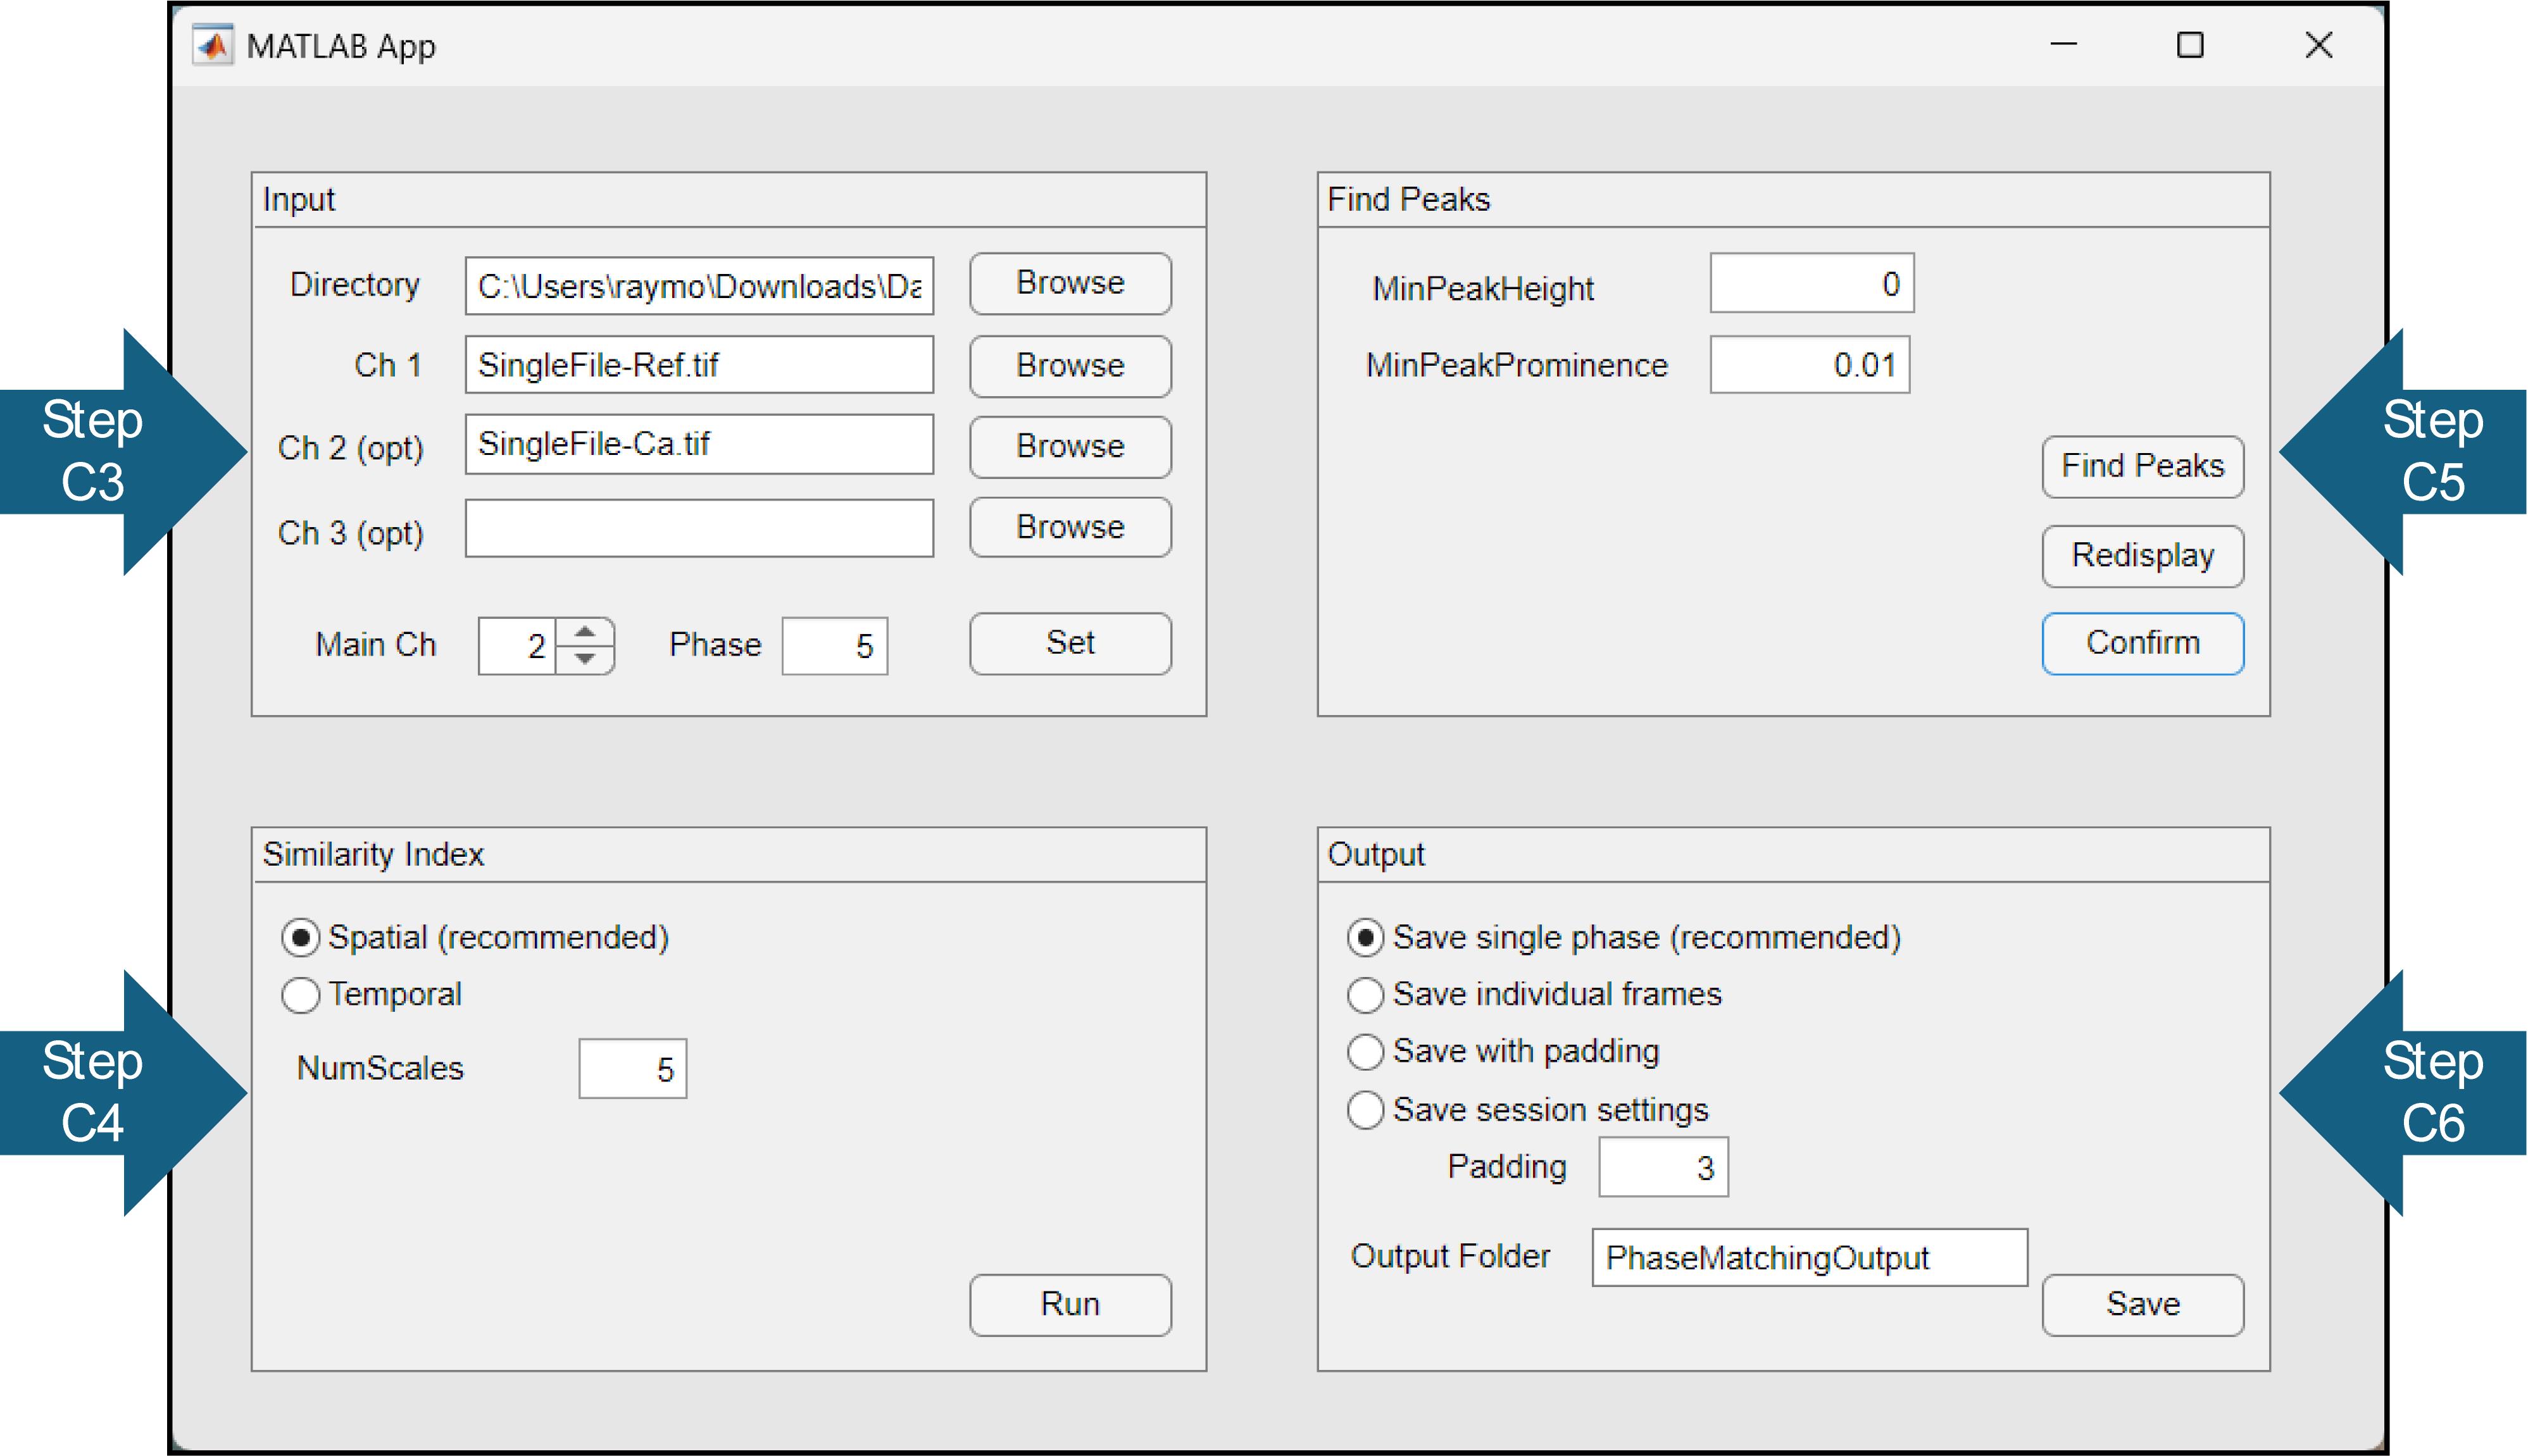
Figure 1. Graphics user interface of Phase Matching application. Arrows indicate steps in the written protocol.Identify the similarity values (Figure 1).
Select either the spatial or temporal method.
Spatial: Compares the similarity of individual frames; this is usually sufficient and faster.
Temporal: Also evaluates the similarity of neighbouring frames. Possibly more accurate, slower.
Click Run. A pop-up window will show a graph showing the similarity index of each frame relative to the reference frame.
(Optional) Adjust the NumScales parameter if peaks are not very prominent, and press Run again. NumScales controls the number of levels of the image pyramid used for determining similarity.
Determine the location of the peaks (Figure 1).
Click Find Peaks to automate finding most of the peaks. A pop-up window showing the position of the peaks will be displayed.
(Optional) MinPeakHeight and MinPeakProminence can be tuned if the user wishes to detect more or less peaks.
(Optional) Click on points on the figure to add or remove them from the peaks list.
Points already detected as peaks will be deselected.
Points not already detected will be selected.
Right-click on a point and Export Cursor Data to Workspace. Note this only needs to be done once; all the other points are saved alongside it.
Always save it as a cursor_info variable. Note that you will need to remove numbering for subsequent adjustments.
Click Redisplay to set values and visualise output. Note that you can click it again to revert a change.
Click Confirm to set the output to be saved.
Save output (Figure 1). A folder will be created in the path of the input files.
Select the output file type.
Save single phase: Saves frames corresponding to the phase of interest as a single OME file.
Save individual frames: Saves frames corresponding to the phase of interest as a series of TIFF files.
Save with padding: Saves frames corresponding to the phase of interest with neighbouring frames padded on as an OME file (see Note 2 in General notes and troubleshooting).
Save session settings: Allows you to easily rerun code in a script.
Click Save. Check the saved image file by opening it in FIJI (Figure 2). Adjust variables and run again if necessary.
Using the Calcium Signal Analysis application
Prepare image datasets.
Ensure each channel is saved as a separate TIFF in the directory.
Image > Duplicate can be used in FIJI to split channels.
Set up the output files (Figure 2).
Browse for the working directory containing the phase-matched TIFF files. Note that dataset files will not be visible here.
Browse for the phase-matched TIFF files.
Select the range of frames you want to use. Note that an End Frame of 0 will default to the last frame of the data.
Click Set to lock in input variables. A pop-up window will show the first and last frames to be analysed.
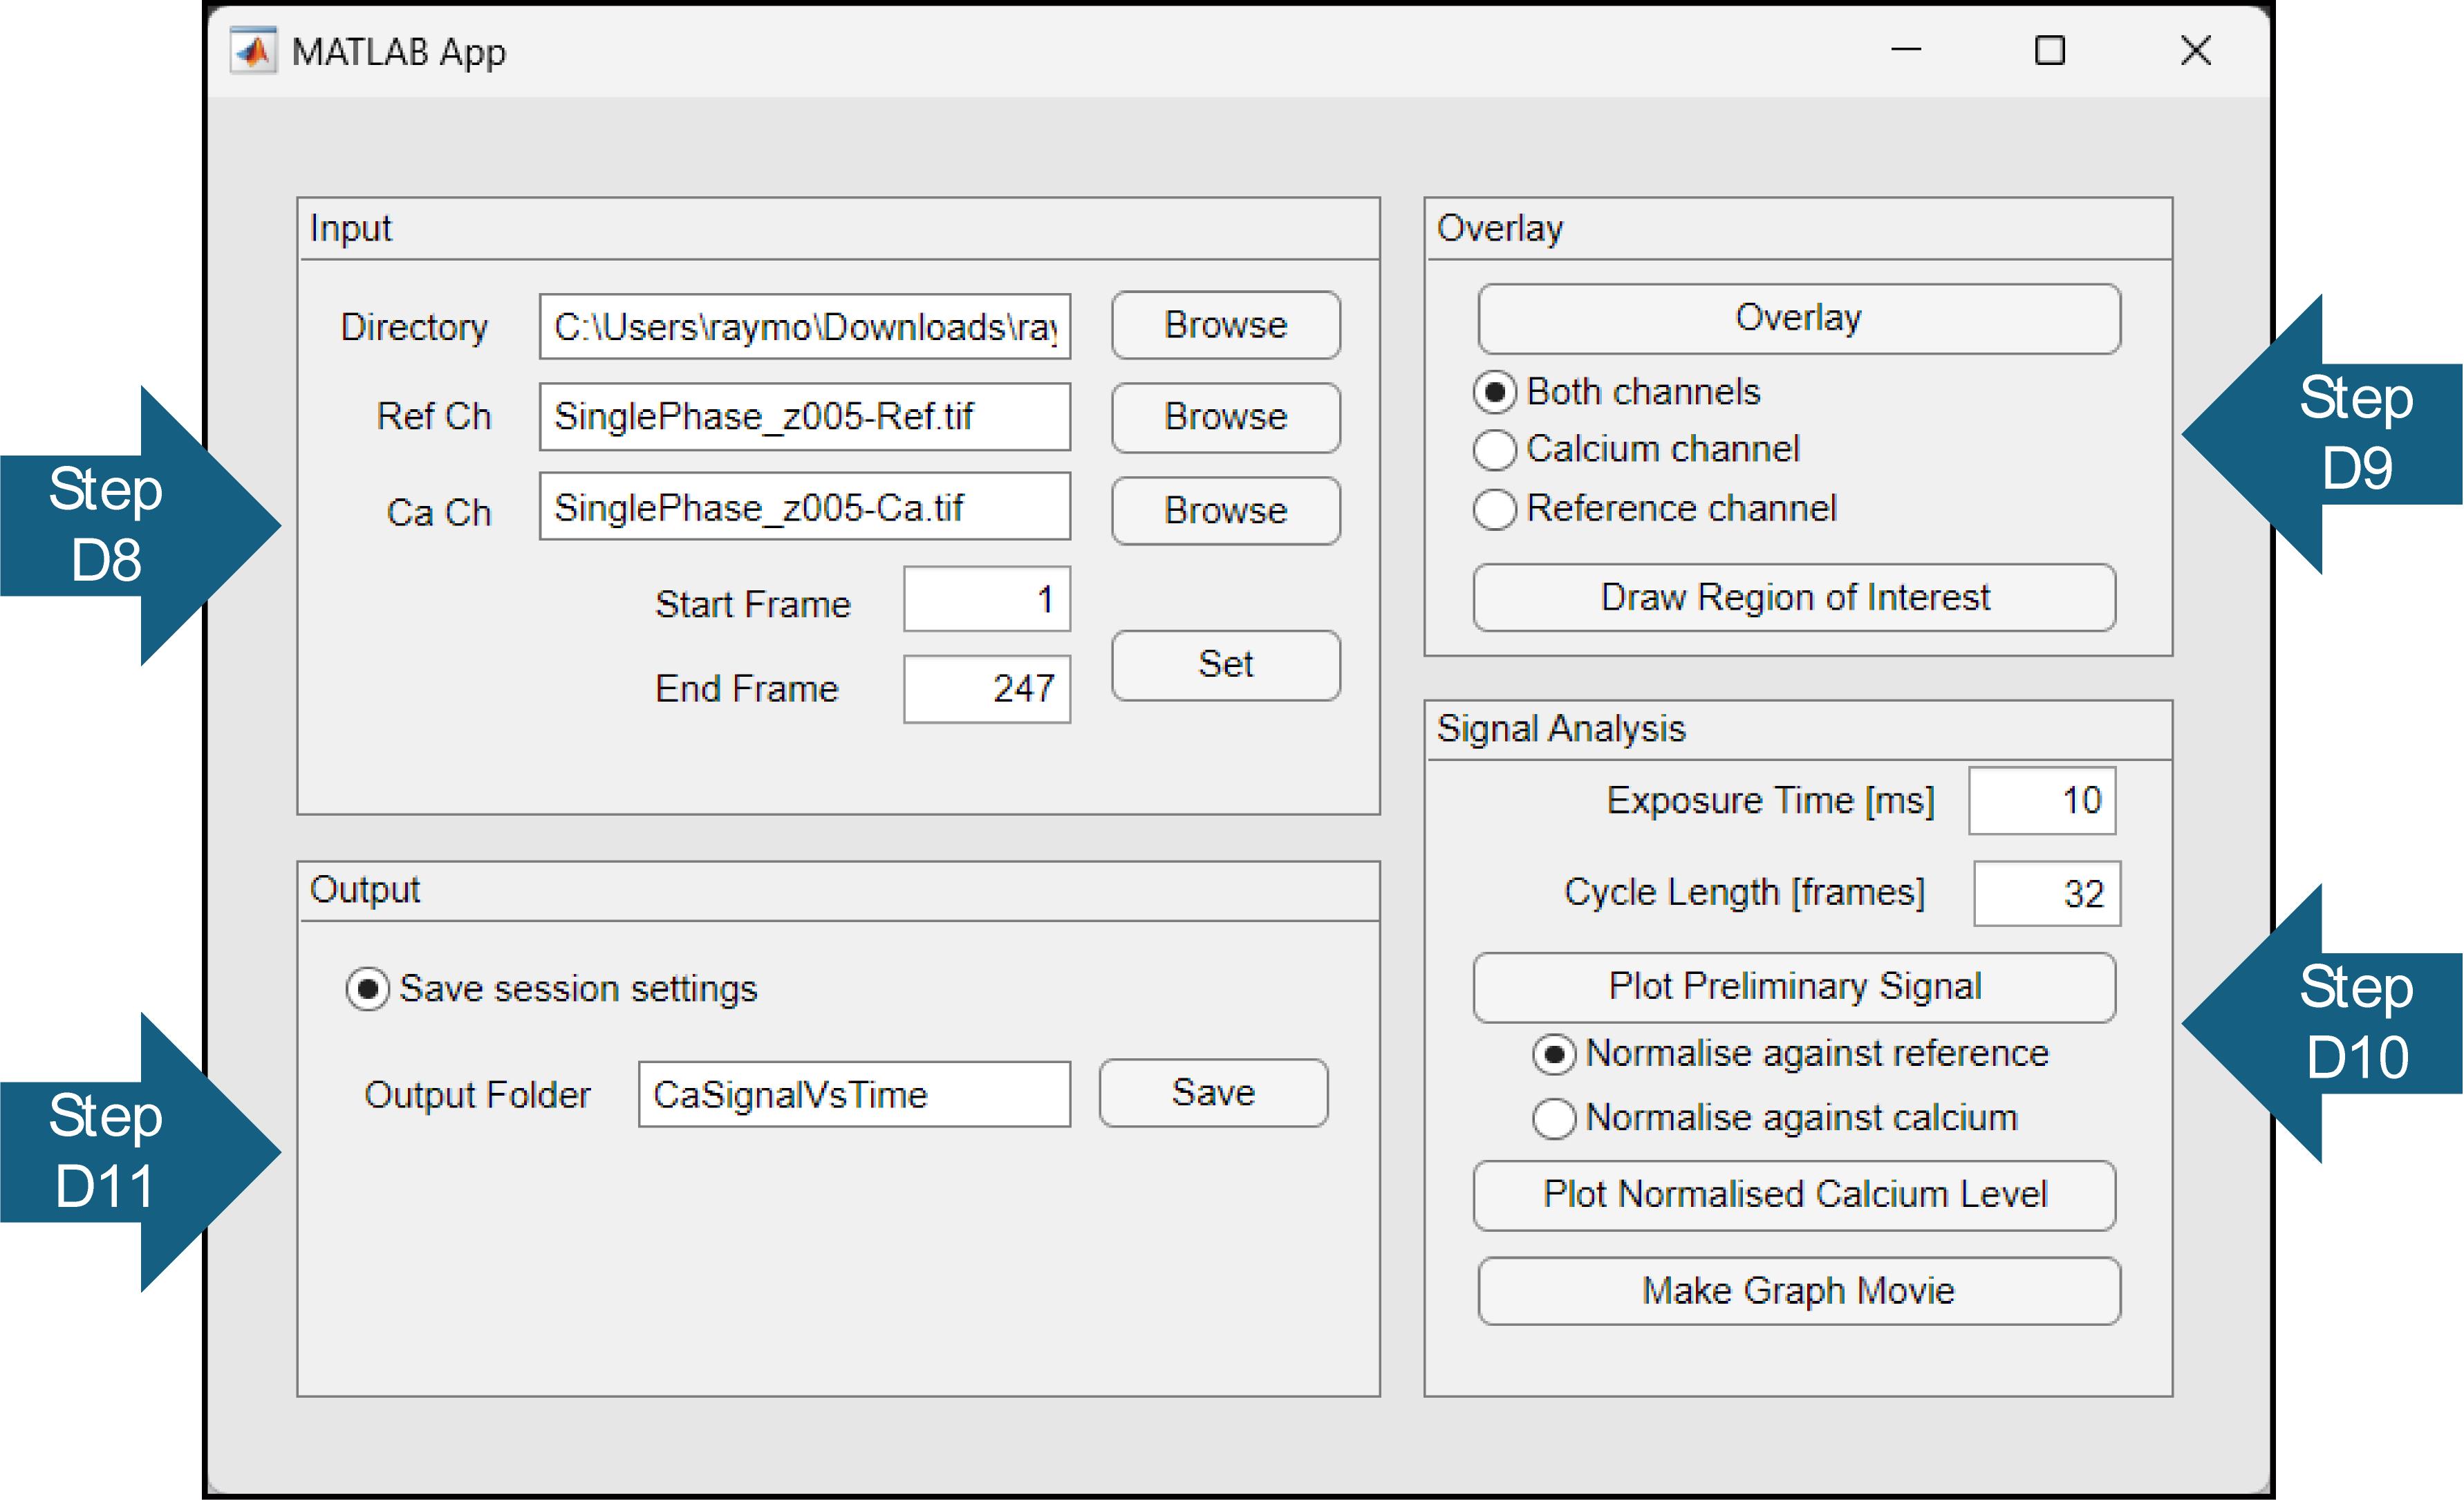
Figure 2. Graphics user interface of Calcium Signal Analysis application. Arrows indicate steps in the written protocol.Perform signal analysis (Figure 2).
Overlay all of the frames in each channel.
Select Draw Region of Interest and trace the cell you wish to analyse (Figure 3B). Users may find using a stylus easier.
Save output (Figure 2). A folder will be created in the path of the input files.
Adjust parameters accordingly.
Exposure Time corresponds to the inverse frame rate and depends on microscope settings.
Cycle Length corresponds to the average number of frames between phase-matched cycles and can be obtained from the Find Peaks figure from Phase Matching software.
Plot the Preliminary Signal to check the signal. Note that it will be saved automatically and may overwrite previous figures.
Plot Normalised Calcium Level to obtain output. Note that it will be saved automatically and may overwrite previous figures.
Normalise against reference normalises the calcium signal against the reference.
Normalise against calcium normalises the calcium signal against its own minimum.
Make Graph Movie to obtain a frame-by-frame output. Note that it will be saved automatically and may overwrite previous figures.
Save output (Figure 2). A folder will be created in the path of the input files.
Choose a name for the Output Folder and Save.
Plots are automatically saved.
Saving session settings is particularly helpful if you want to obtain underlying values.
Putting images and graphs side-by-side
See Note 3 in General notes and troubleshooting.
Create a single TIFF from Graph Movie.
In FIJI, File > Import > Image Sequence.
Browse for the directory where Graph Movie has been saved.
Click OK and wait.
Save the TIFF output.
Combine the graph with the visual data.
Open the phase-matching output alongside the graph movie output from above.
Go to Image > Colour > Channels Tool and select Composite from the drop-down menu.
Select the colours for each channel as you wish.
Go to Image > Type > RGB Color to generate TIFF with both channels combined into one.
Go to Image > Adjust > Size for either open file and adjust to have the same vertical resolution.
Go to Image > Stacks > Tools > Combine to collate the datasets together.
(Optional) Add arrow.
Right-click on the line icon and select Arrow Tool.
Draw an arrow to the cell of interest.
Press Ctrl + D to place the arrow on all frames.
Data analysis
This section provides an example of using the protocol to analyse calcium signals generated by endocardial cells in a beating zebrafish heart. Our raw data consists of a 2-channel, 8000-frame movie of a Tg(fli1a:galff; uas:GCaMP7a);Tg(fl1a:lifeact-mCherry) zebrafish heart, where images were captured at 100 frames per second (Figure 3A). Our cell of interest can be seen clearly in the fifth frame of the 8000-frame movie. We used the Phase Matching application to identify images whose reference channel [the Tg(fli1a:lifeact-mCherry) channel] showed a high degree of similarity to that of the fifth frame. The application identified 247 similar images (peaks in Figure 3B) including the fifth frame itself, corresponding to 247 cardiac cycles captured in the raw data. The application was then used to generate a phase-matched movie containing only those 247 frames (Figure 3C) and a phase-matched movie with padding (Figure 3D). Next, we used the Calcium Analysis application to generate an image overlay of the 247-frame phase-matched movie and selected the ROI by drawing around our cell of interest (Figure 3E, F). The Calcium Analysis application was then used to generate static and moving graphs of the normalised calcium signal in the ROI over time. We combined the moving graphs with the 247-frame phase-matched movie using FIJI (Figure 3G, H) and confirmed that the two signal peaks identifiable in our static graphs related to our cell of interest. The phase-matched movie with padding (Figure 3D) generated earlier was then used to browse the data for additional cells that generated calcium pulses. A video demonstration of this protocol, using the same example dataset, can be found in Supplementary Video 1.
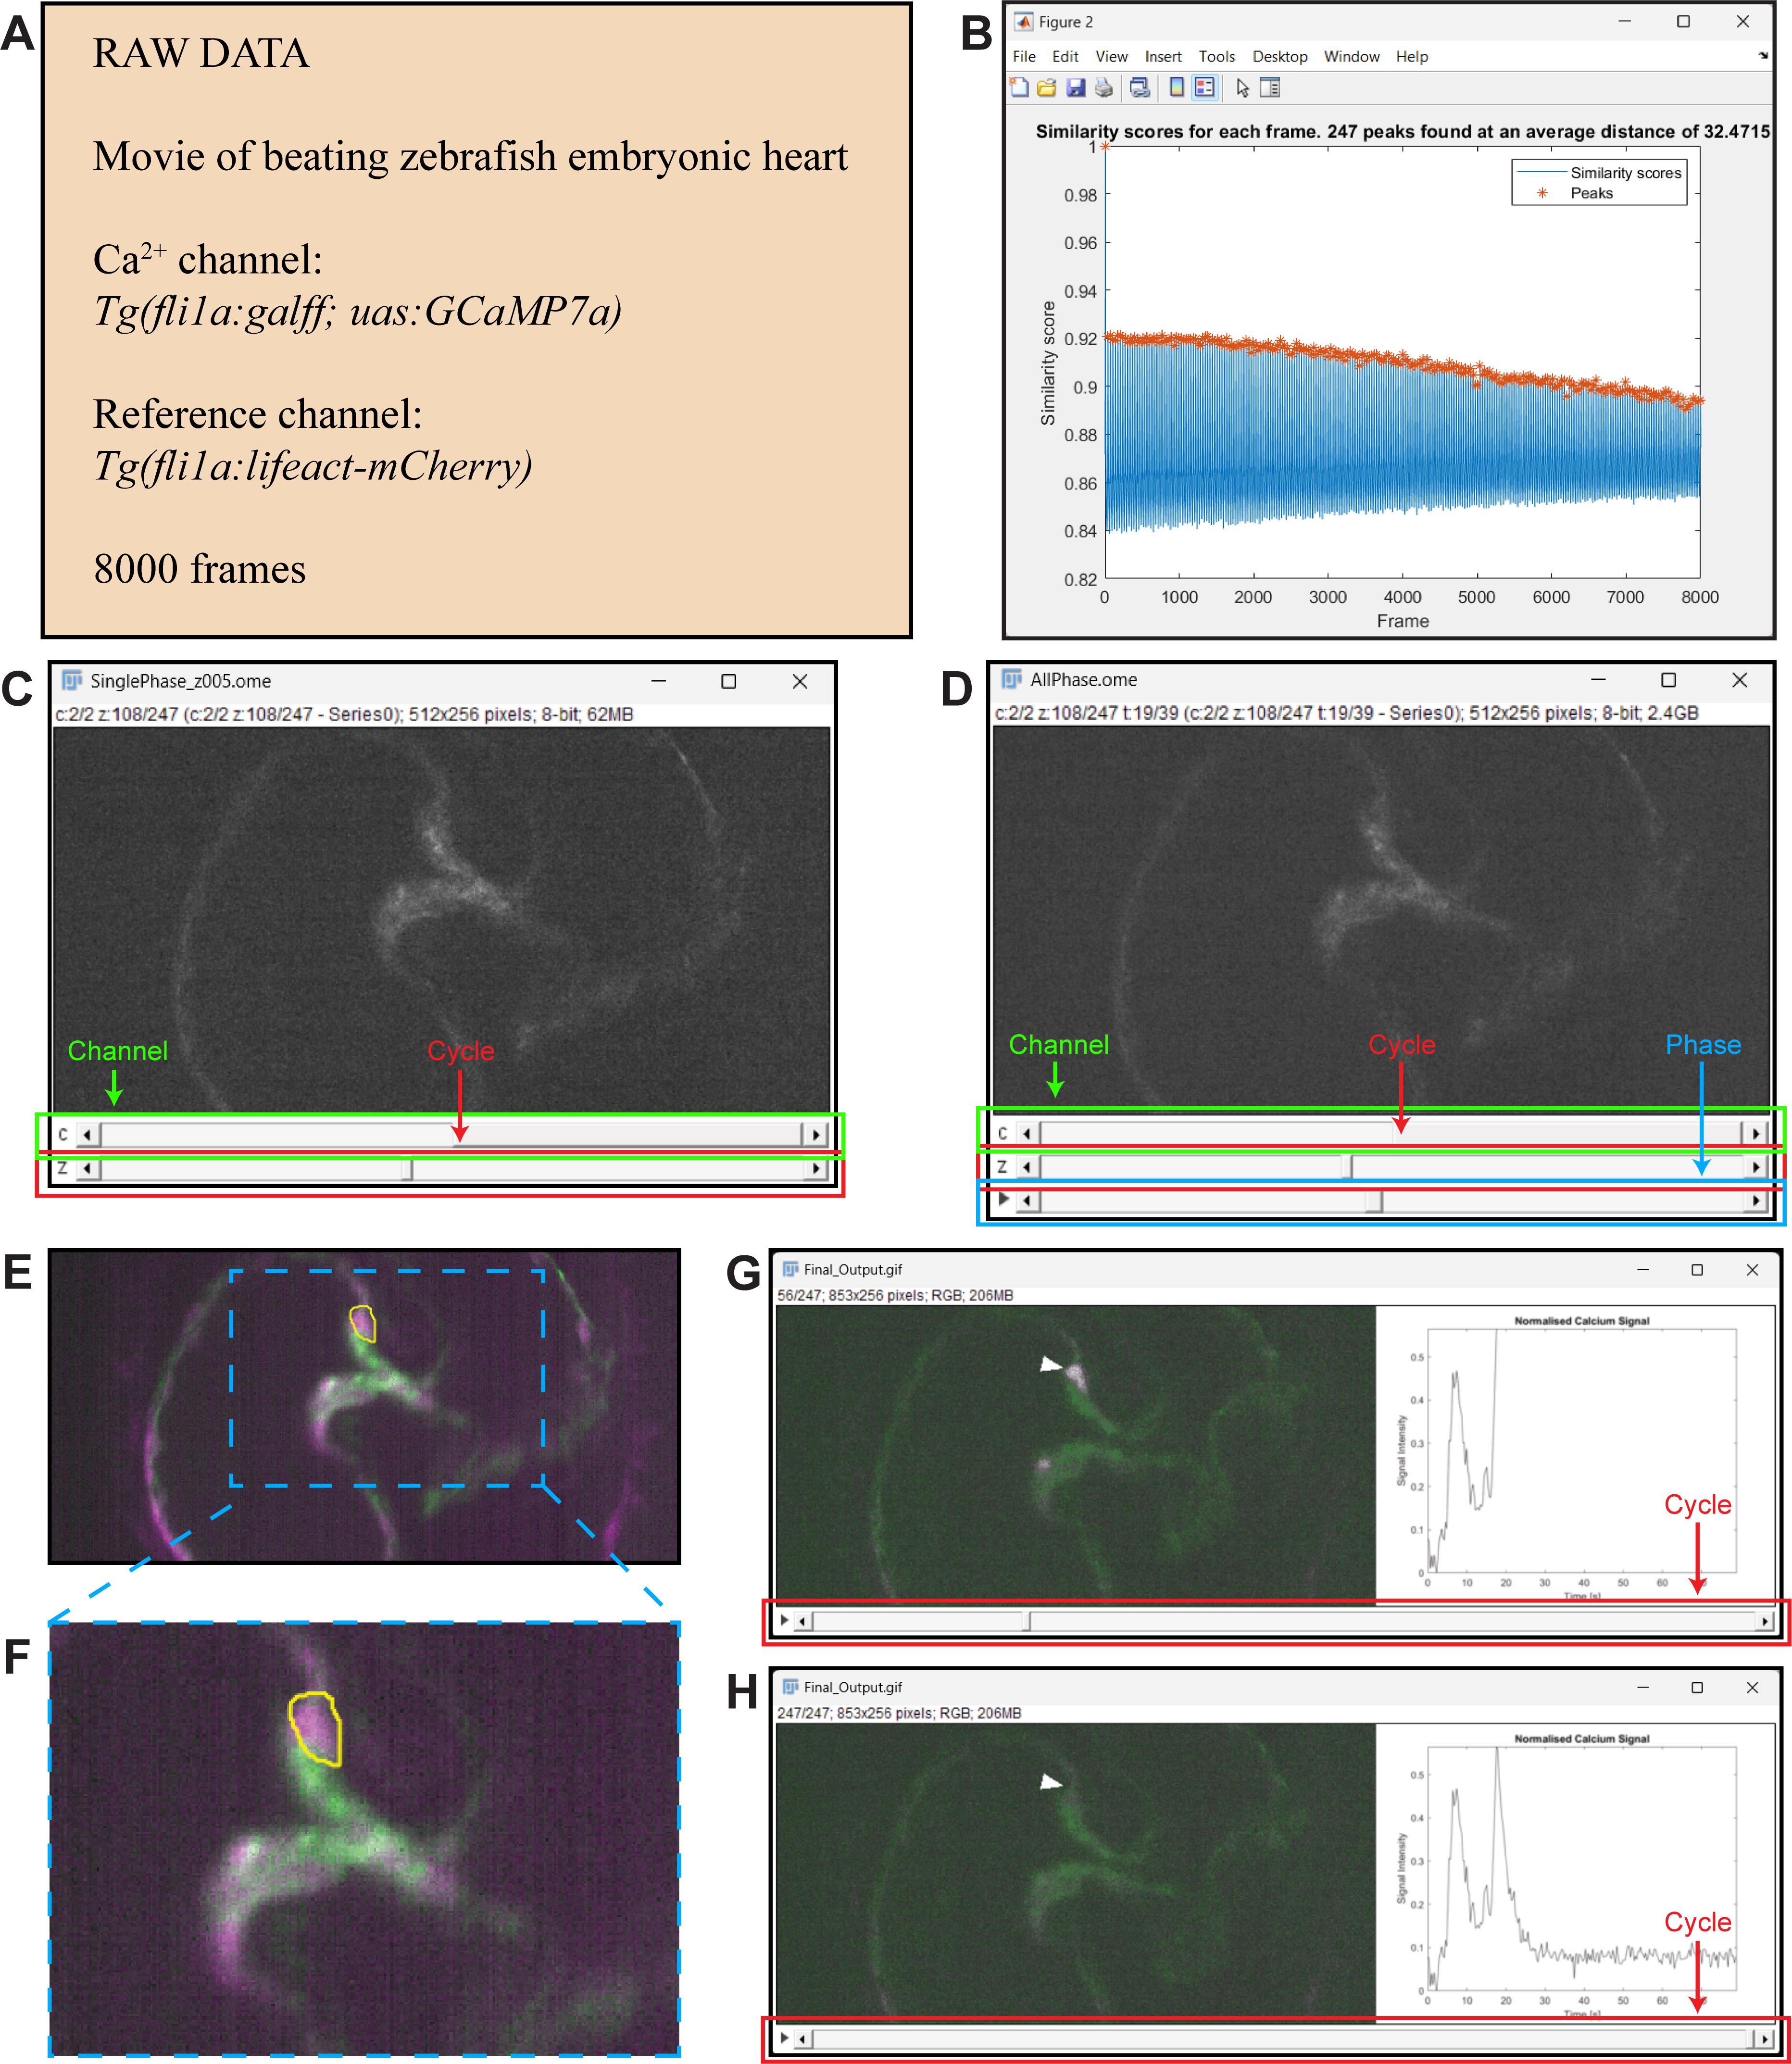
Figure 3. Example of procedure. A. Information about the raw data. B. Pop-up window that appears when the Find Peaks button is clicked in the Phase Matching application; 247 peaks were identified, corresponding to 247 cardiac cycles captured in the raw data. C–D. Outputs of the Phase Matching application as visualised in FIJI. C) Output obtained when the Save single frames option is selected. The first slider (c) allows the user to select the channel; the second slider (z) allows the user to select the cardiac cycle of interest. D) Output obtained when the Save with padding option is selected. The first slider (c) allows the user to select the channel; the second slider (z) allows the user to select the cardiac cycle of interest; the third slider (play symbol) allows the user to select the phase of the cardiac cycle. E. A region of interest (ROI) drawn by the user around a cell (ROI outline shown in yellow) within the Calcium Analysis application. F. Zoom-in box showing ROI. G–H. Final output of procedure. G) The Ca2+ signal (magenta) in the cell of interest is high ~20 s into the movie, and this is seen in the corresponding graph. H) The Ca2+ signal (magenta) in the cell of interest is low at the end of the movie, and this is seen in the corresponding graph.
Validation of protocol
This protocol has been validated in the following research article:
Fukui, H., Chow, R. W., Xie, J., Foo, Y. Y., Yap, C. H., Minc, N., Mochizuki, N., Vermot, J. (2021). Bioelectric signaling and the control of cardiac cell identity in response to mechanical forces. Science, 374 (6565), 351-354. doi: 10.1126/science.abc6229 (Figure 1, Supplementary Movie 2) [4].
General notes and troubleshooting
General notes
For our datasets, we used the Tg(fli1a:galff);(uas:GCaMP7a) line crossed to either the Tg(fli1a:h2b-mCherry)ncv31 [7] line or the Tg(fli1a:lifeact-mCherry)ncv7 line [8]. Images obtained from the following microscopes were tested:
Lightsheet Z.1 (Zeiss) equipped with 20× water immersion objective (Zeiss, 1.0 N.A.) and two cameras (PCO.edge sCMOS).
Inverted microscope (Leica, DMi8) combined with a CSUX1 confocal scanning head (Yokogawa) equipped with a 40× water objective (Leica, 1.1 N.A.) and two cameras (ORCA-Flash4.0 V2, Hamamatsu).
ECLIPSE FN1 upright microscope (Nikon) equipped with 16× water immersion objective (Nikon N16XLWD-PF, 0.80 NA, 3.0 mm WD) and combined with a Dragonfly 200 (Andor) two camera system (Andor Zyla sCMOS).
Excitation of GCaMP7a and mCherry was performed using a 488 nm and 561 nm wavelength laser line, respectively; 8 or 16-bit images with an image resolution of at least 512 × 256 pixels were captured at a frame rate of 100 frames per second.
Phase-matched movies with padding are useful for identifying cells that generate calcium pulses, while phase-matched movies without padding are recommended for measuring the calcium signal over time in a particular cell.
When cells are closely packed together, the fluorescent calcium signal from one cell can bleed into a neighbouring cell. In such cases, it is important to relate signal peaks to the cell of interest.
Troubleshooting
Problem 1: GUI application disappears behind other applications during use.
Possible cause: Application window has low display priority.
Solution: Reopen the app window each time or minimise other interfering applications.
Problem 2: GUI application may return an error in the log file.
Possible cause: User inputted incompatible parameter.
Solution: Double-check that parameters are within the bounds of the dataset and try again.
Problem 3: GUI installation may fail.
Possible cause: MATLAB runtime included is for Windows, not Mac or Linux.
Solution: Download runtime from https://au.mathworks.com/products/compiler/matlab-runtime.html.
Problem 4: Resizing windows may change the aspect ratios of graphics.
Possible cause: MATLAB does not automatically resize accordingly.
Solution: Avoid adjusting window size.
Acknowledgments
We thank Professor Naoki Mochizuki for providing the resources to generate imaging data and for his advice. We thank the Liebling Lab for their advice. We thank Zoe Suckling for testing the software and her feedback on the protocol. Renee Chow was supported by funding from the Fondation Lefoulon-Delalande and the Estate of Donald G. Paech. This project was completed as part of the Commonwealth Scientific and Industrial Research Organisation Undergraduate Research Opportunities Program through the Australian Regenerative Medicine Institute.
Author contributions: Renee Chow wrote the code used in Fukui et al. [4]. Raymond Zhang created the present improved version of the software, which includes a new phase-matching algorithm and a user-assisted manual correction function in the Phase Matching software, as well as graphical user interfaces for both the Phase Matching software and Calcium Analysis software. Hajime Fukui generated all image datasets. Raymond Zhang wrote the protocol. Julien Vermot supervised the early stages of the project. Riccardo Gherardi and Renee Chow supervised the later stages of the project.
References
- Farraj, K. L. and Zeltser, R. (2023). Embryology, Heart Tube. In: StatPearls [Internet]. Treasure Island (FL): StatPearls Publishing.
- Duchemin, A. L., Vignes, H., Vermot, J. and Chow, R. (2019). Mechanotransduction in cardiovascular morphogenesis and tissue engineering. Curr. Opin. Genet. Dev. 57: 106–116.
- Staudt, D. and Stainier, D. (2012). Uncovering the Molecular and Cellular Mechanisms of Heart Development Using the Zebrafish. Annu. Rev. Genet. 46(1): 397–418.
- Fukui, H., Chow, R. W., Xie, J., Foo, Y. Y., Yap, C. H., Minc, N., Mochizuki, N. and Vermot, J. (2021). Bioelectric signaling and the control of cardiac cell identity in response to mechanical forces. Science 374(6565): 351–354.
- Schindelin, J., Arganda-Carreras, I., Frise, E., Kaynig, V., Longair, M., Pietzsch, T., Preibisch, S., Rueden, C., Saalfeld, S., Schmid, B., et al. (2012). Fiji: an open-source platform for biological-image analysis. Nat. Methods 9(7): 676–682.
- Wang, Z., Bovik, A., Sheikh, H. and Simoncelli, E. (2004). Image Quality Assessment: From Error Visibility to Structural Similarity. IEEE Trans. Image Process. 13(4): 600–612.
- Yokota, Y., Nakajima, H., Wakayama, Y., Muto, A., Kawakami, K., Fukuhara, S. and Mochizuki, N. (2015). Endothelial Ca2+ oscillations reflect VEGFR signaling-regulated angiogenic capacity in vivo. eLife 4: e08817.
- Wakayama, Y., Fukuhara, S., Ando, K., Matsuda, M. and Mochizuki, N. (2015). Cdc42 Mediates Bmp-Induced Sprouting Angiogenesis through Fmnl3-Driven Assembly of Endothelial Filopodia in Zebrafish. Dev. Cell 32(1): 109–122.
Supplementary information
The following supporting information can be downloaded here:
- Supplementary Video 1.
Article Information
Copyright
© 2024 The Author(s); This is an open access article under the CC BY-NC license (https://creativecommons.org/licenses/by-nc/4.0/).
How to cite
Readers should cite both the Bio-protocol article and the original research article where this protocol was used:
- Zhang, R. J., Vermot, J., Gherardi, R., Fukui, H. and Chow, R. W. (2024). Calcium Signal Analysis in the Zebrafish Heart via Phase Matching of the Cardiac Cycle. Bio-protocol 14(10): e4989. DOI: 10.21769/BioProtoc.4989.
- Fukui, H., Chow, R. W., Xie, J., Foo, Y. Y., Yap, C. H., Minc, N., Mochizuki, N. and Vermot, J. (2021). Bioelectric signaling and the control of cardiac cell identity in response to mechanical forces. Science 374(6565): 351–354.
Category
Developmental Biology > Cell signaling > Intracellular calcium
Cell Biology > Cell imaging > Live-cell imaging
Do you have any questions about this protocol?
Post your question to gather feedback from the community. We will also invite the authors of this article to respond.