- Protocols

- Articles and Issues
- For Authors
- About
- Become a Reviewer

Real-Time Autophagic Flux Measurements in Live Cells Using a Novel Fluorescent Marker DAPRed
Published: Vol 14, Iss 5, Mar 5, 2024 DOI: 10.21769/BioProtoc.4949 Views: 2455
Reviewed by: Olga KopachJohn P Phelan
Original research article
The authors used this protocol in:
Mar 2023
Advertisement


Protocol Collections
Comprehensive collections of detailed, peer-reviewed protocols focusing on specific topics


Related protocols

Abstract
Autophagy is a conserved homeostatic mechanism involved in cellular homeostasis and many disease processes. Although it was first described in yeast cells undergoing starvation, we have learned over the years that autophagy gets activated in many stress conditions and during development and aging in mammalian cells. Understanding the fundamental mechanisms underlying autophagy effects can bring us closer to better insights into the pathogenesis of many disease conditions (e.g., cardiac muscle necrosis, Alzheimer’s disease, and chronic lung injury). Due to the complex and dynamic nature of the autophagic processes, many different techniques (e.g., western blotting, fluorescent labeling, and genetic modifications of key autophagy proteins) have been developed to delineate autophagy effects. Although these methods are valid, they are not well suited for the assessment of time-dependent autophagy kinetics. Here, we describe a novel approach: the use of DAPRed for autophagic flux measurement via live cell imaging, utilizing A549 cells, that can visualize and quantify autophagic flux in real time in single live cells. This approach is relatively straightforward in comparison to other experimental procedures and should be applicable to any in vitro cell/tissue models.
Key features
• Allows real-time qualitative imaging of autophagic flux at single-cell level.
• Primary cells and cell lines can also be utilized with this technique.
• Use of confocal microscopy allows visualization of autophagy without disturbing cellular functions.
Background
Autophagy is a highly conserved cellular process that removes unwanted or damaged cellular components [1,2]. Although first described as a mechanism to protect cells against starvation [3], it was later understood that autophagy has an important role in non-starving cells to maintain cellular homeostasis [4,5]. Currently, autophagy is recognized as being involved in organ development [6,7] and in coping with infections [8], environmental stressors [9], and aging [10]. It is also known that extreme cellular stress or insufficient autophagic response leads to the deterioration of cellular functions, possibly leading to cell death [11–14].
There are a number of different tools available to study autophagy [15], including electron microscopy and measurement of Atg8-family proteins [e.g., microtubule-associated protein 1A/1B-light chain 3 (LC3)] by various techniques including western blot, flow cytometry, immunofluorescent staining, or fluorescent microscopy, providing an assessment of autophagic activity. Autophagic proteins exhibit tissue- and cell-specific expression and different turnover rates. In addition, some of these approaches require cell fixation, permeabilization, or transfection of exogeneous fluorescent proteins. Since these procedures can alter the physiological expression of autophagy markers, they are not entirely suitable for the accurate assessment of autophagic flux (the rate of autophagosome formation over time, an indicator of autophagic activity) per se.
Live cell imaging is a valuable tool for studying biological processes. When combined with suitable fluorescent marker(s), it allows the visualization and quantification of complex biological processes, such as autophagy, in real time, even at single-cell resolution. Recently, a novel fluorescent dye, DAPRed, was developed for autophagy studies [16]. DAPRed is a small fluorescent molecule that is incorporated into the autophagosome membrane during the double membrane formation [16]. DAPRed allows the real-time visualization of autophagosomes (i.e., formation and subcellular tracking of autophagosomes), enabling autophagic flux measurement in living cells without the need for complex molecular techniques such as cloning or transduction. When DAPRed is combined with adequate imaging techniques, such as confocal or super resolution microscopy, it allows the study of autophagy kinetics and the interactions with other cellular processes (e.g., lysosomal degradation [17]). DAPRed has already been used in semiquantitative studies to address the activation of autophagy [18–20] or autophagic flux measurement [21]. Here, we describe a procedure for the measurement of autophagic flux in single live cells using DAPRed. This procedure involves cell stimulation with the positive control Rapamycin to induce autophagy and marking the plasma membrane with a fluorescently tagged tomato lectin for high spatial precision for single-cell DAPRed fluorescence detection. Autophagy is a dynamic biological process in which autophagosomes are generated and consumed upon merging with lysosomes. Autophagic activity is best described by autophagic flux, which is the rate of autophagosome generation over time. In this protocol, we explain the importance of inhibiting autophagosome–lysosome fusion and the conditions for correctly determining autophagic flux.
Materials and reagents
Polycarbonate Transwell® (tissue culture treated, permeable support of 1.13 cm2 or 12 mm diameter), 12-well plate (Costar, catalog number: 3401)
Centrifuge tubes, 15 mL (VWR, catalog number: 89039-670)
Centrifuge tubes, 50 mL (VWR, catalog number: 89079-494)
N-(2-hydroxyethyl)-piperazine-N'-(2-ethanesulfonic acid) hemisodium salt (HEPES) solution (Sigma-Aldrich, catalog number: H0887)
Dulbecco's modified Eagle's medium/nutrient mixture Ham's F-12 medium (DME/F-12) (Sigma-Aldrich, catalog number: 6421) including 15 mM HEPES and sodium bicarbonate, without L-glutamine
Fetal bovine serum (HyClone, catalog number: SH30071.03)
Bovine serum albumin (Jackson ImmunoResearch Laboratories, catalog number: 001-000-162)
L-Glutamine (Sigma-Aldrich, catalog number: G7513)
Nonessential amino acid solution (Sigma-Aldrich, catalog number: M7145)
Penicillin-Streptomycin (Sigma-Aldrich, catalog number: P4333)
Primocin (VWR, catalog number: MSPP-ANTPM1)
Dimethyl sulfoxide (DMSO) (Sigma-Aldrich, catalog number: D8418)
Microscope cover glass, 22 mm × 22 mm, No. 1. (Denville Scientific Inc., catalog number: M1100-01)
DAPRed (Dojindo Molecular Technologies, catalog number: D677-10)
Chloroquine diphosphate salt (Sigma-Aldrich, catalog number: C6628)
Rapamycin (Selleck Chemical, catalog number: s1039)
Dylight 488-conjugated tomato lectin (Vector Laboratories, catalog number: DL-1174-1)
Hoechst 33342 (Sigma-Aldrich, catalog number: H6024)
Human lung adenocarcinoma cell line A549 (ATCC, catalog number: CCL-185)
Solutions
A549 cell culture medium (MDS) (see Recipes)
Krebs-Ringer solution (see Recipes)
Recipes
A549 cell culture medium (MDS)
DME/F-12 medium supplemented with 10% fetal bovine serum, 1 mM nonessential amino acid solution, 100 U/mL primocin, 10 mM HEPES, 1.25 mg/mL bovine serum albumin, 2 mM L-glutamine, and 1 U penicillin-streptomycin.
Krebs-Ringer solution
136 mM NaCl, 4.7 mM KCl, 1 mM NaH2PO4, 1 mM CaCl2, 1 mM MgSO4, 20 mM HEPES, 1 mM D-glucose. Adjust pH to 7.4.
Equipment
FormaTM Series II Water-Jacketed CO2 incubator (Thermo Scientific, model: 3110)
Centrifuge (Eppendorf, model: 5424)
Confocal microscope (Leica Microsystems, model: Leica STELLARIS 8)
Temperature-controlled chamber: Ludin chamber type 1 (Life Imaging Services, Switzerland)
Software and datasets
Leica LAS 3D Process and Quantify Packages (Leica Microsystems)
ImageJ (National Institutes of Health)
Microsoft Excel
Procedure
Plate A549 cells onto Transwell filters at 100,000 cells/1.13 cm2 and culture until reaching 80% confluence (typically until culture day 4).
Note: Cell culturing parameters, including culturing substrate, plating density, level of confluency, and time to reach desired confluency should be adjusted individually to different cell/tissue types.
Freshly prepare chloroquine [water soluble; vehicle: culture fluid (MDS) (see Recipes)], an inhibitor of autophagosome fusion with lysosome (stock solution: 40 mM), and add to the culture fluid to reach 40 μM final concentration on both apical and basolateral sides for 1 h before imaging; the control should receive culture fluid alone.
Note: Live cell imaging is carried out with and without chloroquine with different sets of cells.
Add DAPRed [0.1 μM; lipid soluble; vehicle: 0.1% (v/v) DMSO] (1 μL) to the culture fluid in the apical compartment for 30 min before imaging.
To label cell plasma membranes, remove culture fluid and apply Dylight 488-conjugated tomato lectin (5 μg/mL: 5 μL from stock of 1 mg/mL) directly onto the apical surface of the cells just prior to imaging.
Note: Although Dylight 488 proved to be resistant to photobleaching in our hands, it is advisable to avoid unnecessary light exposure.
Carefully cut out the Transwell filter with the cell monolayer of interest grown on it using a scalpel along the rim. Mount the Transwell filter with monolayer on a coverslip and add Krebs-Ringer solution (~1–2 mL), as a bathing solution, to the coverslip chamber.
Live cell imaging:
Perform confocal imaging at 63× magnification, 12 bit, and 1,024 × 1,024 resolution with an SP8 confocal microscope system.
In xyz series, measure intracellular fluorescence intensity (DAPRed: 561/570–600 nm, Dylight 488-conjugated tomato lectin: 488/490–530 nm) stack by stack over the entire volume of a single, live A549 cell.
Aim to zoom in sufficiently to get to the level of ~150–200 nm/pixel, which is the resolution limit of current confocal microscopy approaches, and to include as many cells as possible.
Using the signal of Dylight 488-conjugated tomato lectin, set the upper limit for xyz series. For a typical A549 cell, this is 60 × 60 × 20 μm for x, y, and z dimensions, respectively.
Move the objective in the opposite direction to find the lower limit for xyz series (i.e., where the fluorescence signal is lost) and set the sectioning interval between 0.35 and 0.5 μm. This seems to be the most practical interval to produce detailed 3D image quality of autophagosomes in live A549 cells while avoiding phototoxicity and photobleaching caused by more aggressive laser scanning.
Data analysis
Live cell imaging approach: measure DAPRed fluorescence intensity in a single live A549 cell in a stack-by-stack mode and integrate over the entire volume of the cell.
Open image file in ImageJ.
Separate fluorescence channels (DAPRed and Dylight 488-conjugated tomato lectin) in ImageJ software (ImageJ: image/color/split channels).
Use the plasma membrane marker Dylight 488-conjugated tomato lectin to delineate the area of cytoplasm in which fluorescence of DAPRed needs to be measured.
Have the two fluorescence channels open next to each other in two separate windows (see step 1b above).
Synchronize windows (ImageJ: analyze/tools/synchronize windows).
Click on the DAPRed channel and delineate the border of the cell to be measured [create an ROI (Region of Interest)], which is guided by the synchronized cursor of plasma membrane marker.
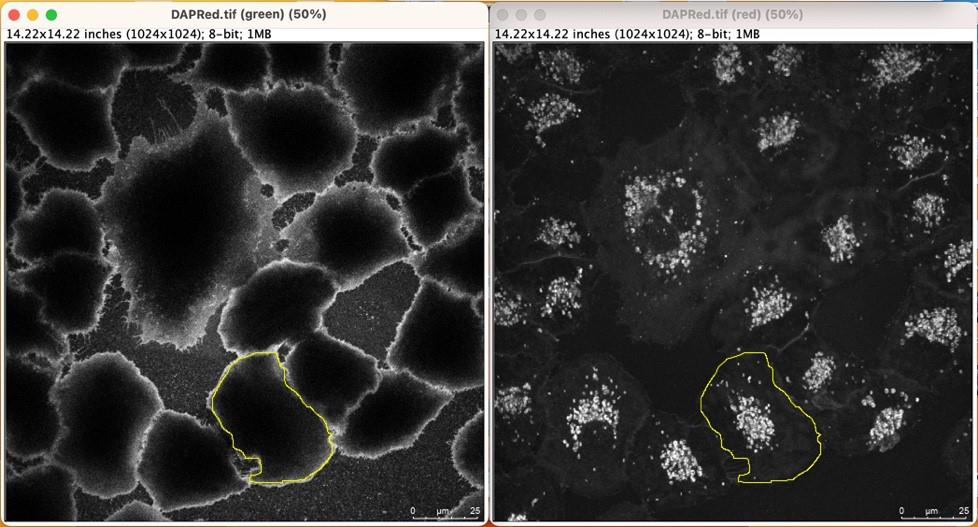
Figure 1. Representative image showing plasma membrane–guided ROI selection. Plasma membrane markers (e.g., Dylight 488-conjugated tomato lectin, left panel) can help precisely delineate the cytosolic border of individual cells (e.g., A549 cells). Plasma membrane–guided ROIs (yellow highlighted areas) were drawn, and measurement was conducted in the DAPRed channel (right panel).Measure DAPRed fluorescence in the ROI in the yellow highlighted area (Figure 1) and export the measured DAPRed fluorescence intensity to Microsoft Excel for subsequent calculations.
Calculation of autophagic flux:
(1) Øcontrol = Fcontrol (with chloroquine) - Fcontrol (without chloroquine)
(2) Øexposure = (Fexposure (with chloroquine) - Fexposure (without chloroquine)) - Øcontrol
Ø: autophagic flux
F: DAPRed fluorescence intensity
Representative data
We recently published an article using this method to assess the kinetics of autophagy in nanoparticle-exposed A549 cells [17]. We also successfully applied this method for autophagy flux detection in rat alveolar epithelial cell monolayers. An in-depth characterization of DAPRed, including an assessment of its photobleaching, was provided in collaboration with the manufacturer [16]. In addition, here we provide a representative dataset in which Rapamycin, an autophagy inducer, was used to stimulate autophagy (Figure 2) and a video showing typical DAPRed labeling (Video 1).
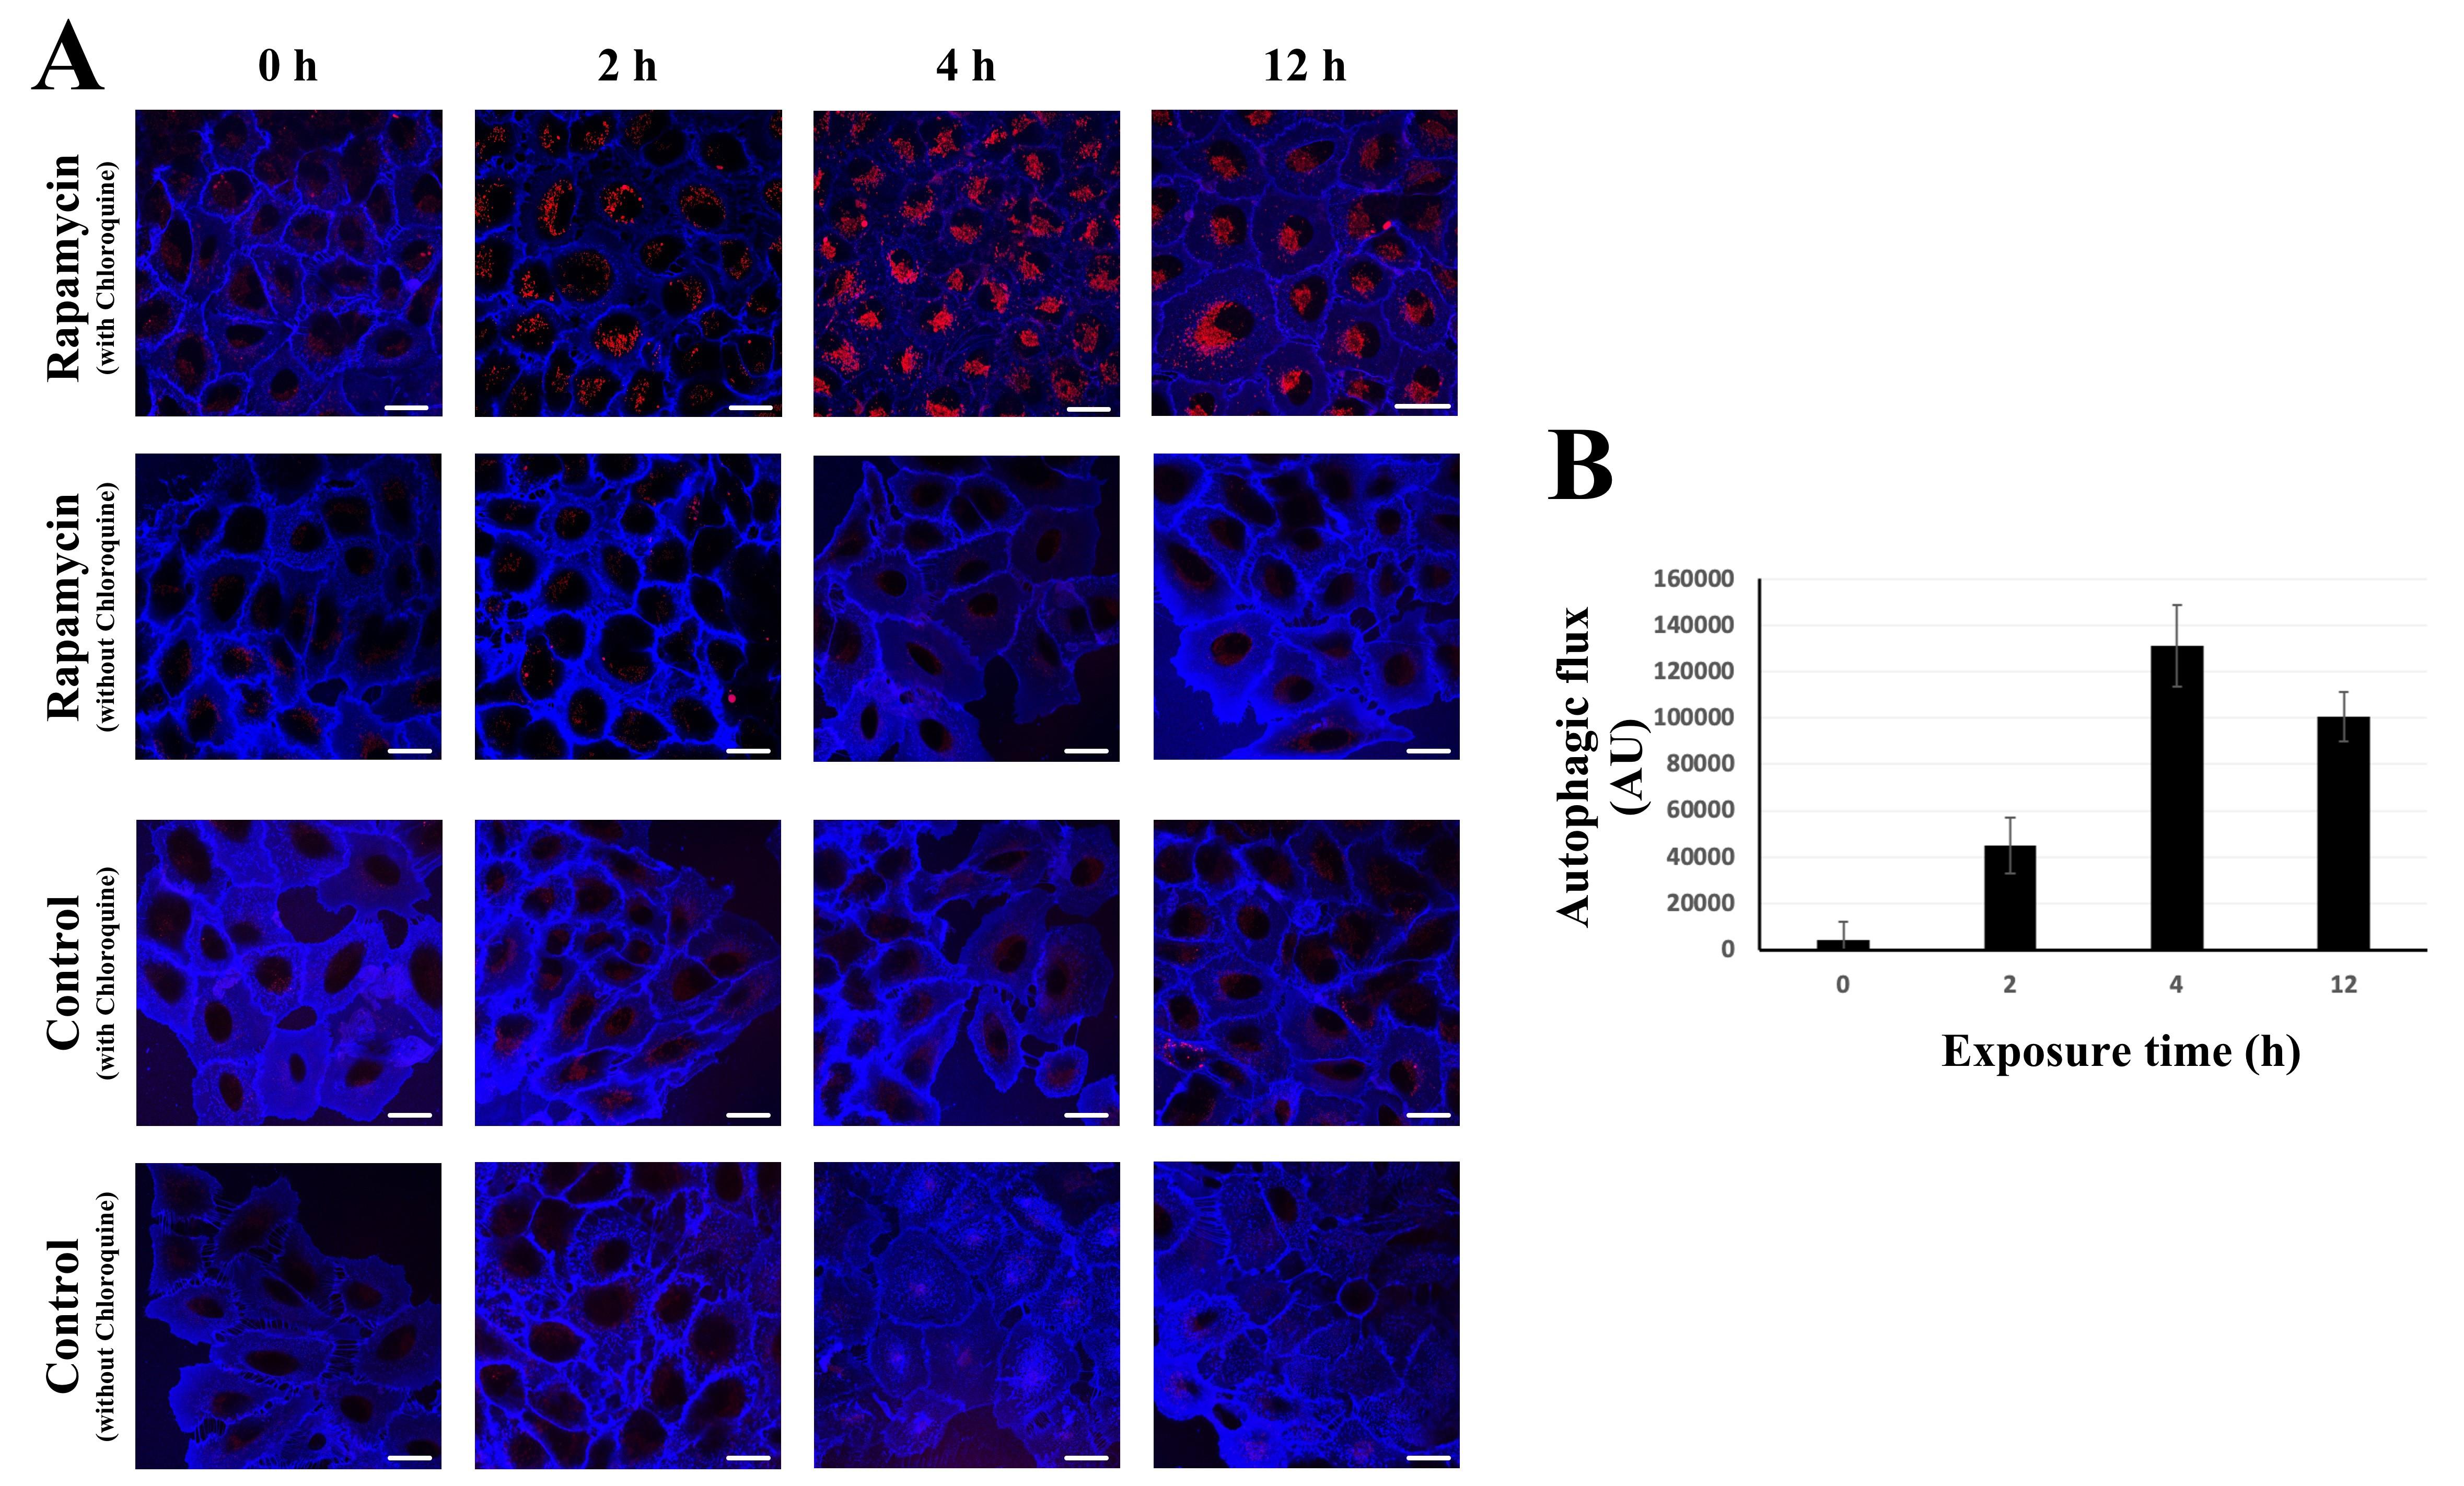
Figure 2. Autophagic flux measurement using DAPRed in single live A549 cells. A. Representative images showing time-dependent activation of autophagic marker DAPRed (red) in A549 cells upon 50 nM Rapamycin exposure. Rapamycin activates autophagy by repressing the activity of the mammalian target of Rapamycin complex 1 (mTORC1). Exposure times are shown above images. Images were captured at a single focal plane representing one cross-section only of the cells. For quantifications (see panel B), DAPRed fluorescence was combined from multiple focal planes covering the entire volume of a single cell. The plasma membrane was labeled by Dylight 405-conjugated tomato lectin to differentiate extracellular from intracellular space and fluorescent signal arising from adjacent cells (see Figure 1). Scale bars, 25 µm. B. Rapamycin-induced (50 nM) autophagic flux. Quantification of autophagic flux measured via DAPRed method was carried out using the formula described in Data analysis. Each time point represents a different set of A549 cells. Cells at each condition were imaged for a short (< 30 min) period of time. n = 7–8.

Validation of protocol
This protocol or parts of it has been used and validated in the following research article(s):
Sipos, A., Kim, K. J., Sioutas, C. and Crandall, E. D. (2023). Kinetics of autophagic activity in nanoparticle-exposed lung adenocarcinoma (A549) cells. Autophagy Rep. 2(1): e2186568.
Data in this research article (Figures 1–6) were generated using the methods described in this current Bio-protocol paper.
General notes and troubleshooting
Detector sensitivity should be adjusted in a way that avoids oversaturated DAPRed signal. For this, under maximal autophagic activity (e.g., in our case, 3–4 h of Rapamycin stimulation), set the detector gain to a level where no oversaturated pixels are present. If needed, increase signal detection from 8 to 12 bit.
A 1,024 × 1,024 resolution is optimal for single-cell analysis. Lower resolution, although it allows faster scanning with less phototoxicity, does not provide the needed spatial resolution. By choosing resolutions higher than 1,024 × 1,024, it may be possible to gain more detailed spatial information. However, increasing the resolution beyond 1,024 × 1,024 was not practical in our experiments, since it also increased the pixel dwell time, predisposing the cells and intracellular organelles to phototoxicity.
DAPRed showed minimal to no photobleaching under optimized, moderate (laser intensity < 10% power) imaging conditions [16].
Photobleaching can be a potential source of artifacts when (typically older) confocal and fluorescent microscopes are used. However, recent developments in detector systems, especially with the Leica Hybrid detectors we utilized for this work, exhibit drastically decreased photobleaching due to their improved sensitivity and increased scanning speed. In our setup, a 561 nm laser was used at 2.5% full power. In addition, pixel dwell time was 0.6 µs while imaging time at a certain region was < 5–8 min. Finally, imaging was performed in a sequential fashion, meaning that quantitative imaging of the DAPRed signal is collected first, followed by qualitative imaging of the plasma membrane marker Dylight 488-conjugated tomato lectin.
Laser power was kept constant (488 nm: 2%, 561 nm: 2.5% full power) during the entire experiment to be able to compare different datasets.
Acknowledgments
This work was supported in part by the Will Rogers Motion Picture Pioneers Foundation, Whittier Foundation and Hastings Foundation. E.D.C. is Hastings Professor in the Keck School of Medicine. This protocol is based on Sipos et al. [17].
Competing interests
Authors declare no conflict of interest.
References
- Kobayashi, S. (2015). Choose Delicately and Reuse Adequately: The Newly Revealed Process of Autophagy. Biol. Pharm. Bull. 38(8): 1098–1103.
- Parzych, K. R. and Klionsky, D. J. (2014). An Overview of Autophagy: Morphology, Mechanism, and Regulation. Antioxid. Redox Signal 20(3): 460–473.
- Ashford, T. P. and Porter, K. R. (1962). Cytoplasmic components in hepatic cell lysosomes. J. Cell Biol. 12(1): 198–202.
- Mizushima, N. and Komatsu, M. (2011). Autophagy: Renovation of Cells and Tissues. Cell 147(4): 728–741.
- Ryter, S. W., Cloonan, S. M. and Choi, A. M. (2013). Autophagy: A Critical Regulator of Cellular Metabolism and Homeostasis. Mol. Cells 36(1): 7–16.
- Cecconi, F. and Levine, B. (2008). The Role of Autophagy in Mammalian Development: Cell Makeover Rather than Cell Death. Dev. Cell 15(3): 344–357.
- Yeganeh, B., Lee, J., Ermini, L., Lok, I., Ackerley, C. and Post, M. (2019). Autophagy is required for lung development and morphogenesis. J. Clin. Invest. 129(7): 2904–2919.
- Deretic, V., Saitoh, T. and Akira, S. (2013). Autophagy in infection, inflammation and immunity. Nat. Rev. Immunol. 13(10): 722–737.
- Martínez-García, G. G. and Mariño, G. (2020). Autophagy role in environmental pollutants exposure. Prog. Mol. Biol. Transl. Sci. 172: 257–291.
- Aman, Y., Schmauck-Medina, T., Hansen, M., Morimoto, R. I., Simon, A. K., Bjedov, I., Palikaras, K., Simonsen, A., Johansen, T., Tavernarakis, N., et al. (2021). Autophagy in healthy aging and disease. Nat. Aging 1(8): 634–650.
- Codogno, P. and Meijer, A. J. (2005). Autophagy and signaling: their role in cell survival and cell death. Cell Death Differ. 12: 1509–1518.
- Denton, D. and Kumar, S. (2018). Autophagy-dependent cell death. Cell Death Differ. 26(4): 605–616.
- Doherty, J. and Baehrecke, E. H. (2018). Life, death and autophagy. Nat. Cell Biol. 20(10): 1110–1117.
- Green, D. R. and Levine, B. (2014). To Be or Not to Be? How Selective Autophagy and Cell Death Govern Cell Fate. Cell 157(1): 65–75.
- Klionsky, D. J., Abdel-Aziz, A. K., Abdelfatah, S., Abdellatif, M., Abdoli, A., Abel, S., Abeliovich, H., Abildgaard, M. H., Abudu, Y. P., Acevedo-Arozena, A., et al. (2021). Guidelines for the use and interpretation of assays for monitoring autophagy (4th edition). Autophagy 17(1): 1–382.
- Sakurai, H. T., Iwashita, H., Arakawa, S., Yikelamu, A., Kusaba, M., Kofuji, S., Nishina, H., Ishiyama, M., Ueno, Y., Shimizu, S., et al. (2023). Development of small fluorescent probes for the analysis of autophagy kinetics. iScience 26(7): 107218.
- Sipos, A., Kim, K. J., Sioutas, C. and Crandall, E. D. (2023). Kinetics of autophagic activity in nanoparticle-exposed lung adenocarcinoma (A549) cells. Autophagy Rep. 2(1): e2186568.
- Fang, H., Geng, S., Hao, M., Chen, Q., Liu, M., Liu, C., Tian, Z., Wang, C., Takebe, T., Guan, J. L., et al. (2021). Simultaneous Zn2+ tracking in multiple organelles using super-resolution morphology-correlated organelle identification in living cells. Nat. Commun. 12(1), doi: 10.1038/S41467-020-20309-7.
- Sun, H., Wang, R., Liu, Y., Mei, H., Liu, X. and Peng, Z. (2021). USP11 induce resistance to 5-Fluorouracil in Colorectal Cancer through activating autophagy by stabilizing VCP. J. Cancer 12(8): 2317–2325.
- Wang, B., Zhang, J., Lu, Y., Peng, L., Yuan, W., Zhao, Y. and Zhang, L. (2021). ChaiQi Decoction Alleviates Vascular Endothelial Injury by Downregulating the Inflammatory Response in ApoE-Model Mice. Evid. Based Complement. Alternat. Med. 2021: 1–10.
- Oh, C. k., Dolatabadi, N., Cieplak, P., Diaz-Meco, M. T., Moscat, J., Nolan, J. P., Nakamura, T. and Lipton, S. A. (2022). S-Nitrosylation of p62 Inhibits Autophagic Flux to Promote α-Synuclein Secretion and Spread in Parkinson's Disease and Lewy Body Dementia. J. Neurosci. 42(14): 3011–3024.
Article Information
Copyright
© 2024 The Author(s); This is an open access article under the CC BY-NC license (https://creativecommons.org/licenses/by-nc/4.0/).
How to cite
Sipos, A., Kim, K. J., Alvarez, J. R. and Crandall, E. D. (2024). Real-Time Autophagic Flux Measurements in Live Cells Using a Novel Fluorescent Marker DAPRed. Bio-protocol 14(5): e4949. DOI: 10.21769/BioProtoc.4949.
Category
Cell Biology > Cell-based analysis > Autophagic activity
Cell Biology > Cell imaging > Confocal microscopy
Do you have any questions about this protocol?
Post your question to gather feedback from the community. We will also invite the authors of this article to respond.