- Protocols

- Articles and Issues
- For Authors
- About
- Become a Reviewer

In vitro Assay to Examine the Function of Tears on Corneal Epithelial Cells

Published: Vol 14, Iss 1, Jan 5, 2024 DOI: 10.21769/BioProtoc.4910 Views: 2713
Reviewed by: Alberto RissoneAbhishek vatsAnonymous reviewer(s)
Original research article
The authors used this protocol in:

Feb 2023
Advertisement


Protocol Collections
Comprehensive collections of detailed, peer-reviewed protocols focusing on specific topics


Related protocols

Abstract
Tears contain numerous secreted factors, enzymes, and proteins that help in maintaining the homeostatic condition of the eye and also protect it from the external environment. However, alterations to these enzymes and/or proteins during pathologies such as mechanical injury and viral or fungal infections can disrupt the normal ocular homeostasis, further contributing to disease development. Several tear film components have a significant role in curbing disease progression and promoting corneal regeneration. Additionally, several factors related to disease progression are secreted into the tear film, thereby serving as a valuable reservoir of biomarkers. Tears are readily available and can be collected via non-invasive techniques or simply from contact lenses. Tears can thus serve as a valuable and easy source for studying disease-specific biomarkers. Significant advancements have been made in recent years in the field of tear film proteomics, lipidomics, and transcriptomics to allow a better understanding of how tears can be utilized to gain insight into the etiology of diseases. These advancements have enabled us to study the pathophysiology of various disease states using tear samples. However, the mechanisms by which tears help to maintain corneal homeostasis and how they are able to form the first line of defense against pathogens remain poorly understood and warrant detailed in vitro studies. Herein, we have developed an in vitro assay to characterize the functional importance of patient isolated tears and their components on corneal epithelial cells. This novel approach closely mimics real physiological conditions and could help the researchers gain insight into the underlying mechanisms of ocular pathologies and develop new treatments.
Key features
• This method provides a new technique for analyzing the effect of tear components on human corneal epithelial cells.
• The components of the tears that are altered in response to diseases can be used as a biomarker for detecting ocular complications.
• This procedure can be further employed as an in vitro model for assessing the efficacy of drugs and discover potential therapeutic interventions.
Keywords: Ocular diseasesBackground
Tears are a vital component of the ocular surface, serving as a first line of defense against pathogens and extreme changes in the environment [1, 2] One of the main functions of tears is to act as lubricant, keeping the eye moist while also protecting it from physical damage [2]. Tears also help to maintain conjunctival and corneal health by providing nutrition, regulating optical properties, and boosting tissue cooling. The unique composition of tears also protects the ocular surface against various bacterial, fungal, and viral infections. The tear film is comprised of three layers: the innermost mucous layer, the middle aqueous part, and the outermost lipid layer. The biological composition of metabolites, electrolytes, mucins, lipids, water, proteins, salts, and organic molecules that are present in tears can be used to distinguish healthy and diseased states [1]. Several studies have shown how tears can be used as an indicator of ocular health and pathology, for example in diabetic retinopathy [3], dry eye disease [4], glaucoma, Graves’ ophthalmopathy, and in some ocular tumors [5, 6].
Given that tears are readily available and can be collected via non-invasive procedures, they have recently been recognized as more valuable tools in the identification of ocular health and in the diagnosis of diseased states when compared to other biological fluids. Therefore, studies are being dedicated towards characterizing the composition of tears and understanding how changes in this composition relate to pathology. In several ocular disorders, tears have been proposed to promote inflammation, and the precise secretome of the tears directly relates to the ocular microenvironment [6]. However, characterizing how tears affect ocular health and more specifically how tears affect corneal epithelial cells remains poorly understood. Herein, we describe procedures that can be easily implemented to study how healthy vs. diseased tears affect the corneal epithelial cells in vitro. This protocol is based on our recently published paper, which focuses on how the tear proteins of Persistent Epithelial Defect (PED) patients have the potential to alter the inflammatory, fibrotic, and corneal epithelial barrier profile of other healthy cornea cells [7]. Taken together, we can infer that patient-derived tears can be a valuable source of factors to create a disease-specific in vitro model to study the key features of the pathology. This system can also be used to study the patient-specific clinicopathological features.
There are standard protocols describing the methods for collecting tears, extracting the protein, and using it for biochemical characterization, proteomic analysis, and inflammatory cytokines analysis. Recently, tears have been explored as a non-invasive method to identify disease-specific markers. Recent reports highlight the presence of exosomes in keratoconus tears, hypothesized as a communication vehicle [8]. The in vitro model used for studying disease pathology, such as in dry eye, allergy, or inflammatory models, is based on using a single growth factor/cytokine, which does not represent the actual pathology, as the disease state is governed by multiple factors such as cytokines, growth factors, and metabolites. The novel aspect of the described protocol is the use of patient-derived factors in the form of tears, which is the true representation of the diseased state (including growth factors, cytokines, and metabolites). Co-culturing patient-specific and control tears with relevant cells (corneal epithelial cells in this case) will provide an in vitro model that truly depicts the diseased state, whereas the healthy individual will be taken as a control. To the best of our knowledge, the ease of collecting tears and using it as a supplement in cell culture has never been explored previously, and this is the first study describing the detailed methodology for establishing a tear-based in vitro model of ocular diseases.
This protocol highlights the effect of patient-derived tears on corneal epithelial cells’ morphology and gene expression pattern. The procedure to collect tears can be done using either the Schirmer strip or the plastic capillary tube method. Sampling with Schirmer strip is relatively easy, rapid, reliable, and free of risk, whereas obtaining tears from capillary tube requires a degree of practice and experience; this procedure is also interrupted by blinking and the investigator needs to hold the tube for the duration of the sampling process. Hence, the protocol developed using the Schirmer’s test strip is easy to carry out, reproducible, and can be used to further understand ocular disease progression. Proteins are isolated post tear collection using the Schirmer’s test strip from both healthy and diseased individuals. Isolated proteins are then used to treat human corneal limbal epithelial (HCLE) cells at a specified concentration for a defined period (48 h in our study) until visual changes are observed. Next, morphological changes in inflammatory or fibrotic gene expression are recorded and studied. Matrix metalloproteinases (MMPs) are iron- and calcium-dependent enzymes that degrade the corneal collagen and the extracellular matrix. The level of MMP9 activity in the tear fluids has been regarded as an indicator of ocular inflammation and damage in dry eye disease, vernal keratoconjunctivitis, and glaucoma. Thus, MMP9 activity of the tears of PED patients has been studied via gelatin zymography and is represented in Figure 1. This novel assay uses tear fluid as a medium for testing and analyzing biomarkers, allowing for a more cost-effective and non-invasive diagnosis. The technique is also beneficial for tracking disease progression, as it can be used to detect changes in biomarkers over time. Furthermore, this method presents a convenient and time-saving method for healthcare professionals to monitor the health of their patients. Tears can be used for in vitro drug testing as a more effective and efficient means to test for the efficacy and safety of drugs. This model also mimics the in vivo conditions and is thus useful in drug testing.
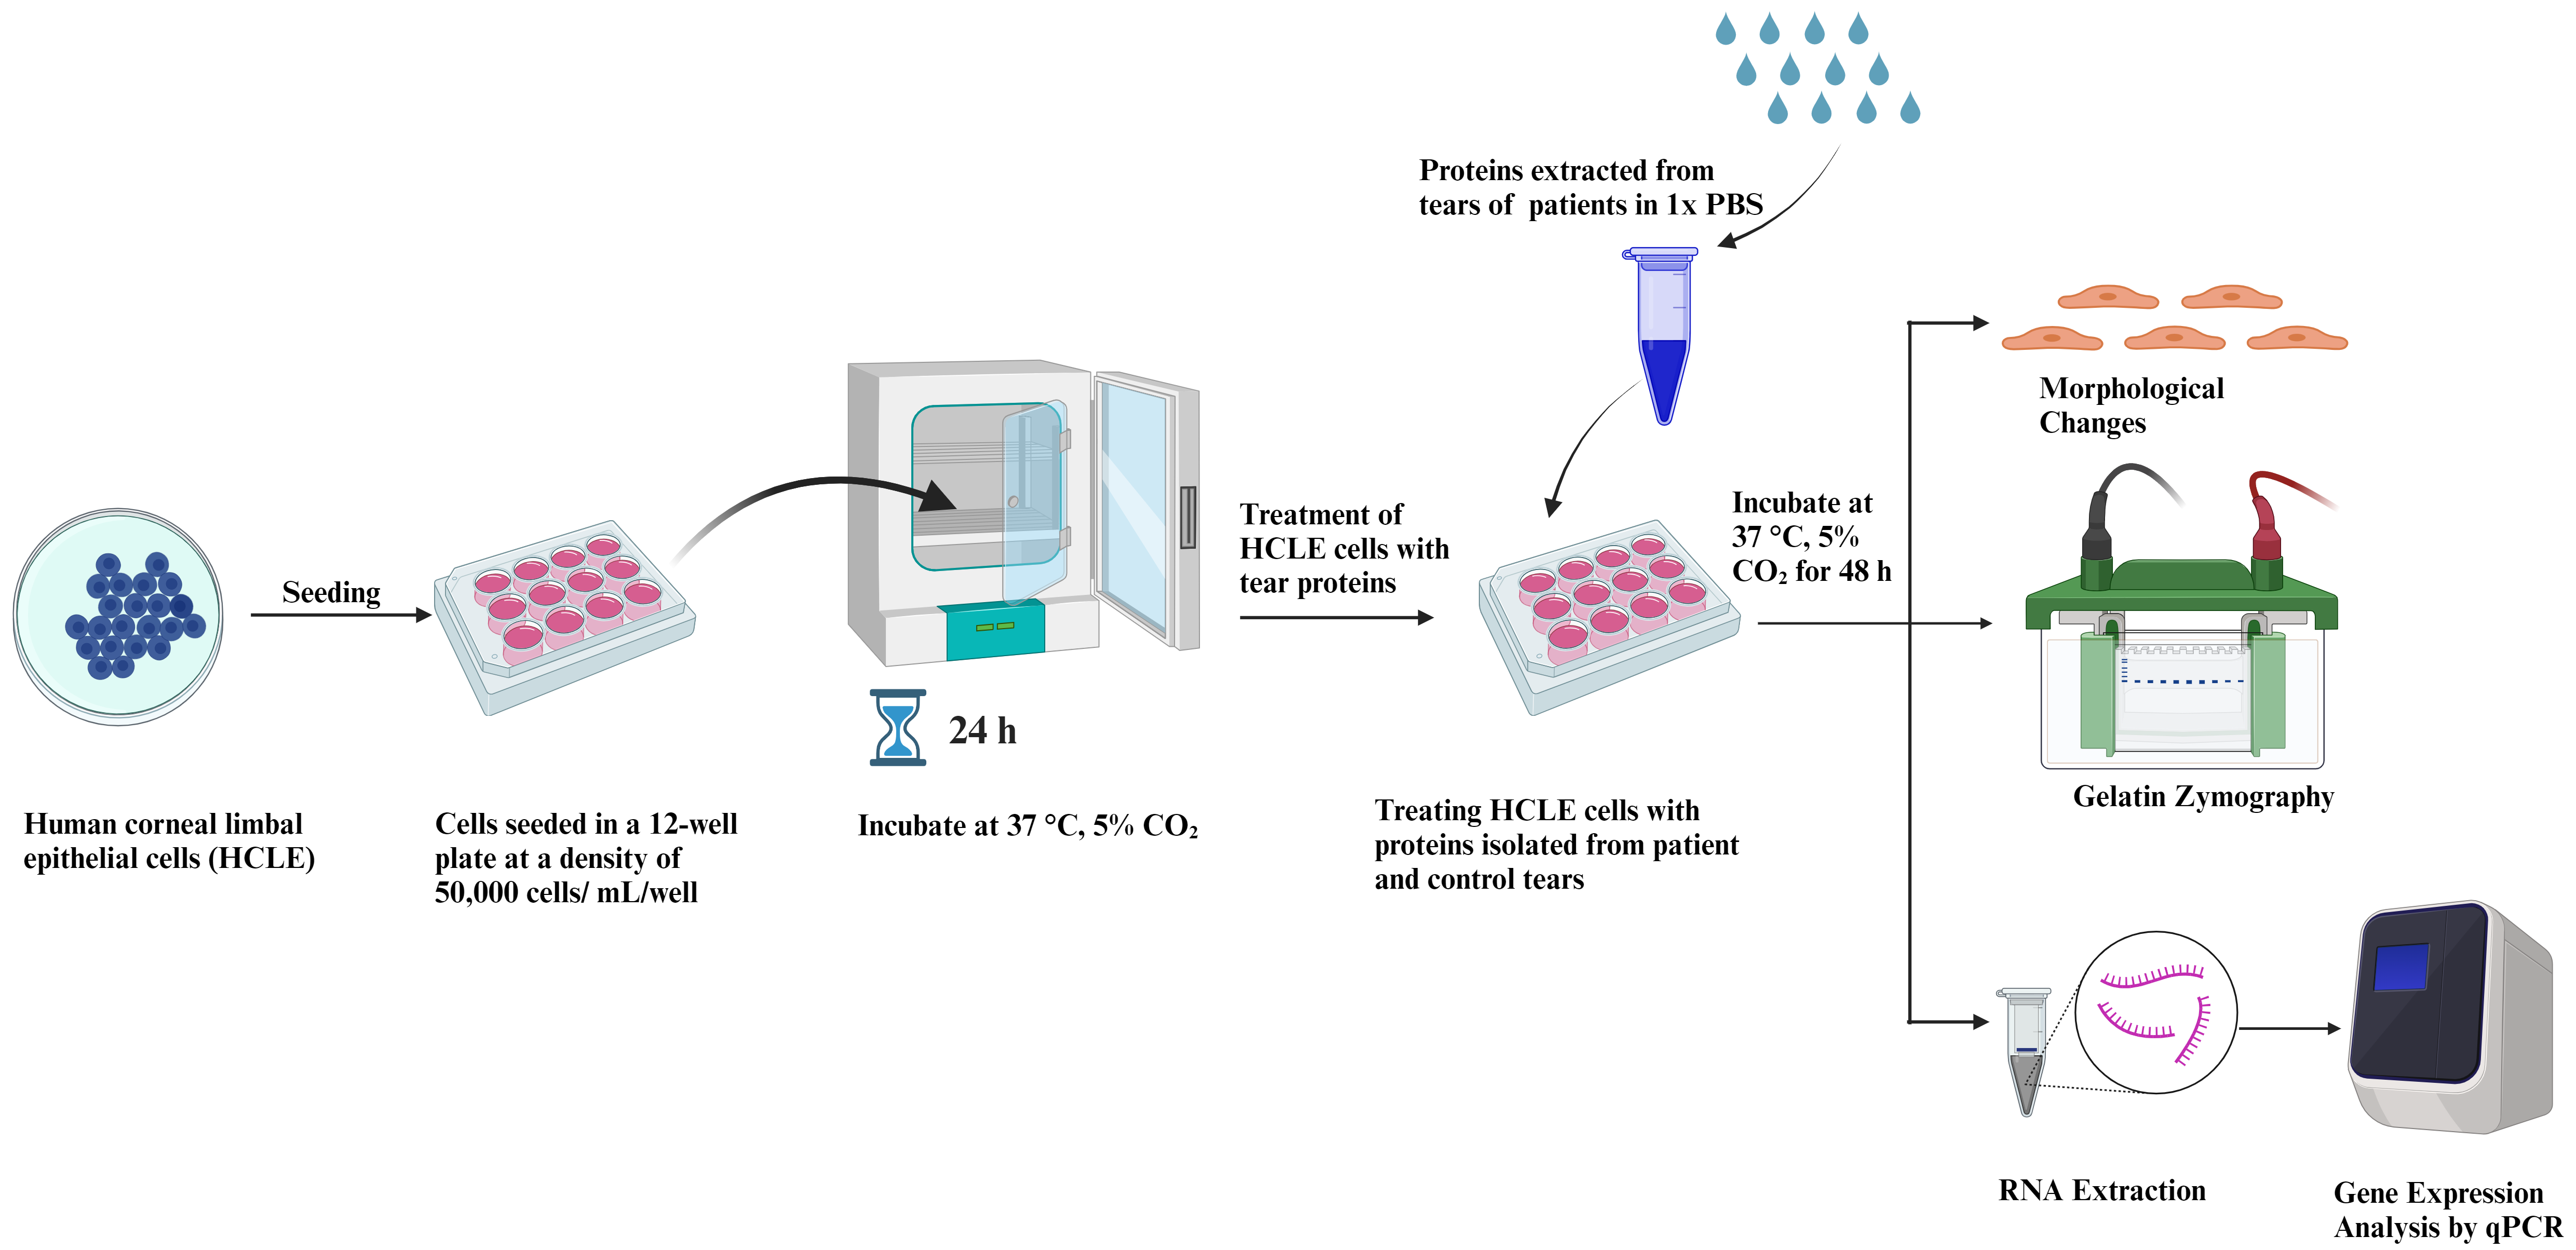
Figure 1. Graphical representation of human corneal limbal epithelial (HCLE) cells treated with tear protein extracts and their downstream processing
Materials and reagents
50 mL conical centrifuge tubes (Thermo Fisher Scientific, catalog number: 339652)
15 mL conical centrifuge tubes (Thermo Fisher Scientific, catalog number: 339650)
100 mm culture dish (tissue culture treated) (Corning, catalog number: 430167)
12-well plate (tissue culture treated) (Thermo Fisher Scientific, catalog number: 173095)
10 mL serological pipettes (Thermo Fisher Scientific, catalog number: 170356N)
1,000 μL micro tip (Thermo Fisher Scientific, catalog number: 90030210-P)
200 μL micro tip (Thermo Fisher Scientific, catalog number: 90030130-P)
10 μL micro tip (Thermo Fisher Scientific, catalog number: 90030000-P)
1.5 mL microcentrifuge tube (Tarsons, catalog number: 500010)
Human corneal limbal epithelial (HCLE) cells (a kind gift from Dr. Ilene Gipson, Harvard Medical School, Schepen Eye Research Institute of Mass Eye and Ear)
Keratinocyte-serum free media (KSFM), supplemented with bovine pituitary extract and epidermal growth factor (EGF) (Gibco, Thermo Fisher Scientific, catalog number: 10724-011-500ML)
Penicillin/streptomycin solution (100×) (Diagnovum, catalog number: D910-100ML)
TrypLETM Express w/o phenol red (Gibco, Thermo Fisher Scientific, catalog number: 12604-013-100ML)
Minimal essential medium (MEM) (Gibco, Thermo Fisher Scientific, catalog number: 32571-036-500ML)
Fetal bovine serum (FBS) (Gibco, Thermo Fisher Scientific, catalog number: 10270-106-500ML)
Dulbecco’s PBS w/o Ca2+, Mg2+ and phenol red (1×) (Diagnovum, catalog number: D402-500ML)
Trypan blue (Thermo Fisher Scientific, catalog number: T10282)
Ammonium persulphate (APS) (Invitrogen, Thermo Fisher Scientific, catalog number: HC2005)
SureCastTM TEMED (Invitrogen, Thermo Fisher Scientific, catalog number: HC2006)
SureCastTM 40 % (w/v) acrylamide (29:1 acrylamide:bis-acrylamide) (Invitrogen, Thermo Fisher Scientific, catalog number: HC2040)
2.5× Tris-SDS buffer (pH 8.8) (HIMEDIA, catalog number: MB039-500ML)
5× Tris-SDS buffer (pH 6.8) (HIMEDIA, catalog number: MB040-500ML)
Gelatin, Hi-LRTM (HIMEDIA, catalog number: GRM019-500G)
0.2 μm Polyethersulfone (PES) syringe filter (mdi Membrane Technologies, catalog number: SYKG0601MNXX204)
Mini-RNA Isolation kit (Qiagen, catalog number: 74004)
Verso c-DNA Synthesis kit (Thermo Fisher Scientific, catalog number: AB1453)
SYBR Green (Applied Biosystems, Thermo Fisher Scientific, catalog number: A25742)
NuPage LDS sample buffer (4×) (Invitrogen, Thermo Fisher Scientific, catalog number: 2463558)
Calcium chloride (CaCl2) (HIMEDIA, catalog number: GRM3906-500G)
Triton X-100 (HIMEDIA, catalog number: MB031-100M)
Coomassie brilliant blue R-250 (HIMEDIA, catalog number: MB153-25G)
Methanol (Rankem, catalog number: M0140)
Acetic acid (Rankem, catalog number: A0060)
Sodium chloride (HIMEDIA, catalog number: MB023-500G)
1 mL syringes (DISPOVAN, model: U-40 Insulin syringe)
Schirmer tear test strips/tear touch (Madhu Instruments Pvt. Ltd.)
Gloves (Kimberly-Clark, catalog number: KM50601)
Kimwipes (Kimtech Science, catalog number: 34120)
Complete KSFM+GF (500 mL) (see Recipes)
Basal media: incomplete KSFM-GF (see Recipes)
1% Triton X-100 solution (see Recipes)
Developing buffer (see Recipes)
Coomassie staining solution (see Recipes)
Destaining solution (see Recipes)
Recipes
Complete KSFM+GF (500 mL)
Bovine pituitary extract, 25 μg/mL (half vial provided)
EGF (0.2 ng/mL)
CaCl2 (0.4 mM)
Penicillin/streptomycin 100× antibiotic (5 mL to achieve a final concentration of 1×)
Basal media: incomplete KSFM-GF
Penicillin/streptomycin 100× antibiotic (5 mL to achieve a final concentration of 1×)
1% Triton X-100 solution
1% Triton X-100 (v/v)
Autoclaved Milli-q water
Developing buffer
10 mM Tris buffer
200 mM NaCl
6 mM CaCl2
pH 7.4
Coomassie staining solution
Coomassie brilliant blue R-250 (0.05%)
Methanol (50% v/v)
Acetic acid (10% v/v)
Make up the remaining volume with Milli-Q water
Destaining solution
Acetic acid (10% v/v)
Methanol (50% v/v)
Milli-Q water (40% v/v)
Equipment
Swinging bucket centrifuge (NEUATION, model: ifuge UC02; catalog number: UC- 2002- EU/UK/AUS)
Tabletop centrifuge (Thermo Fisher Scientific, model: Sorvall Legend Micro 21R; catalog number: 75002447)
Class II biological safety cabinet (ESCO, model: Class II BSC)
Cell culture CO2 incubator (ESCO, model: CCL-170B-8-UV)
EVOSTM XL Core imaging system (Thermo Fisher Scientific, model: AMEX1200)
Automated cell counter (Thermo Fisher Scientific, model: CountlessTM 3 AMQAX2000)
Hemacytometer (Thermo Fisher Scientific, model: CountlessTM Reusable Slide, catalog number: A25750)
NanoDropTM Lite spectrophotometer (Thermo Fisher Scientific, catalog number: ND-LITE)
Gel Doc (Azure Biosystems, model: c600)
Real-time PCR (Azure Biosystems, model: Ceilo 6)
Thermocycler (Bio-Rad, model: T1000)
Rocker shaker (Scientek Hub, model: SR-1)
SureCastTM glass plates for PAGE ((Invitrogen, Thermo Fisher Scientific, catalog number: HC1001)
Mini gel tank (Invitrogen, Thermo Fisher Scientific, AMEX 1200; catalog number: A25977)
-80°C laboratory freezer (Thermo Fisher Scientific, model: Forma 900)
Milli-Q (Elga, model: PQ00018907)
Vortex (NEUATION, model: iSWIX)
Pipettes (1,000, 200, 10, 2.5 μL) (Eppendorf, model: Research Plus)
Software and datasets
Prism 9 (GraphPad Prism version 9.4.1)
BioRender for graphical images (https://www.biorender.com/)
Azure Cielo Manager software (version 1.0.4.0)
Procedure
Culturing and seeding of HCLE cells
Remove a vial of cryopreserved HCLE cells from -80 °C.
Place the vial at 37 °C for 3–4 min to thaw the cells.
Add 1 mL of the cryopreserved cells to 5 mL of MEM+10% FBS media in a 15 mL centrifuge tube in a BSL2 safety cabinet.
Centrifuge at 160× g for 5 min at room temperature.
Discard the supernatant.
Resuspend the pellet in 1 mL of KSFM+GF media.
Add the resuspended cells to a 100 mm tissue culture plate and add 7 mL of fresh KSFM+GF media.
Incubate the cells at 37 °C with 5% CO2 in the incubator to grow.
Once the cells attain 70% confluency, passage the cells twice before seeding for experiment.
For passaging the cells, remove the spent media from the 100 mm tissue culture plate.
Wash the plate with 4 mL of 1× Dulbecco’s PBS.
Add 1 mL of TrypLE solution to the plate and incubate at 37 °C with 5% CO2 for 3–5 min. Collect the trypsinized cells in a 15 mL centrifuge tube.
Neutralize the effects of TrypLE by adding 5 mL of MEM+10% FBS to the 15 mL centrifuge tube containing the trypsinized cells.
Centrifuge at 160× g for 5 min at room temperature. Discard the supernatant.
Resuspend the pellet in 1 mL of KSFM+GF media and add 500 μL to two 100 mm tissue culture plates. Make up the volume to 8 mL by adding 7.5 mL of complete KSFM media to each plate with the help of 10 mL serological pipettes.
Collection of tears from PED patients
Note: Prior to sample collection, patient informed consent must be taken.
A Schirmer strip test, as routinely used to evaluate the degree and severity of dryness in various disease conditions, is used to collect tears. Kindly note that a minimum tear migration up to 5 mm is necessary for optimal protein isolation.
Wear gloves and fold the end of the Schirmer strip within the packet at the ungraduated end.
Remove the Schirmer strip from the opposite end, place the folded end inside the lower lid of both eyes, and ask the patient to close their eyes.
After 5 min, the Schirmer strips are removed from both eyes.
The tear migration distance is noted from the graduated markings.
Collect the strips and place the entire strip containing the adsorbed tears in a 1.5 mL microcentrifuge tube (MCT) labeled with complete patient information.
Note: The important parameters to note during tear collection include the affected eye, patient medication, and the distance of tear migration.
Post tear collection, immediately place the tubes on ice (Figure 2).
Next, collect a second round of tears by repeating steps B2–B7. For control samples, tears are collected from patients not suffering from any ocular diseases.
Finally, store the vials in the -20°C freezer; those can be used within a period of six months.
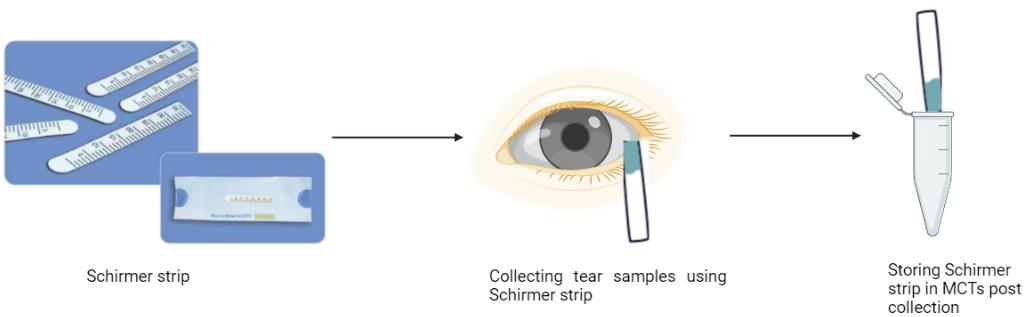
Figure 2. Schematic depicting the method of tear collection from the control and patients’ eyes
Extraction of proteins from tears of patients
Thaw tear vials on ice.
Add 200 μL of 1× PBS to each vial using a 200 μL pipette. It is very crucial that no protease inhibitor cocktail is added while extracting proteins from tear samples, as it will interfere with protein activity.
With the help of a 1,000 μL pipette tip, grind the Schirmer strips in the MCTs.
Vortex for 30 s using a vortexer and then incubate on ice for 2 min.
Repeat step C4 3–4 times.
Centrifuge the MCTs at 16,000× g for 5 min at 4 °C.
Collect the extracted proteins present in the supernatant in a fresh 1.5 mL MCT using a 200 μL pipette.
Quantify proteins by measuring absorbance at 280 nm using NanoDrop (Figure 3).
For protein concentration measurement by NanoDrop, first set blank with 1 μL of 1× PBS using a 2.5 μL pipette. Clean the pedestal with Kimwipes.
Next, add 1 μL of the sample to be quantified as in step C9 and measure absorbance at 280 nm. Note the reading.
Use a 2 mL syringe to attach the 0.22 μm PES syringe filter to filter the extracted proteins.
Equilibrate the filter by adding 500 μL of KSFM-GF media to the 2 mL syringe using a 1,000 μL pipette. Filter the media and then discard the filtered media.
Next, filter the tear proteins before treating cells using a 0.22 μm PES syringe filter.
Add 200 μL of tear proteins to the same syringe filter inside a class II biological safety cabinet and collect the filtered tear proteins into a sterile 15 mL conical centrifuge tube.
Note: Please note that equilibrating the syringe filter with media is necessary to prevent any loss of tear proteins during the filtering process.
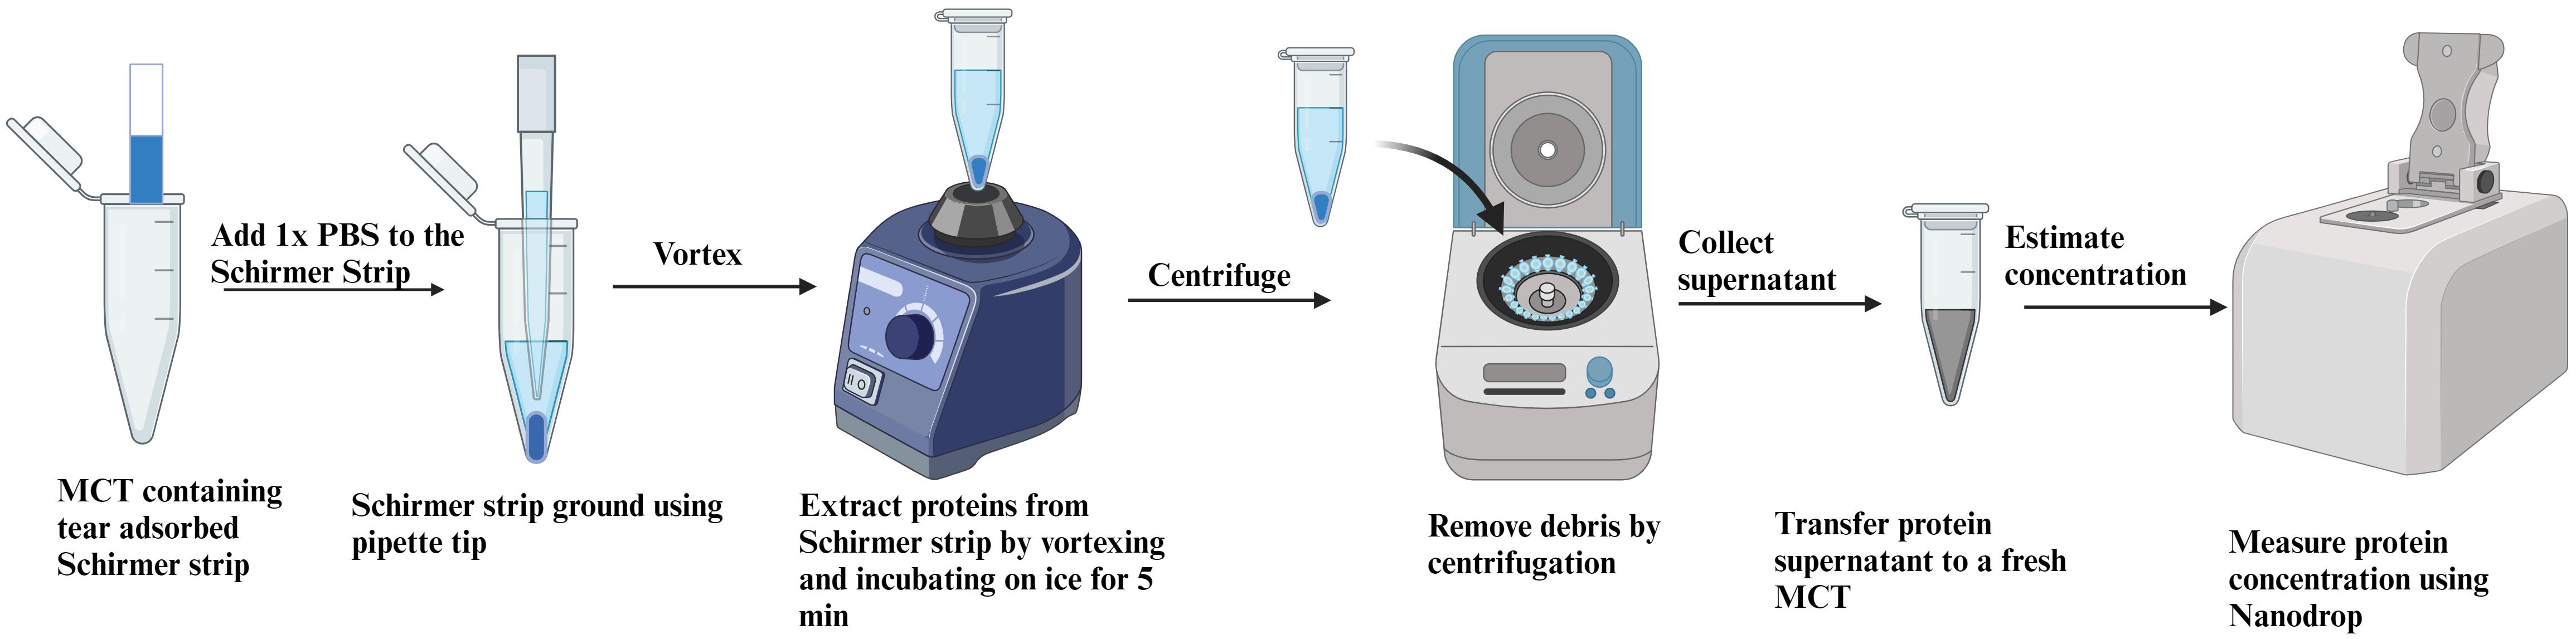
Figure 3. Schematic representation of protein extraction from Schirmer’s test strips
Seeding of HCLE cells for the experiment
Use the previously prepared 100 mm tissue culture dishes of HCLE cells at 70% confluency for seeding the experiment.
Discard the spent KSFM media from the culture dish using a 10 mL serological pipette in a BSL2 safety cabinet.
Wash the plate once with 3–4 mL of 1× Dulbecco’s PBS using a 1,000 μL pipette.
Add 1.5 mL of TrypLE solution to the plate after removing 1× PBS from the plate using a 1,000 μL pipette and incubate the plate at 37 °C for 5 min in a CO2 incubator.
Take out the plate from the CO2 incubator post incubation and tap the plate on both sides to dislodge the trypsinized cells.
In a Class II biological safety cabinet, collect the trypsinized cells in a 15 mL centrifuge tube containing 5 mL of MEM+10% FBS solution to neutralize the effects of TrypLE. Centrifuge the cells at 160× g in a swinging bucket centrifuge for 5 min at room temperature.
Discard the supernatant. Resuspend the pellet in 1 mL of KSFM+GF media using a 1,000 μL pipette.
Mix 10 μL of cells with 10 μL of Trypan Blue solution using a 10 μL pipette. Add 10 μL of this mix to one chamber of a hemacytometer.
Switch on the automated cell counter to count the cells.
Insert the hemacytometer into the automated cell counter. Adjust the brightness to focus the cells. Then, measure the cells’ density as indicated by the percentage of live cells calculated by the automated cell counter. Seed 50,000 cells/well in a 12-well tissue culture plate in 1 mL of KSFM+GF media for 24 h in a CO2 incubator at 37 °C.
Treating HCLE cells with proteins isolated from tears
Once the density reaches 60%–70% confluency, approximately 20 h after seeding, treat cells with tear proteins.
Remove the complete media from each well of the 12-well seeded plate using a 1,000 μL pipette.
Wash the cells once with 500 μL of 1× PBS to remove the remaining growth factors.
Add 1 mL of incomplete KSFM-GF media to each well using a 1,000 μL pipette.
Add an equal concentration of control and test tear proteins to the respective wells in a drop-wise manner. The protein concentration used for treating cells in vitro lies in the range of 60–100 μg/mL to each well.
Incubate the tear protein–treated cells in a CO2 incubator at 37 °C for 48 h.
Note the morphological changes taking place by treating HCLE cells with tear proteins of diseased patients. (Figure 4)
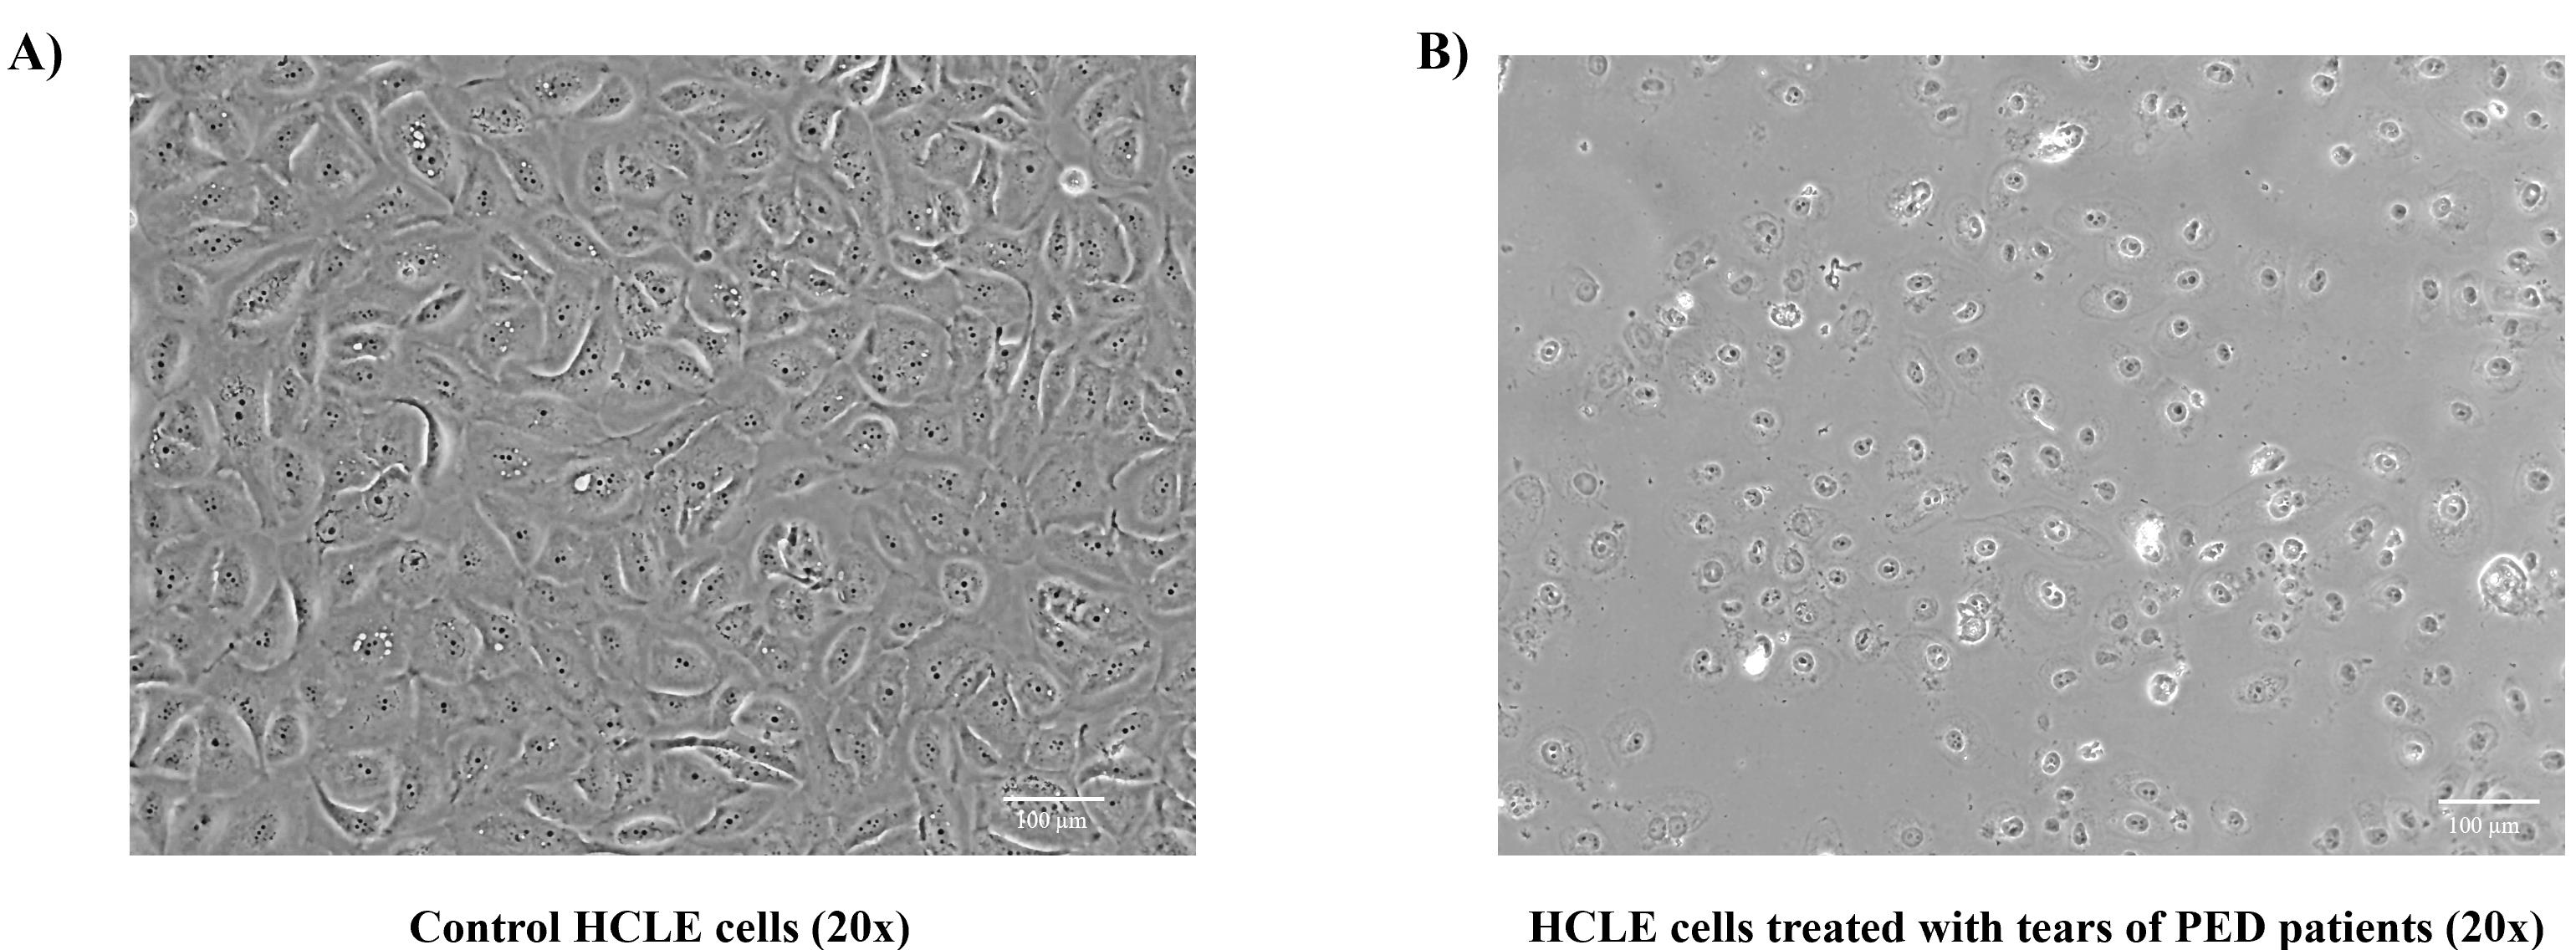
Figure 4. Morphological changes observed after tear treatment to human corneal limbal epithelial (HCLE) cells using EVOS Core imaging system. A. Control HCLE cells appear to be cuboidal maintaining epithelial stratification. B. HCLE cells treated with protein extracts of diseased Persistent Epithelial Defect (PED) patients were found to be more rounded, with decreased cell number and increased number of cellular vacuoles, thereby disrupting the normal stratification process. Please look out for changes in the cellular appearance, cellular vesicles, and the total number of cells present at the end of the experiment.
Analysis of MMP activity using gelatin zymography
After 48 h, collect the culture supernatant of both the control and tear protein–treated cells in 1.5 mL Eppendorf tubes to check the activity of MMPs by gelatin zymography.
Estimate the protein concentration of the supernatant using NanoDrop, following steps C9–C10.
Note: Make a note that for estimating protein concentration of culture supernatants, culture media devoid of growth factors is used to set the blank (KSFM w/o GF, in this case)
Next, mix an equal protein concentration of healthy control tears and patients’ tear-treated culture supernatant with 4× gel loading dye. Mix using a 200 μL pipette.
Note: Please make sure to avoid heating the samples or adding any reducing agent like β-mercaptoethanol during sample preparation.
Prepare an 8% acrylamide gel using 40% acrylamide, TEMED, 2.5× Tris-SDS buffer (pH 8.8), 5× Tris-SDS buffer (pH 6.8), and APS incorporated with 1 mg/mL of gelatin prepared in water.
Load the protein sample made with NuPage sample buffer (1×) and the pre-stained protein ladder onto the gel.
Run the gel at 30 mA for 1.5 h using the mini gel tank apparatus.
When the dye has completely run off, stop running the gel.
Transfer the gel to a staining box and incubate in 30 mL of 1% Triton X -100 for 30 min in a rocker shaker.
Note: Please note that the gelatin zymogram should be incubated in 1% Triton X-100 in order to get rid of SDS and renature proteinases that might affect MMP activity.
Discard the 1% TritonX-100 solution. Rinse the gel with Milli-Q water three times to remove the remaining Triton X-100.
Add 30 mL of developing buffer to the gel. Incubate overnight at 37 °C.
On the next day, remove the developing buffer. Stain the gel with 15 mL of Coomassie blue stain for 10 min in a rocking shaker.
Destain the gel in destaining solution for 5–7 min.
Note: Care must be taken not to extensively destain the gel.
Remove the destaining solution and store the gel in autoclaved water. Visualize the gel using a gel doc system to check for clear bands that indicate MMP activity (Figure 5 shows gelatin zymography depicting the levels of MMP9).
You can quantify the differences in the control and test samples using ImageJ. Refer to [7] for detailed information regarding the densitometric analysis of the MMP9 levels from gelatin zymography.
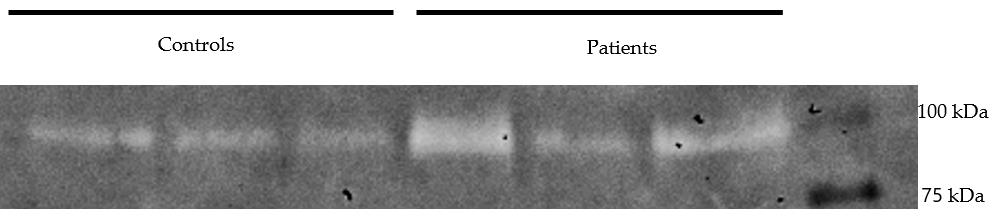
Figure 5. Gelatin zymography depicting the levels of MMP9 activity in the culture supernatants of human corneal limbal epithelial (HCLE) cells treated with tear proteins of control and Persistent Epithelial Defect (PED) patients
Gene expression analysis of tear protein–treated HCLE cells
Lyse cells in RNA lysis buffer and isolate RNA from the cells using Qiagen Mini-RNA Isolation kit, following the manufacturer’s instructions.
Quantify the RNA concentration by measuring absorbance at 260 nm using a NanoDrop, following steps C9–C10. Use the elution buffer provided in the RNA Isolation kit to set a blank for quantifying RNA.
The RNA concentration required to prepare 800 ng of cDNA in 20 μL falls within the range of 90–105 ng/μL. To ensure consistency, both the control and test samples should be converted to equal concentration of RNA to c-DNA using the Verso cDNA Synthesis kit, following the instructions provided by the manufacturer. Perform real time PCR analysis of the samples in duplicates using SYBR Green on an Azure Biosystems qPCR system. Run the housekeeping genes β-actin and RPL10 to study the effect on pro-inflammatory cytokines (as TNF-α, IL-1β, IL-6, TGFβ1, and TGF-β2), cell–cell communication, corneal epithelial homeostasis genes (such as E-cadherin, beta-catenin, and desmoglein), transcription factors like KLF4 (cell cycle inhibitor, EMT regulator, maintenance of corneal epithelial homeostasis), and other genes like GPX4 and NCO4.
For real time PCR, dilute the c-DNA to a final ratio of 1:10. Prepare a final reaction of 15 μL using SYBR green using 5 μL of diluted c-DNA.
Run the samples in duplicate in a 96-well Azure qPCR plate.
The cycling settings are as follows:
Step 1: 95 °C, 3 min
Step 2: 95 °C, 15 s
Step 3: 60 °C, 20 s
Step 4: Go to Step 2, 40 times
Step 5: start 60 °C; end 95 °C
Conduct the analysis of qPCR data using Azure Cielo Manager software and Microsoft Excel.
Employ the geometric mean of the housekeeping genes RPL10 and beta-actin for data normalization.
Utilize the relative expression (∆∆Ct) of genes to present the results, comparing the disease group to the control group.
Generate graphs using Prism 9. Incorporate the normalized fold change and standard errors of the mean for the qPCR data in the graphical representations.
Analyze the graphs to interpret the relative expression levels between the disease and the control groups.
Present the results by comparing the normalized fold changes and standard errors of the means for each gene. (Refer to Figure 6 for the gene expression data performed by real-time PCR.)
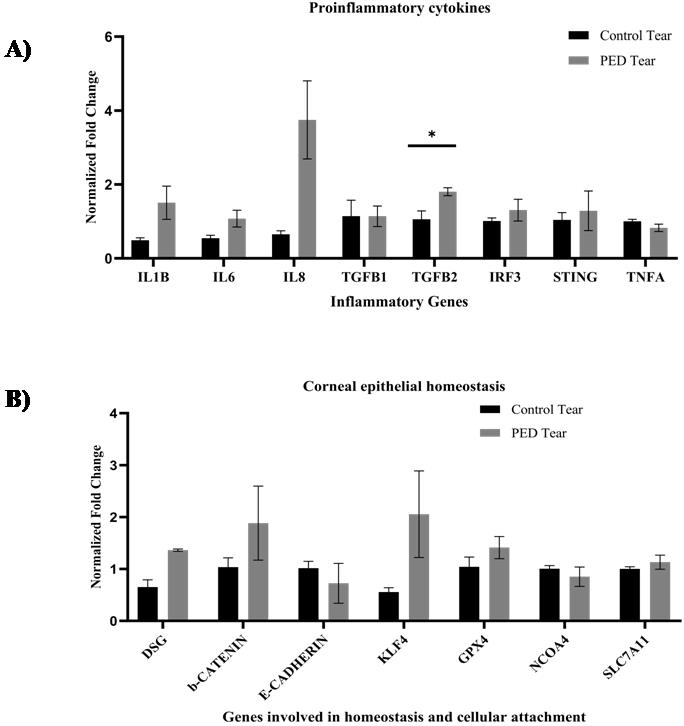
Figure 6. Gene expression analysis of HCLE cells treated with tear proteins (N = 3). A. Transcript level changes of the proinflammatory cytokines were studied in the control and PED tear–treated groups. B. The gene expression changes of the corneal homeostasis markers and transcription factors were analyzed in the control and PED tear–treated groups. The error bars in the figures represent the standard error of the means. An unpaired t-test was conducted, and the asterisk (*) denotes statistical significance (p < 0.05) [7].
Validation of protocol
Dutta et al. (2023). Prolonged Inflammation and Infectious Changes in the Corneal Epithelium Are Associated with Persistent Epithelial Defect (PED). Pathogens (Figure 4, panel A and B).
Acknowledgments
A.T. thanks SERB-DST Start-up research grant and Eicher Group Foundation (EGF) for supporting the study.
Competing interests
There are no conflicts of interest or competing interests.
References
- Azkargorta, M., Soria, J., Acera, A., Iloro, I. and Elortza, F. (2017). Human tear proteomics and peptidomics in ophthalmology: Toward the translation of proteomic biomarkers into clinical practice. J. Proteomics 150: 359–367. doi: 10.1016/j.jprot.2016.05.006
- Raposo, A. C., Portela, R. D., Aldrovani, M., Barral, T. D., Cury, D. and Oriá, A. P. (2020). Comparative Analysis of Tear Composition in Humans, Domestic Mammals, Reptiles, and Birds. Front. Vet. Sci. 7: e00283. doi: 10.3389/fvets.2020.00283
- Torok, Z., Peto, T., Csosz, E., Tukacs, E., Molnar, A., Maros-Szabo, Z., Berta, A., Tozser, J., Hajdu, A., Nagy, V., et al. (2013). Tear fluid proteomics multimarkers for diabetic retinopathy screening. BMC Ophthalmology 13(1): e1186/1471–2415–13–40. doi: 10.1186/1471-2415-13-40
- Aluru, S. V., Agarwal, S., Srinivasan, B., Iyer, G. K., Rajappa, S. M., Tatu, U., Padmanabhan, P., Subramanian, N. and Narayanasamy, A. (2012). Lacrimal Proline Rich 4 (LPRR4) Protein in the Tear Fluid Is a Potential Biomarker of Dry Eye Syndrome. PLoS One 7(12): e51979. doi: 10.1371/journal.pone.0051979
- Ambroziak, A.M., Szaflik, J., Szaflik, J.P., Ambroziak, M., Witkiewicz, J., Skopiñski, P. (2016). Immunomodulation on the ocular surface: A review. Cent. Eur. J. Immunol. 41 (2): 195–208. doi: 10.5114/ceji.2016.60995
- Hagan, S., Martin, E. and Enríquez-de-Salamanca, A. (2016). Tear fluid biomarkers in ocular and systemic disease: potential use for predictive, preventive and personalised medicine. EPMA Journal 7(1): e1186/s13167–016–0065–3. doi: 10.1186/s13167-016-0065-3
- Dutta, T., Sangwan, J., Mondal, M., Vohra, M., Nidhi, V., Gour, A., Kapur, N., Gupta, N., Bhowmick, T., Chandru, A., et al. (2023). Prolonged Inflammation and Infectious Changes in the Corneal Epithelium Are Associated with Persistent Epithelial Defect (PED). Pathogens 12(2): 261. doi: 10.3390/pathogens12020261
- Hefley, B. S., Deighan, C., Vasini, B., Khan, A., Hjortdal, J., Riaz, K. M., Liu, Y. and Karamichos, D. (2022). Revealing the presence of tear extracellular vesicles in Keratoconus. Exp. Eye Res. 224: 109242. doi: 10.1016/j.exer.2022.109242
Article Information
Copyright
© 2024 The Author(s); This is an open access article under the CC BY-NC license (https://creativecommons.org/licenses/by-nc/4.0/).
How to cite
Mondal, M., Vohra, M., Sangwan, J., Verma, S., Coulson-Thomas, V. J., Chandru, A., Bhowmick, T., Sangwan, V. S., Acharya, M. and Tiwari, A. (2024). In vitro Assay to Examine the Function of Tears on Corneal Epithelial Cells. Bio-protocol 14(1): e4910. DOI: 10.21769/BioProtoc.4910.
Category
Biochemistry > Protein > Isolation and purification
Cell Biology > Cell-based analysis > Inflammatory response
Do you have any questions about this protocol?
Post your question to gather feedback from the community. We will also invite the authors of this article to respond.