- Protocols

- Articles and Issues
- For Authors
- About
- Become a Reviewer

Reprogramming Cancer Cells to Antigen-presenting Cells
Published: Vol 13, Iss 22, Nov 20, 2023 DOI: 10.21769/BioProtoc.4881 Views: 5051
Reviewed by: Shalini Low-NamScott McCombDavide Botta
Original research article
The authors used this protocol in:
Jul 2023

Protocol Collections
Comprehensive collections of detailed, peer-reviewed protocols focusing on specific topics


Abstract
Cancer cells evade the immune system by downregulating antigen presentation. Although immune checkpoint inhibitors (ICI) and adoptive T-cell therapies revolutionized cancer treatment, their efficacy relies on the intrinsic immunogenicity of tumor cells and antigen presentation by dendritic cells. Here, we describe a protocol to directly reprogram murine and human cancer cells into tumor-antigen-presenting cells (tumor-APCs), using the type 1 conventional dendritic cell (cDC1) transcription factors PU.1, IRF8, and BATF3 delivered by a lentiviral vector. Tumor-APCs acquire a cDC1 cell-like phenotype, transcriptional and epigenetic programs, and function within nine days (Zimmermannova et al., 2023). Tumor-APCs express the hematopoietic marker CD45 and acquire the antigen presentation complexes MHC class I and II as well as co-stimulatory molecules required for antigen presentation to T cells, but do not express high levels of negative immune checkpoint regulators. Enriched tumor-APCs present antigens to Naïve CD8+ and CD4+ T cells, are targeted by activated cytotoxic T lymphocytes, and elicit anti-tumor responses in vivo. The tumor-APC reprogramming protocol described here provides a simple and robust method to revert tumor evasion mechanisms by increasing antigen presentation in cancer cells. This platform has the potential to prime antigen-specific T-cell expansion, which can be leveraged for developing new cancer vaccines, neoantigen discovery, and expansion of tumor-infiltrating lymphocytes.
Key features
• This protocol describes the generation of antigen-presenting cells from cancer cells by direct reprogramming using lineage-instructive transcription factors of conventional dendritic cells type I.
• Verification of reprogramming efficiency by flow cytometry and functional assessment of tumor-APCs by antigen presentation assays.
Background
Immune evasion, an important hallmark of cancer, is characterized by the exclusion of effector immune cells and immunosuppression, the inherent heterogeneity of cancer cells and reduced antigen presentation, which all contribute to tumor immunogenicity (Sharma et al., 2017; Jhunjhunwala et al., 2021). Immune checkpoint inhibition (ICI) revolutionized cancer treatment by enhancing the patient’s immune system, resulting in long-term responses in melanoma and other types of cancer. Nevertheless, some cancers, such as prostate cancer and glioblastoma, are more resistant to immunotherapeutic approaches. Additionally, among indications eligible for immunotherapy, responses vary greatly across patients (Sharma et al., 2017). Antigen presentation and tumor’s intrinsic immunogenicity play crucial roles in promoting efficient CD8+ and CD4+ T-cell responses during ICI treatment (Manguso et al., 2017; Patel et al., 2017; Oh et al., 2020; Blomberg et al., 2023). Immune evasion mechanisms contribute to tumor progression by reducing immunogenicity through upregulation of immune checkpoints (Hashimoto et al., 2018), tumor antigen editing, and downregulation of antigen presentation pathways (Jhunjhunwala et al., 2021). These mechanisms arise as a consequence of transcriptional and epigenetic alterations in antigen processing and presentation pathways (Guo et al., 2021) and deregulation of interferon (IFN) signaling (Kalbasi and Ribas, 2020). Despite attempts at increasing tumor immunogenicity by manipulating the IFN-γ pathway (Griffin et al., 2021; Guo et al., 2021), successful strategies to engineer tumor immunogenicity are still lacking. For the past decade, conventional dendritic cells type I (cDC1) have been established as key players in anti-tumor immunity. cDC1 cells are specialized in cross-presenting tumor antigens to CD8+ T cells, which is fundamental for successful anti-tumor immunity (Poulin et al., 2012; Barry et al., 2018; Kvedaraite and Ginhoux, 2022). Additionally, cDC1 cells recruit and orchestrate immune effectors through the secretion of pro-inflammatory chemokines and cytokines (Spranger et al., 2017). Importantly, the presence of cDC1 cells within the tumor microenvironment correlates positively with immunotherapy’s success and better survival in humans (Spranger et al., 2017; Hubert et al., 2020; Mayoux et al., 2020).
Recently, a cDC1 cells–based vaccine promoted tumor rejection and abscopal tumor control in murine models, independently of host’s cDC1 cell compartment (Ferris et al., 2022). Current methods to generate cDC1 cells rely on the culture of peripheral blood mononuclear cells (PBMCs), bone marrow (BM) progenitors, or monocytes with cytokine cocktails that promote cDC1 cell differentiation (Poulin et al., 2010; Balan and Dalod, 2016). Efforts have also been placed to differentiate leukemic blasts from acute myeloid leukemia into leukemia-derived dendritic cells with cytokine cocktails (Amberger and Schmetzer, 2020). However, ex vivo production of blood-derived dendritic cells is costly, has limited yields, and the differentiation approach is inefficient and limited to blood cancers (Amberger and Schmetzer, 2020; Makino et al., 2022). On the other hand, direct reprogramming approaches have the advantage to generate the desired cell fate from any cell type, have great potential for in vivo application, and are more suited for clinical applications as transdifferentiation processes often bypass progenitor cell states (Wang et al., 2021; Zimmermannova et al., 2021). Our group has defined the minimum network of transcription factors to induce cDC1 cell’s identity through overexpression of PU.1, IRF8, and BATF3 in fibroblasts (Rosa et al., 2018, 2020 and 2022). While this approach could be potentially used to generate induced cDC1 cells, we have hypothesized that the same combination of transcription factors could restore immunogenicity in cancer cells. Cancer cells retain cellular plasticity that allows the modification of cancer cell fate with direct cellular reprogramming (Hochedlinger et al., 2004; Suva et al., 2013; Ishay-Ronen et al., 2019; Zimmermannova et al., 2021), and we have recently demonstrated that ectopic expression of PU.1, IRF8, and BATF3 induces a cDC1 cell–like state in cancer cells (Zimmermannova et al., 2023). Reprogramming of mouse and human cancer cells to antigen-presenting cells occurs by imposing a cDC1 cells’ transcriptional and epigenetic program. Tumor-antigen-presenting cells (tumor-APCs) acquire a cDC1 cell–like immunophenotype, respond to toll-like receptor (TLR) stimuli to secrete pro-inflammatory cytokines, as well as engulf, process, and cross-present antigens as early as day 3 of reprogramming. Tumor-APCs also show endogenous antigens more promptly, becoming targets for T cell–mediated killing, and upon intratumorally injection reduce tumor growth and increase survival in mice (Zimmermannova et al., 2023).
Here, we describe a protocol to generate tumor-APCs within nine days and follow the process at the phenotypic and transcriptional levels. We also describe a magnetic-activated cell sorting (MACS) protocol to purify a high number of tumor-APCs that can be used for in vitro and in vivo assays. While fluorescence-activated cell sorting (FACS) is used to purify rare populations with higher purity, MACS-based purification recovers more viable cells in 4–6-fold less time than FACS (Sutermaster and Darling, 2019; Pan and Wan, 2020). Additionally, MACS requires less expensive instrumentation than FACS, and is easily scalable without adding significantly more processing time. MACS purification of tumor-APCs recovers an average of 2 × 10⁶ of tumor-APCs per 1 × 10⁶ of original cells seeded at day -1 (Figure 1). We also illustrate the functionality of MACS-purified tumor-APCs by performing antigen presentation assays to Naïve CD4+ T cells. As tumor-APCs can be generated from different cancer types, including mouse and human cell lines and primary tumor cells (Zimmermannova et al., 2023), this technology supports a vast array of in vitro approaches that require large numbers of tumor-APCs, e.g., in vitro tumor antigen-specific T-cell expansion or neoantigen identification.
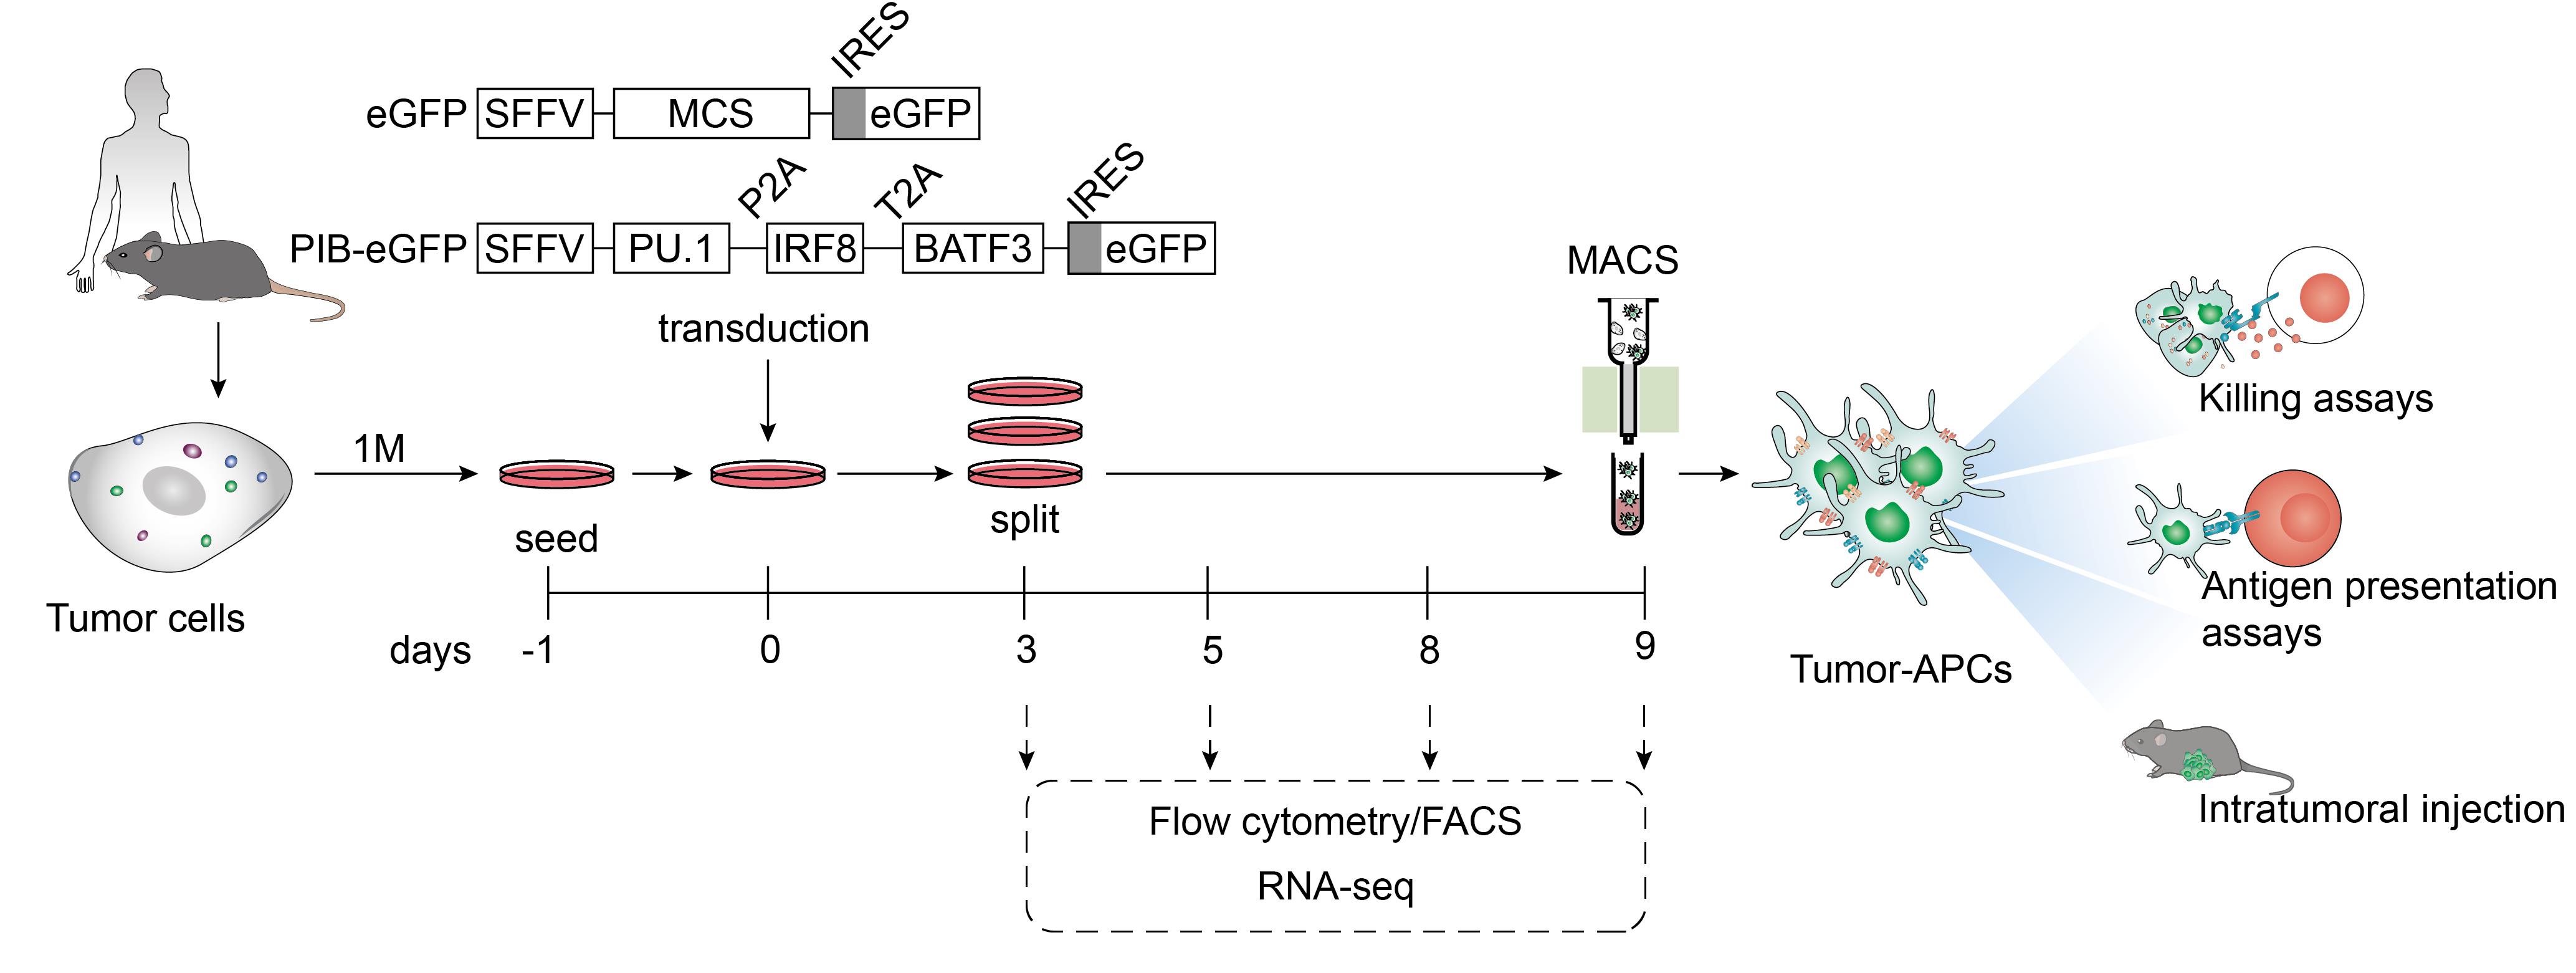
Figure 1. Protocol overview to reprogram mouse and human cancer cells to antigen-presenting dendritic cell-like cells. Tumor cells from murine or human origin are plated one day before transduction with lentiviral particles encoding PU.1, IRF8, and BATF3 in a polycistronic cassette under the control of the spleen focus-forming virus promoter (SFFV). An empty vector with a multiple cloning site (MCS) is used as a control. Both constructs encode eGFP after an internal ribosome entry site (IRES) to trace transduced cells by flow cytometry and fluorescence microscopy. At day 3, confluent plates are split and evaluated for transduction efficiency by flow cytometry. Cells are maintained until day 9 at 60%–80% confluency. Reprogramming efficiency is followed by flow cytometry at days 5, 8, and 9. Tumor-antigen-presenting cells (tumor-APCs) can be purified by fluorescent-activated cell sorting (FACS) for applications that require high purity, including RNA-sequencing (RNA-seq). For in vitro and in vivo functional assessments that require large numbers of reprogrammed cells, tumor-APCs can be enriched by magnetic-activated cell sorting (MACS) through positive selection. To assess enhanced immunogenicity in vitro, tumor-APCs can be co-cultured with activated CD8+ T cell (killing assays). These evaluate whether reprogrammed cancer cells can be targeted by cytotoxic lymphocytes. To evaluate antigen presentation capacity, tumor-APCs are co-cultured with antigen-specific Naïve CD8+ or CD4+ T cells, followed by assessment of T-cell activation and proliferation. In this protocol, we describe antigen presentation to CD4+ T cells to validate tumor-APC function. Moreover, tumor-APCs can be injected intratumorally to evaluate anti-tumor efficacy using tumor growth delay and survival as read-outs.
Materials and reagents
Biological materials
B16F10 cells (B16) (ATCC, catalog number: CRL-6475)
888-mel cells (88MEL) (gifted by Göran B. Jönsson from Lund University)
B6.Cg-Tg (TcraTcrb)425Cbn/J (OT-II mouse) (The Jackson Laboratory, catalog number: 004194) as a source for spleens
C57BL/6j (The Jackson Laboratory, catalog number: 000664) as a source for spleens and bone marrow
Human leucocytes concentrate (Skåne University Hospital, Lund) as a source for PBMCs
Reagents
Plasmid pMD2.G (Addgene, catalog number: 12259)
Plasmid psPAX2 (Addgene, catalog number: 12260)
Plasmid SFFV-mPIB-eGFP containing a tricistronic cassette encoding mouse PU.1, IRF8, and BATF3 (mPIB) (Cell Reprogramming in Hematopoiesis and Immunity Lab, Division of Molecular Medicine and Gene Therapy, Lund University, Sweden)
Plasmid SFFV-hPIB-eGFP containing a tricistronic cassette encoding human PU.1, IRF8, and BATF3 (hPIB) (Cell Reprogramming in Hematopoiesis and Immunity Lab, Division of Molecular Medicine and Gene Therapy, Lund University, Sweden)
Plasmid SFFV-MCS-eGFP empty vector with a multiple cloning site and expressing eGFP (Cell Reprogramming in Hematopoiesis and Immunity Lab, Division of Molecular Medicine and Gene Therapy, Lund University, Sweden)
Dulbecco’s modified Eagle’s medium (DMEM) with high glucose, L-glutamine, and sodium pyruvate (Cytiva, Hyclone, catalog number: SH30243.01)
RPMI 1640 with L-glutamine (Cytiva, Hyclone, catalog number: SH30027.01)
Phosphate buffered saline (PBS) without calcium and magnesium (Cytiva, Hyclone, catalog number: SH30256.01)
Fetal bovine serum (FBS) (Cytiva, Hyclone, catalog number: SV30150.03)
Lenti-XTM qRT-PCR Titration kit (Takara, catalog number: 631235)
Rat serum (GeneTex, catalog number: GTX73226)
Mouse serum (Merck, catalog number: M5905)
GlutaMAXTM Supplement (Thermo Fisher Scientific, Gibco, catalog number: 35050061)
Penicillin-streptomycin solution (Cytiva, Hyclone, catalog number: SV30010)
Sodium pyruvate solution (Thermo Fisher Scientific, Gibco, catalog number: 11360070)
2-Mercaptoethanol (Thermo Fisher Scientific, Gibco, catalog number: 31350010)
Hexadimethrine bromide (Merck, catalog number: H9268-5G)
TrypLE Express (Thermo Fisher Scientific, Gibco, catalog number: 12605010)
Anti-Biotin microbeads (Miltenyi Biotec, catalog number: 130-090-485)
Dead cell removal kit (Miltenyi Biotec, catalog number: 130-090-101)
BD Pharm Lyse lysing buffer (BD Biosciences, catalog number: 555899)
Ammonium chloride solution (Stem Cell Technologies, catalog number: 07800)
Pan-DC Enrichment kit, human (Miltenyi Biotec, catalog number: 130-100-777)
Naïve CD4+ T cell isolation kit, mouse (Miltenyi Biotec, catalog number: 130-104-453)
CellTrace Violet Proliferation kit for flow cytometry (Thermo Fisher Scientific, Invitrogen, catalog number: C34557)
Polyinosinic:polycytidylic acid [poly(I:C)] HMW (InvivoGen, catalog number: tlr-pic-5)
Ovalbumin (OVA) 323–339 (InvivoGen, catalog number: vac-isq)
4′,6′-diamidino-2-phenylindole (DAPI) (Thermo Fisher Scientific, Invitrogen, catalog number: D1306)
Fixable Viability Dye eFluor eFluor520 (Thermo Fisher Scientific, Invitrogen, catalog number: 65-0867-14)
Anti-mouse CD45 Monoclonal Antibody (clone: 30-F11), Biotin (Thermo Fisher Scientific, eBioscience, catalog number: 13-0451-82)
Anti-mouse CD45 Monoclonal Antibody (clone:30-F11), Allophycocyanin-Cyanine7 (Thermo Fisher Scientific, eBioscience, catalog number: 25-0451-82)
Anti-mouse MHC class II (I-A/I-E) Monoclonal Antibody (clone: M5/114.15.2), Biotin (Thermo Fisher Scientific, eBioscience, catalog number: 13-5321-82)
Anti-mouse MHC class II (I-A/I-E) Monoclonal Antibody (clone: M5/114.15.2), PE-Cyanine7 (Thermo Fisher Scientific, eBioscience, catalog number: 25-5321-82)
Anti-mouse CD274 (PD-L1) Monoclonal Antibody (clone: M1H5), PE, (Thermo Fischer Scientific, eBioscience, catalog number: 12-5982-82)
Anti-mouse CD275 (ICOSL) Monoclonal Antibody (clone: HK5.3), PE (Thermo Fisher Scientific, eBioscience, catalog number: 12-5985-82)
Anti-mouse CD366 (Tim-3) Monoclonal Antibody (clone: B8.2.C12), Allophycocyanin (BioLegend, catalog number: 134008)
Anti-mouse CD3 Monoclonal Antibody (clone: 17A2), FITC (BioLegend, catalog number: 100204)
Anti-mouse/human CD45RA (B220) Monoclonal Antibody (clone: RA3-6B2), FITC (Thermo Fisher Scientific, eBioscience, catalog number: 11-0452-85)
Anti-mouse Ly-6G/Ly-6C (Gr-1) Monoclonal Antibody (clone: RB6-8C5), FITC (BioLegend, catalog number: 108406)
Anti-mouse NK1.1 Monoclonal Antibody (clone: PK136), FITC (Thermo Fisher Scientific, eBioscience, catalog number: 11-5941-82)
Anti-mouse CD8a Monoclonal Antibody (clone: 53-6.7), Allophycocyanin-Cyanine7 (BioLegend, catalog number: 100722)
Anti-mouse CD11c Monoclonal Antibody (clone: N418), Brilliant Violet 650 (BioLegend, catalog number: 117339)
Anti-mouse CD4 Monoclonal Antibody (clone: RM4-5), PE/Cyanine7 (Thermo Fisher Scientific, eBioscience, catalog number: 25-0042-82)
Anti-mouse TCR b chain Monoclonal Antibody (clone: H57-597), Allophycocyanin (BioLegend, catalog number: 109212)
Anti-mouse/human CD44 Monoclonal Antibody (clone: IM7), Allophycocyanin-Cyanine7 (BioLegend, catalog number: 103028)
Anti-human HLA-DR Monoclonal Antibody (clone: L243), PE-Cyanine7 (BioLegend, catalog number: 307616)
Anti-human HLA-DR Monoclonal Antibody (clone: L243), Brilliant Violet 711 (BioLegend, catalog number: 307644)
Anti-human CD45 Monoclonal Antibody (clone: H130), Allophycocyanin-Cyanine7 (BioLegend, catalog number: 304014)
Anti-human CD11c Monoclonal Antibody (clone: B-ly6), Violet 450 (BD Biosciences, catalog number: 560369)
Anti-human CD1c Monoclonal Antibody (clone: L161), Allophycocyanin-Cyanine7 (BioLegend, catalog number: 331520)
Anti-human CD141 (thrombomodulin) Monoclonal Antibody (clone: M80), PE-Cyanine7 (BioLegend, catalog number: 344110)
Anti-human CD3 Monoclonal Antibody (clone: UCHT1), FITC (BioLegend, catalog number: 300452)
Anti-human CD19 Monoclonal Antibody (clone: H1B19), FITC (BioLegend, catalog number: 302206)
Anti-human CD56 (NCAM) Monoclonal Antibody (clone: 5.1H11), FITC (BioLegend, catalog number: 362546)
Anti-human VISTA Monoclonal Antibody (clone: B7H5DS8), Allophycocyanin (Thermo Fisher Scientific, eBioscience, catalog number: 17-1088-42)
Anti-human CD274 (PD-L1) Monoclonal Antibody (clone: M1H1), PE (Thermo Fisher Scientific, eBioscience, catalog number: 12-5983-42)
Anti-human CD366 (TIM3) Monoclonal Antibody (clone: F38-2E2), Allophycocyanin (Thermo Fisher Scientific, eBioscience, catalog number: 17-3109-42)
Lentiviral vectors for expression of PU.1, IRF8, and BATF3 individually in inducible vectors (Addgene, catalog numbers: 139839, 139838, and 139837)
Solutions
OVA 323–339 1 mg/mL, prepared according to manufacturer’s protocol
CellTrace Violet (CTV) solution, prepared according to manufacturer’s protocol
DMEM complete media (see Recipes)
RPMI complete media for 88MEL culture (see Recipes)
RPMI complete media for bone-marrow dendritic cells (BM-DCs) (see Recipes)
MACS buffer (see Recipes)
Polybrene 8 mg/mL (see Recipes)
Poly(I:C) 1 mg/mL, prepared according to manufacturer’s protocol (see Recipes)
Recipes
DMEM complete media
Reagent Final concentration Quantity DMEM high glucose, with glutamine and sodium pyruvate 440 mL Heat-inactivated FBS 10% (v/v) 50 mL GlutaMAX 1% (v/v) 5 mL Penicillin-Streptomycin solution 1% (v/v) 5 mL Total 500 mL RPMI complete media for 88MEL culture
Reagent Final concentration Quantity RPMI 1640 440 mL Heat-inactivated FBS 10% (v/v) 50 mL GlutaMAX 1% (v/v) 5 mL Penicillin-Streptomycin 1% (v/v) 5 mL Total 500 mL RPMI complete media for BM-DCs culture
Reagent Final concentration Quantity RPMI 1640 435 mL Heat-inactivated FBS 10% (v/v) 50 mL GlutaMAX 1% (v/v) 5 mL Penicillin-Streptomycin 1% (v/v) 5 mL Sodium Pyruvate 1% (v/v) 5 mL 2-Mercaptoethanol 0.05 mM 0.5 mL Total 500.5 mL MACS buffer
Reagent Final concentration Quantity PBS without calcium and magnesium 480 mL Heat-inactivated FBS 2% (v/v) 10 mL Penicillin-Streptomycin solution 2% (v/v) 10 mL Total 500 mL Polybrene solution
Reagent Final concentration Quantity Hexadimethrine bromide 8 mg/mL 5 g Milli-Q H2O 625 mL Total 625 mL Poly(I:C) 1 mg/mL solution
Reagent Final concentration Quantity Poly(I:C) 1 mg/mL 10 mg Endotoxin free water (provided by the manufacturer) 10 mL Total 10 mL
Laboratory supplies
Serological pipette, sterile, non-pyrogenic/endotoxin free 2–50 mL (Sarstedt, catalog numbers: 86.1253.001, 86.1256.001, 86.1252.001, 86.1254.001, 86.1685.001)
Pasteur pipette, sterile (Sarstedt, catalog number: 86.1171.001)
1 L vacuum filter system, 0.22 mm PE (Corning, catalog number: 431098)
100 mm tissue culture plates (Corning, catalog number: 430167)
Petri dish, 92 mm × 16 mm (Sarstedt, catalog number: 82.1473)
150 mm tissue culture plates (Corning, catalog number: 430599)
6-well tissue culture plates (Corning, catalog number: 353046)
6-well non-tissue-culture-treated plates (Corning, catalog number: 351146)
96-well tissue culture U-shaped bottom plates (Corning, catalog number: 353077)
96-well non-tissue-culture-treated U-shaped bottom plates (Corning, catalog number: 351177)
15 mL centrifuge tubes (Sarstedt, catalog number: 62.547.205)
50 mL centrifuge tubes (Sarstedt, catalog number: 62.547)
MidiMACSTM LS columns (Miltenyi Biotec, catalog number: 130-042-501)
Hemocytometer chamber for cell counting (Corning, CytoSmart, catalog number: 480202)
Microcentrifuge tubes (Sarstedt, catalog number: 72.690.001)
Cell strainer 45 mm nylon mesh (Corning, catalog number: 11587522)
Syringe 5 mL (Avantor, VWR, catalog number: 613-2042)
Round bottom polystyrene test tube 5 mL (Corning, Falcon, catalog number: 352008)
Tweezers curved ends (Avantor, VWR, catalog number: 232-0106)
Forceps (Avantor, VWR, catalog number: 232-0085)
Scissors (Avantor, VWR, catalog number: 233-0225)
Equipment
Scanlaf Mars class 2 laminar flow hood (LaboGene, model: Mars 1200 mm)
Forma Steri-cycle i160 CO2 incubator (Thermo Scientific, model: i160)
Integra Pipetboy acu 2 (Integra-Biosciences, model: acu 2)
BD FACSymphony A1 or LSRFortessa flow cytometer analyzers (16-color, violet/blue/red/yellow-green) (BD Biosciences, model: A1 Cell Analyzer; LSRFortessa Analyzer)
MACS MultiStand (Miltenyi Biotec, catalog number: 130-042-303)
MidiMACSTM separator (Miltenyi Biotec, catalog number: 130-042-301)
4–16K refrigerated centrifuge (Sigma, catalog number: 10474)
Automatic cell counter (Corning, CytoSmart, catalog number: 6749)
Milli-Q Type 1 Ultrapure Water systems (Merck, model: IQ7000)
Thermo Scientific Finnpipette F2 pipettes (Thermo Fisher Scientific, catalog number: 4642010)
Thermo Scientific Finnpipette F2 Multichannel pipettes (Thermo Fisher Scientific, catalog number: 4662030)
Vortex (IKA, model: MS3 basic)
Water bath (Grant Instruments, model: JB series)
Software and datasets
FACSDIVA (v 9.0) (Access date, 03 May 2023)
FlowJo (v 10.8.1) (Access date, 03 May 2023)
GraphPad Prism (v 9) (Access date, 05 May 2023)
CytoSmart (Cell Count Algorithm V3) (Access date, 01 May 2023)
Mouse Tumor-APC RNA-seq data GSE184527 (Access date, 07 July 2023)
Mouse cDC1 cells RNA-seq data GSE103618 (Access date, 07 December 2018)
Procedure
Preparing cancer cell cultures for reprogramming
Note: This protocol is performed in sterile conditions under a class 2 laminar flow hood, using sterile pipettes, materials, and reagents.
Procedures A–C from this protocol were performed using B16 and 88MEL murine and human melanoma cell lines but can be extended to other types of cancer cell lines and primary samples, including adherent and non-adherent cells (Zimmermannova et al., 2023). Cancer cell lines and primary samples can be bought from ATCC, Riken, AMSBio, BioIVT, or VitroBiopharma, among other commercial sources. Alternatively, cancer biopsies can be isolated, processed, and expanded for reprogramming experiments.
Thaw and culture cancer cells in the recommended culture media for the cell type under standard conditions (37 °C, 5% CO2). It is recommended that cells are passaged at least once before plating for reprogramming. For better reproducibility when using the same cell line, ensure that the passage is similar between reprogramming experiments.
Before reprogramming, ensure the cells are dividing normally and display usual morphology by using an inverted light microscope regularly.
Using a hemocytometer, count cells and expand them as follows:
For adherent cells, plate 1 × 10⁶ live cells per 100 mm tissue culture plate.
Note: This step can be adjusted according to the purpose of the experiment. To assess reprogramming efficiency or immunophenotyping during reprogramming, 6-well plates are recommended. For functional assays or in vivo studies, it is recommended to use 100 mm or 150 mm plates. Adjust cell numbers according to the surface area.
For non-adherent cells, skip to step B2.
Allow cells to adhere by incubating at 37 °C, 5% CO2 overnight (approximately 16 h), and proceed with reprogramming (Procedure B).
Tumor-APC reprogramming
Before starting this protocol, prepare lentiviruses as previously described (Rosa et al., 2020 and 2022). The lentiviral vectors for expression of PU.1, IRF8, and BATF3 individually in inducible vectors can be found in Addgene and can be subcloned into any backbone as individual factors or in a polycistronic cassette by adding self-cleaving 2A sequences between sequences.
Titer viral concentrates by qRT-PCR to determine their concentration in viral particles/mL using, for example, Lenti-X qRT-PCR titration kit (see Reagents). This will require viral RNA isolation from supernatant before qRT-PCR reaction to quantify viral RNA content. Calculating viral particles per milliliter of viral supernatant does not provide functional titration, but it ensures reproducibility even when using virus lacking a fluorescent protein. Alternatively, functional titration by FACS can be performed based on eGFP expression and calculating transducing units per milliliter.
The reprogramming process can be done in multiple cell culture media. Use the appropriate media for culturing the cancer cell type of choice throughout reprogramming. B16 were cultured in complete DMEM and 88MEL in complete RPMI (see Recipes 1 and 2).
Pre-warm appropriate volume of cell culture media for 5 min at 37 °C.
Cancer cell transduction is performed as described below for adherent (2a) and non-adherent cells (2b):
To transduce adherent cells seeded in a 100 mm tissue culture plate (Procedure A, Figure 1):
i. Resuspend the volume necessary containing of 4 × 10⁴ viral particles per cell in 10 mL.
Note: The range of 4 × 10⁴ viral particles per cell is optimal for B16 and 88MEL cancer cell lines and can be used as a starting point for similar cell types. However, it is recommended to evaluate the optimal multiplicity of infection (MOI) for efficient reprogramming without affecting cell viability for each individual cell cancer cell type. This is performed by testing increasing viral titers or volumes with known number of particles (determined by qRT-PCR) and assessing transduction efficiency at day 3 and reprogramming efficiency at day 9 (Figure 1). Optimal transduction efficiency with eGFP lentivirus is approximately 70%–80% at day 3. If the lentivirus lacks a fluorescent reporter, reprogramming efficiency can be assessed at day 9 by flow cytometric analysis using CD45 and MHC-II as read-out.
ii. Add 10 mL of polybrene solution to 10 mL of transduction media prepared in the previous step (final concentration: 8 mg/mL, see Recipe 5).
iii. Scale volume of transduction media, lentivirus particles, and polybrene according to the number of plates and plated cells.
iv. Incubate at 37 °C, 5% CO2 for 24 h in transduction media. Proceed to step B3.
To transduce non-adherent cells:
i. Resuspend cells in an adequate volume of media to a final density of 1 × 10⁶ cells/mL.
ii. Add optimized MOI of lentiviral particles for the cell type of choice followed by polybrene (final concentration: 8 mg/mL) to the cell suspension.
iii. Dispense 2 mL of cell suspension per well in a non-tissue-culture-treated 6-well plate.
Note: Non-adherent cells may require higher viral load for efficient reprogramming. It is recommended that viruses are titrated before this step (see note in previous step).
iv. Perform spin infection by centrifugation at 800× g for 1 h at room temperature.
v. After centrifugation, resuspend the cells and incubate at 37 °C, 5% CO2 for 24 h in transduction media.
Change media of transduced cells.
For adherent cultures, aspirate supernatant and carefully add media on top of the cells.
Note: Cautiously dispense media at low speed by adjusting settings in a pipette aid to avoid displacing transduced cells, especially semi-adherent cells.
For non-adherent cells, transfer cell suspension to a 50 mL centrifuge tube. Centrifuge cell suspension for 5 min at 350× g at room temperature, before resuspending cells in adequate media volume for a final density of 1 × 10⁶ cells/mL.
At day 3, observe cells under an inverted light microscope.
Note: Reprogramming-associated cell death is expected after transduction and during the first days of reprogramming (approximately 10%), which can be variable among different cell lines.
If transduced cancer cells in a 100 mm tissue culture plate reach 80% confluency at day 3, aspirate media, wash with room-temperature PBS, and add 1.5 mL of TrypLE Express. Incubate for the minimum amount of time needed until all cells have lifted (minimum 3 min). Resuspend cells in 7 mL of their usual fresh culture media and centrifuge at 350× g for 5 min at room temperature. Aspirate media and resuspend cells in 60 mL to passage 1:6 (i.e., to plate in 6 × 100 mm tissue culture plates). For large experiments, an 80% confluent 100 mm tissue culture plate can be divided into 3 × 150 mm tissue culture plates.
Note: Cell dilution can be adjusted according to cancer cell line of choice and experimental setup. Fast replicating cells can be diluted in 1:6 or 1:8 ratios. Slow dividing cells should be diluted in 1:3 or 1:4 ratios to avoid over dilution.
If transduced cancer cells are not 80% confluent and flow cytometric analysis will not be performed, just change media as in step B3.
For non-adherent cells, transfer cell suspension to a 50 mL centrifuge tube and count cells. Centrifuge at 350× g for 5 min at room temperature followed by resuspension in adequate volume of fresh media for a final density of 1 × 10⁶ cells/mL.
Transduction efficiency can be measured at day 3 of reprogramming by flow cytometric analysis of eGFP expression. Perform step B4a and collect 0.5–1 mL out of 7 mL of cell suspension for flow cytometric analysis in step B4e. Divide the remaining cells evenly on 100 mm or 150 mm plates according to dilution ratio.
Flow cytometric analysis at day 3: Divide the cell suspension collected in step B4d evenly in a sufficient number of round-bottom polystyrene tubes to include single color (SC) controls and fluorescence minus one (FMO) control to assess expression of other markers along with eGFP (i.e., CD45, MHC-II, and MHC-I) and establish the optimal fluorochrome panel and compensation settings. See Table 1 for an example of number of tubes and their contents for flow cytometric analysis of eGFP expression combined with surface staining for CD45, MHC-II, and MHC-I. Note that, by using a fluorescent tag protein like eGFP, all single-color staining will include eGFP as well and FMO eGFP cannot be done unless panel establishment is performed using vectors without eGFP. If measurements are done on the same machine, compensation settings are only required to be performed once during reprogramming, generally at day 5 post-transduction when marker expression is more intense (see step B6).
Table 1. Single-color and FMO tubes required for flow cytometry panel establishment
Sample Tube Fluorochromes Untransduced cancer cells Unstained Not applicable Viability dye Viability dye (i.e., DAPI) eGFP-transduced cancer cells SC eGFP Only eGFP eGFP all stained All antibodies and viability dye Tumor-APCs SC PE-Cyanine7 + eGFP Only PE-Cyanine7 antibody (i.e., anti-MHC-II) SC Allophycocyanin-Cyanine7 + eGFP Only Allophycocyanin -Cyanine7 antibody (i.e., anti-CD45) SC-Allophycocyanin + eGFP Only Allophycocyanin antibody (i.e., anti-MHC-I) FMO PE-Cyanine7 All antibodies except PE-Cyanine7 FMO Allophycocyanin All antibodies except Allophycocyanin FMO Allophycocyanin-Cyanine7 All antibodies except Allophycocyanin -Cyanine7 FMO viability dye All antibodies except viability dye Tumor-APCs all stained All antibodies and viability dye
Change media every 2–3 days, according to the color of the media and cell confluency until the endpoint of reprogramming.
Note: For cancer cells with high doubling rates, replace media every 24 h. Do not let cells reach >80% confluency, as high confluency levels result in low pH, altered metabolism, and mechanical stress that may affect the reprogramming process. Whenever 80% confluency is reached, split cells according to step 4a. For non-adherent cells, maintain cell density between 1 × 10⁶ and 2 × 10⁶ cells/mL during the reprogramming process.
The emergence of tumor-APCs can be assessed at days 5, 8, and 9 post-transduction by flow cytometric analysis.
For adherent cancer cells:
i. Aspirate media, wash with 3 mL of room-temperature PBS, and dissociate cells with 1.5 mL TrypLE Express per plate followed by incubation at 37 °C, 5% CO2 for 3 min (or until all cells have lifted from the plate).
ii. Harvest cells by resuspending them with 3 mL per 100 mm plate of cold MACS buffer (see Recipe 4, keep it at 4 °C) and transferring the resultant cell suspension to a conical 50 mL centrifuge tube. Centrifuge at 350× g for 5 min at 4 °C.
iii. Discard supernatant and resuspend a pellet equivalent to a 100 mm tissue culture plate in 3 mL of MACS buffer.
For non-adherent cells:
i. Resuspend the cells using serological pipettes and transfer culture suspension to a 50 mL centrifuge tube.
ii. Count cell number using a hemocytometer before centrifuging at 400× g for 5 min at 4 °C.
iii. Resuspend non-adherent cell cultures in an adequate volume of cold MACS buffer for a final concentration of 1 × 10⁶ cells/mL.
Cells are now ready for downstream analysis by flow cytometry, FACS-based purification for fluorescence microscopy, RNA-sequencing (RNA-seq), assay for transposase-accessible chromatin with sequencing (ATAC-seq), or MACS-enrichment.
Divide cell suspension evenly into 3–11 round-bottom tubes to assess stained and unstained samples. Include SC and FMO controls if it is the first time doing flow cytometric analysis (see step B4e and Table 1 for examples). CD45, MHC-II, and MHC-I can be used for FACS purification.
Reprogramming of cancer cells can be evaluated by RNA-seq data by quantifying mRNA expression of endogenous PU.1, IRF8, and BATF3, as well as antigen presentation genes and TLR genes (see Data analysis).
Purifying tumor-APCs for functional assays by MACS-enrichment
The MACS protocol here described was optimized for adherent murine melanoma cells using Miltenyi Biotec LS columns and MidiMACS separators. Further optimizations for different cancer cell types might be needed.
For experiments requiring large numbers of reprogrammed cancer cells, it is recommended to perform MACS-enrichment ensuring feasibility of the experiment and viability of the reprogrammed population. For experiments requiring tumor-APCs with >85% purity, it is recommended to perform MACS-enrichment 1–2 days before FACS. This will enrich total reprogrammed cells 10-fold and yield an average of 2 × 10⁶ reprogrammed cells at day 9 per 1 × 10⁶ cancer cells seeded at day -1 (Figure 1), reducing time for FACS purification.
At day 9 of reprogramming, detach cells as described in step B6a.
Resuspend and dissociate cells gently by pipetting up and down 10 times with 3 mL of cold MACS buffer per pellet from 100 mm tissue culture plate. Count cells using a hemocytometer and calculate total cell number.
Note: Adjust starting cell numbers depending on reprogramming efficiency and final application. For cancer cells that have low reprogramming efficiency (<10% of double-positive cells for CD45+ MHC-II+), we recommend starting with a minimum of 1 × 10⁷ cancer cells.
To perform quality control by flow cytometric analysis after the procedure is completed, it is recommended that 0.1–0.3 mL of cell suspension (pre-MACS) is stored on ice in a round-bottom tube.
Note: If a high level of cell debris and cell death is noticed, consider using a dead cell or debris removal kit in advance, as dying cells can bind unspecifically to antibodies and result in poor enrichment yields (see Table 6, Troubleshooting).
Centrifuge cell suspension from step 2 at 350× g for 5 min at 4 °C.
Note: The volumes included in the next steps are for 107 cells. Adjust volumes according to the total cell number obtained in step C2.
Aspirate supernatant and resuspend 107 cells in 0.1 mL of MACS buffer.
Pipette 2 µL of rat serum per 107 total cells of rat serum into the cell suspension.
(Critical) Place cells on ice and incubate for 15 min.
Note: It is crucial that incubation steps are always performed on ice to avoid capping of antibodies on the cell surface and non-specific cell labeling.
Pipette 0.125 µg of biotin-labeled anti-CD45 and 0.06 µg of biotin-labeled anti-MHC-II per 107 total cells. Resuspend cells by lightly vortexing the sample.
Note: the volume of antibodies may require further optimization (see Table 6, Troubleshooting). If the cell line of choice does not express a marker abundantly (CD45 or MHC-II), it is possible to perform MACS with one antibody only targeting the most expressed marker.
Place cell suspension on ice and incubate for 5 min. See General note 1 for an alternative to biotin beads.
Wash cells with 2 mL per 107 total cells of cold MACS buffer followed by centrifugation at 350× g for 5 min at 4 °C.
Aspirate supernatant and resuspend cells in 80 µL of cold MACS buffer per 107 total cells.
Add 20 µL of anti-biotin microbeads per 107 total cells and resuspend cell suspension by lightly vortexing the sample.
Place cells on ice and incubate for 15 min.
In the meantime, prepare magnetic MACS MultiStand and columns. Place the MACS MultiStand inside the laminar flow hood and attach magnetic MidiMACS separators.
Insert LS MACS columns into MidiMACS separators.
Equilibrate columns by washing with 3 mL of cold MACS buffer. Discard the liquid and place a 50 mL centrifuge tube under the column.
After incubation, wash cells by adding 2 mL of MACS buffer per 107 total cells followed by centrifugation at 350× g for 5 min at 4 °C.
Aspirate supernatant and resuspend cells in 1 mL per 107 total cells.
(Critical) For optimal enrichment, it is crucial to obtain a single-cell suspension at this step. Pipette up and down to remove cell clumps before introducing magnetic-labeled cells in columns. If necessary, filter cells through a 50 mm nylon mesh.
Note: When working with columns, always wait until the column reservoir is empty before proceeding to the next step.
(Critical) Transfer 0.5 mL of cell suspension onto the column. It is recommended to only apply 0.5–1 mL of filtered magnetic-labeled, single-cell suspension per column to avoid column clogging.
Wash column with 3 mL of MACS buffer. Repeat twice.
In this step, cells in flowthrough are untransduced and unsuccessfully reprogrammed cancer cells. It is recommended that 0.1–0.2 mL of flowthrough [post-MACS negative fraction, (-)] is saved for evaluation by flow cytometry after the protocol is completed. Place remaining cells on ice (see Table 6, Troubleshooting).
Remove column from the separator and place it on top of a 15 mL centrifuge tube. Wait for 1 min.
Pipette 5 mL of MACS buffer into the column reservoir and immediately but carefully plunge the liquid out of the column (see Table 6, Troubleshooting). In this step, the eluted cell suspension contains partial and complete reprogrammed tumor-APCs labeled by CD45 or MHC-II antibodies.
Centrifuge at 350× g for 5 min at 4 °C.
Resuspend cell pellet in 5 mL of media. Count cells using a hemocytometer.
(Critical) Save 0.1–0.2 mL of the cell suspension in step C23 [post-MACS positive fraction, (+)] for flow cytometric analysis.
Prepare enough round-bottom polystyrene tubes for the following samples: pre-MACS, post-MACS(-), post-MACS(+), unstained, viability stain (DAPI or fixable viability dye), and SC and FMO controls. Unstained, viability stain, SC, and FMO controls should be run with pre-MACS cell suspension saved in step 3 of this procedure. For example, for full quality control assessment, pre-MACS, post-MACS(-), and post-MACS(+) should be stained with fluorescently labeled anti-CD45 and anti-MHC-II and viability stain before flow cytometry evaluation (see Data analysis). Optionally, anti-MHC-I can also be used as a marker. See Table 2 for an example of number of tubes and specific contents for each before flow cytometric analysis.
Table 2. Example of number of tubes needed for flow cytometric analysis of MACS efficiency using pre-MACS and post-MACS samples
Sample Tube Fluorochromes Untransduced cancer cells Unstained Not applicable Viability dye Viability dye (i.e., DAPI) Pre-MACS SC staining See Table 1 FMO staining See Table 1 Pre-MACS All fluorochromes (anti-CD45, anti-MHC-II, optional anti-MHC-I) and viability dye Post-MACS(-) Post-MACS(-) All fluorochromes and viability dye Post-MACS(+) Post-MACS(+) All fluorochromes and viability dye eGFP-transduced cancer cells eGFP All fluorochromes and viability dye After quality control of the enriched tumor-APCs population, post-MACS positive fraction should contain >70% of partial and complete reprogrammed cells. Total number of cells expected after MACS enrichment is 2 × 10⁵–6 × 10⁶ cells per 106 cells seeded.
Resuspended cells are now ready for downstream application in functional antigen presentation assays, killing assays by activated CD8+ T cells, and in vivo intratumoral injections.
Note: Tumor-APCs exit the cell cycle during the reprogramming process and cannot expand as the original cancer cell (Zimmermannova et al., 2023). We did not test whether tumor-APCs can be freeze-thawed before functional assays. We recommend using freshly reprogrammed tumor-APCs for further applications.
Evaluate exogenous antigen presentation to Naïve murine CD4+ T cells
This part of the protocol is performed using reprogrammed murine B16 melanoma cells as tumor-APCs. eGFP-transduced cancer cells and BM-DCs should be included as negative and positive controls, respectively. See General note 2 for BM-DCs preparation and freezing before experimental setup. A minimum of 3.3 × 10⁵ BM-DCs are necessary. See General note 3 for alternative APCs to BM-DCs.
One day before MACS procedure, thaw one vial of BM-DCs (containing 3 × 10⁶ cells) by gently resuspending the frozen cells in 10 mL of pre-warmed complete RPMI for BM-DCs (see Recipe 3).
Transfer BM-DCs cell suspension to a 15 mL conical tube. Centrifuge at 350× g for 5 min at room temperature to remove freezing solution.
Aspirate supernatant and resuspend BM-DCs in 10 mL of new RPMI for BM-DCs. Plate cell suspension in a non-tissue-culture-treated Petri dish. Incubate cells overnight at 37 °C, 5% CO2.
After MACS enrichment of tumor-APCs, count enriched cells and prepare a microcentrifuge tube with 1 × 10⁶ resuspended tumor-APCs.
Note: 1 × 10⁶ tumor-APCs is ideal to account for pipetting errors. The minimum number of tumor-APCs that can be used for this protocol is 3 × 10⁵.
Centrifuge tumor-APCs at 350× g for 5 min at room temperature. Remove supernatant and resuspend tumor-APCs in 0.5 mL of complete RPMI for BM-DCs.
Detach eGFP-transduced cancer cells as described in step B6a. Resuspend cells in 10 mL of warm media and calculate cell concentration using a hemocytometer.
Prepare a microcentrifuge tube with 1 × 10⁶ eGFP-transduced cancer cells and repeat step D5.
Prepare a tissue-culture-treated 96-well U-shaped bottom plate with media only as described below (see Table 3 for an example of the experimental setup):
Table 3. Experimental setup for antigen presentation using tumor-APCs and control eGFP-transduced cells in a tissue-culture-treated 96-well U-shaped bottom plate
Wells A B C D E F G 1 Tumor-APCs
NATumor-APCs
OVA 323–339eGFP-transduced cancer cells
NAeGFP-transduced cancer cells
OVA 323–3392 3 4 9 Tumor-APCs
NA
Poly(I:C)Tumor-APCs
OVA 323–339
Poly(I:C)eGFP-transduced cancer cells
NA
Poly(I:C)GFP-transduced cancer cells
OVA 323–339
Poly(I:C)10 11 12 Prepare 1.5 mL of RPMI for BM-DCs, no antigen (NA) added. Pipette 0.1 mL of this media in eight wells.
Prepare 1.5 mL of RPMI for BM-DCs, 10 mg/mL poly(I:C), NA added. Pipette 0.1 mL of this media in eight wells.
Note: Alternatively, or in conjunction with poly(I:C), other TLR agonists can be used.
Prepare 1.5 mL of RPMI for BM-DCs, 10 mg/mL OVA 323–339. Pipette 0.1 mL of this media in eight wells.
Prepare 1.5 mL of RPMI for BM-DCs, 10 mg/mL poly(I:C), and 10 mg/mL OVA 323–339. Pipette 0.1 mL of this media in eight wells.
Note: Other TLR agonists can be used, replacing or in combination with poly(I:C).
(Critical) Resuspend and pipette 5 µL (dispensing 1 × 10⁴ cells per well) of each APC suspension (tumor-APC or eGFP-transduced cancer cells) in the middle of their assigned U-shaped bottom wells (see Table 3) and observe each well under the microscope. It is important that seeded cells cluster together at the center of the well for optimal antigen presentation.
Note: Avoid dispersing cells in the walls of the plate. This will ensure maximum contact between APCs and T cells.
Prepare BM-DCs by transferring the supernatant from step D3 to a conical 15 mL centrifuge tube and resuspend well. Calculate cell density using a hemocytometer.
Transfer 1 × 10⁶ BM-DCs to a microcentrifuge tube. Centrifuge cells at 350× g for 5 min at room temperature. Aspirate supernatant as much as possible and resuspend cells in 0.5 mL of complete RPMI for BM-DCs.
Prepare a non-tissue-culture-treated 96-well U-shaped bottom plate with media only as described below (see Table 4 for an example of the control samples setup):
Prepare 0.7 mL of RPMI for BM-DCs, NA added. Pipette 0.1 mL in wells A1–A4.
Prepare 0.7 mL of RPMI for BM-DCs, 10 mg/mL poly(I:C). Pipette 0.1 mL in wells C1–C4.
Prepare 1.8 mL of RPMI for BM-DCs, 10 mg/mL OVA 323–339. Pipette 0.1 mL of media in wells A9-A12. Add 0.1 mL of media to wells E1–E12, which will be later used as staining controls for flow cytometric analysis.
Prepare 0.7 mL of RPMI for BM-DCs, 10 mg/mL Poly(I:C), and 10 mg/mL OVA 323–339. Pipette 0.1 mL in wells C9–C12.
(Critical) Resuspend BM-DCs from step D11, pipette 5 µL (dispensing 1 × 10⁴ cells per well) in the middle of each U-shaped bottom wells (see Table 4), and observe each well under the microscope. It is important that seeded cells cluster together at the center of the well for optimal antigen presentation.
Note: BM-DCs are used as a positive control for the assay. Alternatively, it is possible to seed up to 6 × 10⁴ cells per well. Adjust final resuspension volume to pipette only 5 µL per well and keep seeded cells in the center of the well.
Table 4. Experimental setup for antigen presentation using BM-DCs in a non-tissue-culture-treated 96-well U-shaped bottom plate
Wells A B C D E 1 BM-DC
NABM-DC
NA
Poly(I:C)BM-DC
OVA 323–3392 3 4 5 6 7 8 9 BM-DC
OVA 323–339BM-DC
OVA 323–339
Poly(I:C)10 11 12 Incubate all 96-well plates at 37 °C, 5% CO2 overnight (12–16 h). Observe cells the day after. All cells should be gathered at the center of the well.
On the day after seeding APCs for antigen presentation assays, start by preparing sterile forceps, tweezers, a pair of scissors, and 20 mL of cold MACS buffer. This will be used for spleen isolation.
Euthanize OT-II mice according to protocols approved by local ethical committees and the regulations of the animal facility where the procedure is being conducted. For this protocol, mice were sacrificed in a CO2 chamber followed by cervical translocation.
Note: To calculate the number of mice needed, estimate how many Naïve T cells are necessary for the whole assay, considering that the number seeded per well is 1 × 10⁵ cells. The number of isolated Naïve CD4+ T cells is expected to be between 1.5 × 10⁶ and 3 × 10⁶ cells per spleen. For the setup exemplified in this protocol, a total of 7 × 10⁶ Naïve T cells will be needed.
Place mice on a surface where they can lie on the left side facing upwards (see Data analysis).
Spray the torso with 70% ethanol to reduce the chance of contamination.
Cut the skin and peritoneum right below the thorax and slightly off center to the left of the mouse’s body to reveal the spleen (see Data analysis).
Note: If the spleen looks enlarged (splenomegaly) or black, discard the carcass and the spleen.
Pull out and hold the spleen with the help of tweezers with fine tips and cut the connective tissue and fat attached to the spleen.
Note: Removing connective tissue and fat as much as possible at this stage will facilitate Naïve T-cell isolation by avoiding cell clumping.
Remove the spleen and store it in cold MACS buffer prepared in step D15. Repeat for the number of mice sacrificed.
Discard the carcasses according to local animal facility’s procedures and continue the protocol under sterile conditions.
Place a 45 mm cell strainer on top of a 50 mL centrifuge tube.
Place a 45 mm cell trainer inside a Petri dish. Pipette 3 mL of cold MACS buffer to prepare the filter.
Using forceps or a pipette, place one spleen inside the cell strainer. With the help of a 5 mL syringe pestle, crush the spleen against the cell strainer mesh.
Once most of the spleen is crushed, remove filter from plate. With a 10 mL serological pipette, pipette 5 mL of MACS buffer into the plate and wash the plate before transferring the cell suspension through the cell strainer from step D23. Serial filtration will avoid cell clumping with connective tissue and fat in later stages.
Repeat steps D24–D26 for every spleen.
Note: The filter from step D23 and the plate from step D24 can be reused for up to four spleens. Substitute filter in step 24 for every new spleen that needs to be crushed. The syringe pestle can be reused for all spleens. If needed, use several centrifuge tubes to collect the samples.
When splenocytes collection is finished, centrifuge cell suspension at 350× g for 5 min at room temperature.
Meanwhile, prepare red blood cell lysis solution. Pipette 0.1 mL of BD Pharm Lyse solution for every 0.9 mL of sterile room temperature Milli-Q water. Keep this solution in the dark. Use 1 mL of this solution per spleen, i.e., for 15 spleens, prepare 15 mL of BD Pharm Lyse solution as described.
Note: Alternatively, red blood cells can be lysed using ammonium chloride solution.
Aspirate supernatant of splenocytes solution. Resuspend solution in the appropriate volume of red blood cell lysis solution prepared in step D29 (1 mL per spleen) and incubate splenocytes for 8 min at room temperature in the dark.
Stop the reaction by adding 50 mL of cold MACS buffer. If you notice aggregates floating, filter through a 45 mm mesh.
Note: It is important that these aggregates are removed at this step to avoid loss of Naïve T cells in clumps.
Centrifuge filtered cell suspension at 350× g for 5 min at 4 °C.
Aspirate the supernatant and resuspend cells in 10–30 mL of cold MACS buffer. Count splenocytes using a hemocytometer.
Note: If splenocytes were separated into different centrifuge tubes, they can be combined at this point of the procedure. Resuspend all the pellets and combine them in a single cell suspension together in one tube. The cell suspension should look dense and cloudy. Dilute the sample before counting.
Centrifuge cell suspension at 350× g for 5 min at 4 °C. Aspirate supernatant and resuspend the pellet in 40 µL of MACS buffer per 1 × 10⁷ total cells.
Proceed by following manufacturer’s protocol for Naïve CD4+ T-cell isolation (mouse Miltenyi kit). Naïve cells are unlabeled by the kit and are found in the negative fraction.
After isolating Naïve CD4+ T cells, count the number of cells using a hemocytometer.
Note: If the number of Naïve CD4+ T cells is higher than 5 × 10⁶ per spleen, it is recommended to repeat the Naïve CD4+ T-cell isolation kit protocol to avoid contamination with activated CD4+ T cells and other cell lineages.
For each well containing APCs, prepare 1 × 10⁵ T cells labeled with CellTrace Violet (CTV) as follows:
Transfer the volume of cell suspension necessary to contain 5.5 × 10⁶ Naïve CD4+ T cells for 48 assay wells in addition to five more wells for control staining (see step D47 for flow cytometric analysis). Keep the leftover Naïve CD4+ T cells on ice for later use. Centrifuge cell suspension at 350× g for 5 min at 4 °C.
Prepare CTV according to manufacturer’s protocol by resuspending the powder in 20 mL of dimethyl sulfoxide (provided in the kit).
Aspirate supernatant and resuspend cells in 5.5 mL of cold PBS with no additives for a final density of 1 × 10⁶ cells/mL. Pipette 5.5 µL of CTV reagent into the cell suspension (1 µL per 1 × 10⁶ T cells).
Incubate T cells in a water bath at 37 °C for 20 min.
After incubation, add five times the initial staining volume of MACS buffer to block staining and incubate for 5 min in the water bath.
Centrifuge cells at 350× g for 5 min at 4 °C and aspirate supernatant. Resuspend T cells in RPMI for BM-DCs for a final cell density of 1 × 10⁶ cells/mL.
Prepare the different conditions of T cells as follows:
Prepare 1.2 × 10⁶ Naïve T cells in RPMI for BM-DCs, corresponding to 1.2 mL from the cell suspension prepared in step D37f, and dispense 0.1 mL (dispensing 1 × 10⁵ T cells per well) on top of the wells for the following conditions: Tumor-APCs NA, eGFP-transduced cancer cells NA, and BM-DCs NA.
Prepare 1.2 × 10⁶ Naïve T cells in RPMI for BM-DCs, corresponding to 1.2 mL from the cell suspension prepared in step D37f, add 10 mg/mL poly(I:C), and dispense 0.1 mL (dispensing 1 × 10⁵ T cells per well) on top of the wells for the following conditions: Tumor-APCs NA poly(I:C), eGFP-transduced cancer cells NA poly(I:C), and BM-DCs NA poly(I:C).
Prepare 1.9 × 10⁶ Naïve T cells in RPMI for BM-DCs, corresponding to 1.9 mL from the cell suspension prepared in step D37f, add 10 mg/mL OVA 323–339, and dispense 0.1 mL (dispensing 1 × 10⁵ T cells per well) on top of the wells for the following conditions: Tumor-APCs OVA, eGFP-transduced cancer cells OVA, and BM-DCs OVA. Include five wells of the extra BM-DCs OVA condition seeded on the day prior (for example, on top of wells E1–E5).
Prepare 1.2 × 10⁶ Naïve T cells in RPMI for BM-DCs, corresponding to 1.2 mL from the cell suspension prepared in step D37f, add 10 mg/mL OVA 323–339 and 10 mg/mL poly(I:C), and dispense 0.1 mL (dispensing 1 × 10⁵ T cells per well) on top of the wells for the following conditions: Tumor-APCs OVA poly(I:C), eGFP-transduced cancer cells OVA poly(I:C), and BM-DCs OVA poly(I:C).
Note: B16 cancer cells do not express MHC-II before reprogramming (see Data analysis). Therefore, it is not needed to wash away the peptide from supernatant in 96-well plates and it is recommended to keep the peptides until the end of co-culture. However, if the cell line of choice expresses MHC-II before reprogramming, it is recommended to centrifuge the 96-well plates at 350× g for 5 min at room temperature, before plating Naïve T cells on top of the APCs. Remove supernatant by flipping the plate downwards in a fast movement, wash the wells with fresh RPMI media, centrifuge for 5 min at room temperature, and remove media again before proceeding with step D38.
For the leftover extra wells for BM-DCs OVA, prepare 8 × 10⁵ unlabeled Naïve CD4+ T cells from step D37a by resuspending the cells in 0.8 mL of RPMI for BM-DCs and adding 10 mg/mL of OVA 323–339.
Pipette 0.1 mL of unlabeled T-cell resuspension on top of each of the remaining six wells (for example, wells E6–E11), dispensing 1 × 10⁵ T cells per well. These samples will be used for flow cytometric analysis (see step D47).
Incubate plates with co-cultures at 37 °C, 5% CO2 for four full days. Analysis is done at day 5.
Antigen presentation is evaluated by OT-II CD4+ T cells proliferation on a flow cytometer. Prepare antibody staining solution by mixing 0.5 µL of rat serum, 0.5 µL of antibody anti-CD4 PE-Cyanine7, anti-TCRbeta allophycocyanin, and anti-CD44 allophycocyanin-Cyanine7 per 0.1 mL of MACS buffer per sample.
Add to the antibody staining solution fixable viability dye eFluor 520 (FVD520) at a 1:100 dilution (1 µL per 0.1 mL per sample)
Centrifuge 96-well U-shaped bottom plates with T cell tumor-APCs, eGFP-transduced cancer cells, or BM-DCs co-cultures at 350× g for 5 min at 4 °C.
Flip the plate in a fast movement to remove media.
Add 0.1 mL of antibody-viability dye staining solution per well.
Separately, prepare staining controls as follows (see Table 5):
Table 5. Single-color and FMO staining controls for flow cytometric analysis of T-cell activation and expansion
Sample/well Tube Fluorochrome Unlabeled T cells
(from BM-DC OVA 323–339 wells E6-E11)Unstained Not applicable Viability dye Viability dye (FVD) SC CD4 Only antibody for CD4 SC CD44 Only antibody for CD44 SC TCR Only antibody for TCR FMO CTV All antibodies and viability dye CTV-labeled T cells
(from BM-DC OVA 323–339 wells E1-E5)SC CTV Not applicable FMO CD4 All antibodies except anti-CD4 and viability dye FMO CD44 All antibodies except anti-CD44 and viability dye FMO TCR All antibodies except anti-TCR and viability dye FMO viability dye All antibodies except viability dye Single color staining for CD4, CD44, TCR, and FVD and FMO CTV are done using unlabeled T cells from BM-DCs OVA condition.
Single color staining for CTV and FMO CD4, CD44, TCR, and FVD are done using CTV-labeled T cells from BM-DCs OVA condition.
Reserve the supernatant of one well to use as unstained control.
Incubate plates for 30 min at 4 °C, protected from light.
Add 0.1 mL of cold MACS buffer to each well and centrifuge plates at 350× g for 5 min at 4 °C.
Flip the plates to remove staining solution and resuspend the cell pellets in the 96-well plates in 100 µL of cold MACS buffer before going to a flow cytometer.
Flow cytometry analysis can be done directly from the 96-well plate using a high-throughput screening device attached to the flow cytometer. Alternatively, pipette each sample to a polystyrene tube prior to acquisition.
OT-II proliferation is measured by gating within live, single CD4+ TCR+ CD44+ CTVlow population of CD4+ T cells, with T-cell division assessed by loss of CTV staining overtime (see Data analysis).
Note: This protocol can also be used for assessing antigen presentation through MHC-I to Naïve CD8+ T cells (Zimmermannova et al., 2023). Instead of using OVA 323–339, incubate APCs with OVA 257-264 (SIINFEKL) or OVA protein. Wash peptide before co-culture with Naïve T cells, as some cells naturally express MHC-I that leads to unspecific binding. Instead of using OT-II mouse strain, collect spleens from OT-I mouse strain (C57BL/6-Tg(TcraTcrb)1100Mjb/J) as described in steps D16–35, and isolate Naïve CD8+ T cells using appropriate kits. Co-culture with Naïve CD8+ T cells should be shortened to three days instead of four. In this scenario, anti-CD4 is substituted for anti-CD8 in the same color, PE-Cyanine7.
Human tumor-APCs can also be used for antigen presentation assays by pulsing tumor-APCs with peptides derived from cytomegalovirus (CMV) and melanoma-associated antigen recognized by T cells (MART-1), followed by co-culture with CD8+ T cells isolated from CMV+/MART-1+ donors. Flow cytometric analysis is done at day 8 of co-culture and read-out is obtained from tetramer staining against CMV or MART1 and intracellular staining for IFN-γ and TNF-α to assess activation (Zimmermannova et al., 2023). In addition to antigen presentation assays, tumor-APCs can be employed in killing assays, by co-culturing with activated T cells followed by assessing T cell–mediated cytolysis by flow cytometry or by electric impedance with the xCELLigence Real-time Cell Analysis Assay (Zimmermannova et al., 2023). Finally, tumor-APCs can be used for therapeutic intratumoral vaccination protocols. In all applications described here, tumor-APCs derived from cancer cell lines and primary samples can be used.
Data analysis
Mouse and human melanoma cells are amenable to direct cell reprogramming by overexpression of PU.1, IRF8, and BATF3 (Figure 1), imposing a cDC1 cell-like cell fate (Zimmermannova et al., 2023). Tumor-APCs can be harvested at days 3, 5, 8, or 9 of reprogramming to assess reprogramming efficiency by immunophenotyping and transcriptional profiling (Figure 1). Reprogramming efficiency is assessed at reprogramming day 9 by flow cytometry through the emergence of partial (CD45+ or MHC-II+) and completely reprogrammed (CD45+MHC-II+) populations within transduced cells (eGFP+) (Figure 2A–2B), reflecting the transition to the hematopoietic lineage and acquisition of antigen presentation machinery. Additionally, we tested the expression of immune checkpoint inhibitors CD274, ICOSL, TIM3, and VISTA at cell surface of reprogrammed cells (Figure 2C–2D). Overall, we show that reprogrammed cells express these molecules at levels in a similar range to natural cDC1 cells isolated from mouse spleens (live, lineage negative for B220, CD3, NK1.1, CD19, and Gr1, MHC-II+CD11c+CD8a+) and human peripheral blood (live, lineage negative for B220, CD3, CD56, and CD19, HLADR+CD11c+CD141+).
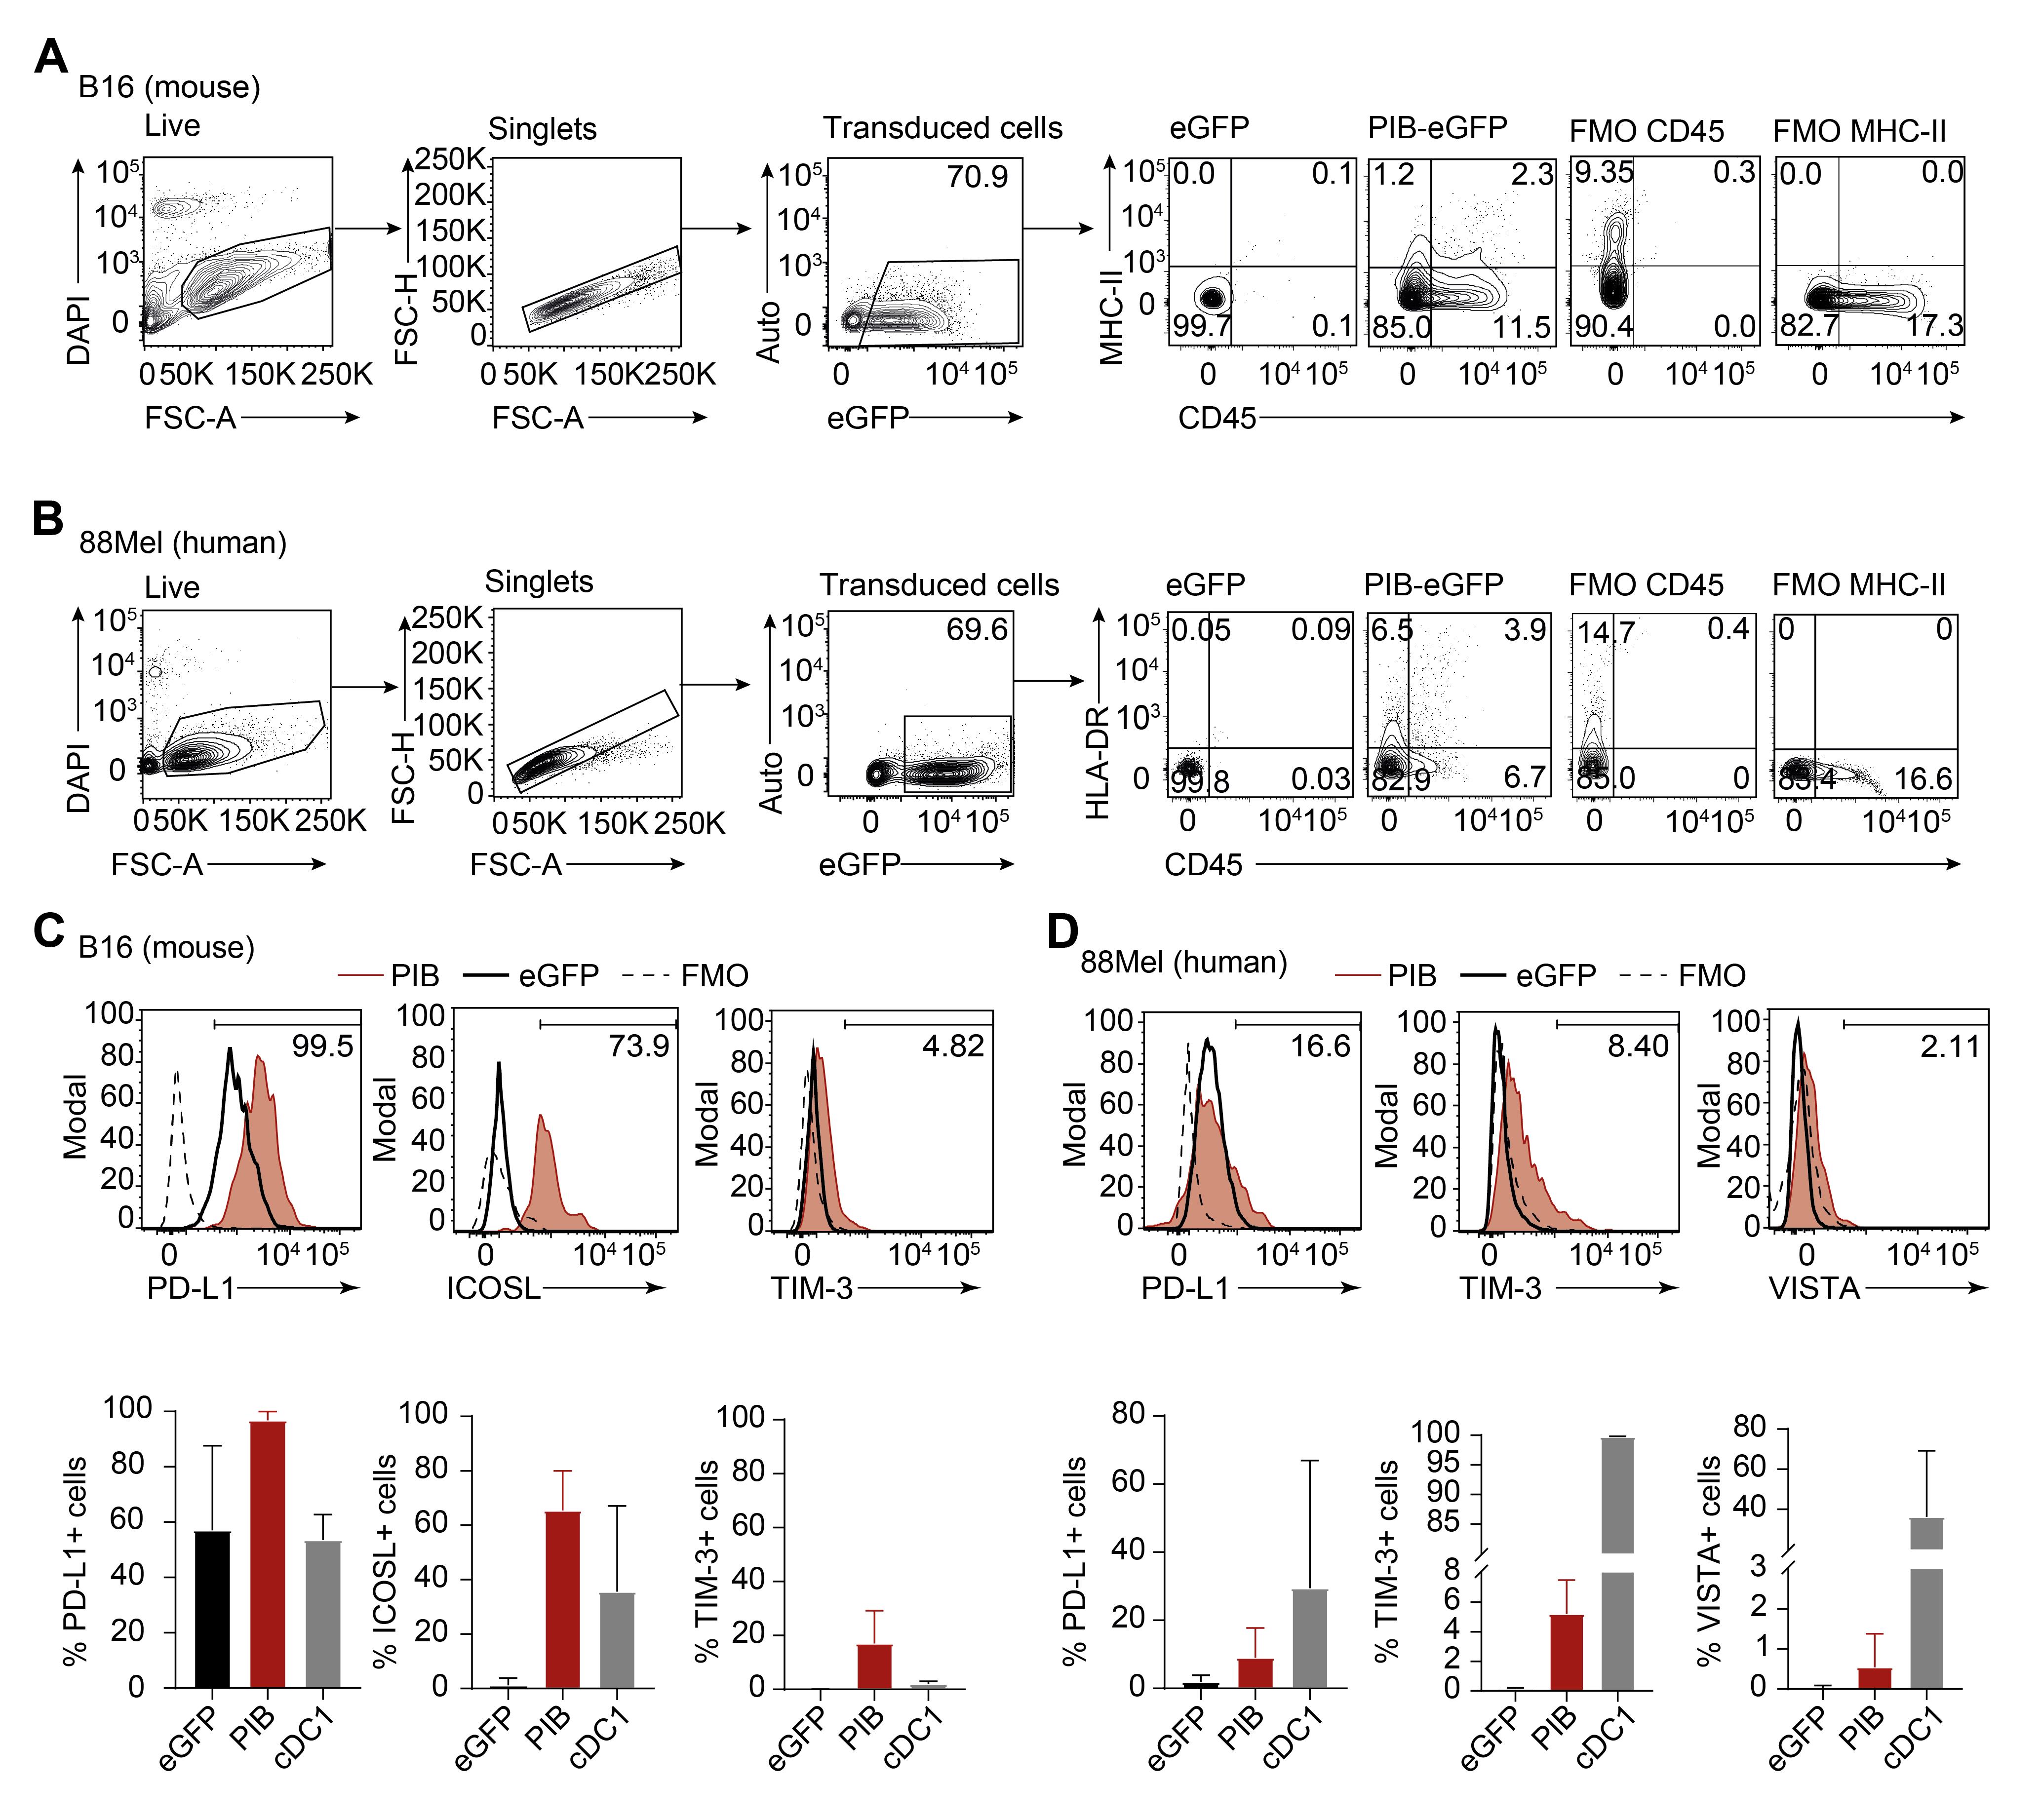
Figure 2. Immunophenotyping human and mouse-derived eGFP-transduced cancer cells by flow cytometry. A. Gating strategy to analyze the reprograming efficiency of mouse-derived eGFP-transduced cancer cells and B. human-derived eGFP-transduced cancer cells at day 9 post induction of PU.1, IRF8, and BATF3 (PIB). Live cells were gated on viability dye negative population (4,6-diamidino-2-phenylindole, DAPI) followed by singlet selection. Expression of CD45+MHC-II+ was quantified by flow cytometry following a gating strategy based on fluorescence minus one (FMO) staining. eGFP-transduced cells were used as controls. C. Mouse and D. human tumor-APCs were evaluated by flow cytometry for the expression of PD-L1, ICOSL, TIM-3, and VISTA at day 9 of reprogramming. The gating strategy was based on FMO for the respective fluorochrome. eGFP-transduced cancer cells and splenic (mouse, live, lineage negative for B220, CD3, NK1.1, CD19, and Gr1, MHC-II+CD11c+CD8a+) or peripheral blood (human, live, lineage negative for B220, CD3, CD56, and CD19, HLADR+CD11c+CD141+) cDC1 cells were used as controls (biological replicates n = 3–11). Mean ± SD is represented.
Population RNA-seq data can also be used to validate the successful acquisition of a tumor-APC transcriptional program in purified CD45+MHC-II+/HLA-DR+ cancer cells (Zimmermannova et al., 2023). For example, we have previously demonstrated that reprogrammed eGFP+ cancer cells upregulate endogenous gene expression PU.1, IRF8, and BATF3 as well as start expressing the APC machinery at the mRNA level. Gene set enrichment analysis using RNA-seq data can also be used to follow tumor-APC maturity. In contrast to eGFP transduced cancer cells, we observed that reprogrammed tumor-APCs derived from mouse melanoma and lung carcinoma cells activate the expression of Tlr1-6 (Figure 3). These findings are consistent with the expression of co-stimulatory molecules following TLR stimuli with Poly(I:C) and lipopolysaccharide (Zimmermannova et al., 2023).
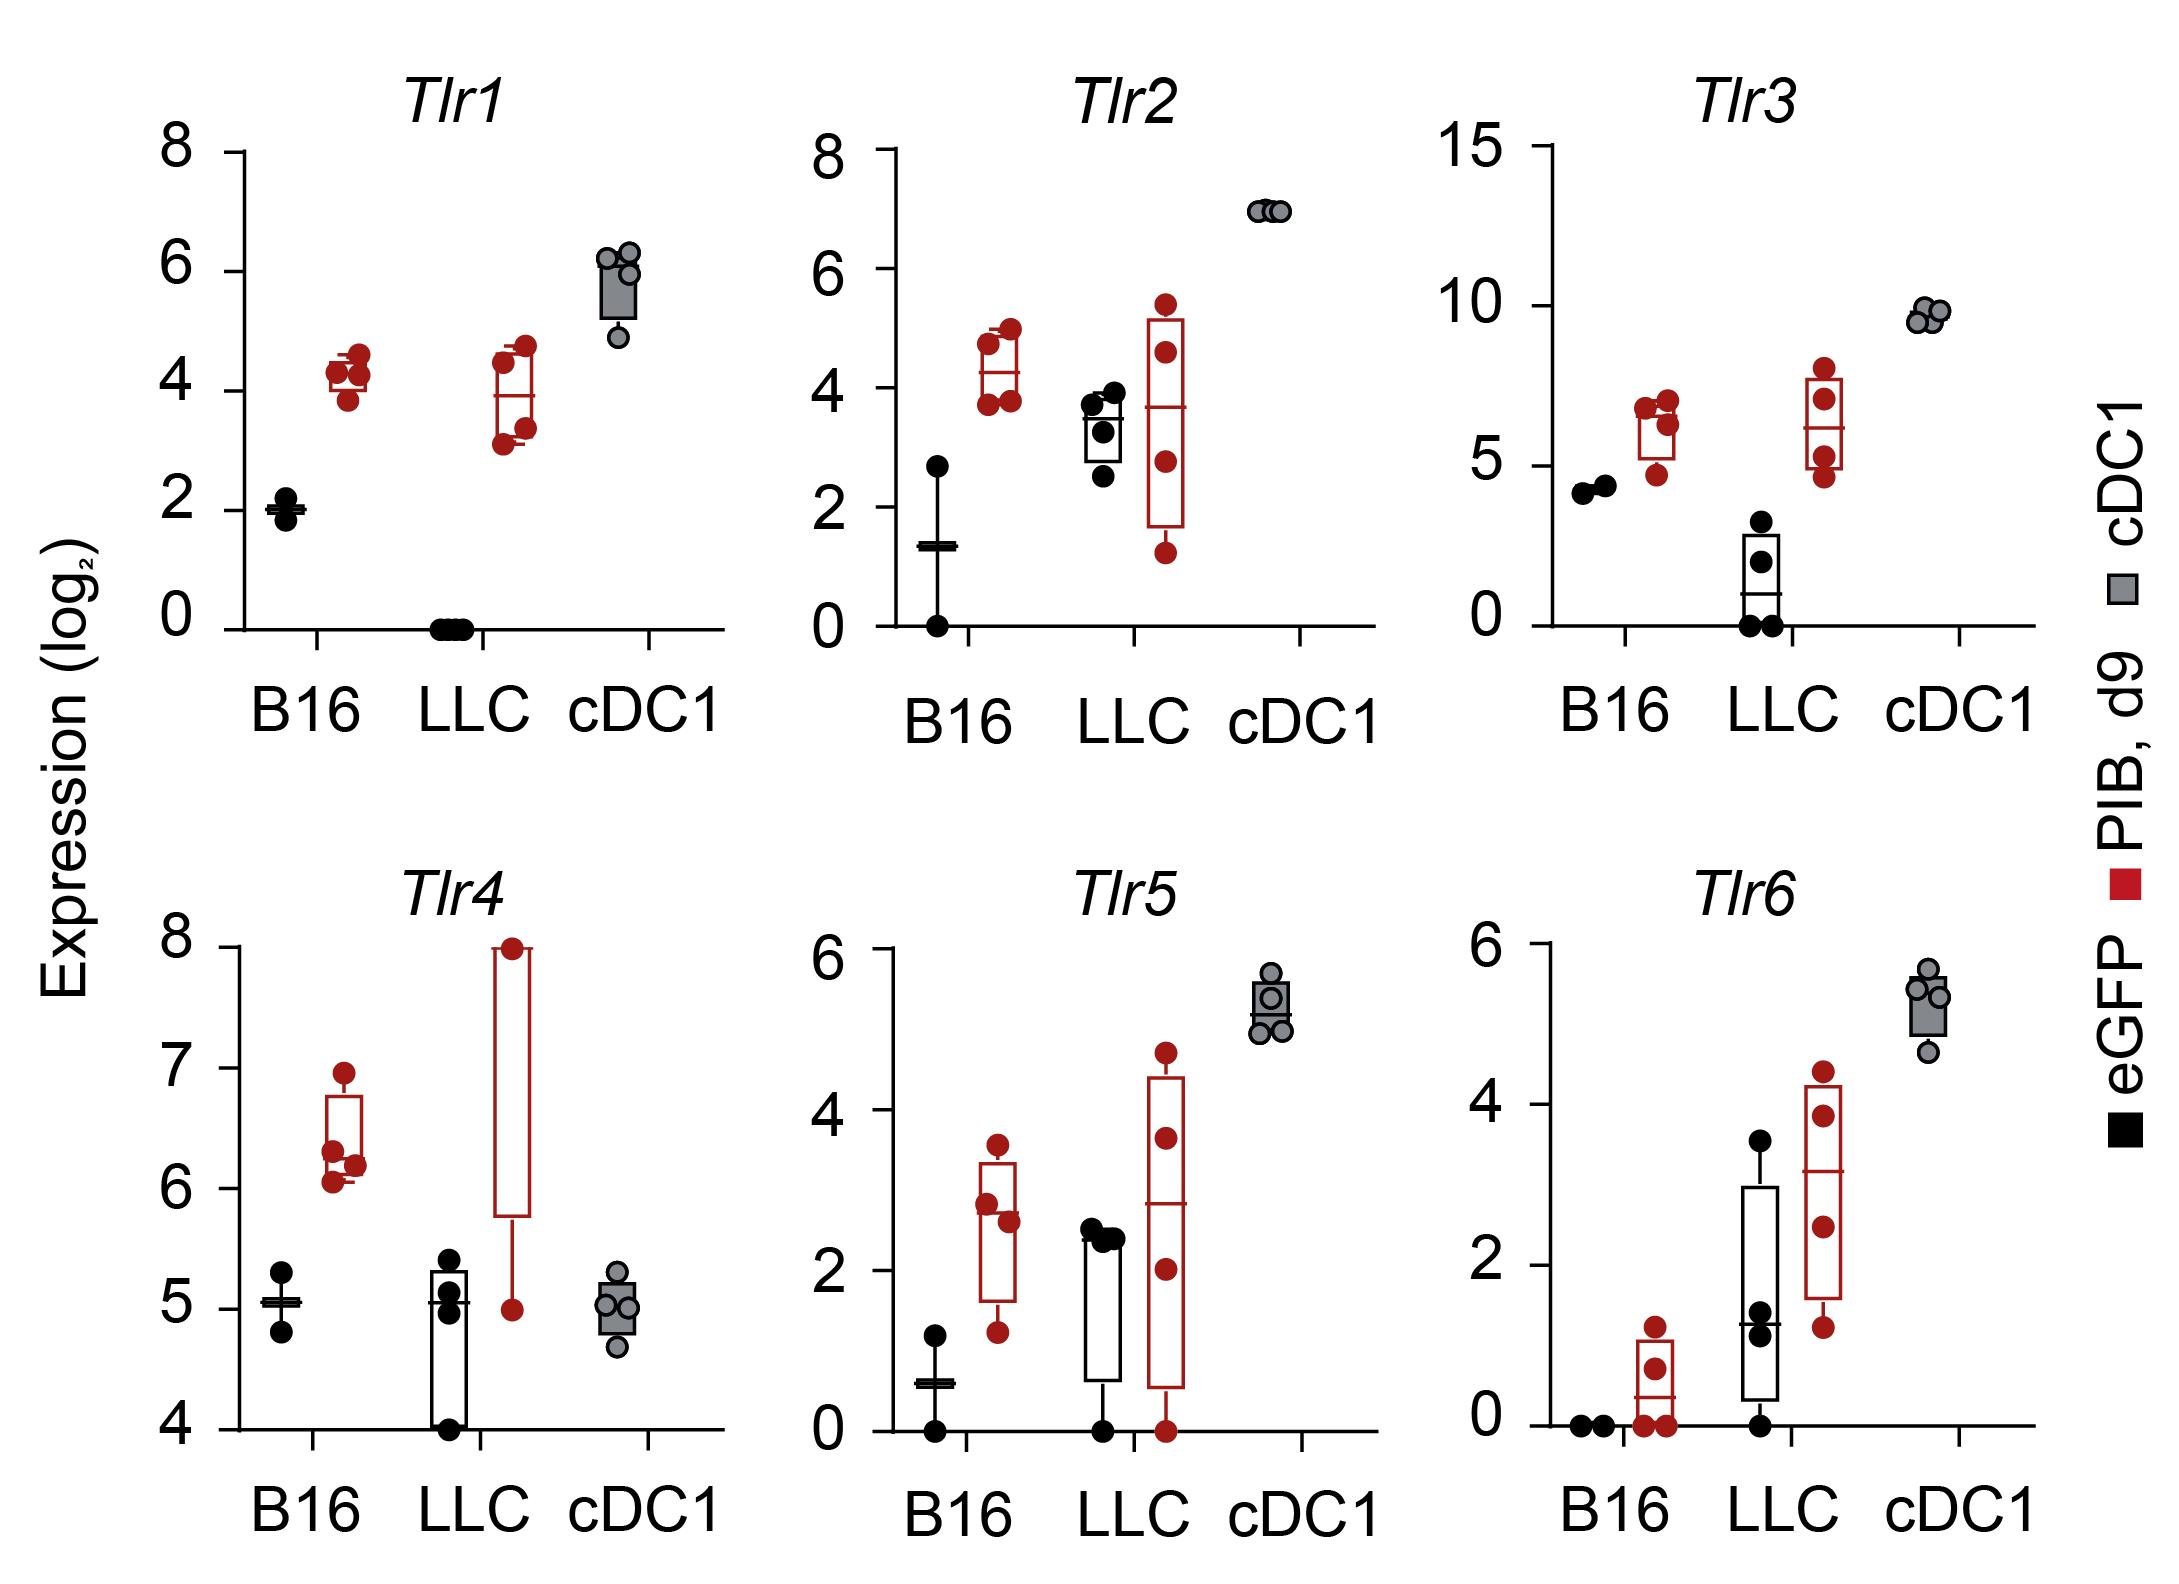
Figure 3. Profiling PIB-eGFP-transduced cancer cells maturity by toll-like receptor (TLR) analysis. Genes encoding murine Tlr1-6 are expressed in mouse melanoma and lung cancer cells (B16, LLC, eGFP+CD45+MHC-II+) on reprogramming day 9 after PIB induction (red) and splenic conventional dendritic cells type 1 (cDC1, MHC-II+CD11c+CD8a+). After 9 days post transduction with PIB, tumor-APCs (eGFP+MHC-II+CD45+), eGFP-transduced cancer cells (eGFP+MHC-II-CD45-), and splenic cDC1 cells (MHC-II+CD11c+CD8a+) were FACS purified. Transcriptome was assessed by bulk RNA sequencing to quantify gene expression (Rosa et al., 2018; Zimmermannova et al., 2023, GSE103618, GSE184527). Gene expression is depicted as whisker-box plots with minimum, maximum, mean, and standard deviation shown. As an alternative, RT-qPCR can be executed to quantify the expression of TLR and assess the tumor-APCs maturation profile.
Tumor-APC function can be assessed by cytokine secretion, endogenous and exogenous antigen presentation capacity, CD8+ T cell–mediated killing assays, and enhanced in vivo anti-tumor activity (Figure 1). However, due to the number of cells required for these applications, enrichment for the reprogrammed population is required. Here, we describe an optimized protocol for enriching reprogrammed murine cancer cells using a MACS-based purification (Figures 4A–4B). Quality control is performed by flow cytometry through viability, total transduced cells (eGFP+), and total percentage of cells expressing either CD45, MHC-II, or both markers (partial and complete reprogrammed cells) (Figures 4C–4D). eGFP+ expression is confirmed in the majority of reprogrammed PIB-eGFP-transduced cancer cells after MACS isolation [post-MACS(+), % eGFP+ cells 73.94 ± 16.81], contrasting with 34.60 ± 23.09% and 32.62 ± 22.00% of successfully transduced cells found in pre-MACS and post-MACS(-) fraction (Figure 4E). More importantly, the enriched positive fraction [post-MACS(+)] contains 72.23 ± 12.74% of partially and complete reprogrammed cells (Figure 4F). This enrichment is supported by low percentages of reprogrammed cells in post-MACS-negative fraction [post-MACS(-), 5.82 ± 4.1%], which represents a 10-fold enrichment from pre-MACS (10.97 ± 7.45%) to the post-MACS(+) fraction (Figure 4F). Additional phenotypic analysis by evaluation of MHC-I expression illustrates that tumor-APCs express more MHC-I molecules according to higher mean intensity fluorescence (MFI) than eGFP-transduced cancer cells (Figure 4G, H). This optimized protocol for purification of tumor-APCs can yield approximately 2 × 10⁶ total cells per 1 × 10⁶ cells seeded cancer cells at day -1.
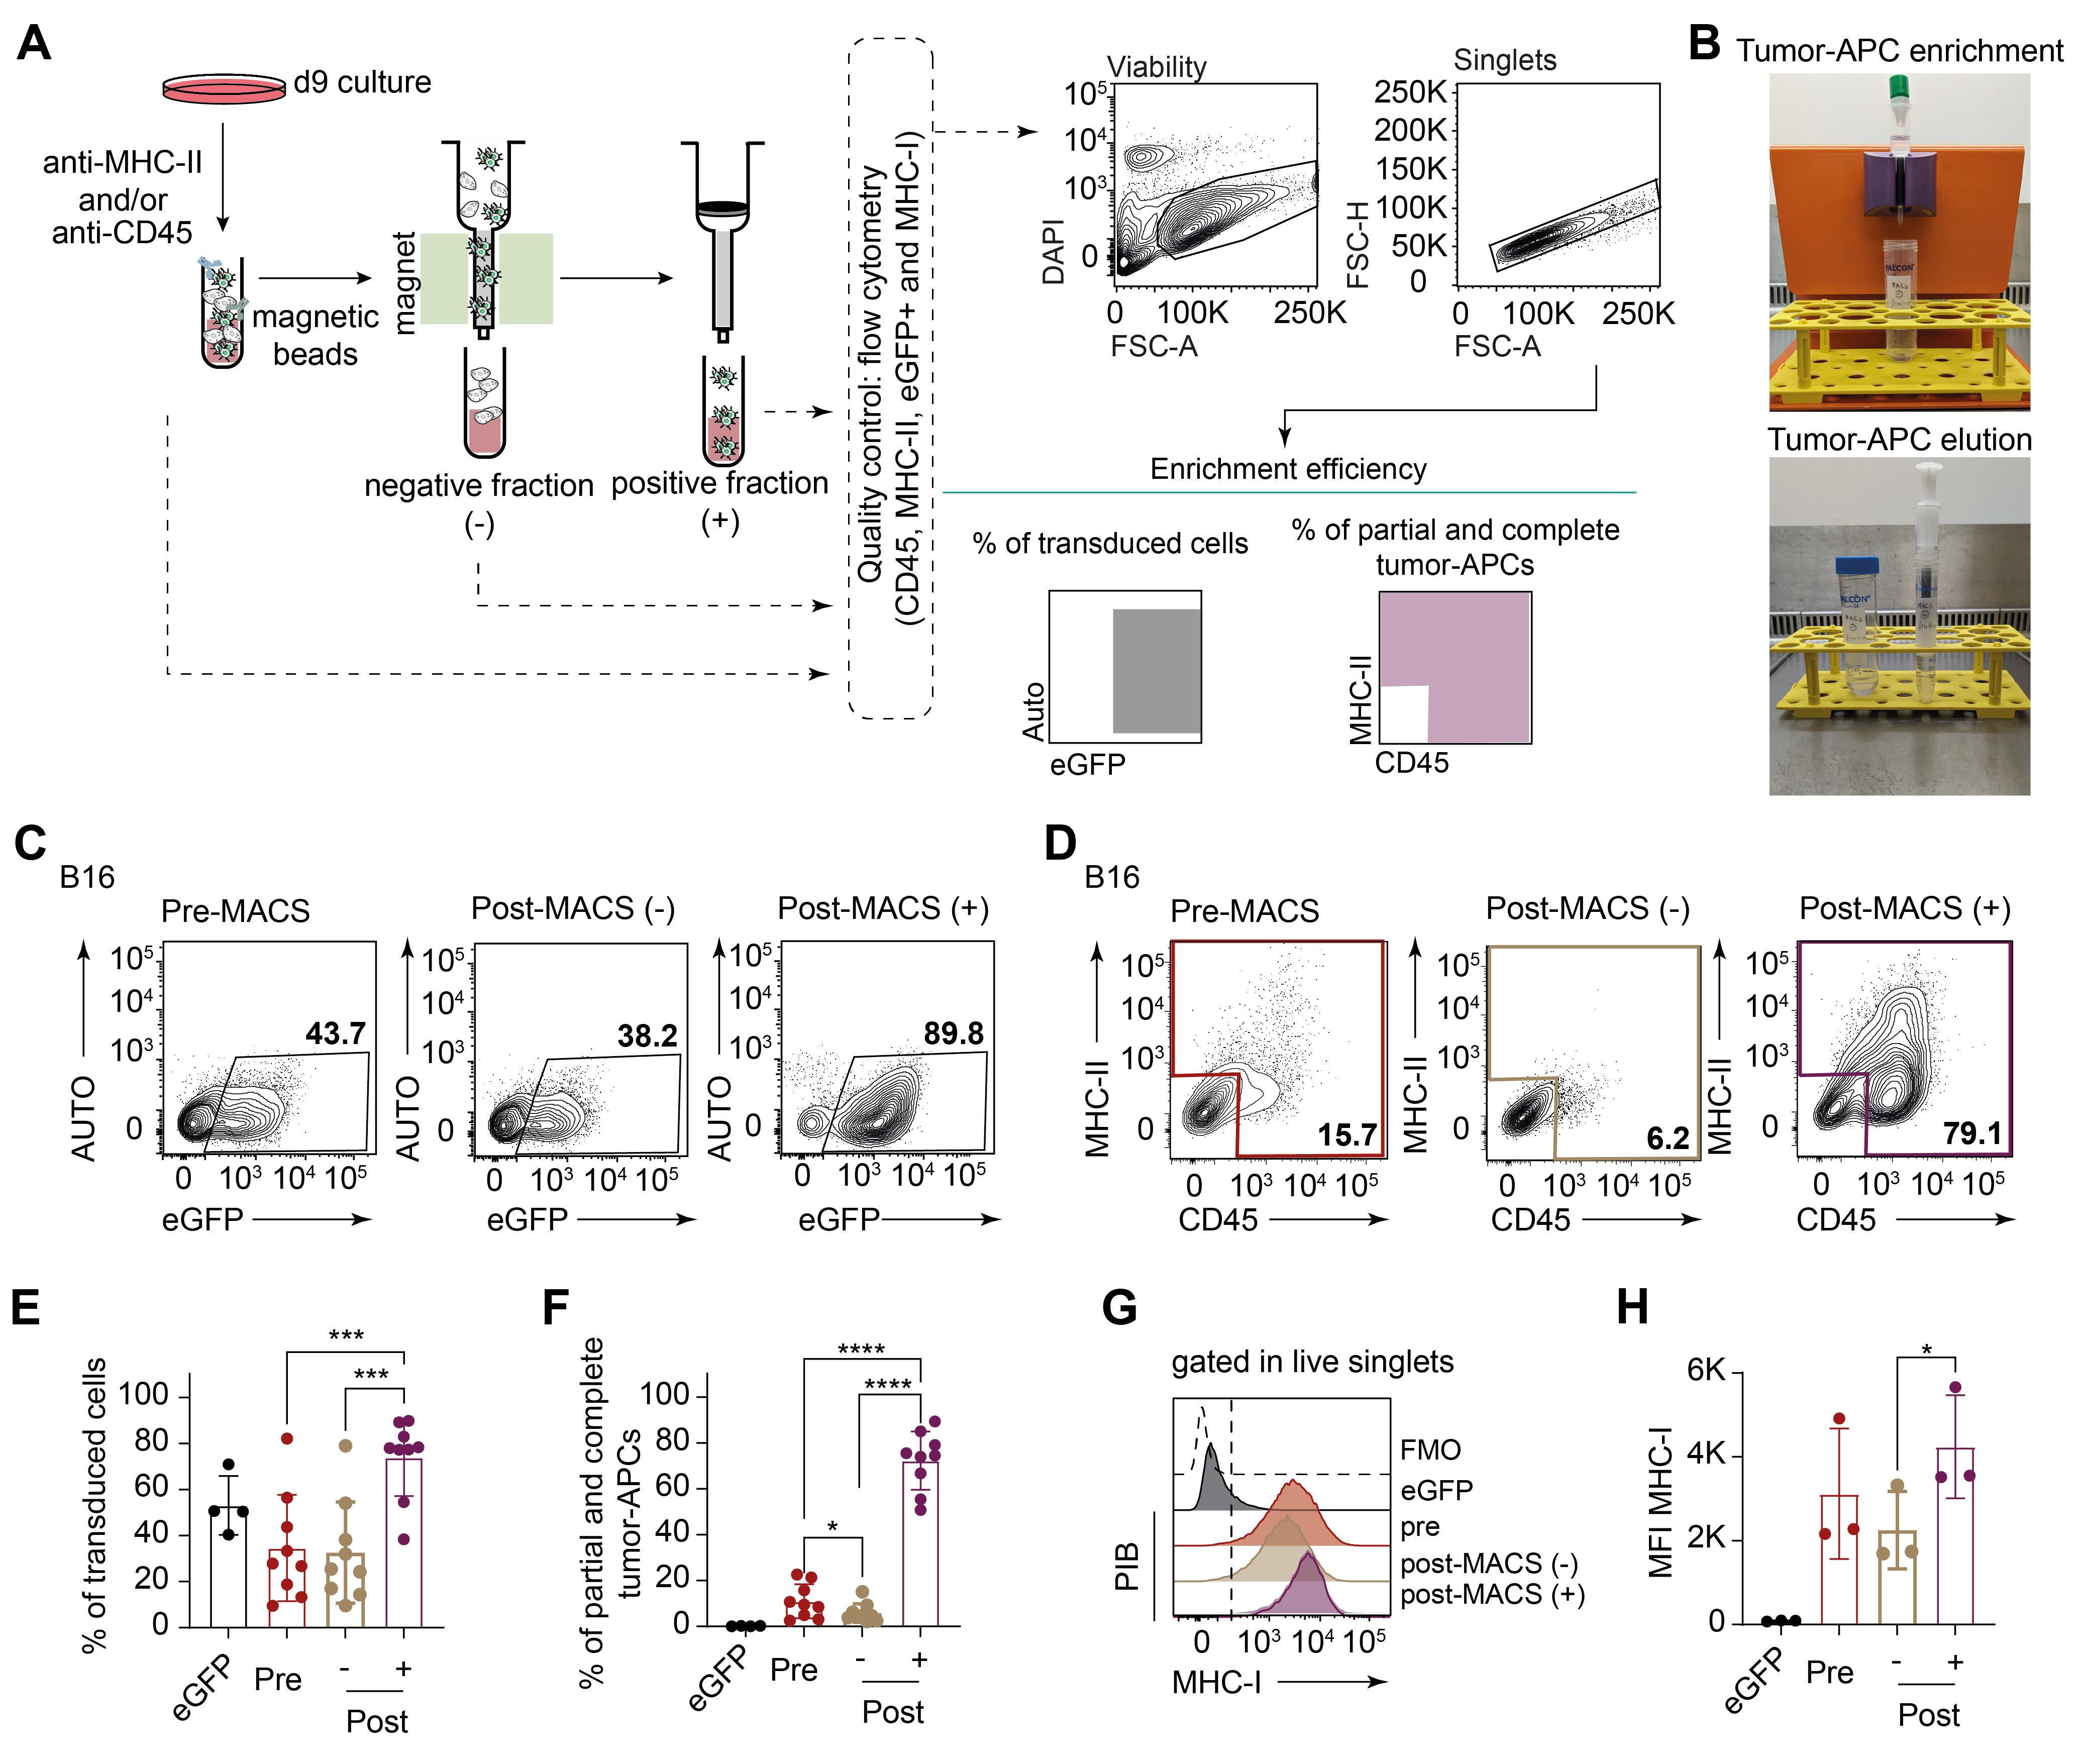
Figure 4. Enrichment of PIB-eGFP-transduced cancer cells by a magnetic activated cell sorting (MACS)-based method and antigen presentation assessment. A. Schematic overview of a MACS-protocol to enrich mouse melanoma–derived PIB-eGFP-transduced cancer cells based on the expression of CD45 and MHC-II. Reprogramming cultures were labeled with anti-CD45 and anti-MHC-II, followed by the introduction of magnetic beads targeting the previous antibodies. The cell suspension is first filtered in a nylon mesh before passing through a column under a strong magnetic field where positively labeled cells (PIB-eGFP-transduced cancer cells) will attach, letting the negative population flow through in the post-MACS-negative fraction (-). The column is then removed from the magnetic MACS MultiStand and placed in a centrifuge tube before elution and plunging of positively labeled PIB-eGFP-transduced cancer cells in the post-MACS-positive fraction (+). Quality control was assessed by flow cytometry after collecting samples pre-MACS, post-MACS(-), and post-MACS(+). The gating strategy follows viability dye negative population selection before duplet exclusion and evaluation of the total reprogrammed cell population that includes either CD45+, MHC-II+, or double positive cells (partial and complete reprogrammed cells). eGFP+ population is also evaluated as a measure of transduction efficiency. B. Photographs depicting tumor-APC enrichment in the magnetic columns (top) followed by elution outside the magnetic stand (bottom). C. Representative flow cytometry plots for expression of eGFP and D. representative flow cytometry plots of a successful MACS procedure. Pre-MACS and post-MACS(-) samples were included to demonstrate the enrichment efficiency. E. Quantification of eGFP+ cells representing total % of transduced cells in pre-MACS samples and post-MACS(-) (post -) and (+) fractions (post +) (biological replicates n = 4–9). F. Quantification of partial and complete reprogrammed cells in pre-MACS samples and post-MACS(-) and (+) fractions. eGFP-transduced cancer cells were included as controls (biological replicates n = 4–9). G. Representative flow cytometry histograms for MHC-I expression across eGFP-transduced cancer cells and tumor-APCs pre- and post-MACS fractions. H. Median intensity fluorescence (MFI) for MHC-I expressed by cancer cells and tumor-APCs pre- and post-MACS fractions (biological replicates n = 3). *** p-value < 0.001; **** p-value < 0.0001
To provide evidence for the function of MACS-enriched tumor-APCs, we demonstrated antigen presentation to Naïve CD4+ T cells (Figure 5A). We have previously shown that reprogrammed cancer cells present endogenous and exogenous antigens through MHC-I context to Naïve CD8+ T cells (Zimmermannova et al., 2023). Here, we assess their antigen presentation capacity through MHC-II pathway. For this, MACS-enriched reprogrammed cancer cells were fed OVA peptides 323–339, which are specifically presented in MHC-II to CD4+ T cells (Figure 5A). Splenic Naïve CD4+ T cells are co-cultured with tumor-APCs for four days before flow cytometric analysis (Figures 5A–5B). Melanoma-derived tumor-APCs in co-culture with Naïve CD4+ T cells induced the expression of CD44 and T-cell expansion at levels similarly elicited by BM-DCs (Figure 5C) (PIB %CD44+CTVlow: 88.48 ± 5.47, BM-DCs %CD44+CTVlow: 85.35 ± 3.86).
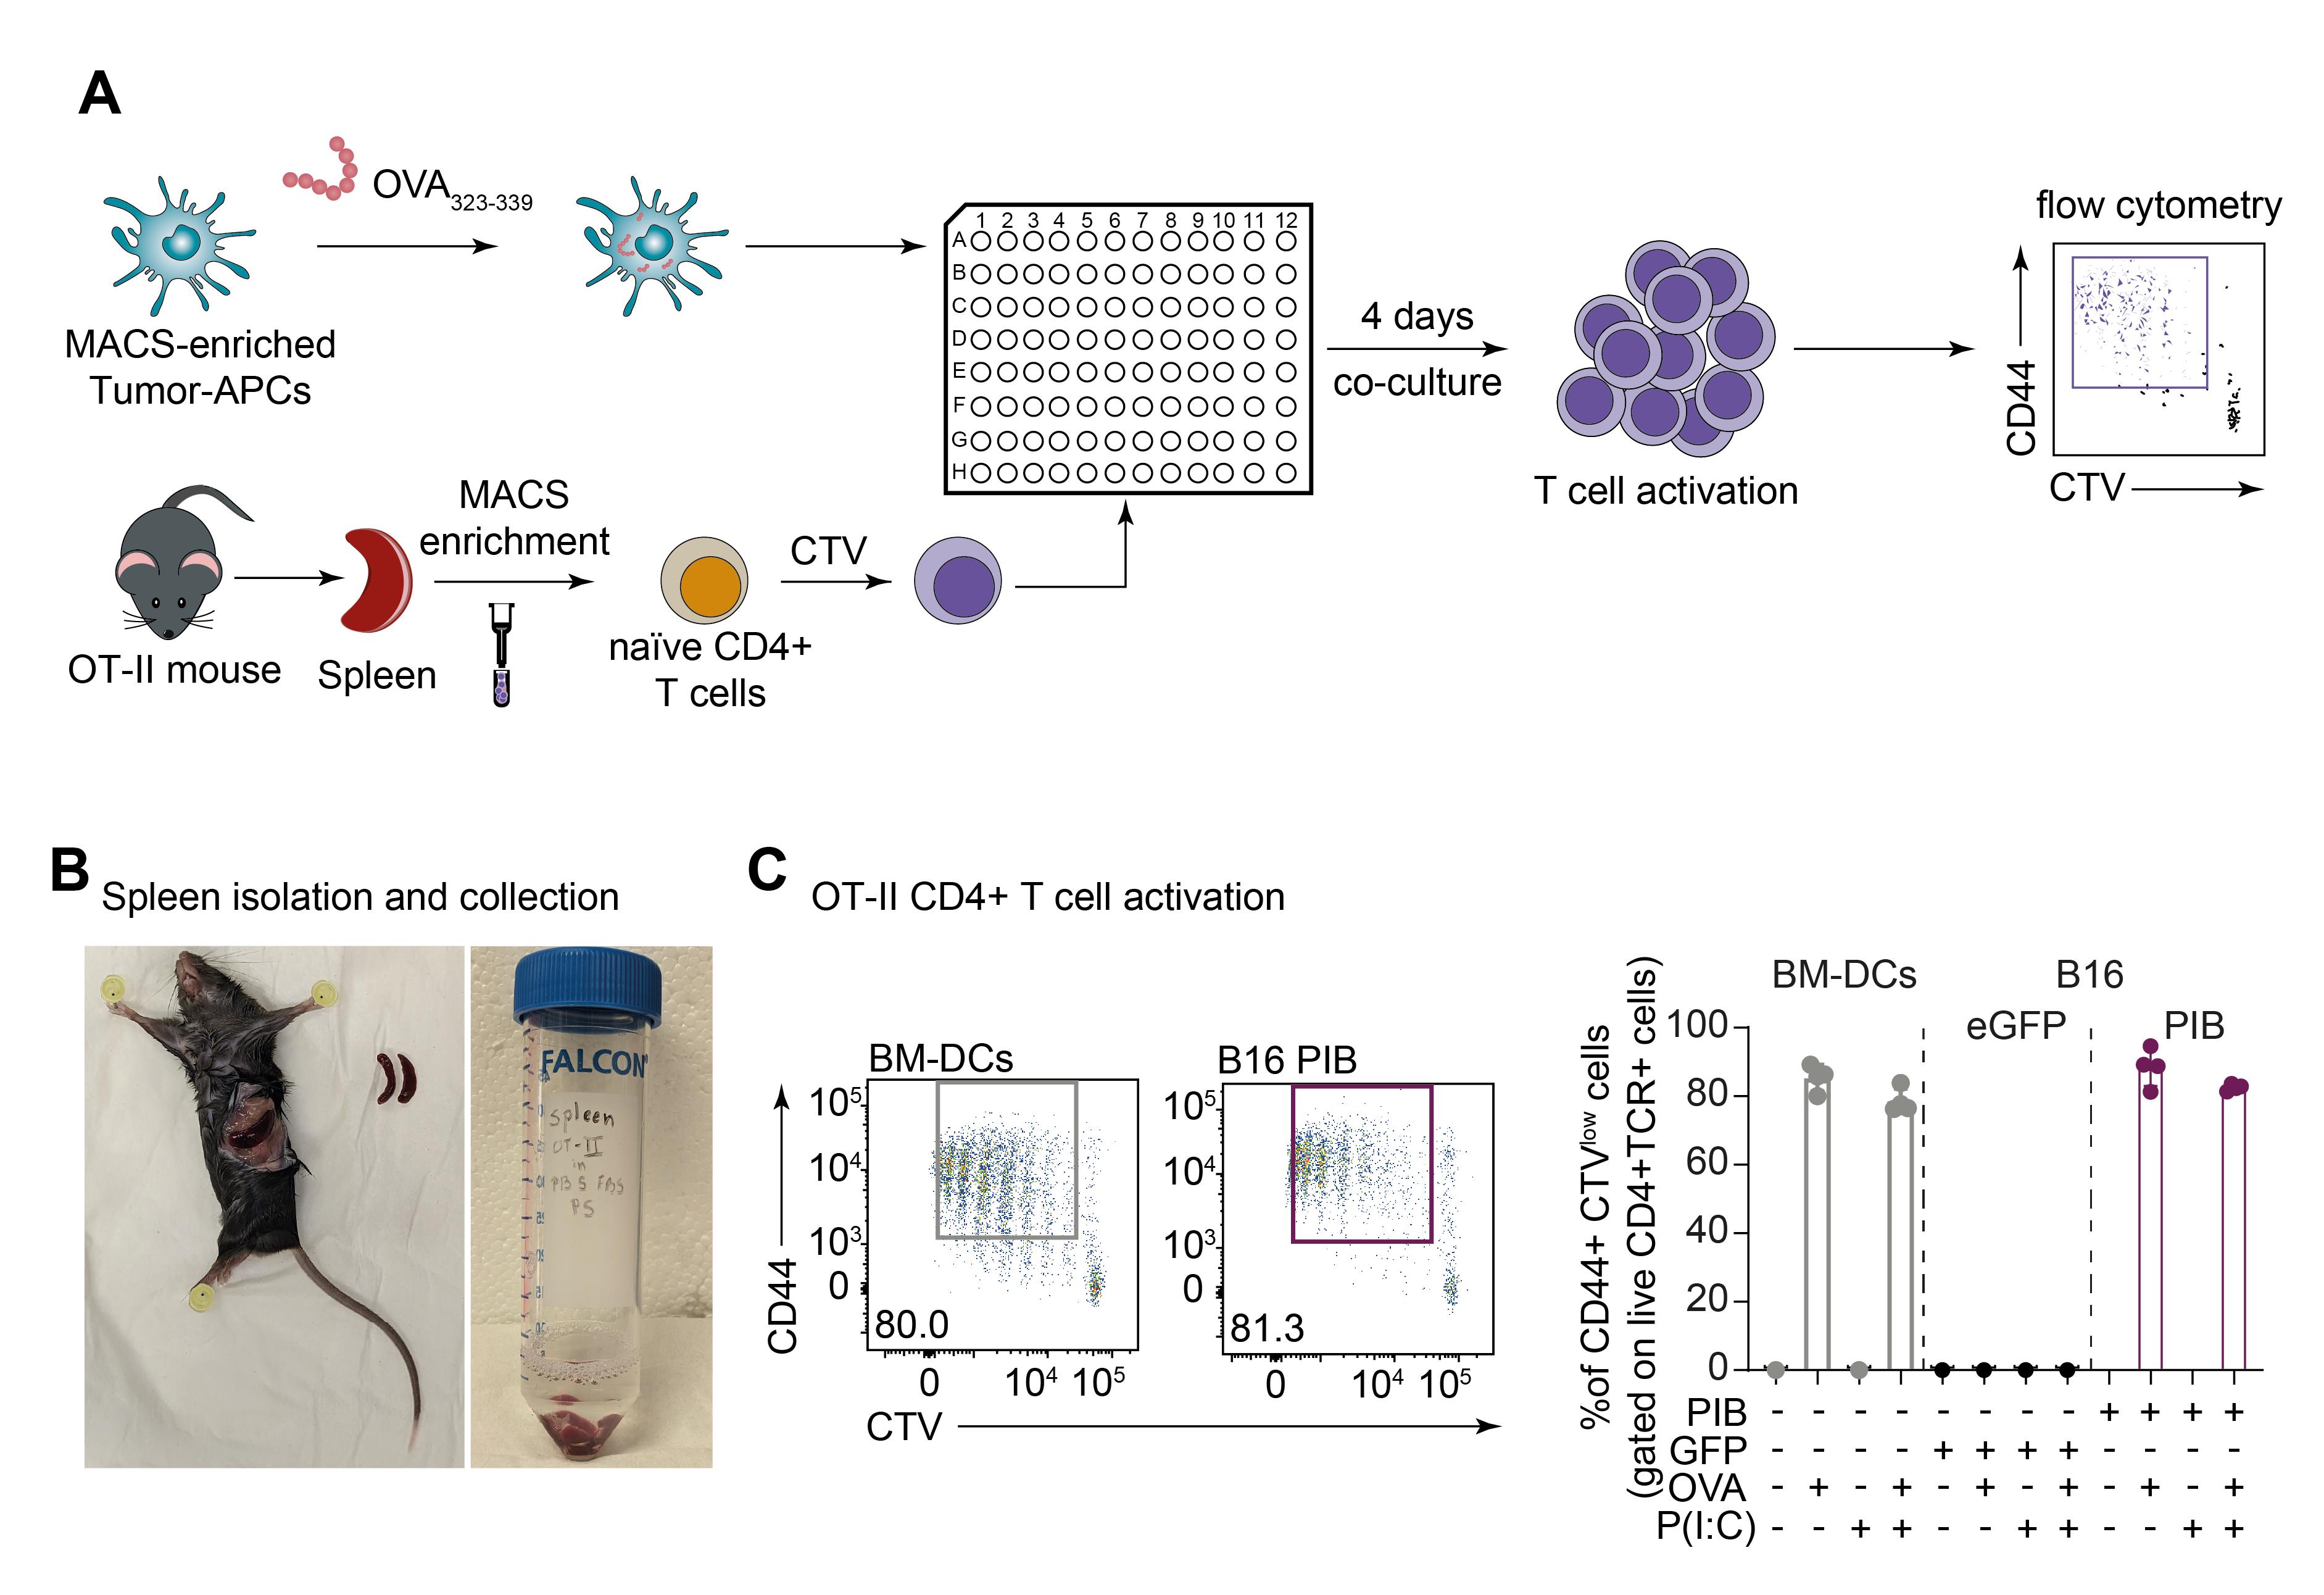
Figure 5. Evaluation of tumor-APCs exogenous antigen presentation to Naïve CD4+ T cells. A. Schematic representation of an antigen presentation assay using tumor-APCs as exogenous antigen presenters to CD4+ T cells. Enriched tumor-APCs are cultured with ovalbumin (OVA) peptides (323–339), which bind specifically to MHC-II molecules. After OVA 323–339 pulse, tumor-APCs are then co-cultured with Naïve CD4+ T cells isolated from OT-II mouse model. Naïve CD4+ T cells were labeled with CellTrace Violet (CTV) before the start of co-culture. T cell expansion is measured after four days of co-culture by flow cytometric analysis. B. Photographs depicting spleen isolation and collection from OT-II mouse strain. Splenocytes are isolated and enriched for Naïve CD4+ T cells. C. T cell activation was evaluated by CD44 expression (CD44+) and CTV dilution (CTVlow) (biological replicates n = 4). Mean ± SD is shown.
In summary, this protocol describes the reprogramming of murine and human cancer cells into tumor-APCs by ectopic expression of PU.1, IRF8, and BATF3. Tumor-APCs undergo stepwise acquisition of a mature APC transcriptional and immunophenotypic profile. The expression of CD45 and MHC-II allows MACS purification for in vitro and in vivo functional assays. Tumor-APCs are endowed with enhanced immunogenicity and can present exogenous antigens to Naïve CD8+ (Zimmermannova et al., 2023) and CD4+ T cells, as shown in this protocol. Moreover, tumor-APCs constitute a novel strategy to enhance anti-tumor immunity through cell reprogramming towards cDC1 cell fate by directly inducing antigen presentation in cancer cells, surpassing a central immune evasion mechanism. Finally, direct reprogramming of cancer cells can serve as a platform for alternative methods for neoantigen discovery and in vitro expansion of tumor infiltrating lymphocytes.
Validation of protocol
All experiments were repeated independently at least once. Data obtained by flow cytometry for quality control after MACS-enrichment (Figure 4E, 4F and 4H) were subjected to a normality test before the application of repeated measures one way ANOVA (matched pairs), with Geisser-Greenhouse correction enabled, followed by Tukey’s multiple comparison test in GraphPad Prism.
This protocol was validated in Zimmermannova et al. (2023)
General notes and troubleshooting
General notes
General note 1: Labeling for MACS procedure can be done using fluorescently labeled antibodies, i.e., PE-CD45. To recover positively labeled cells, use appropriately labeled microbeads against the fluorochrome, i.e., anti-PE microbeads. It is not recommended to perform this version of MACS if the cells will be used for in vitro assays with subsequent flow cytometry readouts, as the persistence of fluorescent antibodies in culture can interfere with the analysis.
General note 2: BM-DCs are used as reference samples for antigen presentation assays. Prepare BM-DCs according to Mayer et al. (2014) in advance. Freeze day-16 BM-DCs with a cell density of 2 × 10⁶–3 × 10⁶ cells per vial, to account for cell loss during freezing-thawing cycles, and thaw one vial the day before experimental setup.
General note 3: As an alternative to using BM-DCs as reference for antigen presentation assays, it is possible to use fresh isolated APCs, such as cDC1, cDC2 cells, or macrophages from C57BL/6j spleens.
Troubleshooting
Table 6. Troubleshooting
| Step | Problem | Possible reason | Solution |
| B4 and 5 | High levels of cell death | Initial virus load too high | Confirm the minimum amount copy number necessary to transduce and reprogram efficiently by testing different volumes of the same virus concentrate for the cell type of choice. Use a eGFP reporter and evaluate the transduction efficiency at days 3 and 9 by flow cytometry. qPCR titration is recommended to calculate the number of particles used per seeded cell. |
| B4 | Low transduction levels | Initial virus load too low | Functionally titrate the virus and calculate the minimum amount needed for efficient transduction and reprogramming without compromising cell viability. |
| B6 | Low reprogramming efficiency | The cell type of choice can be resistant | If the cell type of choice is not amenable to reprogramming despite high transduction levels, check for literature descriptions of epigenetic alterations silencing MHC-II, MHC-I, and CD45 gene loci as well as hard mutations in the genome in known cDC1 cells–specific genes. |
| C3 | High levels of cell debris and cell death | Acidic media during reprogramming Initial viral load too high Cell type of choice is fragile | Remove cell debris and dead cells by using a dead cell removal kit to avoid unspecific binding to antibodies and poor enrichment yields. |
| C19 | Cell clumping and column clogs | Cells are large and sticky. | Use EDTA as a chelating agent in the MACS buffer throughout the entirety of the protocol. |
| C28 | Poor enrichment yield–post-MACS(+) fraction has more than 20% contaminating untransduced cells | Cell volume/concentration loaded in the column was too high for the cell type of choice Insufficient column washing | Avoid loading too many cells onto the column. If cells are large, decrease the volume loaded onto one column and divide the volume of cell suspension by more columns. Thoroughly wash the columns with the indicated volume and ensure that the liquid passes through completely before loading more volume. Ensure all liquid has passed through before removing the column from the magnetic stand. Repeat MACS procedure. |
| C28 | The post-MACS(+) fraction has a high number of dead cells | A plunger was inserted too fast in the column The plunger was pushed up and down in the column | When plunging the positively labeled cells from the column, do it slowly. Avoid pushing the plunger up and down in the column once the cells are inside as it can cause suction and damage cells. Wash column twice with 5 mL of MACS buffer, only plunging slowly on the last wash outside of the magnetic stand. |
| C28 | The post-MACS(-) fraction has high levels of reprogrammed cells | Insufficient or improper staining before microbead addition | Ensure that the quantity of antibodies used is adequate. This might need optimization. Repeat enrichment on the post-MACS(-) fraction. |
Acknowledgments
This project has received funding from the European Research Council (ERC) under the European Union’s Horizon 2020 research and innovation program (Grant agreement No. 866448). This project was also funded by Cancerfonden (20 0939 PjF), the Swedish Research Council (2020-00615), NovoNordisk Fonden (0056527), the Mats Paulsson Foundation, SweLife and Medtech4Health (2020-04744), Eurostars-2 Joint Program (2021-03371), and FCT (2022.02338.PTDC), and Plano de Recuperação e Resiliência de Portugal pelo fundo NextGenerationEU (C644865576-00000005). The Knut and Alice Wallenberg foundation, the Medical Faculty at Lund University, and Region Skåne are acknowledged for financial support. A.G.F is supported by an FCT scholarship (SFRH/BD/133233/2017).
This protocol was adapted from the publication of Zimmermannova et al. (2023).
Competing interests
C.-F.P has an equity interest and serves in a management position at Asgard Therapeutics, AB, which develops cancer immunotherapies based on reprogramming technologies. C.-F. P., A.G.F, O.Z. and E.A are inventors on US patent 11,345,891, patent applications WO 2018/185709 and WO 2022/243448 held by Asgard Therapeutics, AB, which covers the cell reprogramming protocol described here.
Ethical considerations
Animal care and procedures for strains OT-II and C57BL/6j were performed in accordance with Swedish guidelines and regulations after approval from the local ethical committee (ethical permit: 5.8.18-11845/2019). Human leucocyte concentrates from healthy donors were provided by the Clinical Immunology and Transfusion Medicine at Skåne University Hospital (ethical permit: 2022:11). Donor consent and anonymity are ensured by the hospital.
References
Amberger, D. C. and Schmetzer, H. M. (2020). Dendritic cells of leukemic origin: specialized antigen-presenting cells as potential treatment tools for patients with myeloid leukemia. Transfus. Med. Hemother. 47(6): 432–443.
- Balan, S. and Dalod, M. (2016). In Vitro Generation of Human XCR1+ Dendritic Cells from CD34+ Hematopoietic Progenitors. Methods Mol. Biol. 1423: 19–37.
- Barry, K. C., Hsu, J., Broz, M. L., Cueto, F. J., Binnewies, M., Combes, A. J., Nelson, A. E., Loo, K., Kumar, R., Rosenblum, M. D., et al. (2018). A natural killer–dendritic cell axis defines checkpoint therapy–responsive tumor microenvironments. Nat. Med. 24(8): 1178–1191.
- Blomberg, O. S., Spagnuolo, L., Garner, H., Voorwerk, L., Isaeva, O. I., van Dyk, E., Bakker, N., Chalabi, M., Klaver, C., Duijst, M., et al. (2023). IL-5-producing CD4+ T cells and eosinophils cooperate to enhance response to immune checkpoint blockade in breast cancer. Cancer Cell 41(1): 106–123.e10.
- Ferris, S. T., Ohara, R. A., Ou, F., Wu, R., Huang, X., Kim, S., Chen, J., Liu, T. T., Schreiber, R. D., Murphy, T. L., et al. (2022). cDC1 Vaccines Drive Tumor Rejection by Direct Presentation Independently of Host cDC1. Cancer Immunol. Res. 10(8): 920–931.
- Griffin, G. K., Wu, J., Iracheta-Vellve, A., Patti, J. C., Hsu, J., Davis, T., Dele-Oni, D., Du, P. P., Halawi, A. G., Ishizuka, J. J., et al. (2021). Epigenetic silencing by SETDB1 suppresses tumour intrinsic immunogenicity. Nature 595(7866): 309–314.
- Guo, W., Wang, Y., Yang, M., Wang, Z., Wang, Y., Chaurasia, S., Wu, Z., Zhang, M., Yadav, G. S., Rathod, S., et al. (2021). LincRNA-immunity landscape analysis identifies EPIC1 as a regulator of tumor immune evasion and immunotherapy resistance. Sci. Adv. 7(7): eabb3555.
- Hashimoto, M., Kamphorst, A. O., Im, S. J., Kissick, H. T., Pillai, R. N., Ramalingam, S. S., Araki, K. and Ahmed, R. (2018). CD8 T Cell Exhaustion in Chronic Infection and Cancer: Opportunities for Interventions. Annu. Rev. Med. 69(1): 301–318.
- Hochedlinger, K., Blelloch, R., Brennan, C., Yamada, Y., Kim, M., Chin, L. and Jaenisch, R. (2004). Reprogramming of a melanoma genome by nuclear transplantation. Gene. Dev. 18(15): 1875–1885.
- Hubert, M., Gobbini, E., Couillault, C., Manh, T. P., Doffin, A. C., Berthet, J., Rodriguez, C., Ollion, V., Kielbassa, J., Sajous, C., et al. (2020). IFN-III is selectively produced by cDC1 and predicts good clinical outcome in breast cancer. Sci. Immunol. 5(46): eaav3942.
- Ishay-Ronen, D., Diepenbruck, M., Kalathur, R. K. R., Sugiyama, N., Tiede, S., Ivanek, R., Bantug, G., Morini, M. F., Wang, J., Hess, C., et al. (2019). Gain Fat—Lose Metastasis: Converting Invasive Breast Cancer Cells into Adipocytes Inhibits Cancer Metastasis. Cancer Cell 35(1): 17–32.e6.
- Jhunjhunwala, S., Hammer, C. and Delamarre, L. (2021). Antigen presentation in cancer: insights into tumour immunogenicity and immune evasion. Nat. Rev. Cancer 21(5): 298–312.
- Kalbasi, A. and Ribas, A. (2020). Tumour-intrinsic resistance to immune checkpoint blockade. Nat. Rev. Immunol. 20(1): 25–39.
- Kvedaraite, E. and Ginhoux, F. (2022). Human dendritic cells in cancer. Sci Immunol. 7(70): eabm9409.
- Makino, K., Long, M. D., Kajihara, R., Matsueda, S., Oba, T., Kanehira, K., Liu, S. and Ito, F. (2022). Generation of cDC-like cells from human induced pluripotent stem cells via Notch signaling. J. Immunother. Cancer 10(1): e003827.
- Manguso, R. T., Pope, H. W., Zimmer, M. D., Brown, F. D., Yates, K. B., Miller, B. C., Collins, N. B., Bi, K., LaFleur, M. W., Juneja, V. R., et al. (2017). In vivo CRISPR screening identifies Ptpn2 as a cancer immunotherapy target. Nature 547(7664): 413–418.
- Mayer, C. T., Ghorbani, P., Nandan, A., Dudek, M., Arnold-Schrauf, C., Hesse, C., Berod, L., Stüve, P., Puttur, F., Merad, M., et al. (2014). Selective and efficient generation of functional Batf3-dependent CD103+ dendritic cells from mouse bone marrow. Blood 124(20): 3081–3091.
- Mayoux, M., Roller, A., Pulko, V., Sammicheli, S., Chen, S., Sum, E., Jost, C., Fransen, M. F., Buser, R. B., Kowanetz, M., et al. (2020). Dendritic cells dictate responses to PD-L1 blockade cancer immunotherapy. Sci. Transl. Med. 12(534): eaav7431.
- Oh, D. Y., Kwek, S. S., Raju, S. S., Li, T., McCarthy, E., Chow, E., Aran, D., Ilano, A., Pai, C. C., Rancan, C., et al. (2020). Intratumoral CD4+ T cells mediate anti-tumor cytotoxicity in human bladder cancer. Cell 181(7): 1612–1625.e13.
- Pan, J. and Wan, J. (2020). Methodological comparison of FACS and MACS isolation of enriched microglia and astrocytes from mouse brain. J. Immunol. Methods 486: 112834.
- Patel, S. J., Sanjana, N. E., Kishton, R. J., Eidizadeh, A., Vodnala, S. K., Cam, M., Gartner, J. J., Jia, L., Steinberg, S. M., Yamamoto, T. N., et al. (2017). Identification of essential genes for cancer immunotherapy. Nature 548(7669): 537–542.
- Poulin, L. F., Reyal, Y., Uronen-Hansson, H., Schraml, B. U., Sancho, D., Murphy, K. M., Håkansson, U. K., Ferreira Moita, L., Agace, W. W., Bonnet, D., et al. (2012). DNGR-1 is a specific and universal marker of mouse and human Batf3-dependent dendritic cells in lymphoid and nonlymphoid tissues. Blood 119(25): 6052–6062.
- Poulin, L. F., Salio, M., Griessinger, E., Anjos-Afonso, F., Craciun, L., Chen, J. L., Keller, A. M., Joffre, O., Zelenay, S., Nye, E., et al. (2010). Characterization of human DNGR-1+ BDCA3+ leukocytes as putative equivalents of mouse CD8α+ dendritic cells. J. Exp. Med. 207(6): 1261–1271.
- Rosa, F. F., Pires, C. F., Kurochkin, I., Ferreira, A. G., Gomes, A. M., Palma, L. G., Shaiv, K., Solanas, L., Azenha, C., Papatsenko, D., et al. (2018). Direct reprogramming of fibroblasts into antigen-presenting dendritic cells. Sci. Immunol. 3(30): eaau4292.
- Rosa, F. F., Pires, C. F., Kurochkin, I., Halitzki, E., Zahan, T., Arh, N., Zimmermannova, O., Ferreira, A. G., Li, H., Karlsson, S., et al. (2022). Single-cell transcriptional profiling informs efficient reprogramming of human somatic cells to cross-presenting dendritic cells. Sci. Immunol. 7(69): eabg5539.
- Rosa, F., Pires, C., Zimmermannova, O. and Pereira, C. F. (2020). Direct Reprogramming of Mouse Embryonic Fibroblasts to Conventional Type 1 Dendritic Cells by Enforced Expression of Transcription Factors. Bio Protoc 10(10): e3619.
- Sharma, P., Hu-Lieskovan, S., Wargo, J. A. and Ribas, A. (2017). Primary, adaptive, and acquired resistance to cancer immunotherapy. Cell 168(4): 707–723.
- Spranger, S., Dai, D., Horton, B. and Gajewski, T. F. (2017). Tumor-residing Batf3 dendritic cells are required for effector T cell trafficking and adoptive T cell therapy. Cancer Cell 31(5): 711–723.e4.
- Sutermaster, B. A. and Darling, E. M. (2019). Considerations for high-yield, high-throughput cell enrichment: fluorescence versus magnetic sorting. Sci. Rep. 9(1): 227.
- Suva, M. L., Riggi, N. and Bernstein, B. E. (2013). Epigenetic reprogramming in cancer. Science 339(6127): 1567-1570.
- Wang, H., Yang, Y., Liu, J. and Qian, L. (2021). Direct cell reprogramming: approaches, mechanisms and progress. Nat. Rev. Mol. Cell Biol. 22(6): 410–424.
- Zimmermannova, O., Caiado, I., Ferreira, A. G. and Pereira, C. F. (2021). Cell Fate Reprogramming in the Era of Cancer Immunotherapy. Front. Immunol. 12: e714822.
- Zimmermannova, O., Ferreira, A. G., Ascic, E., Velasco Santiago, M., Kurochkin, I., Hansen, M., Met, Ã., Caiado, I., Shapiro, I. E., Michaux, J., et al. (2023). Restoring tumor immunogenicity with dendritic cell reprogramming. Sci. Immunol. 8(85): eadd4817.
Article Information
Copyright
© 2023 The Author(s); This is an open access article under the CC BY-NC license (https://creativecommons.org/licenses/by-nc/4.0/).
How to cite
Readers should cite both the Bio-protocol article and the original research article where this protocol was used:
- Ferreira, A. G., Zimmermannova, O., Kurochkin, I., Ascic, E., Åkerström, F. and Pereira, C. F. (2023). Reprogramming Cancer Cells to Antigen-presenting Cells. Bio-protocol 13(22): e4881. DOI: 10.21769/BioProtoc.4881.
- Zimmermannova, O., Ferreira, A. G., Ascic, E., Velasco Santiago, M., Kurochkin, I., Hansen, M., Met, Ã., Caiado, I., Shapiro, I. E., Michaux, J., et al. (2023). Restoring tumor immunogenicity with dendritic cell reprogramming. Sci. Immunol. 8(85): eadd4817.
Category
Immunology > Immune cell function > Antigen-specific response
Cell Biology > Cell engineering > Partial reprogramming
Cancer Biology > Tumor immunology
Do you have any questions about this protocol?
Post your question to gather feedback from the community. We will also invite the authors of this article to respond.