- Protocols

- Articles and Issues
- For Authors
- About
- Become a Reviewer

Studying Cellular Focal Adhesion Parameters with Imaging and MATLAB Analysis
(*contributed equally to this work) Published: Vol 13, Iss 21, Nov 5, 2023 DOI: 10.21769/BioProtoc.4867 Views: 2056
Reviewed by: Alka MehraAnonymous reviewer(s)
Original research article
The authors used this protocol in:

Jul 2021
Advertisement


Protocol Collections
Comprehensive collections of detailed, peer-reviewed protocols focusing on specific topics


Related protocols

Abstract
Cell signaling is highly integrated for the process of various cell activities. Although previous studies have shown how individual genes contribute to cell migration, it remains unclear how the integration of these signaling pathways is involved in the modulation of cell migration. In our two-hit migration screen, we revealed that serine-threonine kinase 40 (STK40) and mitogen-activated protein kinase (MAPK) worked synergistically, and the suppression of both genes could further lead to suppression in cell migration. Furthermore, based on our analysis of cellular focal adhesion (FA) parameters using MATLAB analysis, we are able to find out the synergistic reduction of STK40 and MAPK that further abolished the increased FA by shSTK40. While FA identification in previous studies includes image analysis using manual selection, our protocol provides a semi-automatic manual selection of FAs using MATLAB. Here, we provide a method that can shorten the amount of time required for manual identification of FAs and increase the precision for discerning individual FAs for various analyses, such as FA numbers, area, and mean signals.
Keywords: Focal adhesion (FA)Background
Our protocol can be used to identify focal adhesion (FA) molecules such as paxillin, talin, or vinculin. Images of FA molecules are usually taken by a confocal fluorescent microscope (Doss et al., 2020) or through super-resolution fluorescence microscopy (Kanchanawong et al., 2010) to show clear images. Our protocol allows fast imaging using fluorescent microscopy, acquiring a large number of images for FA identification and quantification. Selecting FAs using prior methods such as ImageJ requires researchers to manually select all FAs by the naked eye. This creates great deviations between different operators and even different times of selection by the same operator. The semi-automatic manual selection provides a time-saving and precise method, running MATLAB scripts to select all FAs in images. Researchers may then select specific FAs for further analysis. By using MATLAB software instead of the traditional analysis by ImageJ plugins (Horzum et al., 2014), we are able to analyze different FA parameters, such as number, area, and signal intensity in a semi-automatic manual method. Furthermore, we chose paxillin for the representation of FA due to its clearer immunofluorescent staining under fluorescent microscope compared to other FA proteins, such as talin and vinculin. By understanding the general properties of FA followed by different treatments, such as STK40 knockdown, we can further explore subsequent cellular mechanisms.
Materials and reagents
Cell culture
Cells
SAS and HSC-3 cells [gifts from J. S. Chia’s Lab (National Taiwan University, Taipei, Taiwan)]
HepG2 and HEK-293T cells [American Type Culture Collection (Manassas, VA, USA)]
HUVEC cells (Lonza, Basel Stücki, Switzerland)
HaCaT cells [American Type Culture Collection (Manassas, VA, USA)]
Culture medium
Dulbecco’s modified Eagle’s medium (DMEM) (Gibco, Thermo Fisher Scientific, catalog number: 11965092 and HyClone, catalog number: 16750-074) for SAS, HSC-3, HepG2, and HEK-293T cells
Endothelial cell growth medium-2 (EGM2) (Lonza, catalog number: CC-3162) for HUVEC cells
1% of penicillin/streptomycin (P/S) (Gibco, catalog number: 15140122)
10% fetal bovine serum (FBS) (HyClone, catalog number: 12389802)
0.5% trypsin-EDTA (Gibco, catalog number: sc-363354)
Phosphate-buffered saline (PBS) (Corning, catalog number: 21-040-CM)
Coating and infection
96-well plate (Thermo Fisher Scientific, NuncTM, catalog number: 165305)
Coated chamber slides [Thermo Fisher Scientific, catalog number: 155411 (4-well) or Nunc Lab-TEK, catalog number: 155383]
6-well plate (Jetbiofil, catalog number: TCP011006)
Poly-D-lysine (Sigma-Aldrich, catalog number: A3890401)
Collagen (100 μg/mL; collagen I, bovine) (Gibco, catalog number: A1048301)
Lentiviruses of control or STK40 [shRNA plasmids bought from National RNAi Core (NRC; Academia Sinica, Taipei, Taiwan); plasmids of shSTK40 were transfected into HEK-293T cells to produce lentiviruses while control lentiviruses were directly bought from NRC]
Puromycin (2 μg/mL) (Sigma-Aldrich, catalog number: A1113803)
Blasticidin (10 μg/mL) (Sigma-Aldrich, catalog number: 15205)
Reagents used prior to immunofluorescent staining
20 mM HEPES (Gibco, catalog number: 15630080)
0.1% BSA (BioShop, catalog number: ALB001)
25 ng/mL FGF1 (Invitrogen, catalog number: PHG0244)
10 U heparin (Sigma, catalog number: H3393)
Drugs
Trametinib 100 nM (LC laboratories, catalog number: T-8123)
Y27632 5 μM (Sigma-Aldrich, catalog number: 688000)
Blebbistatin 5 μM (Sigma-Aldrich, catalog number: 203390)
Verteporfin 2.5 μM (MedChemExpress, catalog number: HY-B0146)
Leptomycin B 100 nM (Cayman Chemical Company, catalog number: 10004976)
Immunofluorescent staining
4% paraformaldehyde (Sigma-Aldrich, catalog number: 158127)
0.25% Triton X-100 (J.T. Baker, catalog number: 10421871)
Primary antibody: purified mouse anti-PXN (BD Biosciences, catalog numbers: 610051 and 610052) in 1% BSA. Paxillin was chosen as the optimal representation of FA due to its clearer visibility compared to other antibodies such as talin and vinculin
5% BSA for blocking
4’,6-diamidino-2-phenylindole (DAPI); 10 μg/mL (Invitrogen, catalog number: D1306)
Secondary antibodies: goat anti-mouse immunoglobulin G (IgG) (H + L) cross-adsorbed secondary antibody and Alexa Fluor 488 (Invitrogen, catalog number: A11001) at 1:500; goat anti-mouse IgG (H + L) cross-adsorbed secondary antibody and Alexa Fluor 594 (Invitrogen, catalog number: A11005) at 1:500 in 1% BSA
Equipment
Microscope (Nikon Eclipse Ti)
Camera (Nikon DS-Qi2)
Excitation light source: X-cite 120 (Excelitas Technologies Corp.)
Filter cubes (Chroma Technology Corporation)
DAPI filter set (excitation wavelength: 360 nm; dichroic mirror wavelength: 400 nm; emission wavelength: 460 nm)
Fluorescein isothiocyanate (FITC) filter set (excitation wavelength: 480 nm; dichroic mirror wavelength: 505 nm; emission wavelength: 535 nm)
Texas Red (Tx-Red) filter set (excitation wavelength: 560 nm; dichroic mirror wavelength: 595 nm; emission wavelength: 630 nm)
Yellow fluorescent protein (YFP) filter set (for over-expression) (excitation wavelength: 500 nm; dichroic mirror wavelength: 520 nm; emission wavelength: 542 nm)
Autofluorescent plastic slides (Chroma Technology Corporation, catalog number: 92001)
Software
MATLAB (MathWorks, Natick, MA, USA)
Install MATLAB Image Processing Toolbox to run script.
Microsoft Excel (Redmond, WA, USA)
Procedure
Preparation for immunofluorescence fixation
Seed SAS, HaCaT, HUVEC, or HepG2 cells on culture medium in a 6-well plate. For SAS and HaCaT cells, seed 3 × 10⁵ cells/well. Seed cells at 60% confluency. For SAS, HaCaT, and HepG2 cells, use DMEM with 1% penicillin/streptomycin, 10% FBS, and 0.5% trypsin-EDTA as culture medium. For HUVEC cells, use EGM2 as culture medium.
On the next day, transduce lentiviruses that knockdown or over-express STK40 into seeded SAS, HaCaT, HUVEC, or HepG2 cells. The lentiviruses are generated by transfecting vectors of (1) shRNA plasmid targeting STK40 bought from Academia Sinica or (2) plasmid of over-expression construct targeting STK40 into HEK-293T cells. For our over-expression construct of STK40, YFP is tagged at the cytoplasmic domain of STK40 to ensure fluorescent visibility under the microscope.
Select cells in a 6-well plate with antibiotics such as puromycin or blasticidin over 24–48 h.
On the same day of antibiotics selection, perform collagen coating in a new 96-well plate or 4- or 8-well chamber slide. Coat poly-D-lysine 100 μg/mL in PBS for 5 min at 37 °C. Wash SAS, HaCaT, HUVEC, or HepG2 cells with PBS and then coat cells with bovine collagen 100 μg/mL in PBS. Collagen coating ensures better cell attachment for cell migration and subsequent observation of focal adhesion. Incubate chamber slides or 96-well plates at 37 °C overnight.
On the next day, re-seed cells from the 6-well plate onto the coated 96-well plate or 4- or 8-well chamber slide. To observe nascent and prominent FAs, the transduced cells are re-seeded differently:
To observe nascent FAs: seed cells at a higher density at 70%–80% confluency to perform wound scratch. The FAs on the first row of the wound will be analyzed later. For SAS cells, seed 2–3 × 10⁴ cells per 96-well plate and 1.5 × 10⁵ cells per 4-well chamber slide. For HaCaT cells, seed 1 × 10⁴ cells per 96-well plate and 5 × 10⁴ per 4-well chamber slide.
To observe prominent FAs: seed cells at a lower density at 40% confluency. Cells will perform random migration and all of their prominent FAs will be analyzed later. For SAS cells, seed 6,000 cells per 96-well plate and 3 × 10⁴ cells per 4-well chamber slide. For HaCaT cells, seed 5,000 cells per 96-well plate and 2.5 × 10⁴ cells per 4-well chamber slide. The prominent FAs of HaCaT cells are shown as demonstration in this protocol.
Incubate cells at 37 °C in supplemented medium with or without drugs according to their groups. The supplemented medium contains 20 mM HEPES, 0.1% BSA, 25 ng/mL FGF1, and 10 U of heparin. The experimental groups include untreated and drug-treated groups.
Untreated group.
Drug-treated groups:
i. Blebbistatin (5 μM): inhibits myosin II.
ii. Y27632 (5 μM): inhibits ROCK (Rho-kinase). Blebbistain or Y27632 are added to inhibit force-mediated FA. The FA results from the co-inhibition of STK40, and force-generating FA tell us whether the effect of STK40 on FA is due to force-mediated FA strengthening.
iii. Trametinib (100 nM): inhibits MAPK kinase. The FA results from the co-inhibition of STK40, and MAPK kinase tell us whether MAPK is involved in the effect of STK40 on FA.
iv. Leptomycin (100 nM): inhibits exportin to block nuclear exportation. The blockage of nuclear export by leptomycin renders the accumulation of our other target protein, YAP (Yes-associated protein), in the nucleus. The FA results of the co-inhibition of STK40 and exportin provide partial clues for us to explore whether the spatial distribution of YAP is involved in the effect of STK40 on FA.
v. Verteporfin (2.5 μM): inhibits YAP activity. The FA results from the co-inhibition of STK40, and YAP tell us whether YAP is involved in the effect of STK40 on FA. Furthermore, the FA results of the inhibition of STK40, YAP, and MAPK support the STK40-YAP-MAPK system on FA in our published paper (Yu et al., 2021).
To observe nascent and prominent FAs, the duration of drug treatment is different.
To observe nascent FAs, treat cells with drugs as follows:
i. 5 μM blebbistatin, 5 μM Y27632, or 100 nM trametinib: overnight
ii. 100 nM leptomycin B: 1 h
iii. 2.5 μM verteporfin: 6 h.
Go to steps 7–10 in this section to create wound scratch.
To observe prominent FAs, treat cells with drugs as follows:
i. 5 μM blebbistatin, 5 μM Y27632, or 100 nM trametinib: overnight
ii. 100 nM leptomycin B: 3 h
iii. 2.5 μM verteporfin: 8 h.
Go directly to section B for fixation.
After incubation, keep the media by transferring it to a new 96-well plate or chamber slide. Wash cells with PBS.
Create wounds with a tip for chamber slides and a scratcher for 96-well plates in cells immersed in PBS. A horizontal wound is created in the middle of the well for 96-well plates. To create wounding for chamber slides, draw a cross to create two wounds in each well.
After wounding, put back media onto the cells.
Incubate cells at 37 °C for another 2 h. During this period, cells migrate towards the wound, as shown in Video 1. The video demonstrates SAS cells wound-healing migration for 10 h. The purpose of the 2 h migration is to ensure that the cells migrate towards the wound to form nascent FAs (Olson and Nechiporuk, 2021). The lamellipodia of migrating cells towards the wound are stretched out. Nascent FAs are visible under this condition.
 Video 1. Wound-healing migration of SAS cells for 10 h
Immunofluorescence fixation and staining
Fix cells with 4% paraformaldehyde in PBS at room temperature for 15 min.
Permeate cells with 0.25% Triton X-100 at room temperature for 10 min.
Block cells with 5% BSA at room temperature for 1 h.
Incubate cells with primary antibodies in 1% BSA in PBS overnight at 4 °C. Anti-PXN is used as primary antibody to stain FA.
Stain cells with secondary antibodies and 10 μg/mL of DAPI (10 μg/mL) in 1% BSA in PBS.
Use a Nikon Eclipse Ti for FA imaging. Focus on the FAs of the fixed cells and take z-stack images. Take images of FA with a step size of 1 μm. We took seven z-stack images with a total range of 5 μm for our analysis (Figure 1A).
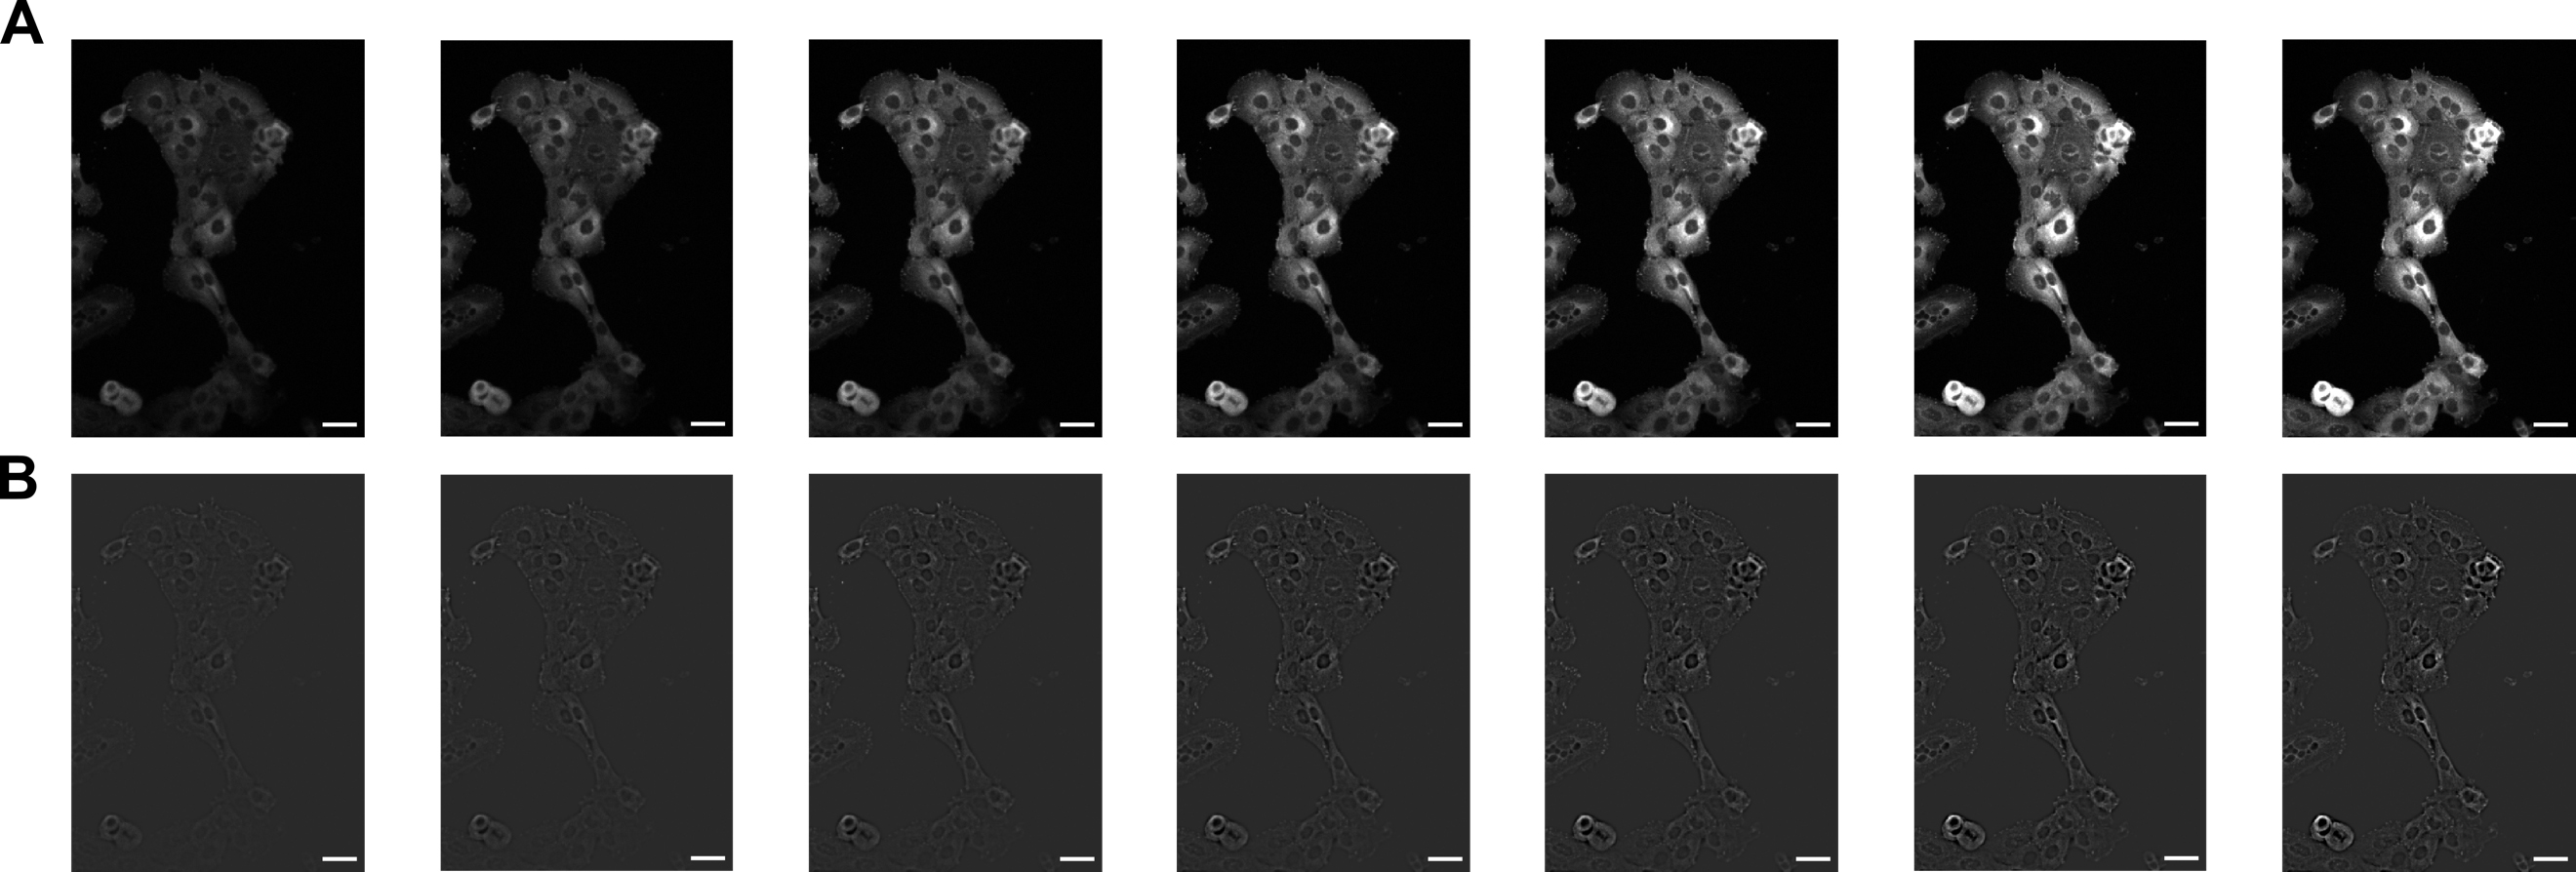
Figure 1. Z-stack images of prominent focal adhesion (FA) of HaCaT cells. We took seven Z-stack images of FA with the step size of 1 μm. (A) The original fluorescence images. The images are listed sequentially from left to right. Their file names are: adj_xy04c1z02.tif, adj_xy04c1z03.tif, adj_xy04c1z04.tif, adj_xy04c1z05.tif, adj_xy04c1z06.tif, adj_xy04c1z07.tif and adj_xy04c1z08.tif. (B) The images of FA with their background subtracted. Their file names are: adj_bs_xy04c1z02.tif, adj_bs_xy04c1z03.tif, adj_bs_xy04c1z04.tif, adj_bs_xy04c1z05.tif, adj_bs_xy04c1z06.tif, adj_bs_xy04c1z07.tif and adj_bs_xy04c1z08.tif. Scale bars: 50 μm.
Data analysis
Immunofluorescent images of FA are analyzed using MATLAB software written scripts: FA1_save_fluoref_cor_img.m, FA2_FA_background_20200313.m, and FA3_FA_identification_FAclearer_20200316chiao.m. The overall pipeline of data analysis is shown in Figure 2. We utilized the cell line HaCaT as our demonstration of FA analysis. We adjusted cells and FA contrast equally for better visualization. All seven Z-stack images (adj_xy04c1z02.tif, adj_xy04c1z03.tif, adj_xy04c1z04.tif, adj_xy04c1z05.tif, adj_xy04c1z06.tif, adj_xy04c1z07.tif, and adj_xy04c1z08.tif) are included in our data analysis. These images are in the zip folder “Adjusted_xy04.zip.” The seven images are shown in Figure 1A.
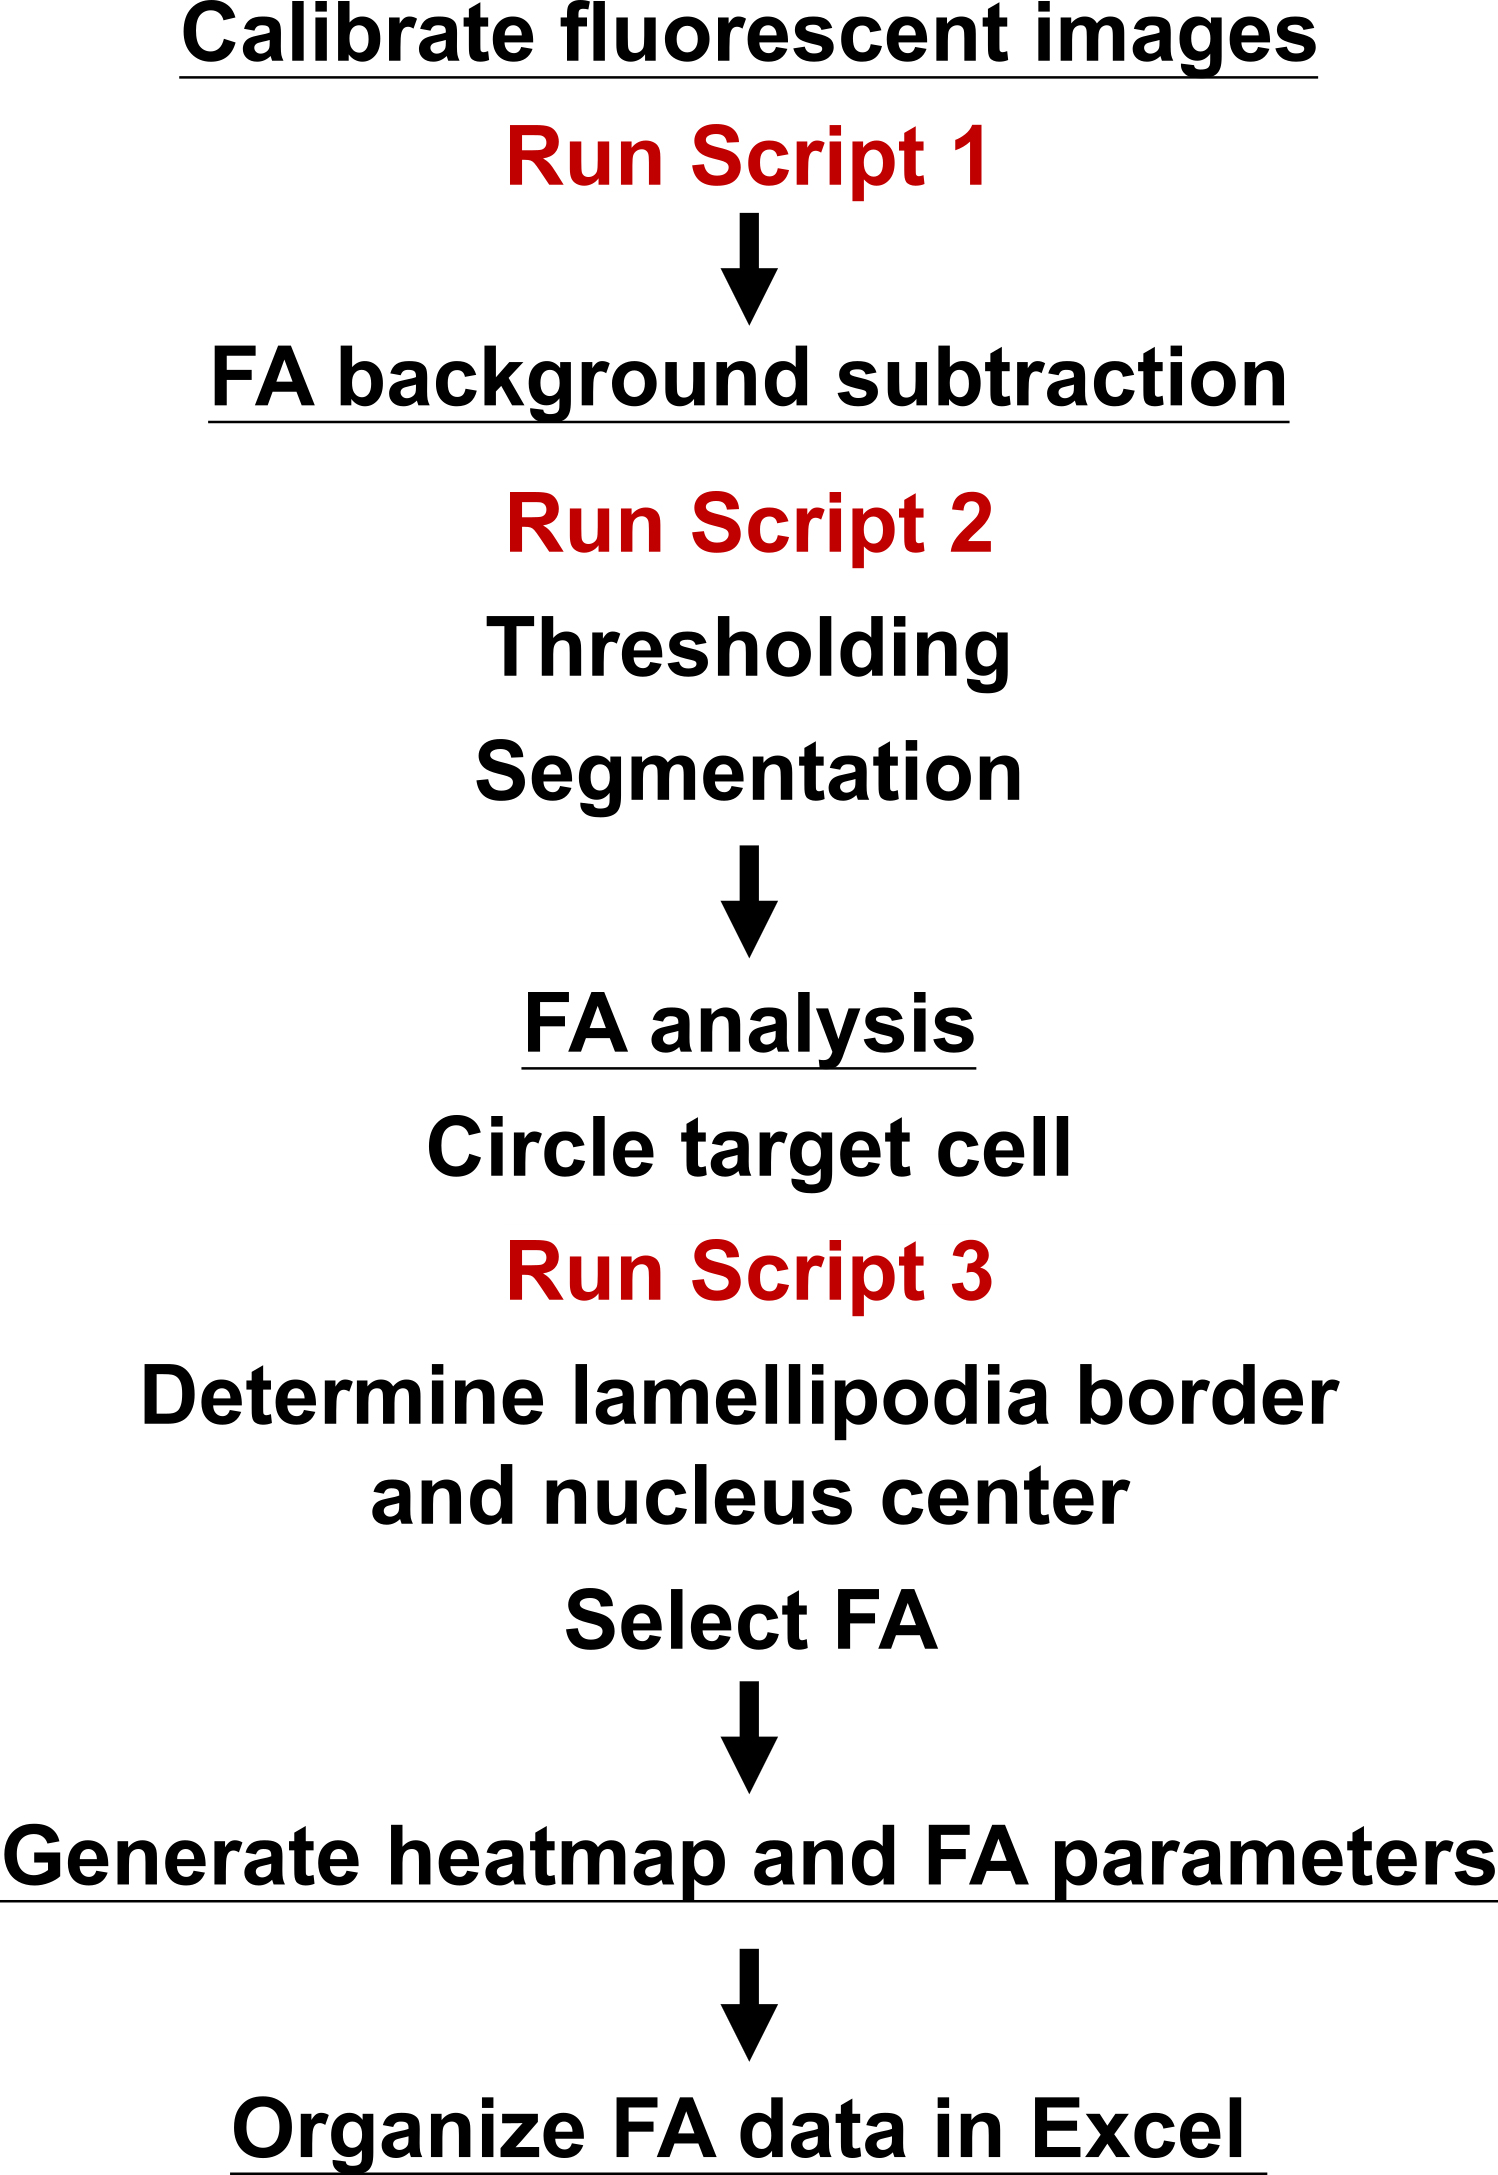
Figure 2. Pipeline of data analysis. Process of the overall analysis of focal adhesion (FA). Script 1 refers to “FA1_save_fluoref_cor_img.m,” script 2 refers to “FA2_FA_background_20200313.m,” and script 3 refers to “FA3_FA_identification_FAclearer_20200316chiao.m.”Calibration of fluorescence
Calibrated fluorescent images of FA (FITC for FA in our demonstration) are obtained by correcting the original fluorescent images with reference images. The reference images are taken with fluorescent light on and off under the autofluorescent plastic slide (Figure 3 and Figure 4). The calibration of fluorescence is required due to the change of illumination by LED excitation light under confocal microscopes. Inconsistency and unevenness occur, reducing the fluorescence on the edges of sample images. This calibration step ensures that the fluorescence in our analyses is closest to the actual FA fluorescence of the sample.
To calibrate the fluorescence of images, load the original FA images and reference images. Then, run the first script (“FA1_save_fluoref_cor_img.m”) to crop the edges of our FA images for analysis.
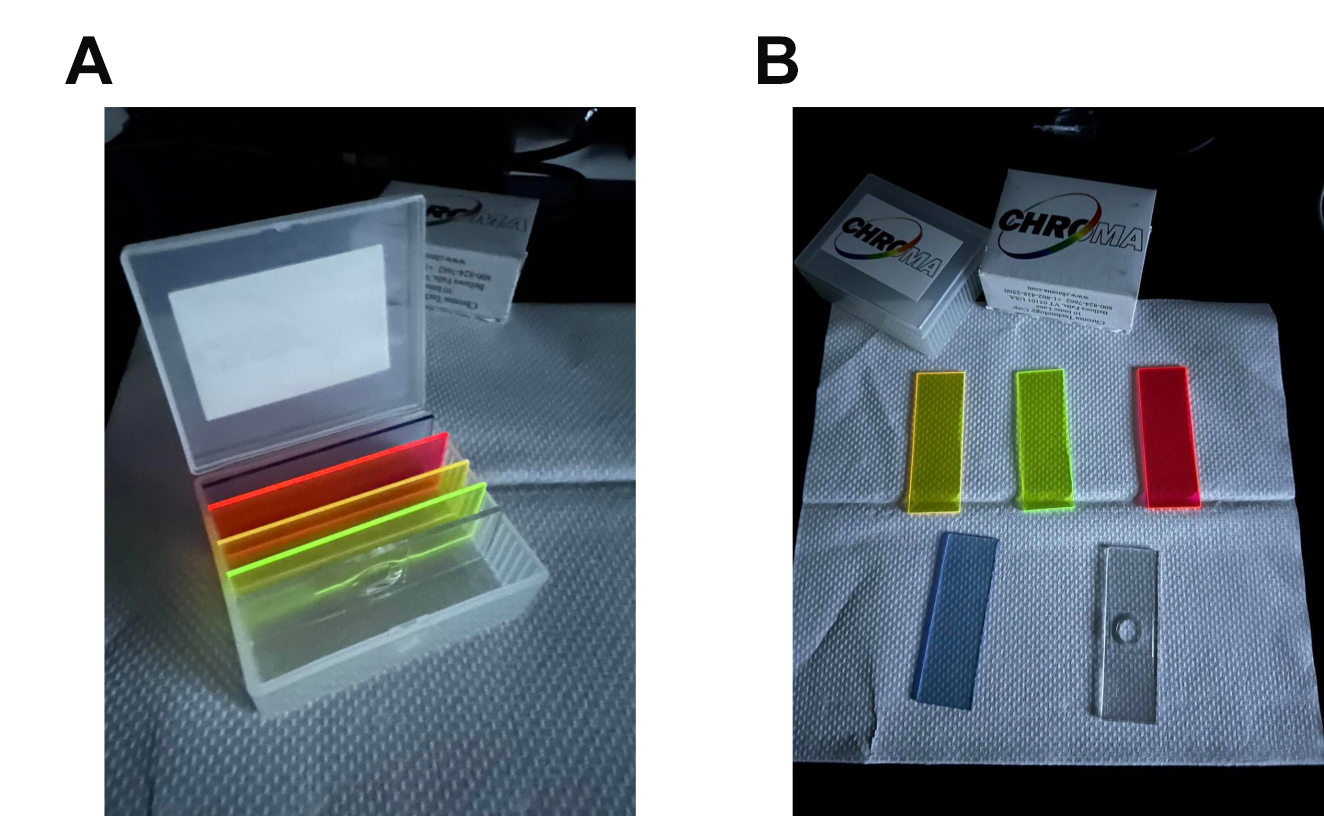
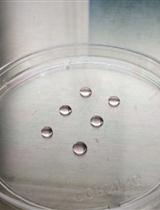
Figure 3. Representative images of autofluorescent plastic slides. (A) All the slides in the slide storage box. (B) (left to right, up to down): YFP, FITC, TX-Red, and DAPI slides. The transparent slide is used for creating compartments in the slide storage box.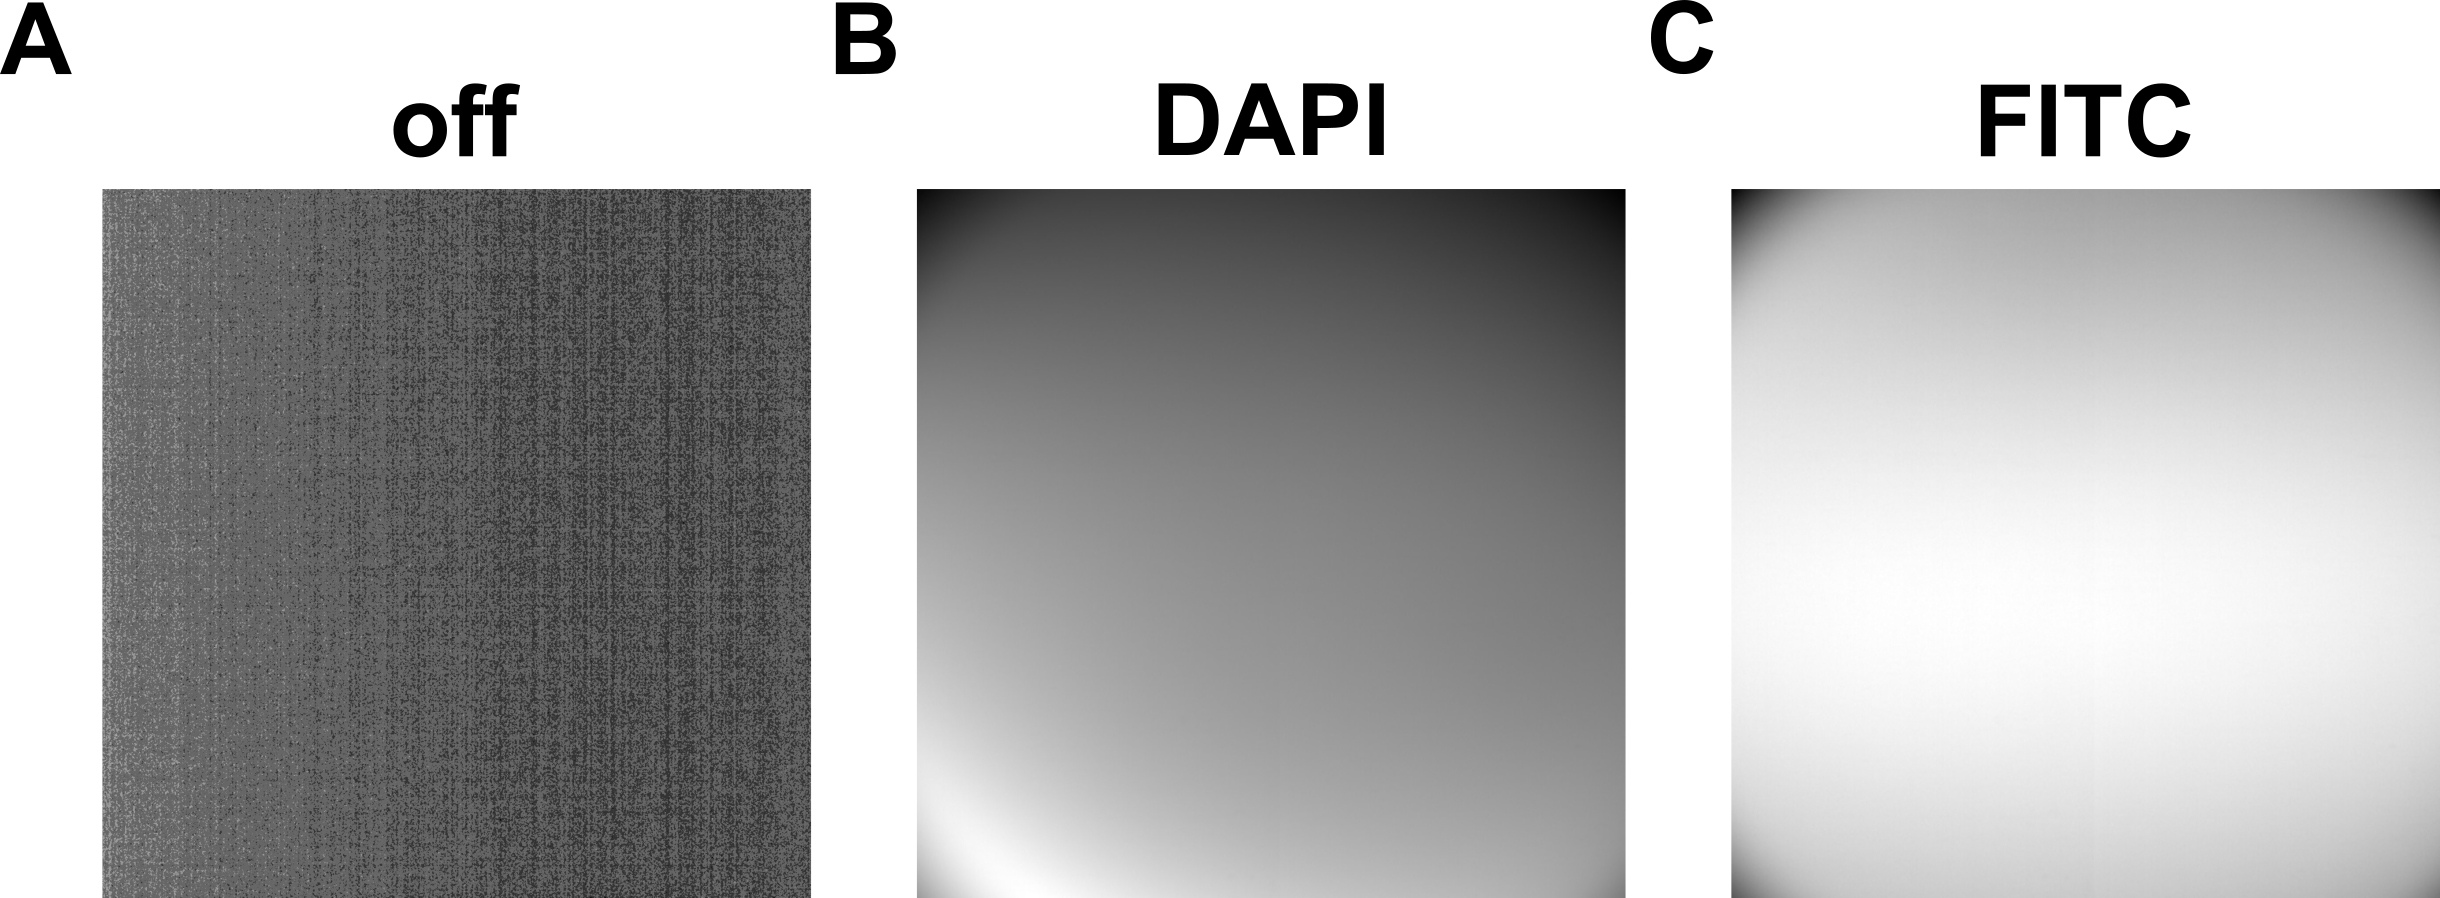
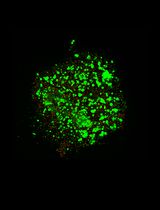
Figure 4. Reference images utilized for calibration of fluorescence. (A) Off: reference image taken with lights off. (B) DAPI: reference image taken under DAPI autofluorescent plastic plate and DAPI light on. (C) FITC: reference image taken under FITC autofluorescent plastic plate and FITC light on. For tif files of these images, see zip file “reference_images.zip.” The names of the files are: off.tif, dapi.tif, and fitc.tif.FA background subtraction
The background signal of FA is subtracted using the second script (“FA2_FA_background_20200313.m”). The purpose of carrying out background subtraction is to eliminate the background noises of the images, contrasting FAs of the cells with the background to ensure better discerning. To carry out background subtraction, we first determine the background signal of each individual pixel. Each signal of each pixel is separately determined by the median value of its surrounding pixels within the radius of 1.46 μm. Then, we subtract the background signal by its original signal by running the script, completing background subtraction. Images adj_bs_xy04c1z02.tif, adj_bs_xy04c1z03.tif, adj_bs_xy04c1z04.tif, adj_bs_xy04c1z05.tif, adj_bs_xy04c1z06.tif, adj_bs_xy04c1z07.tif, and adj_bs_xy04c1z08.tif are generated after running the script. These images are also in the zip folder “Adjusted_xy04.zip.” The contrast of the images of FAs was adjusted equally, subtracting their background signal.
Thresholding: The purpose of thresholding for the mask of FA is to allow clear identification of Fas for quantification and qualification. The threshold is determined as two standard deviations above the mode of background value.
Segmentation: To distinguish each FA from one another for analysis, segmentation is required. In other words, the process of segmentation prevents repeated analysis of the same FA. To be specific, double analysis of a single FA generates results for two separate Fas with identical data in all parameters. To carry out FA segmentation, use the function of watershed segmentation in MATLAB.
FA analysis
FA analysis is processed using the third script: “FA3_FA_identification_FAclearer_20200316chiao.m.” Steps to run the script are as follows:
Cells are selected differently to analyze nascent or prominent FAs:
i. Nascent FA: The FAs of the first row of the wound are selected for analysis. Select only the cells with adjacent cells at their two sides. These are the cells that perform directed cell migration towards the wound. Nascent FAs forming in the lamellipodia of these cells at the leading edges of the wound are analyzed.
ii. Prominent FA: All cells with clear FAs are selected for analysis. We analyze the prominent FAs of HaCaT as demonstration.
For both analyses of nascent and prominent FAs, all of the FAs within 7 μm (15 pixel) of the lamellipodia edge are analyzed per run. The detailed steps are listed below.
Circle target cell, then run script:
Circle the target cell manually by pinpointing the surroundings of the cell in the panel of Figure 5A. Run script, which loads in the original fluorescent image (Figure 5B). The script will show again the background-subtracted image of the selected target cell (Figure 5C). Afterwards, the script automatically identifies all the FAs (Figure 5D). This will be the background-subtracted image that the script will analyze later on.
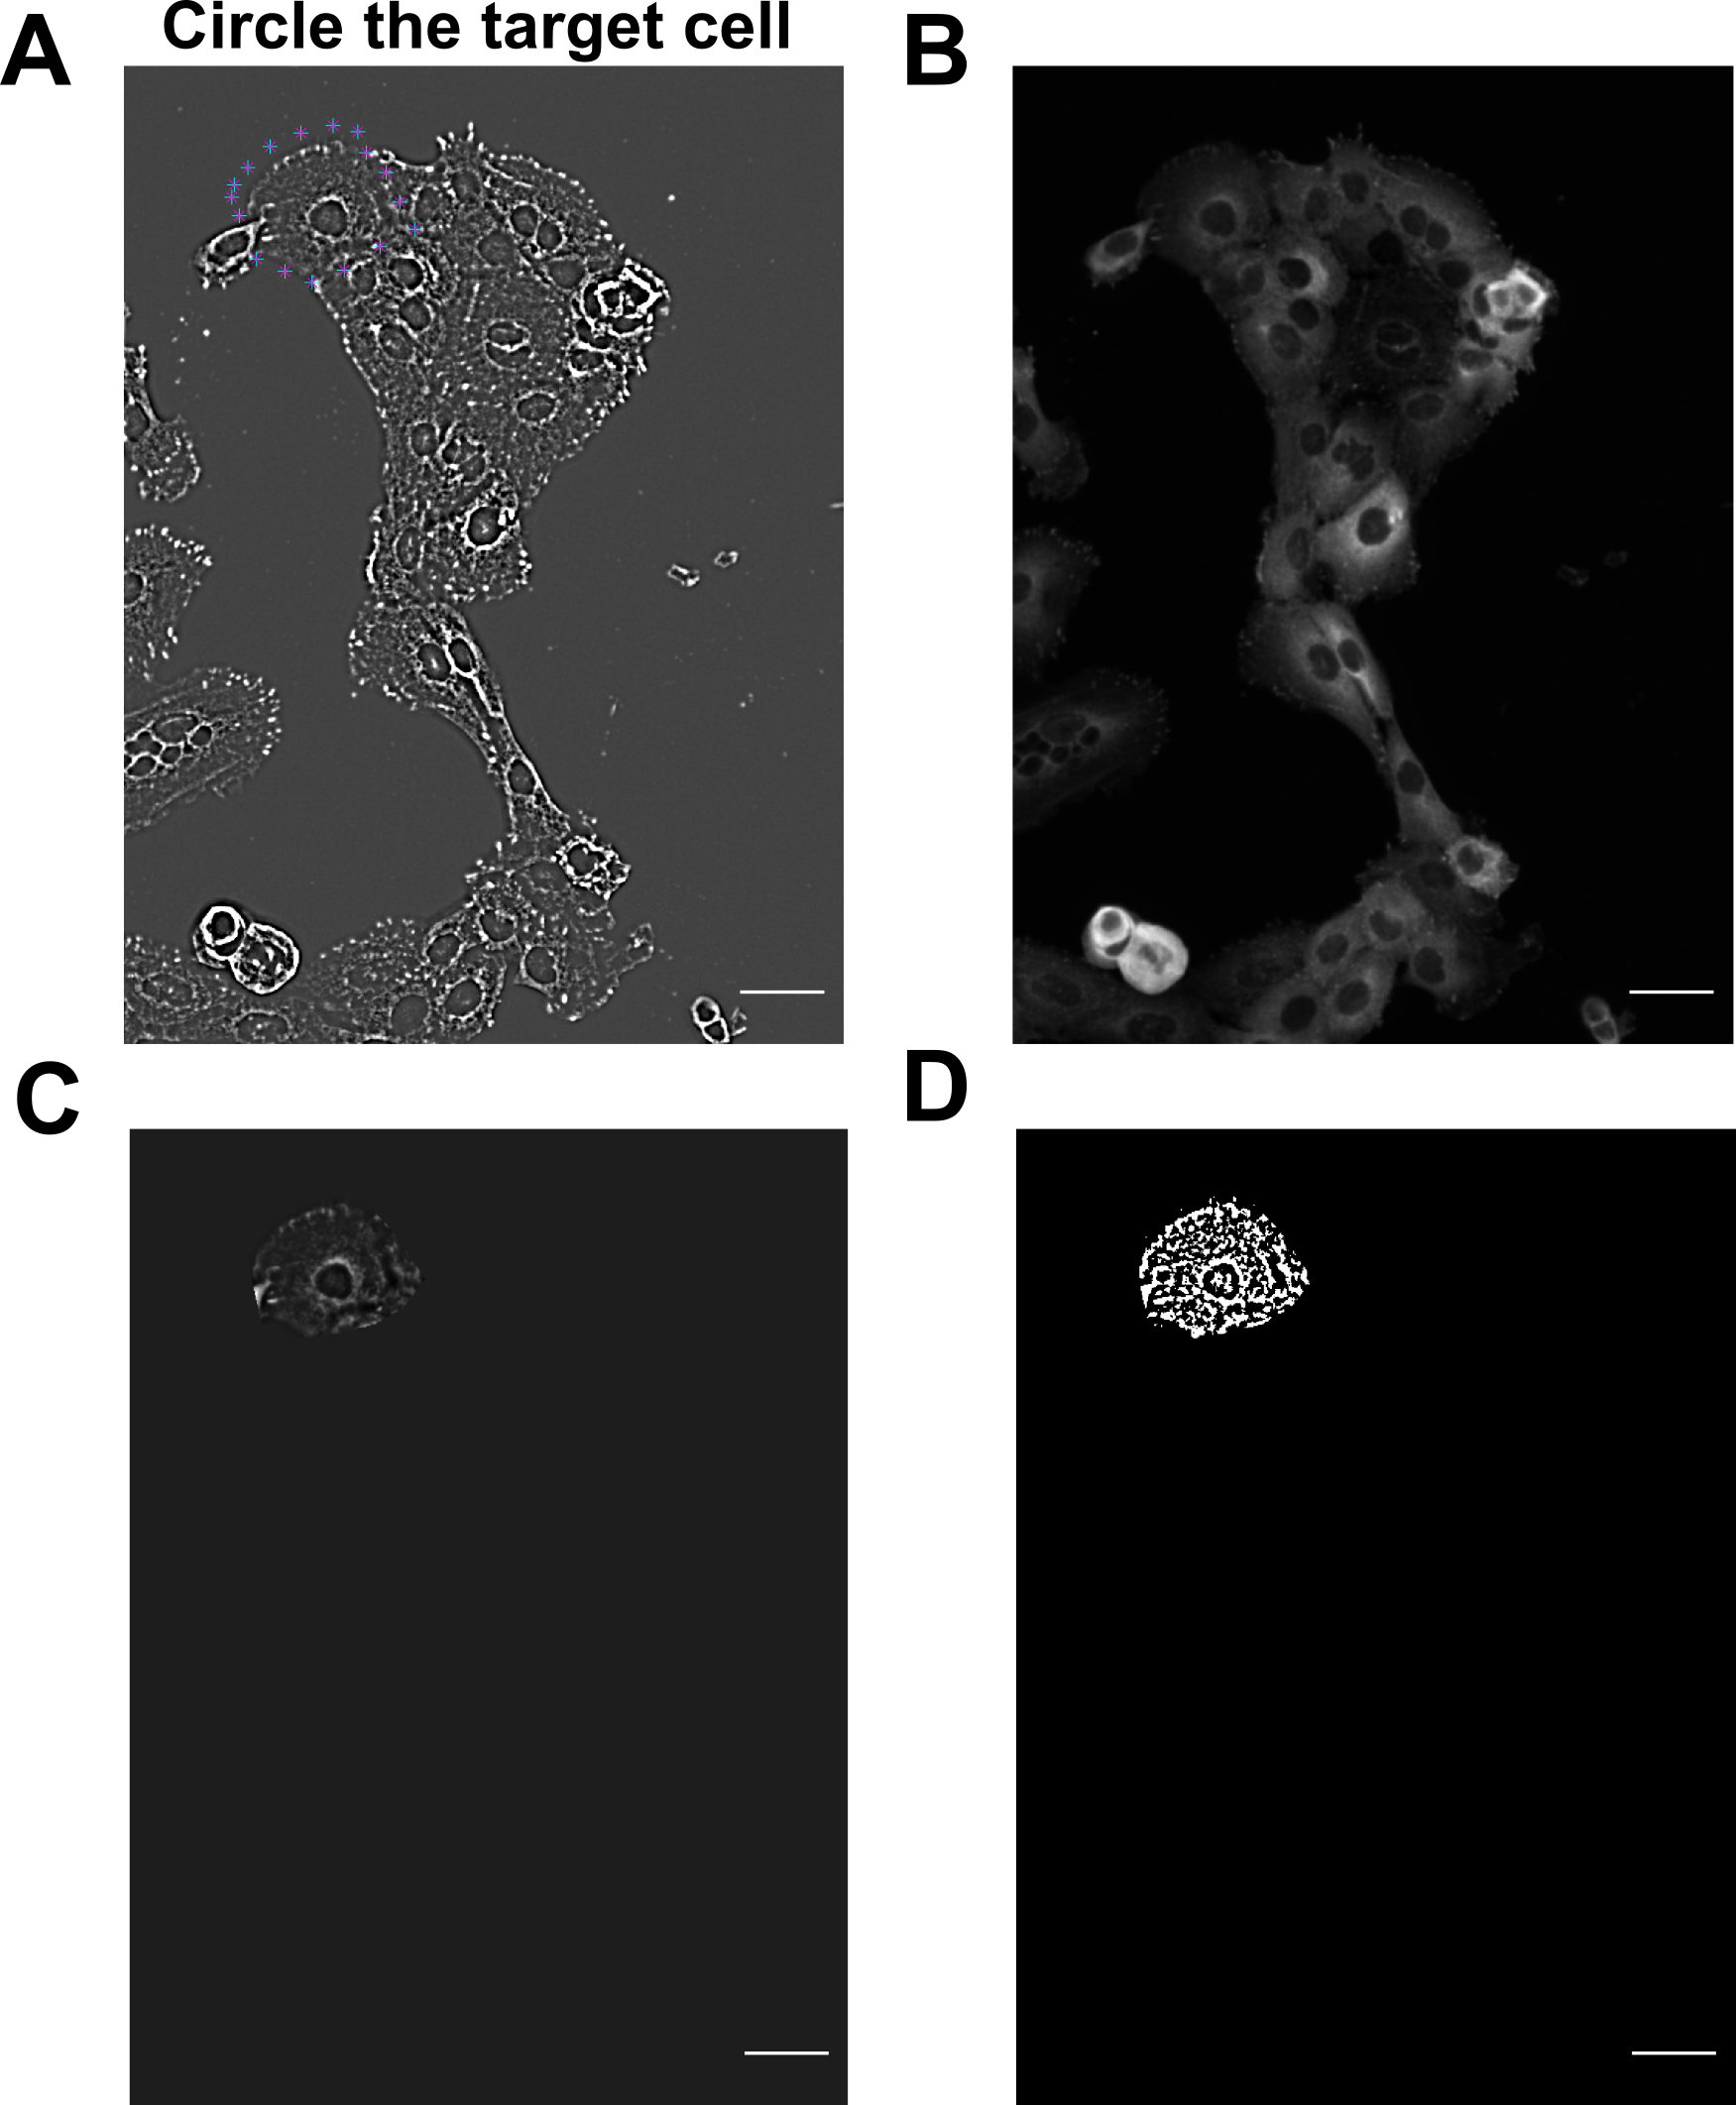
Figure 5. HaCaT cells are selected utilizing MATLAB scripts to analyze prominent focal adhesion (FA). Individual HaCaT cells are selected manually by pinpointing the surrounding of the cell. (A–B) Images of cells after performing background subtraction (A) and the original FA image (B). Blue crosses of (A) indicate selected cell. (C–D) Image of selected cell after background subtraction shows up again in (C). MATLAB script then automatically identifies FAs in (D). Scale bars: 50 μm.Determine lamellipodia border:
We pinpoint the border of the cell showing clear lamellipodial protrusion toward the wound to determine lamellipodia border of target cell.
Determine nuclear center:
Nucleus of the target cell is marked so that the clear lamellipodium for FA analysis is completely determined. The completion of determining lamellipodia border and nuclear center is shown in Figure 6A–6C. The red dash line demonstrates the lamellipodia border and the nucleus center from which the lamellipodia border is determined.
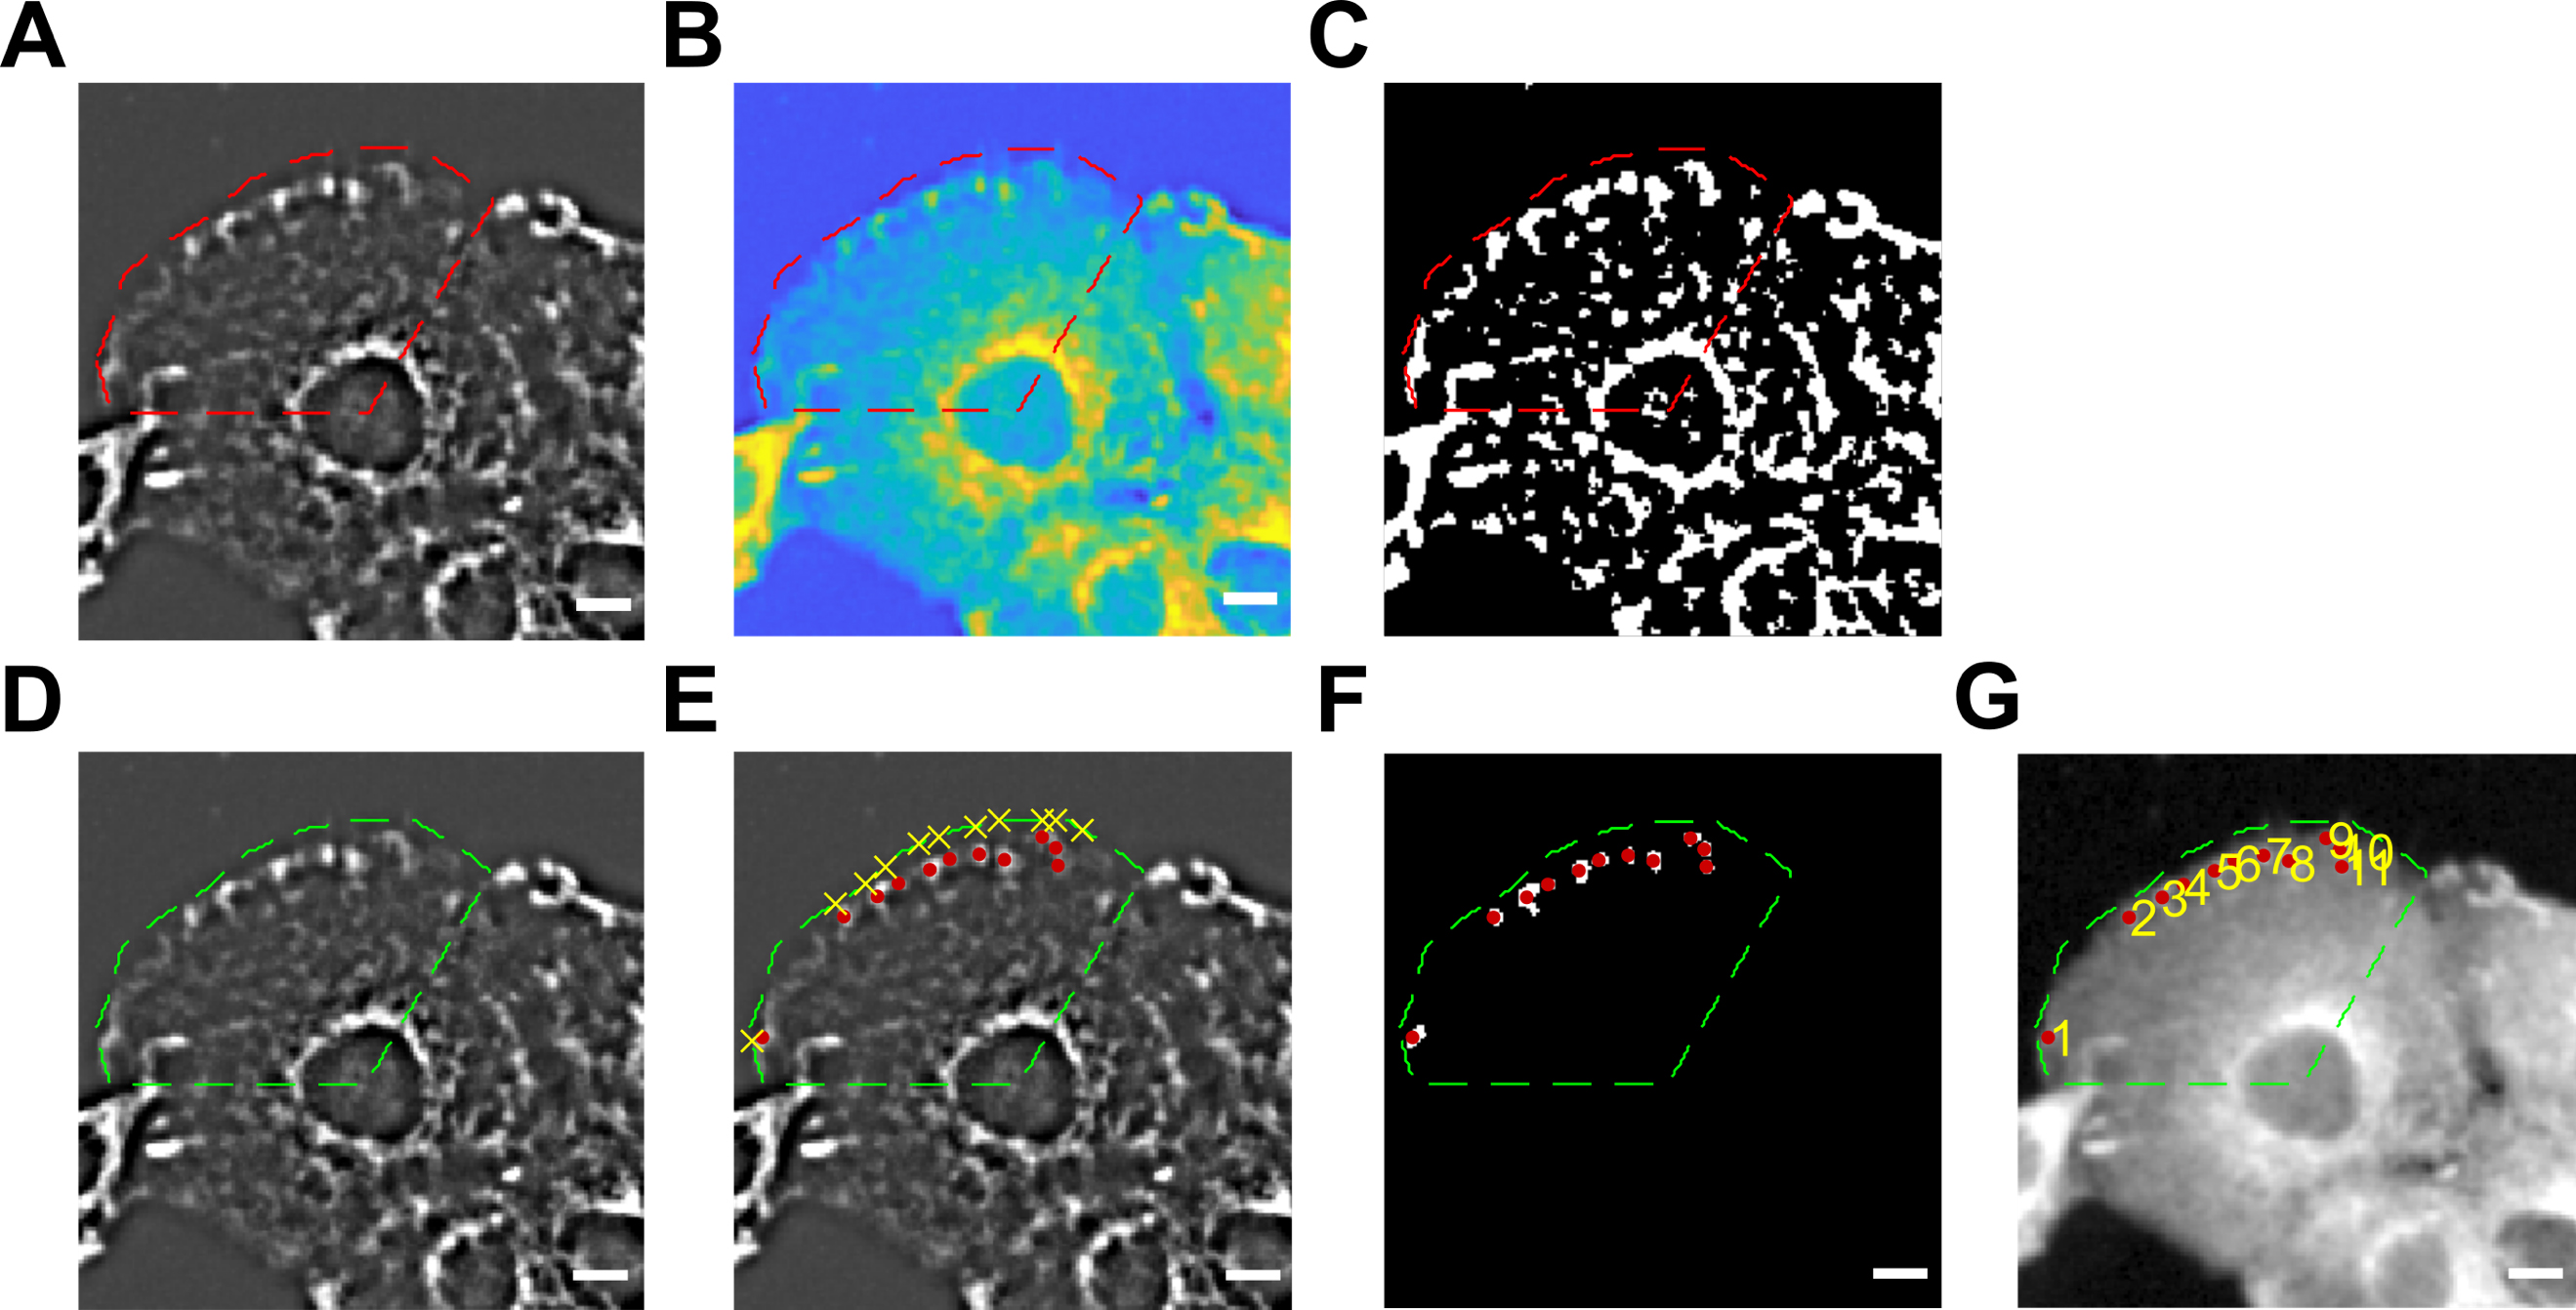
Figure 6. Focal adhesions (FA) of chosen cells are then selected for further analysis. (A–C) The nucleus center and lamellipodia border are determined. FA under background subtraction (A); red dash lines indicate the chosen cell with determined nucleus (B) and lamellipodia border (C). (D–G) Thresholding of FAs after background subtraction and FA numbering of chosen cell. Green dash lines indicate the chosen cell with determined nucleus and lamellipodia border (D). Yellow X indicates manually selected FAs (E) with its corresponding red dots (F) of actual FAs in the selection. FAs are numbered according to sequence of selection (G). Scale bars: 10 μm.FA selection:
Under determined lamellipodium, all FAs are selected manually for analysis (Figure 5D to 5G). FAs within 7 μm of the lamellipodia edge are analyzed. After analysis, FA signal intensities are generated as shown in the heatmap of Figure 7. In this process, the script corrects the FA signal to get rid of the effects of photobleaching. The generated heatmap is shown on Figure 7; the left panel demonstrates original FA signal (Ori Cell x87y101), while the right panel depicts corrected FA signal (Cor Cell x87y101). The data of corrected FA signal with its photobleaching corrected will then be utilized for final FA analysis.
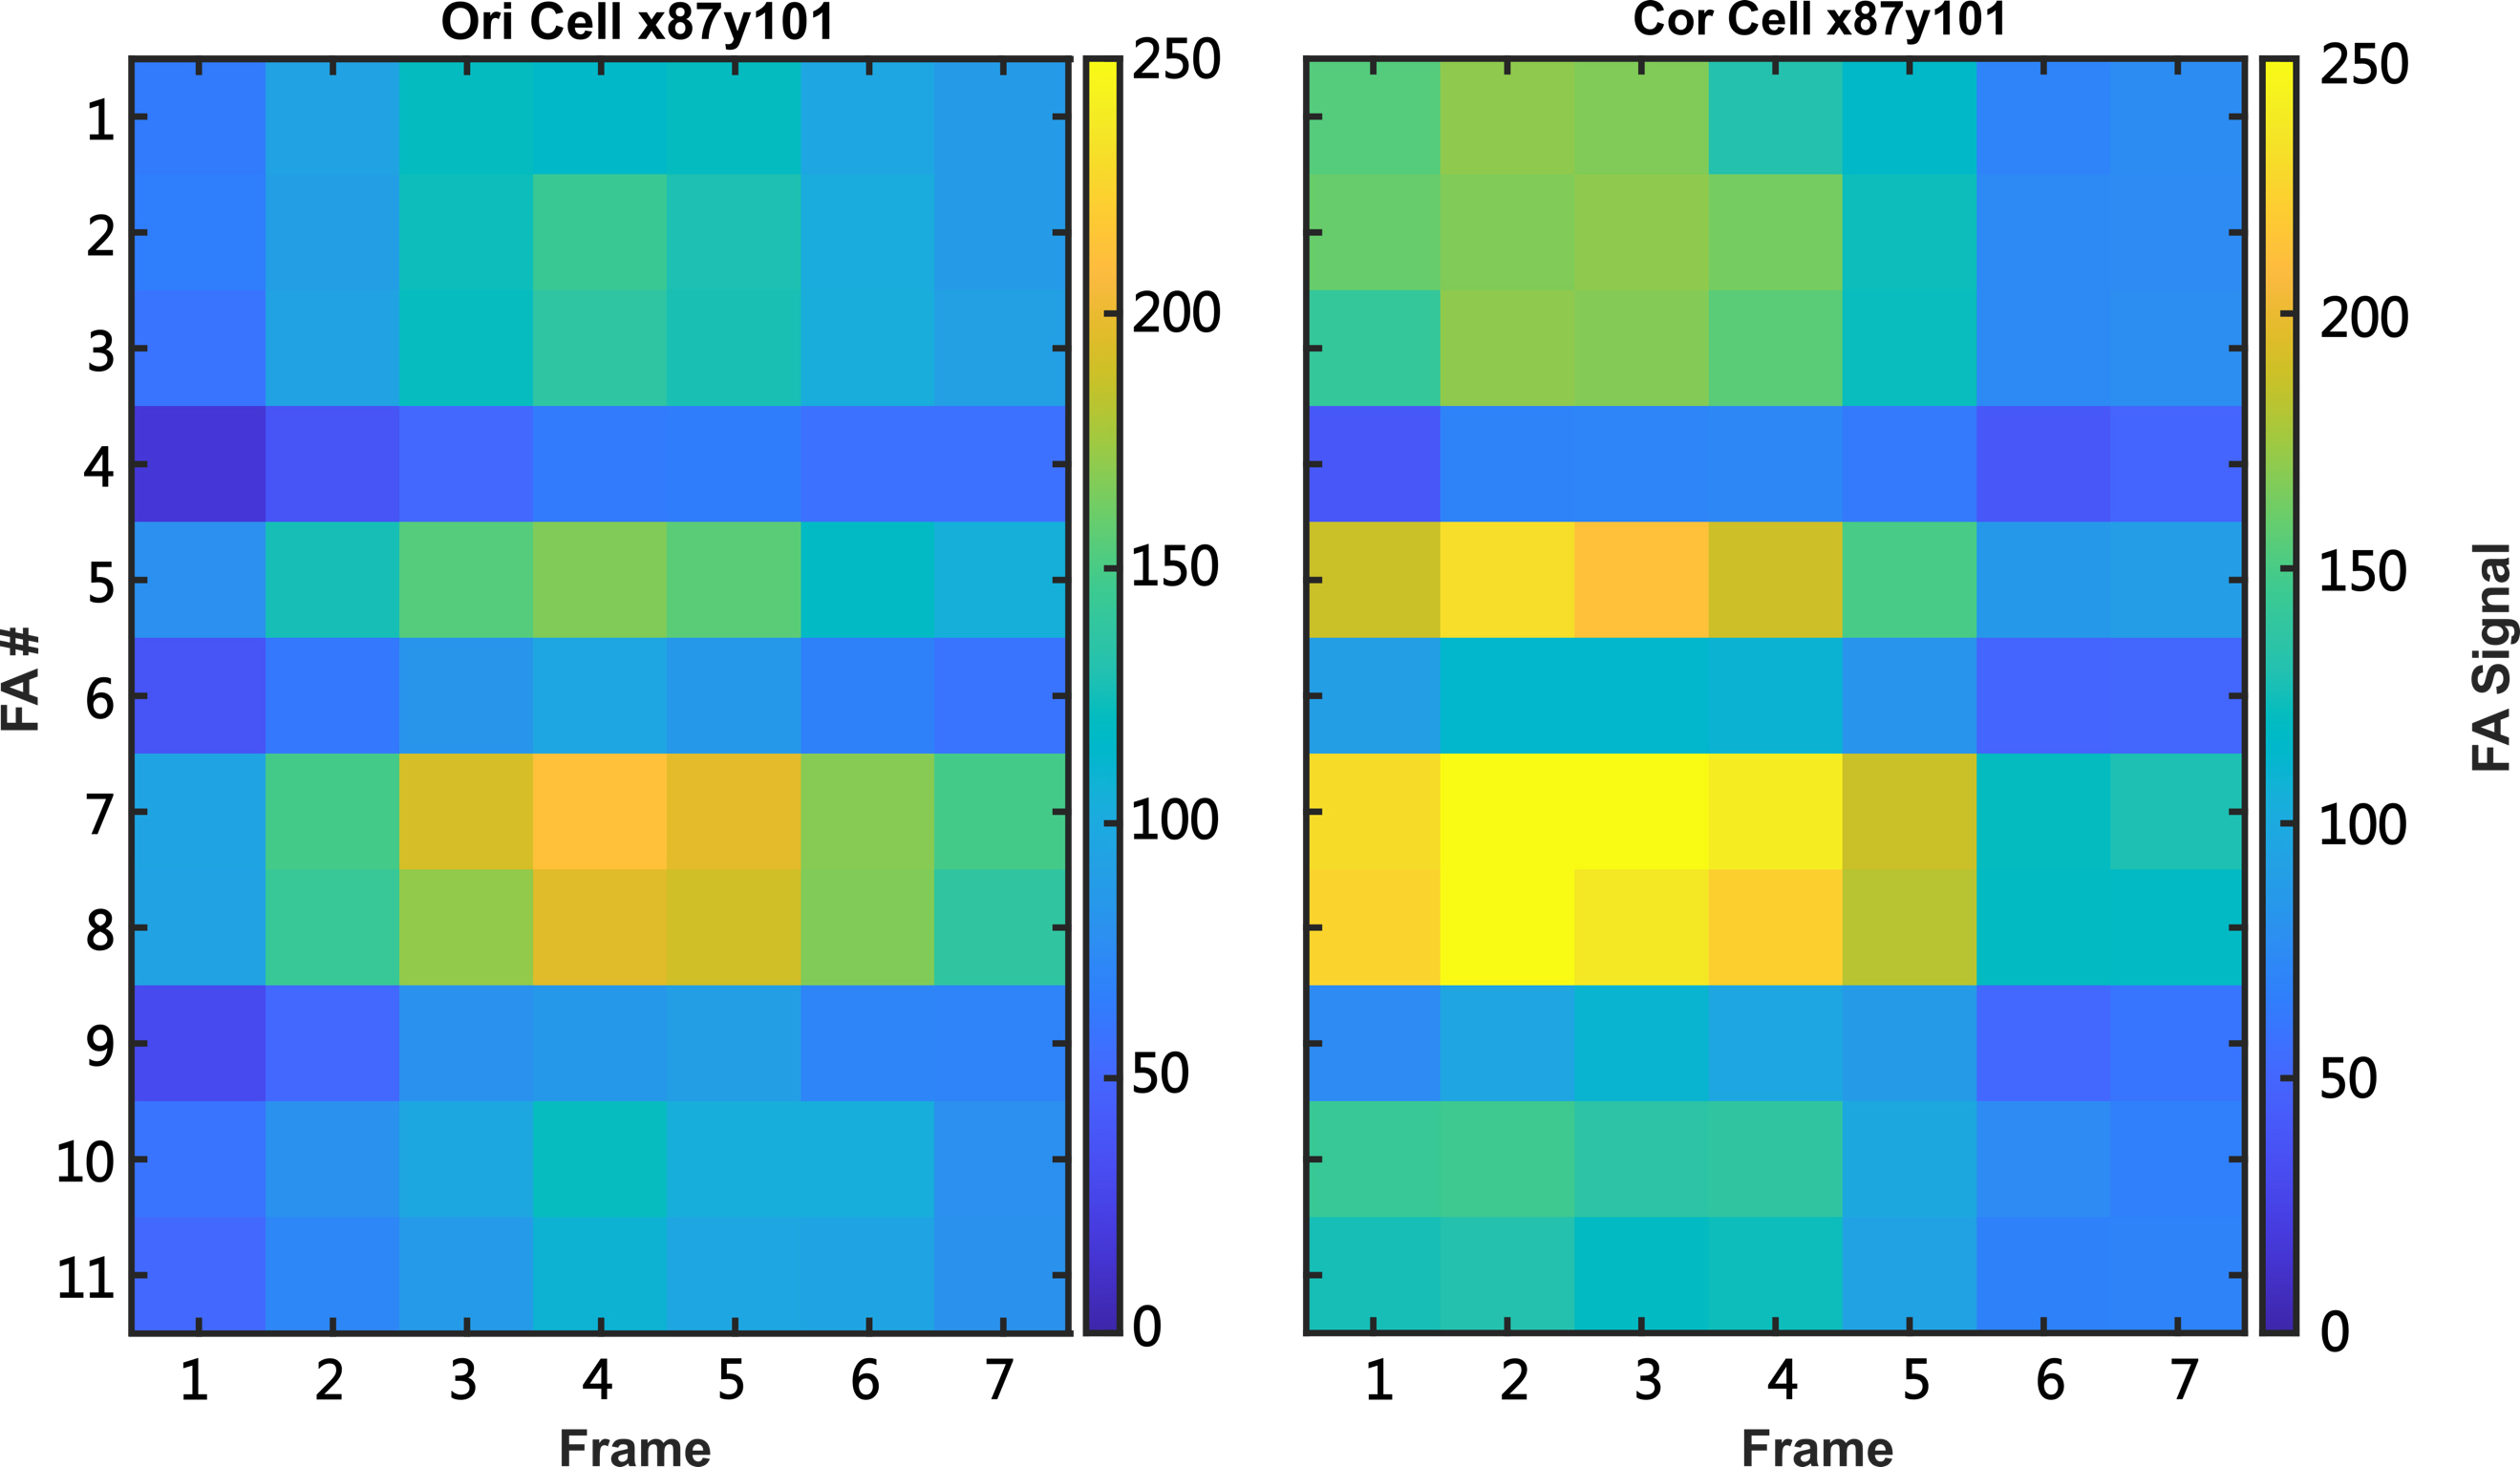
Figure 7. Heatmap of focal adhesion (FA) signal intensity. Left panel: OriCellx87y101 indicates original FA signal intensity before photobleaching correction. X87 and y101 indicate x and y axis of selected target cell. CorCellx87y101 indicates corrected FA signal intensity, depicting the signals processed with photobleaching correction. FA# depicts the sequential numbering of the 11 FA selected manually in Figure 6. Frame depicts the seven z-stack images taken for analysis.Generate data of different FA parameters:
Complete script running. Different FA parameters for quantification and qualification are generated: (a) FA location, (b) FA eccentricity, (c) FA area, (d) mean FA signal, and (e) FA numbers. The integrated FA is utilized for FA analysis. The formula for integrated FA is as follows:
Integrated FA = FA area × mean FA signal
*The integrated FA is generated by multiplying (c) by (d).
*(a) FA location: coordinates x and y are generated.
*(b) FA eccentricity determines whether the FA is closer to circular or linear shape. Numeric value ranging from 0 to 1 is generated after running the script. Larger numbers symbolize greater eccentricity.
Organize FA data:
Data of FAs and cells from multiple sites analyzed are pulled up and organized using Microsoft Excel. See Excel file “xy04.” The Excel file is all the FA data of all cells of the well xy04. The highlighted portion demonstrates the FA data of our demo cell, x87y101.
Acknowledgments
This work was supported by grants from The Ministry of Science and Technology in Taiwan (MOST 107-2320-B-002-038-MY3 and MOST 108-2926-I-002-002-MY4), National Taiwan University Hospital (NTUH 106-T02, NTUH 107-T13, NTUH 108-T13, and VN 109-14), and The Liver Disease Prevention and Treatment Research Foundation in Taiwan. This protocol was adapted from Yu et al. (2021).
Competing interests
The authors declare that they have no competing interests.
References
- Doss, B. L., Pan, M., Gupta, M., Grenci, G., Mège, R.-M., Lim, C. T., Sheetz, M. P., Voituriez, R. and Ladoux, B. (2020). Cell response to substrate rigidity is regulated by active and passive cytoskeletal stress. Proc. Natl. Acad. Sci. U. S. A. 117(23): 12817–12825.
- Kanchanawong, P., Shtengel, G., Pasapera, A. M., Ramko, E. B., Davidson, M. W., Hess, H. F. and Waterman, C. M. (2010). Nanoscale architecture of integrin-based cell adhesions. Nature 468(7323): 580–584.
- Horzum, U., Ozdil, B. and Pesen-Okvur, D. (2014). Step-by-step quantitative analysis of focal adhesions. MethodsX 1: 56–59.
- Yu, L. Y., Tseng, T. J., Lin, H. C., Hsu, C. L., Lu, T. X., Tsai, C. J., Lin, Y. C., Chu, I., Peng, C. T., Chen, H. J., et al. (2021). Synthetic dysmobility screen unveils an integrated STK40-YAP-MAPK system driving cell migration. Sci. Adv. 7(31): eabg2106.
- Olson, H. M. and Nechiporuk, A. V. (2021). Lamellipodia-like protrusions and focal adhesions contribute to collective cell migration in zebrafish. Dev. Biol. 469: 125–134.
Supplementary information
The following supporting information can be downloaded here:
- Adjusted_xy04 files
- MATLAB files
- reference images
- xy04.xlsx
Article Information
Copyright
© 2023 The Author(s); This is an open access article under the CC BY-NC license (https://creativecommons.org/licenses/by-nc/4.0/).
How to cite
Readers should cite both the Bio-protocol article and the original research article where this protocol was used:
- Yu, L. Y., Tseng, T., Lin, H. C., Hsu, C. L., Lu, T., Lin, Y., Tseng, M. and Tsai, F. C. (2023). Studying Cellular Focal Adhesion Parameters with Imaging and MATLAB Analysis. Bio-protocol 13(21): e4867. DOI: 10.21769/BioProtoc.4867.
- Yu, L. Y., Tseng, T. J., Lin, H. C., Hsu, C. L., Lu, T. X., Tsai, C. J., Lin, Y. C., Chu, I., Peng, C. T., Chen, H. J., et al. (2021). Synthetic dysmobility screen unveils an integrated STK40-YAP-MAPK system driving cell migration. Sci. Adv. 7(31): eabg2106.
Category
Drug Discovery > Drug Design
Cancer Biology > Invasion & metastasis > Cell biology assays > Cell adhesion
Cell Biology > Cell imaging > Fixed-cell imaging
Do you have any questions about this protocol?
Post your question to gather feedback from the community. We will also invite the authors of this article to respond.